Abstract
Ovarian cancer survival remains poor despite recent advances in our understanding of genetic profiles. Unfortunately, the majority of ovarian cancer patients have recurrent disease after chemotherapy and lack other treatment options. Wnt signalling has been extensively implicated in cancer progression and chemoresistance. Therefore, we investigated the previously described Wnt receptors ROR1 and ROR2 as regulators of epithelial-to-mesenchymal transition (EMT) in a clinically relevant cell line model. The parental A2780- and cisplatin-resistant A2780-cis cell lines were used as a model of ovarian cancer chemoresistance. Proliferation, adhesion, migration and invasion were measured after transient overexpression of ROR1 and ROR2 in the parental A2780 cell line, and silencing of ROR1 and ROR2 in the A2780-cis cell line. Here we show that ROR1 and ROR2 expression is increased in A2780-cis cells, alongside β-catenin-independent Wnt targets. Knockdown of ROR1 and ROR2 significantly inhibited cell migration and invasion and simultaneous knockdown of ROR1 and ROR2 significantly sensitised cells to cisplatin, whilereas ROR overexpression in the parental cell line increased cell invasion. Therefore, ROR1 and ROR2 have the potential as novel drug targets in metastatic and recurrent ovarian cancer patients.
Introduction
The low survival rates for ovarian cancer patients are due, in part, to the late diagnosis and the development of resistance to traditional chemotherapy in recurrent disease. Despite seminal studies in recent years investigating the genetic and molecular aetiology of epithelial ovarian cancer, particularly the high-grade ovarian cancer serous subtype,1, 2, 3 our understanding of ovarian cancer progression and chemoresistance is still very limited.
Used for over 30 years, cisplatin remains a common chemotherapy treatment option following cytoreductive surgery for patients with advanced ovarian cancer.4 Cisplatin is a platinum analogue that prevents normal DNA function through reactions that cause intrastrand or interstand crosslinks.5 Patients with ovarian cancer generally respond well to chemotherapy but the tumours often recur, which is a clinical challenge.
Ovarian cancer is a heterogeneous disease and each subtype has different propensities to metastasise. Extensive genomic analysis of high-grade ovarian cancer serous subtype has allowed for the classification of four major molecular subtypes: mesenchymal, immunoreactive, differentiated and proliferative.1, 6, 7, 8, 9 The mesenchymal phenotype exhibits a shorter disease-specific survival and increased Wnt signalling.9 In individual patient case studies, a switch to this mesenchymal phenotype has been shown in samples taken from metastatic sites, such as omental implants in comparison with primary tumour.7 Epithelial-to-mesenchymal transition (EMT) has also been implicated in high-grade ovarian cancer serous subtype invasiveness and chemoresistance through in vivo studies.10, 11, 12, 13 The EMT profile of ovarian cancer cell lines can predict responses to cisplatin, which suggests that the more aggressive, mesenchymal-type cells are more resistant to chemotherapy.13
An important signalling cascade involved in EMT regulation is the Wnt signalling pathway, with increasing evidence suggesting that β-catenin-independent signalling has a critical role in this dynamic process.10, 14, 15, 16, 17, 18, 19, 20, 21, 22
Recent studies demonstrate that the novel Wnt receptors ROR1 and ROR2 correlate with worse prognosis and drive EMT in a variety of tumour types including breast cancer, cervical cancer and melanoma.15, 23, 24, 25, 26 Our laboratory reported that upregulation of Wnt5a in epithelial ovarian cancer regulates EMT10 and confirmed that the novel Wnt5a receptor, ROR2, is also upregulated in a patient cohort of ovarian cancer. We recently demonstrated that ROR2 and its sister receptor, ROR1, regulate ovarian cancer migration and invasion.27
Patients who develop recurrent and chemoresistant disease generally do not have additional surgery. Therefore, owing to the challenge of patient sample collection, we used a well-established clinically relevant cell line model for continuing the investigation into RORs in ovarian cancer. Here we report that ROR1 and ROR2 expression is increased in this chemoresistant cell line and support our initial findings that ROR1 and ROR2 regulate ovarian cancer cell migration and invasion. ROR1 and ROR2 present as possible targets for novel therapies for the treatment of ovarian cancer.
Results
ROR1 and ROR2 expression is increased in the A2780-cis chemoresistant cell line model
Our previous study27 identified that ROR1 and ROR2 are upregulated in epithelial ovarian cancer and regulate cell migration and invasion. Clinically, ovarian cancer patients present with aggressive disease, which often recurs after chemotherapy or radiation therapy.28 Therefore, we chose to continue our investigation of RORs in epithelial ovarian cancer using a well-established chemoresistant cell line, the A2780-cis model.
A2780-cis cells have an increased expression of both ROR1 and ROR2 at the transcriptional level compared with the parental A2780 cell line (Supplementary Figure 1A). The A2780 cell line had no mRNA expression of ROR2; however, both ROR1 and ROR2 protein were present in each cell line (Supplementary Figure 1B).
In addition to overexpression of both ROR receptors, the A2780-cis cells had increased β-catenin-independent Wnt signalling, as seen by significant upregulation of downstream targets CJUN, RHOA and NFAT (Supplementary Figures 1C; P<0.05), and a possible decrease in β-catenin-dependent signalling, as measured by a decrease in AXIN2 (Supplementary Figure 1D).
Previously, it has been shown that the A2780-cis cells exhibit a mesenchymal phenotype with increased migration and invasion capacity compared with the parental A2780 cells.11 Therefore, we confirmed the EMT profile of the A2780-cis cells and similarly found significant upregulation of important EMT genes such as MMP3 (600-fold increase) and BMP2 (50-fold increase) (Supplementary Figure 1E) and significant downregulation of CDH1 (50-fold decrease) and CDH2 (9000-fold decrease) (Supplementary Figure 1F).
ROR2, but not ROR1, silencing in A2780-cis decreases proliferation and has no effect on cell adhesion
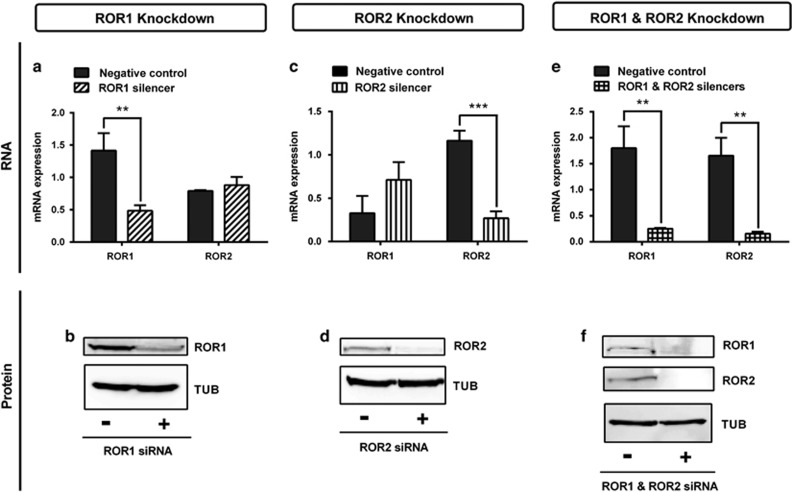
Successful small interfering RNA (siRNA) transfection of A2780-cis significantly decreased ROR expression at the mRNA (Figures 1a, d and g, P<0.01 and P<0.001) and protein level (Figures 1b, e and f).
Figure 1.
ROR1 and ROR2 silencing using siRNA. (a) ROR1 is decreased at the mRNA level following siRNA-induced knockdown in cisplatin serous ovarian cancer (A2780-cis) cells. No effect on ROR2 mRNA level. qRT–PCR was performed in triplicate and normalised to three different housekeeping genes (SDHA, HSPCB and RPL13A). Results represent an average of three experiments. Error bars represent the s.d. of the mean. **P<0.01. (b) Representative immunoblots showing ROR1 knockdown at the protein level in A2780-cis cells. Top panel: ROR1; bottom panel: loading control α-tubulin. (c) ROR2 is decreased at the mRNA level following siRNA-induced knockdown in A2780-cis cells. No significant effect on ROR1 mRNA level. qRT–PCR was performed in triplicate and normalised to three different housekeeping genes (SDHA, HSPCB and RPL13A). Results represent an average of three experiments. Error bars represent the s.d. of the mean. ***P<0.001. (d) Representative immunoblots showing ROR2 knockdown at the protein level in A2780-cis cells. Top panel: ROR2; bottom panel: loading control α-tubulin. (e) ROR1 and ROR2 are decreased at the mRNA level following siRNA-induced knockdown in A2780-cis cells. qRT–PCR was performed in triplicate and normalised to three different housekeeping genes (SDHA, HSPCB and RPL13A). Results represent an average of three experiments. Error bars represent the s.d. of the mean. **P<0.01. (f) Representative immunoblots showing ROR1 and ROR2 knockdown at the protein level in A2780-cis cells. Top panel: ROR1; middle panel: ROR2; bottom panel: loading control α-tubulin.
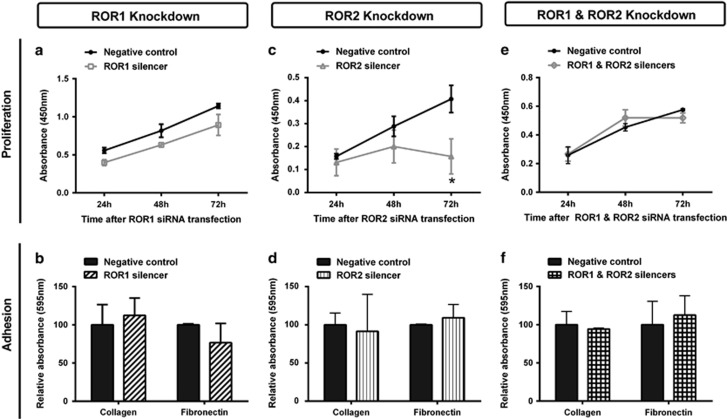
ROR1 silencing had no effect on A2780-cis proliferation (Figure 2a) or adhesion (Figure 2b). However, ROR2 silencing significantly decreased cell proliferation (Figure 2c, P<0.05), but did not affect cell adhesion (Figure 2d). Double ROR1 and ROR2 knockdown did not have any effect on cell proliferation (Figure 2e) or adhesion (Figure 2f).
Figure 2.
ROR1 and ROR2 silencing does not affect adhesion and may decrease proliferation. (a) Cell proliferation does not change over 24–72 h following ROR1 knockdown in A2780-cis cells. Results represent the average of three independent experiments. Error bars represent the s.d. of the mean. (b) ROR1 knockdown has no effect on the adhesion of A2780-cis cells to collagen or fibronectin. Results represent the average of three experiments. (c) Cell proliferation significantly decreases over 24–72 h following ROR2 knockdown in A2780-cis cells. Results represent the average of three independent experiments. Error bars represent the s.d. of the mean. (d) ROR2 knockdown has no effect on the adhesion of A2780-cis cells to collagen or fibronectin. Results represent the average of three experiments. (e) Cell proliferation does not change over 24–72 h following double ROR1 and ROR2 knockdown in A2780-cis cells. Results represent the average of three independent experiments. Error bars represent the s.d. of the mean. (f) Double ROR1 and ROR2 knockdown has no effect on the adhesion of A2780-cis cells to collagen or fibronectin. Results represent the average of three experiments.
ROR silencing in A2780-cis inhibits cell migration
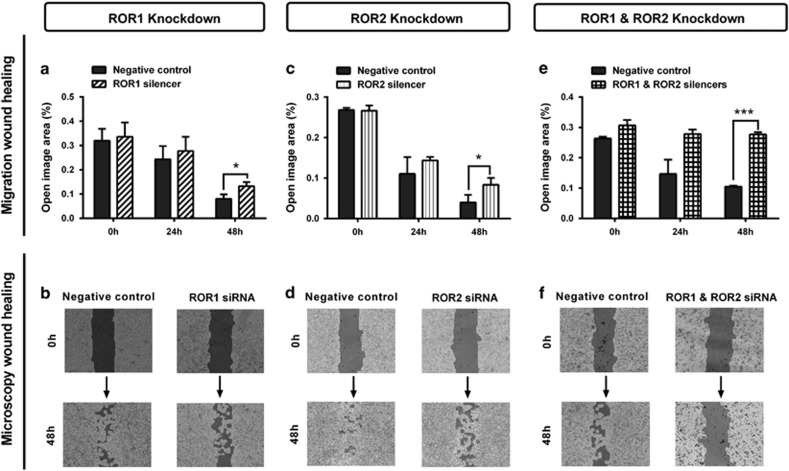
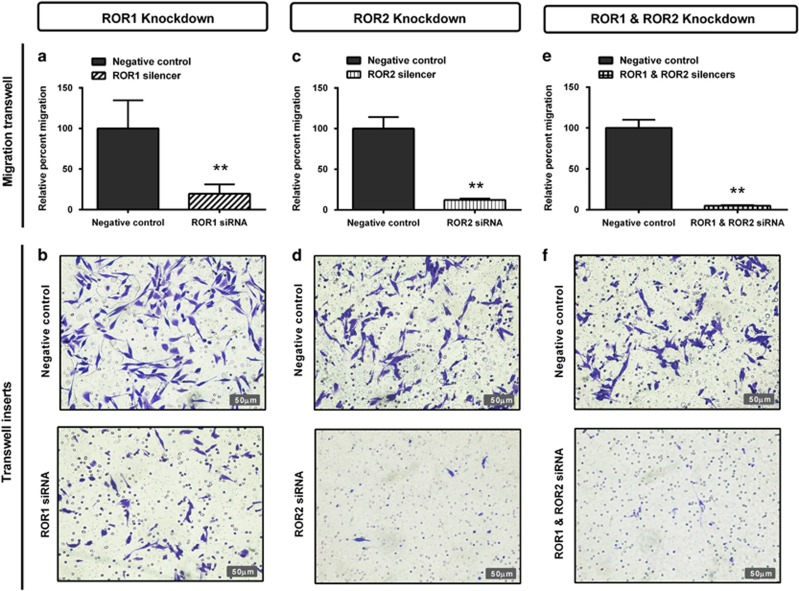
Two separate methods were used to investigate the role of RORs in cell migration: the wound healing assay (horizontal) and transwell assay (vertical). ROR1 knockdown significantly decreased wound healing migration (Figure 3a, P<0.05) and significantly decreased transwell migration (Figure 4a, P<0.01). ROR2 knockdown significantly decreased both wound healing (Figure 3c, P<0.05) and transwell migration (Figure 4c, P<0.01). Combined ROR1 and ROR2 knockdown had the strongest inhibitory effect on overall cell migration in both assays (Figures 3e and 4e, P<0.01).
Figure 3.
ROR1 and ROR2 silencing inhibits wound healing migration. (a) Wound healing cell migration is significantly decreased following ROR1 knockdown in A2780-cis cells. Results represent an average of three experiments. Error bars represent the s.d. of the mean. *P<0.05. (b) Representative images of wound healing analysis showing dark shading as ‘open image area' where no cells are present. Increased dark shading is seen in the ROR1 knockdown cells after 48 h incubation. (c) Cell migration is significantly decreased following ROR2 knockdown in A2780-cis cells. Results represent an average of three experiments. Error bars represent the s.d. of the mean. *P<0.05. (d) Representative images of wound healing analysis showing dark shading as ‘open image area' where no cells are present. Increased dark shading is seen in the ROR2 knockdown cells after 48 h incubation. (e) Cell migration is most significantly decreased following double ROR1 and ROR2 knockdown in A2780-cis cells. Results represent an average of three experiments. Error bars represent the s.d. of the mean. ***P<0.001. (f) Representative images of wound healing analysis showing dark shading as ‘open image area' where no cells are present. The darkest shading is seen in the double ROR1 and ROR2 knockdown cells after 48 h incubation.
Figure 4.
ROR1 and ROR2 silencing inhibits cell migration through transwells. (a) Relative cell migration performed using the transwell migration assay is significantly decreased following ROR1 knockdown in A2780-cis cells. Results represent an average of three experiments. Error bars represent the s.d. of the mean. **P<0.01. (b) Representative images of transwell membranes stained with crystal violet shows decreased number of cells after ROR1 knockdown. (c) Relative cell migration is significantly decreased following ROR2 knockdown in A2780-cis cells. Results represent an average of three experiments. Error bars represent the s.d. of the mean. **P<0.01. (d) Representative images of transwell membranes stained with crystal violet shows decreased number of cells after ROR2 knockdown. (e) Relative cell migration is most significantly decreased following double ROR1 and ROR2 knockdown in A2780-cis cells. Results represent an average of three experiments. Error bars represent the s.d. of the mean. **P<0.01. (f) Representative images of transwell membranes stained with crystal violet shows the strongest decrease in cell number after double ROR1 and ROR2 knockdown.
ROR silencing in A2780-cis cells inhibits cell invasion
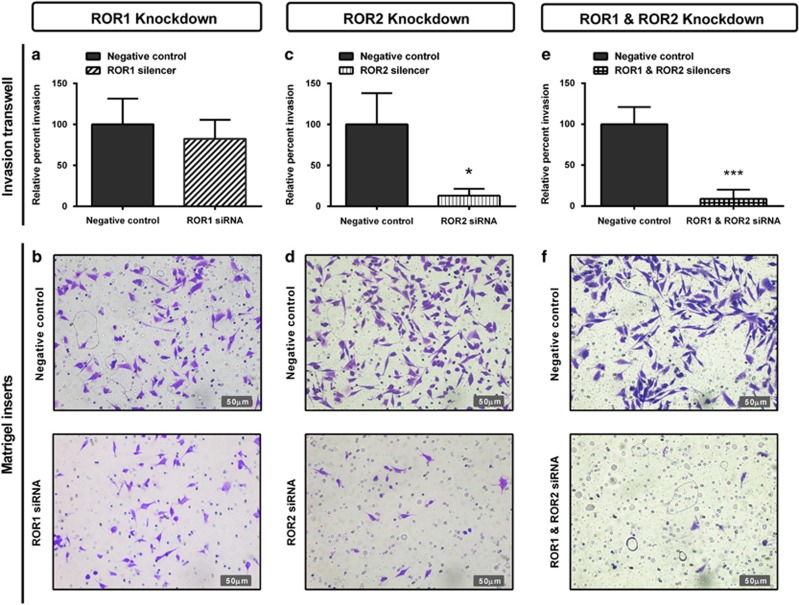
We then aimed to investigate the role of RORs in A2780-cis cell invasion through Matrigel-coated transwells. ROR1 knockdown slightly decreased invasion, although this was not significant (Figure 5a). ROR2 significantly decreased invasion (Figure 5c, P<0.05) and combined ROR1 and ROR2 knockdown had the strongest inhibitory effect on cell invasion (Figures 5e and f, P<0.001).
Figure 5.
ROR1 and ROR2 silencing inhibits cell invasion through Matrigel-coated transwells. (a) Relative cell invasion performed using the Matrigel-coated transwell assay decreases following ROR1 knockdown in A2780-cis cells, however, is not significant. Results represent an average of three experiments. Error bars represent the s.d. of the mean. (b) Representative images of transwell membranes stained with crystal violet shows slight decrease in cells after ROR1 knockdown. (c) Relative cell invasion is significantly decreased following ROR2 knockdown in A2780-cis cells. Results represent an average of three experiments. Error bars represent the s.d. of the mean. *P<0.05. (d) Representative images of transwell membranes stained with crystal violet shows decreased number of cells after ROR2 knockdown. (e) Relative cell invasion is most significantly decreased following double ROR1 and ROR2 knockdown in A2780-cis cells. Results represent an average of three experiments. Error bars represent the s.d. of the mean. ***P<0.001. (f) Representative images of transwell membranes stained with crystal violet shows the strongest decrease in cell number after double ROR1 and ROR2 knockdown.
Simultaneous ROR1 and ROR2 silencing sensitises A2780-cis cells to cisplatin
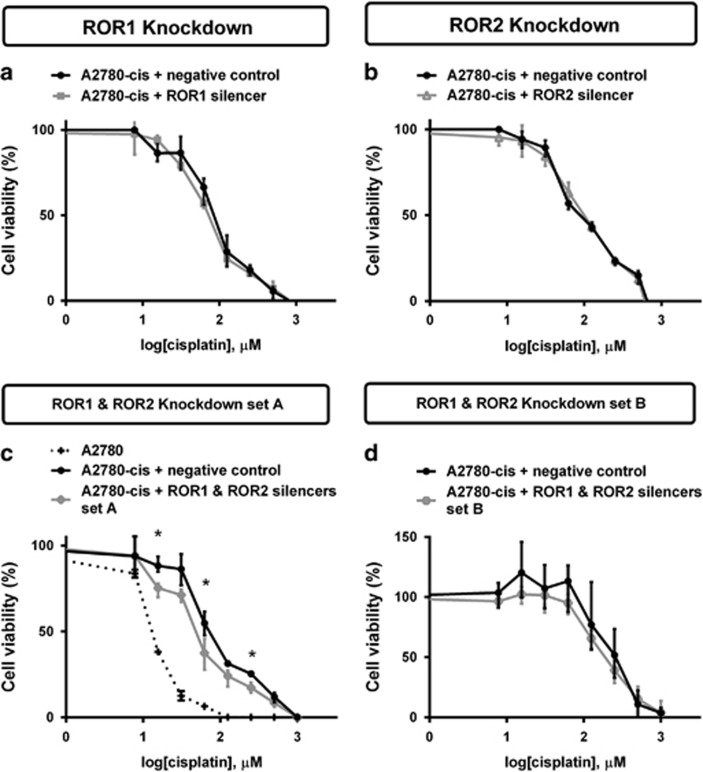
A2780-cis cells were treated with increased concentration of cisplatin to determine cell viability. ROR1 and ROR2 knockdown separately had no effect on chemoresistance (Figures 6a and b). However, combined ROR1 and ROR2 knockdown had a minor but statistically significant chemosensitising effect on the A2780-cis cells to cisplatin when compared with the control cells (Figure 6c, P<0.05). This result was replicated using an additional set of ROR silencers (Figure 6d).
Figure 6.
Combined ROR1 and ROR2 silencing sensitises A2780-cis cells to cisplatin. (a) ROR1 knockdown has no effect on cell viability when treated with cisplatin. Results represent an average of three experiments. Error bars represent the s.d. of the mean. (b) ROR2 knockdown has no effect on cell viability when treated with cisplatin. Results represent an average of three experiments. Error bars represent the s.d. of the mean. (c) Simultaneous ROR1 and ROR2 knockdown decreases A2780-cis chemoresistance and was significant at three concentration points using silencers set A. Significance was determined only between the black (negative control) and grey (ROR1- and ROR2-silenced) cells. The dotted line indicates chemosensitivity of the A2780 cell line for comparison. A2780-cis Results represent an average of three experiments. A2780 results represent an average of two experiments. Error bars represent the s.d. of the mean. *P<0.05. (d) Simultaneous ROR1 and ROR2 knockdown decreases A2780-cis chemoresistance using silencers set B, however, is not statistically significant. A2780-cis results represent an average of three experiments. Error bars represent the s.d. of the mean.
Neither ROR1 nor ROR2 overexpression affects A2780 cell proliferation or migration
We then investigated the role of RORs in this model through ectopic expression in the parental A2780 cell line. Successful plasmid transfection of A2780 was confirmed by quantitative PCR with an increased ROR expression at the mRNA level (Figures 7a–c).
Figure 7.
ROR1 and ROR2 overexpression in the A2780 parental cell line. (a) ROR1 is overexpressed at the mRNA level following ROR1 plasmid transfection. No effect seen on ROR2 levels. qRT–PCR was performed in triplicate and normalised to three different housekeeping genes (SDHA, HSPCB and RPL13A). Results represent an average of three experiments. Error bars represent the s.d. of the mean. (b) ROR2 is overexpressed at the mRNA level following ROR2 plasmid transfection. No effect seen on ROR1 levels. qRT–PCR was performed in triplicate and normalised to three different housekeeping genes (SDHA, HSPCB and RPL13A). Results represent an average of three experiments. Error bars represent the s.d. of the mean. (c) Simultaneous transfection of ROR1 and ROR2 plasmids in A2780 increases mRNA levels of ROR1 and ROR2. qRT–PCR was performed in triplicate and normalised to three different housekeeping genes (SDHA, HSPCB and RPL13A). Results represent an average of three experiments. Error bars represent the s.d. of the mean.
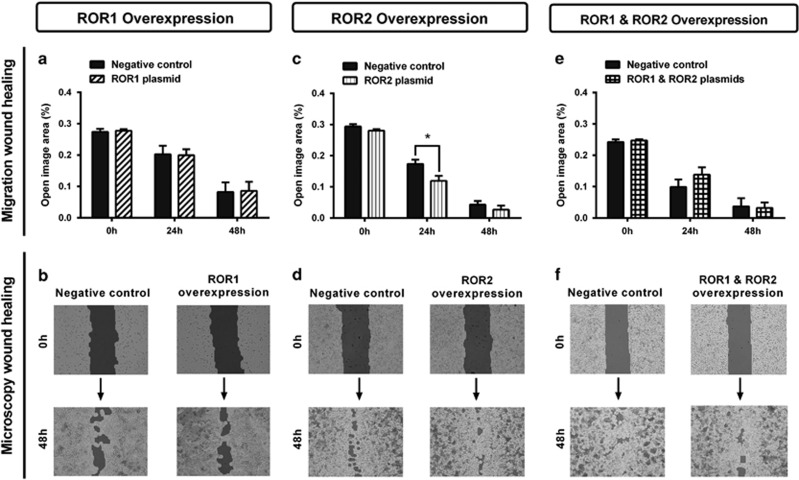
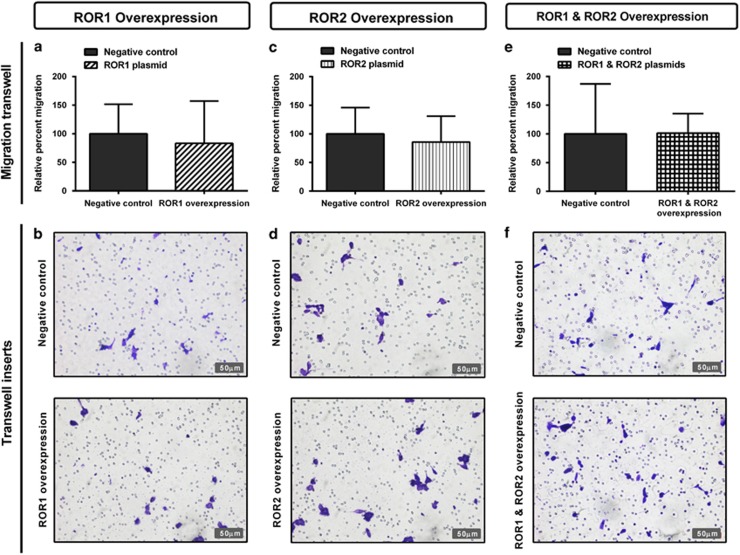
Individual overexpression of ROR1 and ROR2, or simultaneous expression of ROR1 and ROR2 had no significant effect on cell proliferation (Figures 8a–c). There was no change in wound healing migration after ROR1 overexpression (Figures 9a and b); however, there was a significant increase in migration at the 24 h point after ROR2 transfection (Figures 9c–d, P<0.05). No change was seen in wound healing migration after simultaneous ROR1 and ROR2 overexpression (Figures 9e and f). Additionally, neither single ROR1 and ROR2 nor double ROR overexpression had a significant effect on cell transwell migration (Figures 10a–f).
Figure 8.
ROR overexpression has no effect on A2780 proliferation. (a) Cell proliferation does not change over 24-72 h following ROR1 overexpression in A2780 cells. Results represent the average of three independent experiments. Error bars represent the s.d. of the mean. (b) Cell proliferation does not change over 24–72 h following ROR2 overexpression in A2780 cells. Results represent the average of three independent experiments. Error bars represent the s.d. of the mean. (c) Cell proliferation does not change over 24–72 h following simultaneous ROR1 and ROR2 overexpression in A2780 cells. Results represent the average of three independent experiments. Error bars represent the s.d. of the mean.
Figure 9.
ROR2 overexpression may increase wound healing migration. (a) Wound healing cell migration does not change following ROR1 overexpression in A2780 cells. Results represent an average of three experiments. Error bars represent the s.d. of the mean. (b) Representative images of wound healing analysis showing dark shading as ‘open image area' where no cells are present. (c) Wound healing cell migration is significantly increased at the 24 h time point following ROR2 overexpression in A2780 cells, indicated by a decrease in ‘open image area'. Results represent an average of three experiments. Error bars represent the s.d. of the mean. *P<0.05. (d) Representative images of wound healing analysis showing dark shading as ‘open image area' where no cells are present. (e) Wound healing cell migration does not change following simultaneous ROR1 and ROR2 overexpression in A2780 cells. Results represent an average of three experiments. Error bars represent the s.d. of the mean. (f) Representative images of wound healing analysis showing dark shading as ‘open image area' where no cells are present.
Figure 10.
ROR overexpression has no effect on cell migration through transwells. (a) Relative cell migration performed using the transwell migration assay does not change after ROR1 overexpression in A2780 cells. Results represent an average of three experiments. Error bars represent the s.d. of the mean. (b) Representative images of transwell membranes stained with crystal violet shows similar number of cells after ROR1 overexpression. (c) Relative cell migration does not change after ROR2 overexpression in A2780 cells. Results represent an average of three experiments. Error bars represent the s.d. of the mean. (d) Representative images of transwell membranes stained with crystal violet shows similar number of cells after ROR2 overexpression. (e) Relative cell migration performed using the transwell migration assay does not change after simultaneous ROR1 and ROR2 overexpression in A2780 cells. Results represent an average of three experiments. Error bars represent the s.d. of the mean. (f) Representative images of transwell membranes stained with crystal violet shows similar number of cells after ROR1 and ROR2 overexpression.
ROR1 overexpression increases cell invasion
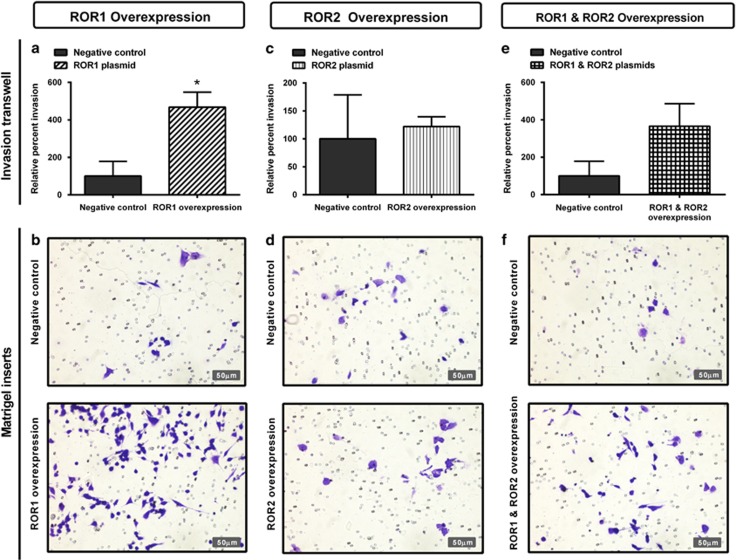
Ectopic expression of ROR1 in the A2780 cell line significantly increased cell invasion through Matrigel-coated transwells (Figures 11a and b, P<0.05). However, there was no change in cell invasion after ROR2 overexpression (Figures 11c and d). Simultaneous ROR1 and ROR2 overexpression resulted in an increase in cell invasion; however, this was not statistically significant (Figures 11e and f).
Figure 11.
ROR1 and ROR2 overexpression increases cell invasion. (a) Relative cell invasion performed using the Matrigel-coated transwell assay significantly increases following ROR1 overexpression in A2780 cells. Results represent an average of two experiments. Error bars represent the s.d. of the mean. *P<0.05. (b) Representative images of transwell membranes stained with crystal violet shows increase in cells after ROR1 overexpression. (c) Relative cell invasion following ROR2 overexpression has a minor increase in A2780 cells, which is not significant. Results represent an average of two experiments. Error bars represent the s.d. of the mean. (d) Representative images of transwell membranes stained with crystal violet shows similar number of cells after ROR2 overexpression. (e) Relative cell invasion increases following double ROR1 and ROR2 overexpression in A2780 cells, however, is not statistically significant. Results represent an average of two experiments. Error bars represent the s.d. of the mean. (f) Representative images of transwell membranes stained with crystal violet after double ROR1 and ROR2 overexpression.
ROR overexpression does not change cisplatin sensitivity in the parental A2780 cell line
A2780 cells were treated with increased concentration of cisplatin to determine cell viability. ROR1 and ROR2 overexpression separately had no effect on chemoresistance (Figures 12a and b). Double ROR1 and ROR2 transfection was also not sufficient to significantly increase cell chemoresistance (Figure 12c).
Figure 12.
ROR1 and ROR2 overexpression has no effect on A2780 sensitivity to cisplatin. (a) ROR1 overexpression has no effect on cell viability when treated with cisplatin. Results represent an average of three experiments. Error bars represent the s.d. of the mean. (b) ROR2 overexpression has no effect on cell viability when treated with cisplatin. Results represent an average of three experiments. Error bars represent the s.d. of the mean. (c) Simultaneous ROR1 and ROR2 overexpression has no effect on cell viability when treated with cisplatin. Results represent an average of three experiments. Error bars represent the s.d. of the mean.
Discussion
Here we have shown that silencing ROR1 and ROR2 decreases cell migration and invasion in the cisplatin-resistant cell line A2780-cis. We believe this is a more clinically appropriate model for the investigation of ovarian cancer as patients often develop recurrent and resistant disease. This paper supports our previous study,27 which found that ROR2 was upregulated in ovarian cancer patients and that knockdown of ROR1 and ROR2 together significantly inhibited cell migration and invasion. Additionally, other groups have also reported the overexpression of ROR1 in ovarian cancer patients and linked to poor clinical outcome and increased capacity of spheroid formation.29, 30 Here we have additionally shown that these receptors may enhance chemoresistance, and that knockdown may sensitise these cells to cisplatin.
The ability of ovarian cancer cells to adhere to a secondary site is extremely important in ovarian cancer metastasis because of the unique dissemination process of shedding into peritoneal fluid.31 During the adhesion assays, we noted that the A2780-cis cell line did not adhere to collagen but only fibronectin, whereas the A2780 adhered to both extracellular matrix components. This is an interesting observation and supports the profile array results (Supplementary Figure 1E and F), suggesting that these A2780-cis cells are in a process of upregulated EMT with very low adhesion components.12
Recently, β-catenin-dependent Wnt signalling has been implicated in the A2780- and cisplatin-resistant cell lines.32 It was shown that Wnt gatekeepers such as DKK1 and SFRP4 were significantly downregulated in the A2780-cis cells compared with A2780. Additionally, downstream targets such as JUN were upregulated, supporting our current and previous results.17, 27 The study, however, also saw lower β-catenin protein levels in the A2780-cis cells, which may indicate some β-catenin-independent inhibitory action via the ROR receptors; unfortunately, no other β-catenin-independent Wnt targets were investigated.
Overcoming chemoresistance is a major challenge in epithelial ovarian cancer treatment and although there is initial remission in 75% of patients, subsequent recurrence occurs <2 years post-treatment.33 Attempts to identify characteristics of chemoresistant cells have shown markers of EMT in vitro.34 Silencing of EMT transcription factors Snail and Slug induces chemosensitivity in A2780 cisplatin-resistant cells, while upregulation leads to radiotherapy resistance and chemoresistance in A4 ovarian cancer cells.11, 35 In our study, we found that simultaneous silencing of ROR1 and ROR2 significantly sensitised cells to cisplatin (Figure 6c), a commonly used chemotherapy agent for ovarian cancer patients. We confirmed these results using an additional set of siRNA silencers (Figure 6d). We hypothesise that the A2780-cis cells undergo a reversion of EMT, that is, gain epithelial characteristics after double ROR knockdown, which causes their sensitivity to cisplatin. Indeed, it would be important to investigate these changes further through profiling stable knockdown and patient cell models.
During the course of the viability assays, we observed a shift in the chemoresistance of the A2780-cis cells. The viability assay with siRNA set B was completed ~4 months after set A. Therefore, it is highly likely that these cells would have changed under consistent pressure from cisplatin treatments and continual passaging. However, even though this was seen, we still noted some reduction in chemoresistance after double ROR knockdown using silencer set B (Figure 6d). The chemosensitising results, although significant at some concentration points, are minor and investigations are ongoing.
In this study, we demonstrated that ROR2 silencing alone decreased cell proliferation (Figure 2c), yet ROR1 or double ROR1 and ROR2 silencing did not (Figures 2a and e). We also found that ROR1 silencing alone had no effect on invasion (Figure 5a), yet ROR2 and double ROR1 and ROR2 silencing significantly perturbed invasion (Figures 5c and e). We also performed ROR1, ROR2 and simultaneous ROR plasmid overexpression in the parental A2780 cell line. Overexpressing the ROR receptors was not sufficient to increase migration (Figure 10) or chemoresistance of the A2780 cells (Figure 12). Interestingly, we did observe an increase in invasion after ROR1, ROR2 and double overexpression (Figure 11). ROR1 knockdown in the chemoresistant A2780-cis cell line did not significantly alter cell invasion (Figure 5a); however, ROR1 overexpression in the parental A2780 cells did. This may be because the A2780 cell line does not normally express ROR1; therefore, overexpressing the protein at very high levels could markedly change their behaviour.
These differing results between ROR1 and ROR2 after silencing and overexpression suggests that they may facilitate alternative signalling pathways as discussed previously.27 Recently, it has been found that ROR1 is critical in the structure and formation of caveolae36 and is a target for the frequently amplified NKX2-1 gene in lung adenocarcinoma.37 Interestingly, its significance as a scaffold protein for a number of other RTKs was found in sustaining caveolae formation and prosurvival signalling. ROR2 may be more involved in planar cell polarity signalling through GTPases RhoA and Rac, a branch of the β-catenin-independent Wnt signalling pathway.38
Conclusion
ROR1 and ROR2 are upregulated in a chemoresistant model of ovarian cancer and regulate cell migration and invasion through EMT. Targeting the ROR receptors provides a potential avenue for novel therapeutics to overcome the current inevitable development of chemoresistance in ovarian cancer patients.
Materials and methods
Cell culture
The epithelial ovarian cancer cell line A2780 was kindly donated by Dr Michelle Henderson (Children's Cancer Institute, UNSW, Sydney, Australia) and was originally purchased from the American Type Culture Collection (ATCC, Manassas, VA, USA). Its daughter chemoresistant cell line A2780-cis was obtained from Sigma-Aldrich (no. 93112517, St Louis, MO, USA). Both cell lines were cultured as per the supplier's recommendations (RPMI-1640 containing 10% foetal bovine serum). Media were supplemented with penicillin/streptomycin and GlutaMAX (Life Technologies, Carlsbad, CA, USA). A2780-cis cells were maintained in 1μm cisplatin every 2–3 passages. Cells were grown in 5% CO2 at 37 °C and were routinely tested negative for mycoplasma contamination.
ROR silencing
Cells were transfected with siRNA targeting ROR1 and ROR2 as described previously.27 ROR silencing efficiency was confirmed by western blotting and quantitative real-time polymerase chain reaction (qRT–PCR) as described previously.27
ROR overexpression
A plasmid encoding human ROR2 with pFLAG tagged at the N-terminal end was constructed by subcloning the ROR2 cDNA transcript into pFLAG-CMV-4 plasmid (Sigma-Aldrich). ROR1 mouse expression plasmid (pcDNA3-mRor1-flag) was generously donated by Prof Yasuhiro Minami (Kobe University, Kobe, Japan). Plasmid transfections were conducted using polyethylenimine (Polysciences, Warwrington, PA, USA) according to the manufacturer's specifications. In all transfection experiments, 1 × 10⁶ cells were seeded into 6-well plates and serum starved overnight. Cells were transfected the following day with 700 ng of ROR1 or ROR2 expression vector, or an empty vector pFLAG control (labelled in figures as negative control). Transfection mixture was removed 24 h later and cells were washed with serum-free media and replaced with complete media containing 10% foetal bovine serum. The efficiency of ROR overexpression was confirmed by western blotting and qRT–PCR. In addition to the primers previously used to detect ROR1 and ROR2,27 additional ROR1 primers were used to detect the ROR1 expression plasmid (F: 5′-GGGCAACCAACTATGGCTCT-3′ R: 5′-TGTTGCCACACACTGGAAGT-3′).
EMT PCR Array
Human EMT RT2 Profiler PCR Array (PAS0907; SABiosciences Qiagen, Valencia, CA, USA) and RT2 Real-Timer SyBR Green/ROX PCR Mix (SABioscience Qiagen) was used to measure mRNA expression levels of 93 EMT genes in the A2780 and A2780-cis cell lines according to the manufacturer's protocol. Each array was repeated in triplicate.
Proliferation assay
As described previously,27 cell proliferation was measured using the CCK8 Kit (Dojindo, Rockville, MD, USA) according to the manufacturer's protocol. Briefly, 7 h after ROR siRNA or plasmid transfection, 100 μl of cells were seeded in triplicate into a 96-well plate at a concentration of 4 × 10⁴ cells per ml in triplicate. At 3 h after the addition of CCK8, absorbance was read at 450 nm using the SpectraMax 190 Microplate reader (Molecular Devices, Sunnydale, CA, USA). Each assay was repeated in triplicate.
Viability assay
Cell viability was measured using the CCK8 Kit (Dojindo) according to the manufacturer's protocol. At 24 h after ROR siRNA or plasmid transfection, 100 μl of cells were seeded in triplicate into a 96-well plate at a concentration of 4x10⁴ cells per ml. They were left to adhere for 24 h, treated with cisplatin in serial dilutions up to a concentration of 1000 mm and left to incubate at 37 °C for another 24 h. At 3 h after the addition of CCK8, absorbance was read at 450nm using the SpectraMax 190 Microplate Reader (Molecular Devices). A2780 cell viability was repeated in duplicate and used as a comparison for A2780-cis, which was repeated in triplicate. A second set of ROR silencers were used to validate the results, as described previously.27
Adhesion assay
As described previously,27 cell adhesion was measured against collagen type I and fibronectin. After 2 h of incubation on precoated collagen or fibronectin plates, cells were stained with crystal violet and lysed with acetic acid. Absorbance was measured at 595 nm using the SpectraMax Plus190 Microplate Reader (Molecular Devices). Each assay was repeated in triplicate.
Wound healing assay
Wound healing was analysed using IBIDI Culture-Inserts (IBIDI GmbH, Martinsried, Germany) as described previously.27 Cells were plated at a concentration of 1 × 10⁵ cells per ml, and after 24 h of incubation, culture inserts were removed. Photographs of the movement of cells into the scratch area were taken every 6–12 h until the scratch area had closed using a Leica DMIL microscope (Leica Microsystems, North Ryde, NSW, Australia). Wound healing was then analysed using TScratch software (ETH Zurich, Zurich, Switzerland).39 Each assay was repeated in triplicate.
Transwell migration assay
Cell migration was measured using Transwell inserts (Corning Life Sciences, Tewksbury, MA, USA) as described previously,27 according to the manufacturer's instructions. The transwells for the A2780 cells required overnight precoating of collagen (10 μg/ml in H2O) before seeding. Cells were seeded in transwell inserts at a concentration of 1 × 10⁶ cells per ml (200 μl) and incubated overnight. ImageJ (Java) software (Rasband, NIH, Bethesda, MD, USA) was used to obtain an average cell count of the four stained membrane images. Each assay was repeated in triplicate.
Transwell invasion assay
Cell invasion was measured using Matrigel precoated transwell inserts (BioCoat Matrigel Invasion Chambers, Corning Life Sciences, Tewksbury, MA, USA) according to the manufacturer's instructions as described previously27 and were optimised using untreated cells. Cells were seeded in transwell inserts at a concentration of 5 × 10⁵ cells per ml (100 μl) and incubated for 48 h. ImageJ (Java) software was used to obtain an average cell count of the four stained membrane images. Each ROR silencing assay was repeated in triplicate and each ROR overexpression assay was completed in duplicate.
Statistical analysis
As described previously,27 all in vitro experimental results are expressed as mean±s.d. An F test was first used to determine equal or unequal data variance (s.d.). A Student's t-test type 2 was used to determine significance if equal variance. If unequal variance, a Student's t-test type 3 was used to determine significance. T-test values below P<0.05 were considered statistically significant. *P<0.05, **P<0.01 and ***P<0.001.
Acknowledgments
We thank Dr Michelle Henderson of the CCI, UNSW for the generous donation of the A2780 cells. We also thank Prof Yasuhiro Minami, Kobe University for the ROR1 plasmid and Sean Qi Ma, UNSW for the creation of the ROR2 plasmid. Ovarian Cancer Research Foundation grant support was provided to CF.
The authors declare no conflict of interest.
Footnotes
Supplementary Information accompanies this paper on the Oncogenesis website (http://www.nature.com/oncsis).
Supplementary Material
References
- Konecny GE, Wang C, Hamidi H, Winterhoff B, Kalli KR, Dering J et al. Prognostic and therapeutic relevance of molecular subtypes in high-grade serous ovarian cancer. J Natl Cancer Inst 2014; 106. [DOI] [PMC free article] [PubMed] [Google Scholar]
- Schildkraut JM, Iversen ES, Akushevich L, Whitaker R, Bentley RC, Berchuck A et al. Molecular signatures of epithelial ovarian cancer: analysis of associations with tumor characteristics and epidemiologic risk factors. Cancer Epidemiol Biomarkers Prev 2013; 22: 1709–1721. [DOI] [PMC free article] [PubMed] [Google Scholar]
- Verhaak RG, Tamayo P, Yang JY, Hubbard D, Zhang H, Creighton CJ et al. Prognostically relevant gene signatures of high-grade serous ovarian carcinoma. J Clin Invest 2013; 123: 517–525. [DOI] [PMC free article] [PubMed] [Google Scholar]
- Helm CW, States JC. Enhancing the efficacy of cisplatin in ovarian cancer treatment—could arsenic have a role. J Ovarian Res 2009; 2: 2. [DOI] [PMC free article] [PubMed] [Google Scholar]
- Dasari S, Tchounwou PB. Cisplatin in cancer therapy: molecular mechanisms of action. Eur J Pharmacol 2014; 740: 364–378. [DOI] [PMC free article] [PubMed] [Google Scholar]
- Cancer Genome Atlas Research N. Integrated genomic analyses of ovarian carcinoma. Nature 2011; 474: 609–615. [DOI] [PMC free article] [PubMed] [Google Scholar]
- Leong HS, Galletta L, Etemadmoghadam D, George J, Australian Ovarian Cancer S, Kobel M et al. Efficient molecular subtype classification of high-grade serous ovarian cancer. J Pathol 2015; 236: 272–277. [DOI] [PubMed] [Google Scholar]
- Patch AM, Christie EL, Etemadmoghadam D, Garsed DW, George J, Fereday S et al. Whole-genome characterization of chemoresistant ovarian cancer. Nature 2015; 521: 489–494. [DOI] [PubMed] [Google Scholar]
- Tothill RW, Tinker AV, George J, Brown R, Fox SB, Lade S et al. Novel molecular subtypes of serous and endometrioid ovarian cancer linked to clinical outcome. Clin Cancer Res 2008; 14: 5198–5208. [DOI] [PubMed] [Google Scholar]
- Ford CE, Punnia-Moorthy G, Henry CE, Llamosas E, Nixdorf S, Olivier J et al. The non-canonical Wnt ligand, Wnt5a, is upregulated and associated with epithelial to mesenchymal transition in epithelial ovarian cancer. Gynecol Oncol 2014; 134: 338–345. [DOI] [PubMed] [Google Scholar]
- Haslehurst AM, Koti M, Dharsee M, Nuin P, Evans K, Geraci J et al. EMT transcription factors snail and slug directly contribute to cisplatin resistance in ovarian cancer. BMC Cancer 2012; 12: 91. [DOI] [PMC free article] [PubMed] [Google Scholar]
- Kurrey NK, Amit K, Bapat SA. Snail and Slug are major determinants of ovarian cancer invasiveness at the transcription level. Gynecol Oncol 2005; 97: 155–165. [DOI] [PubMed] [Google Scholar]
- Miow QH, Tan TZ, Ye J, Lau JA, Yokomizo T, Thiery JP et al. Epithelial–mesenchymal status renders differential responses to cisplatin in ovarian cancer. Oncogene 2015; 34: 1899–1907. [DOI] [PubMed] [Google Scholar]
- Baldwin LA, Hoff JT, Lefringhouse J, Zhang M, Jia C, Liu Z et al. CD151-alpha3beta1 integrin complexes suppress ovarian tumor growth by repressing slug-mediated EMT and canonical Wnt signaling. Oncotarget 2014; 5: 12203–12217. [DOI] [PMC free article] [PubMed] [Google Scholar]
- Cui B, Zhang S, Chen L, Yu J, Widhopf GF, Fecteau JF et al. Targeting ROR1 inhibits epithelial–mesenchymal transition and metastasis. Cancer Res 2013; 73: 3649–3660. [DOI] [PMC free article] [PubMed] [Google Scholar]
- Dissanayake SK, Wade M, Johnson CE, O'Connell MP, Leotlela PD, French AD et al. The Wnt5A/protein kinase C pathway mediates motility in melanoma cells via the inhibition of metastasis suppressors and initiation of an epithelial to mesenchymal transition. J Biol Chem 2007; 282: 17259–17271. [DOI] [PMC free article] [PubMed] [Google Scholar]
- Ford CE, Jary E, Ma S, Nixdorf S, Heinzelmann-Schwarz V, Ward RL. The Wnt gatekeeper SFRP4 modulates EMT, cell migration and downstream Wnt signalling in serous ovarian cancer cells. PLoS ONE 2013; 8: e54362. [DOI] [PMC free article] [PubMed] [Google Scholar]
- Kanzawa M, Semba S, Hara S, Itoh T, Yokozaki H. WNT5A is a key regulator of the epithelial–mesenchymal transition and cancer stem cell properties in human gastric carcinoma cells. Pathobiology 2013; 80: 235–244. [DOI] [PubMed] [Google Scholar]
- Ren D, Minami Y, Nishita M. Critical role of Wnt5a-Ror2 signaling in motility and invasiveness of carcinoma cells following Snail-mediated epithelial–mesenchymal transition. Genes Cells 2011; 16: 304–315. [DOI] [PubMed] [Google Scholar]
- Taki M, Kamata N, Yokoyama K, Fujimoto R, Tsutsumi S, Nagayama M. Down-regulation of Wnt-4 and up-regulation of Wnt-5a expression by epithelial-mesenchymal transition in human squamous carcinoma cells. Cancer Sci 2003; 94: 593–597. [DOI] [PMC free article] [PubMed] [Google Scholar]
- Anastas JN, Moon RT. WNT signalling pathways as therapeutic targets in cancer. Nat Rev Cancer 2013; 13: 11–26. [DOI] [PubMed] [Google Scholar]
- Loh YN, Hedditch EL, Baker LA, Jary E, Ward RL, Ford CE. The Wnt signalling pathway is upregulated in an in vitro model of acquired tamoxifen resistant breast cancer. BMC Cancer 2013; 13: 174. [DOI] [PMC free article] [PubMed] [Google Scholar]
- O'Connell MP, Fiori JL, Xu M, Carter AD, Frank BP, Camilli TC et al. The orphan tyrosine kinase receptor, ROR2, mediates Wnt5A signaling in metastatic melanoma. Oncogene 2010; 29: 34–44. [DOI] [PMC free article] [PubMed] [Google Scholar]
- O'Connell MP, Marchbank K, Webster MR, Valiga AA, Kaur A, Vultur A et al. Hypoxia Induces Phenotypic Plasticity and Therapy Resistance in Melanoma via the Tyrosine Kinase Receptors ROR1 and ROR2. Cancer Discov 2013; 3: 1378–1393. [DOI] [PMC free article] [PubMed] [Google Scholar]
- Sun B, Ye X, Lin L, Shen M, Jiang T. Up-regulation of ROR2 is associated with unfavorable prognosis and tumor progression in cervical cancer. Int J Clin Exp Pathol 2015; 8: 856–861. [PMC free article] [PubMed] [Google Scholar]
- Henry C, Quadir A, Hawkins NJ, Jary E, Llamosas E, Kumar D et al. Expression of the novel Wnt receptor ROR2 is increased in breast cancer and may regulate both beta-catenin dependent and independent Wnt signalling. J Cancer Res Clin Oncol 2015; 141: 243–254. [DOI] [PubMed] [Google Scholar]
- Henry C, Llamosas E, Knipprath-Meszaros A, Schoetzau A, Obermann E, Fuenfschilling M et al. Targeting the ROR1 and ROR2 receptors in epithelial ovarian cancer inhibits cell migration and invasion. Oncotarget 2015; 6: 40310–40326. [DOI] [PMC free article] [PubMed] [Google Scholar]
- Bowtell DD, Bohm S, Ahmed AA, Aspuria PJ, Bast RC Jr, Beral V et al. Rethinking ovarian cancer II: reducing mortality from high-grade serous ovarian cancer. Nat Rev Cancer 2015; 15: 668–679. [DOI] [PMC free article] [PubMed] [Google Scholar]
- Zhang S, Cui B, Lai H, Liu G, Ghia EM, Widhopf GF II et al. Ovarian cancer stem cells express ROR1, which can be targeted for anti-cancer-stem-cell therapy. Proc Natl Acad Sci USA 2014; 111: 17266–17271. [DOI] [PMC free article] [PubMed] [Google Scholar]
- Zhang H, Qiu J, Ye C, Yang D, Gao L, Su Y et al. ROR1 expression correlated with poor clinical outcome in human ovarian cancer. Sci Rep 2014; 4: 5811. [DOI] [PMC free article] [PubMed] [Google Scholar]
- Yeung TL, Leung CS, Yip KP, Au Yeung CL, Wong ST, Mok SC. Cellular and molecular processes in ovarian cancer metastasis. A Review in the Theme: cell and molecular processes in cancer metastasis. Am J Physiol Cell Physiol 2015; 309: C444–C456. [DOI] [PMC free article] [PubMed] [Google Scholar]
- Barghout SH, Zepeda N, Xu Z, Steed H, Lee CH, Fu Y. Elevated beta-catenin activity contributes to carboplatin resistance in A2780cp ovarian cancer cells. Biochem Biophys Res Commun 2015; 468: 173–178. [DOI] [PubMed] [Google Scholar]
- Ozols RF. Challenges for chemotherapy in ovarian cancer. Ann Oncol 2006; 17(Suppl 5): v181–v187. [DOI] [PubMed] [Google Scholar]
- Kajiyama H, Shibata K, Terauchi M, Yamashita M, Ino K, Nawa A et al. Chemoresistance to paclitaxel induces epithelial-mesenchymal transition and enhances metastatic potential for epithelial ovarian carcinoma cells. Int J Oncol 2007; 31: 277–283. [PubMed] [Google Scholar]
- Kurrey NK, Jalgaonkar SP, Joglekar AV, Ghanate AD, Chaskar PD, Doiphode RY et al. Snail and Slug mediate radioresistance and chemoresistance by antagonizing p53-mediated apoptosis and acquiring a stem-like phenotype in ovarian cancer cells. Stem Cells 2009; 27: 2059–2068. [DOI] [PubMed] [Google Scholar]
- Yamaguchi T, Lu C, Ida L, Yanagisawa K, Usukura J, Cheng J et al. ROR1 sustains caveolae and survival signalling as a scaffold of cavin-1 and caveolin-1. Nat Commun 2016; 7: 10060. [DOI] [PMC free article] [PubMed] [Google Scholar]
- Yamaguchi T, Yanagisawa K, Sugiyama R, Hosono Y, Shimada Y, Arima C et al. NKX2-1/TITF1/TTF-1-induced ROR1 is required to sustain EGFR survival signaling in lung adenocarcinoma. Cancer Cell 2012; 21: 348–361. [DOI] [PubMed] [Google Scholar]
- Martinez S, Scerbo P, Giordano M, Daulat AM, Lhoumeau AC, Thome V et al. The PTK7 and ROR2 receptors interact in the vertebrate WNT/PCP pathway. J Biol Chem 2015; 290: 30562–30572. [DOI] [PMC free article] [PubMed] [Google Scholar]
- Geback T, Schulz MM, Koumoutsakos P, Detmar M. TScratch: a novel and simple software tool for automated analysis of monolayer wound healing assays. BioTechniques 2009; 46: 265–274. [DOI] [PubMed] [Google Scholar]
Associated Data
This section collects any data citations, data availability statements, or supplementary materials included in this article.


