

Abstract
Both obesity and diabetes mellitus are associated with alterations in lipid metabolism as well as a change in bone homeostasis and osteoclastogenesis. We hypothesized that increased fatty acid levels affect bone health by altering precursor cell differentiation and osteoclast activation. Here we show that palmitic acid (PA, 16:0) enhances receptor activator of NF-κB ligand (RANKL)-stimulated osteoclastogenesis and is sufficient to induce osteoclast differentiation even in the absence of RANKL. TNFα expression is crucial for PA-induced osteoclastogenesis, as shown by increased TNFα mRNA levels in PA-treated cells and abrogation of PA-stimulated osteoclastogenesis by TNFα neutralizing antibodies. In contrast, oleic acid (OA, 18:1) does not enhance osteoclast differentiation, leads to increased intracellular triglyceride accumulation, and inhibits PA-induced osteoclastogenesis. Adenovirus-mediated expression of diacylglycerol acyl transferase 1 (DGAT1), a gene involved in triglyceride synthesis, also inhibits PA-induced osteoclastogenesis, suggesting a protective role of DGAT1 for bone health. Accordingly, Dgat1 knockout mice have larger bone marrow-derived osteoclasts and decreased bone mass indices. In line with these findings, mice on a high-fat PA-enriched diet have a greater reduction in bone mass and structure than mice on a high-fat OA-enriched diet. Thus, we propose that TNFα mediates saturated fatty acid-induced osteoclastogenesis that can be prevented by DGAT activation or supplementation with OA.
Keywords: OSTEOCLASTOGENESIS, PALMITIC ACID, TNFA, DGAT1, TRIGLYCERIDES
Introduction
Bone undergoes constant remodeling, balancing osteoclast-mediated bone resorption, and osteoblast-regulated bone formation. Under normal conditions, these processes secure the stability of bone mass. Systemic or local abnormalities, such as hormonal deregulation(1) or inflammation,(2) compromise bone homeostasis and may enhance bone resorption by osteoclasts, resulting in reduced bone mass.
Osteoclasts are multinucleated cells that derive from hematopoietic monocyte/macrophage precursor cells.(2) Osteoclastogenesis mostly relies on activation of precursor cells by the receptor activator of NF-κB ligand (RANKL). RANKL is produced by osteoblasts, osteocytes,(3,4) stromal cells, T and B lymphocytes, and endothelial cells(5) and binds to the specific receptor activator of NF-κB (RANK). Differentiation of macrophages into osteoclasts is accompanied by fusion with adjacent macrophages, resulting in formation of big multinucleated cells. Osteoclastogenesis can be assessed by size and multinuclearity, as well as by gene expression levels of tartrate-resistant acid phosphatase (TRAP). Tumor necrosis factor α (TNFα) can also induce osteoclastogenesis through a RANKL/RANK-independent mechanism.(6–10) Induction of pro-inflammatory cytokines, such as TNFα and IL-6, has been implicated in bone loss that occurs in chronic inflammatory diseases such as rheumatoid arthritis and periodontitis,(11,12) as well as in diabetes.(12,13)
Systemic metabolic derangements in obesity, diabetes mellitus, and the metabolic syndrome are linked to abnormal bone homeostasis. Although obesity itself has traditionally been associated with increased bone mass,(14) mainly attributed to enhanced bone formation in response to weight-bearing mechanical stimulation,(15) increased fat mass and hyperlipidemia have been shown to decrease bone mineral density and increase fracture risk in young(16–18) and adult individuals.(19–25) Previous studies on the impact of hyperlipidemia and increased circulating fatty acid (FA) levels on osteoclastogenesis have been inconclusive.(26,27) We hypothesize that saturation of FA is an important variable promoting osteoclastogenesis and osteolysis. Our study aimed to investigate this hypothesis and identify mechanisms that mediate these actions.
Materials and Methods
RAW 264.7 cell cultures
RAW 264.7 cells were plated into 6-well plates at a density of 150,000 cells/well in 10% fetal bovine serum (FBS) (ATCC, Manassas, VA, USA) plus 1% penicillin/streptomycin (ATCC), DMEM (4500 mg/L glucose) (ATCC) supplemented with 20 ng/mL RANKL (PeproTech, Rocky Hill, NJ, USA). In the fatty acid treatments, 1% bovine serum slbumin (BSA) (Sigma-Aldrich, St. Louis, MO, USA) was added to the medium along with 0.2 mM palmitic acid (PA) or 0.2 mM oleic acid (OA) or 0.2 mM PA + 0.2 mM OA diluted in methanol. Control cells were treated with equivalent amount of methanol and BSA. Anti-TNFa antibody (10 μg/mL, Millipore, Billerica, MA, USA) was added to the culture medium. Cells were cultured for 5 days, and the medium was replenished on day 2 and day 4.
Animals
All procedures involving animals were approved by the Institutional Animal Care and Use Committee at Columbia University. Mice were maintained under appropriate barrier conditions in a 12-hour light-dark cycle and received food and water ad libitum. Mice were anesthetized by isofluorane inhalation.
Bone marrow cell cultures
Bone marrow cells (BMC) were extracted from mouse femurs that were aseptically removed, and adherent soft tissue was dissected away. Bone ends were cut off with razor blades, and the marrow cavity was flushed with α-MEM. The BMC were collected and plated in 6-well plates at a density of 4 × 10⁶ cells/well in 10% FBS plus 1% penicillin/streptomycin α-MEM (ATCC) supplemented with 50 ng/mL macrophage colony-stimulating factor (MCSF) (PeproTech) and 20 ng/mL RANKL. Cells were cultured for 5 days, and the medium was replenished on day 2 and day 4. On day 5, cells were fixed and stained for TRAP.
Animals’ fatty-acid (FA)-enriched diet to induce weight gain
Four-week old male C57BL/6 mice were randomly divided into groups (n = 9/group) and put on either PA- or OA-enriched diet (Research Diets Inc., New Brunswick, NJ, USA) or normal chow diet for 3 months. The high caloric FA-enriched diets contained an increased amount of FA (20% of calories from fatty acids, whereas chow contains a total of 10%) to induce weight gain (Supplemental Table S1). Animal weight was monitored once a week.
Analysis of osteoclast morphological and area of osteoclast resorption
Osteoclast cell area and resorption area were measured using ImageJ software (NIH, Bethesda, MD, USA). All TRAP + cells with at least 3 nuclei were considered osteoclasts.
RNA purification and gene expression analysis
Total RNA purification, cDNA generation, and quantitative real-time PCR were performed as previously described.(28) Incorporation of SYBR Green dye into the PCR products was monitored with an iCycler BioRad (Hercules, CA, USA) sequence detection system. Samples were normalized against 18 S. The sequences of the primers can be provided upon request.
Fatty acid and glucose oxidation assays
FA and glucose oxidation were measured in osteoclasts derived from RAW 264.7 cells after 5 days of treatment with RANKL and undifferentiated (day 1 post-RANKL stimulation) RAW 264.7 cells. Cells were cultured as described above. On day 1 and day 5, cells were harvested in PBS, incubated at 37°C for 2 hours in modified Krebs-Ringer buffer (MKR) (115 mm NaCl, 2.6 mm KCl, 1.2 mm KH2PO4, 10 mm NaHCO3, 10 mm HEPES [pH 7.4]) that contained 2% BSA, 0.2 mmol/mL palmitate, and 10 μCi/mL [9,10-3H]palmitate (PerkinElmer, Waltham, MA, USA) for assessment of FA oxidation or MKR that contained 0.2 mmol/mL glucose and 10 μCi/ml D-[3-3H]glucose (PerkinElmer) for assessment of glucose oxidation and were gassed with 95% O2 and 5% CO2. Then, water was extracted with chloroform: methanol (2:1) extraction. Palmitate or glucose oxidation was determined by measuring the amount of 3H2O in the aqueous phase.
Analysis of osteoclast resorptive activity
Cells were cultured in the presence of 0.2 mM PA or 0.2 mM OA or 0.2 mM PA + 0.2 mM OA on dentine discs (Immunodiagnostic Systems Inc., Scottsdale, AZ, USA) for 5 days. Resorption lacunae were scanned using electron microscopy.
Cellular neutral lipid staining
Intracellular neutral lipids were stained with Oil Red O, as described previously.(29)
Construction of recombinant adenovirus expressing human DGAT1
The plasmid that contained the cDNA of human DGAT1 (pOTB7-hDgat1, accession number BC023565) was purchased by Open Biosystems, Inc. (Pittsburgh, PA, USA). The hDGAT1 cDNA was extracted by partial digestion with XhoI and EcoRI restriction enzymes and subcloned into the same restriction sites of the pcDNA3.1 vector. The hDGAT1 cDNA was subsequently excised from the pcDNA 3.1 vector with HindIII and XbaI digestion and cloned in corresponding sites of the pAdTrackCMV vector. The recombinant adenoviruses were constructed as previously described(30) using the Ad-Easy-1 system. Usually, titers of 0.5 to 2 × 10¹⁰ plaque-forming units (pfu)/mL were obtained.
Infection of cells with recombinant adenoviruses
RAW 264.7 cells were grown in DMEM containing 10% FBS and 1% penicillin/streptomycin for 2 days. Cells were infected with Ad-DGAT1 or control adenovirus-expressing GFP (Ad-GFP) at a 250 multiplicity of infection (MOI) in DMEM supplemented with 2% heat-inactivated horse serum and 1% penicillin/streptomycin. Eight hours post-infection, the medium was removed and fresh 10% FBS-containing medium was added.
ELISA
Serum levels of proteins were determined using ELISA, according to the manufacturers’ recommendations (n = 5 to 7/group; R&D Systems [Minneapolis, MN, USA], Abcam [Cambridge, UK], MyBioSource [San Diego, CA, USA]).
Bone densitometry
BMD was measured using dual-energy X-ray absorptiometry (DXA) on a Lunar PIXImus (GE Lunar, Madison, WI, USA) X-ray densitometer for small animals using Lunar PIXIMUS2 version 2.10 software. The mice (n = 7 to 8) were scanned at 10 mm/s with a resolution of 0.5 mm × 0.5 mm. BMD was determined in a window that excluded the head area.
Micro-CT analysis
Scans were performed starting from the fused growth plate with a scan length of 3 mm back to the diaphysis direction in the distal and the midshaft of femurs (n = 6 to 8/group) with a scanning length of 1 mm using a micro-computed tomography system (vivaCT 40, Scanco Medical, Bassersdorf, Switzerland). The scans were performed using 21-μm resolution at 55 KV exciting voltage and 200 ms integration time. The total scan time for each sample was 15 minutes for distal femur scan and 5 minutes for midshaft scan. With a manually defined volume of interest (VOI), the following three-dimensional structural parameters were analyzed with the analyses script built in micro-CT machine: bone volume fraction (BV/TV, %), trabecular number (Tb.N, 1/mm), trabecular thickness (Tb.Th, mm), trabecular separation (Tb.Sp, mm), bone surface to bone volume ratio (BS/BV, 1/mm), and bone mineral density (BMD, mg HA/ccm).
Histomorphometric analysis
Femurs (n = 5/group) were isolated and fixed in 4% paraformal-dehyde at 4°C. Afterward, they were decalcified in 15% EDTA and dehydrated in progressive concentrations of ethanol, cleared in xylene, and embedded in paraffin. Five-micromolar sections were cut and stained for TRAP and counterstained with hematoxylin. Measurements were taken 150 μm distal from the growth plate and 150 μm away from cortical bone using Bioquant Osteo 2012 (Nashville, TN, USA). Measurements included percent trabecular bone volume (BV/TV), number of osteoclasts per bone surface (N.OC/BS), osteoblast surface (ObS), and percent osteoclast surface (OcS/BS).(31)
Statistical analysis
Comparisons between groups were performed using GraphPad (La Jolla, CA, USA) InStat 3 statistical software. Data from more than two groups were analyzed by one-way ANOVA. Comparisons between two groups were performed using unpaired two-tailed Student’s t tests. All values are presented as means ± SE. Differences between groups were considered statistically significant at p < 0.05.
Results
Osteoclastogenesis is associated with increased fatty acid oxidation
To investigate the impact of FAs on osteoclast differentiation, we used macrophage-derived RAW 264.7 cells, which we differentiated into mature osteoclasts by stimulating them with RANKL, as described previously.(2,32) Treatment of RAW 264.7 cells with RANKL for 5 days converted macrophages from small, round, mononuclear cells into large multinucleated osteoclasts that stain positive for TRAP (Fig. 1A). Palmitate oxidation was increased in osteoclasts (day 5 post-stimulation) by 45% compared with undifferentiated cells (day 1 post-stimulation) (Fig. 1B). Accordingly, expression of FA catabolism genes was increased in osteoclasts. Particularly, we found a fivefold increase in peroxisome proliferator-activated receptor g coactivator (PGC) 1β expression (Fig. 1C), which regulates mitochondrial functional capacity and cellular energy metabolism,(33,34) whereas PGC1α mRNA was not detected in this system. The mRNA levels of carnitine palmitoyl-transferase (CPT) 1α, an enzyme that mediates a rate limiting step in β-oxidation,(35–37) was increased threefold in osteoclasts (Fig. 1C). Furthermore, we found a threefold increase in the expression of CD36 (Fig. 1C), which is a scavenger receptor that mediates the uptake of long-chain FAs (LCFA) and oxidized low-density lipoproteins.(38) Moreover, there was a 3.9-fold increase in glucose oxidation of RANKL-stimulated osteoclasts compared with undifferentiated cells (Supplemental Fig. S1), as shown previously.(39–41) Accordingly, differentiation of primary BMC to osteoclasts with RANKL/MCSF also increased fatty acid oxidation markers, such as fatty acyl-CoA oxidase (AOX, fivefold), Cpt-1α (40%), and PGC-1β (15-fold) (Supplemental Fig. S2A). Thus, RANKL-mediated osteoclastogenesis is associated with increased FA and glucose utilization.
Fig. 1.
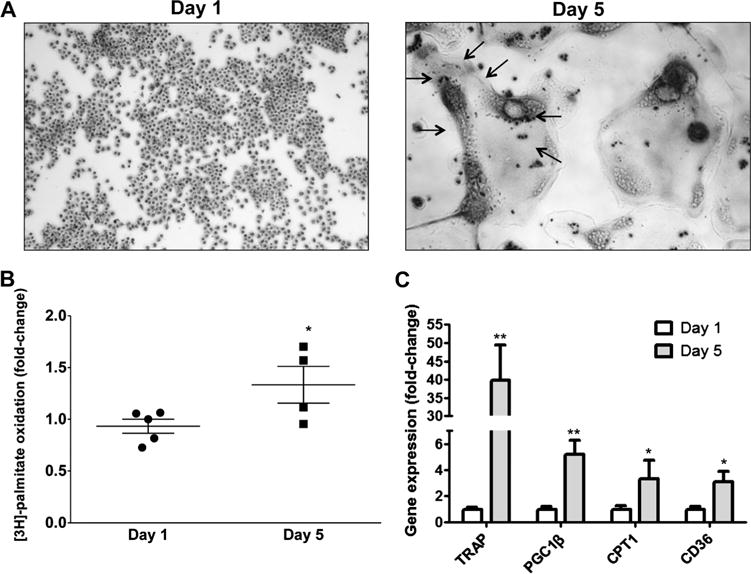
Osteoclasts are associated with increased levels of fatty acid oxidation. (A) TRAP staining of RAW 246.7 cells 1 day (macrophages) and 5 days (osteoclasts indicated by arrows) post-stimulation with RANKL. (B) [3H]-palmitate oxidation in osteoclasts compared with undifferentiated cells; *p < 0.05, n = 4 to 5. (C) RT-PCR analysis for TRAP, PGC1β, CPT1α, and CD36 mRNAs; *p < 0.05, **p < 0.01, n = 5 to 8.
Treatment of cells with PA but not OA enhances osteoclastogenesis
To further investigate the role of FAs in osteoclastogenesis, we differentiated RAW 264.7 cells into osteoclasts using RANKL in the presence of either 0.2 mM PA, or 0.2 mM OA, the two most abundant dietary FAs in the Western diet and in serum.(42) Combined treatment with RANKL and PA led to the formation of large multinucleated osteoclasts with intense TRAP staining, whereas treatment with RANKL and OA resulted in smaller osteoclasts similar in size to the control cells treated with RANKL only (Fig. 2Aa, 2Ab, and Supplemental Fig. S3). Moreover, PA-treated cultures had more osteoclastic resorption compared with control cells (Fig. 2Ba, 2Bb). Our morphological findings were consistent with TRAP mRNA levels, which increased ~sevenfold in the PA-treated cells compared with control cells that were treated with RANKL only, whereas they remained unchanged in the OA-treated cells (Fig. 2C). PA induced a more profound increase (52-fold) in the gene expression levels of the dendritic cell-specific transmembrane protein (DC-STAMP) (Fig. 2C), an osteoclast precursor fusion marker, the osteoclast stimulatory transmembrane protein (OC-STAMP; 21-fold) (Fig. 2C), an osteoclast differentiation marker, and a vacuolar (V-) ATPase proton pump (Atp6v0d2; 14-fold) (Fig. 2C), which carries out an extracellular acidification function that is crucial for bone resorption. PA also increased gene expression levels of FA utilization markers, such as PGC1β (eightfold) (Fig. 2C) and CPT1α (50-fold) (Fig. 2D) compared with cells stimulated with RANKL only. Treatment of primary BMC with RANKL/MCSF and PA reproduced the increase in PGC1β expression levels, although to a less pronounced extent (40%), compared with cells treated with RANKL/MCSF only (Supplemental Fig. S2B). CPT1α was not further increased by PA treatment, but the increased levels of AOX (twofold) indicate increased fatty acid oxidation levels compared with cells treated with RANKL/MCSF only (Supplemental Fig. S2B). OA treatment increased CPT1α expression (20-fold) but did not affect PGC1β compared with cells stimulated with RANKL only (Fig. 2C). Thus, PA, but not OA, leads to enhanced osteoclastogenesis.
Fig. 2.
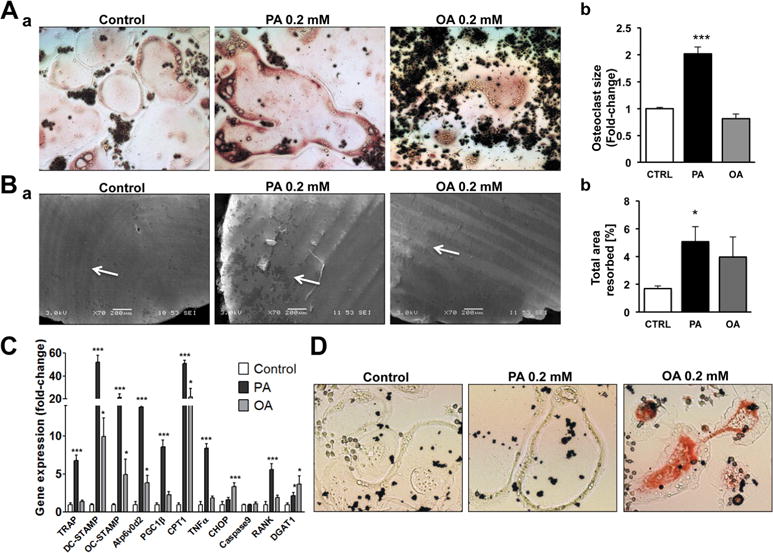
PA enhances osteoclastogenesis. (A) a) TRAP staining in osteoclasts (5 days post- stimulation with RANKL) treated with PA or OA. b) Average size of osteoclasts treated with PA or OA. Average size was calculated from measurement of 233 osteoclasts in control treatment, 202 osteoclasts in PA-treated cultures, and 160 osteoclasts in OA-treated cultures; ***p < 0.001. (B) a) Analysis of osteoclastic resorption using scanning electron microscopy. Cells were cultured in the presence of PA or OA on dentin discs. b) Resorbed area in cultures treated with PA or OA versus CTRL; PA versus CTRL; *p < 0.05, n = 7 to 10. (C) RT-PCR for TRAP, DC-STAMP, OC-STAMP, Atp6v0d2, PGC1β, CPT1, TNFα, CHOP, Caspase9, RANK, and DGAT1 mRNAs; *p < 0.05, ***p < 0.001, n = 4 to 6. D. Neutral lipid staining with Oil-Red-O in osteoclasts treated with PA or OA.
PA enhances osteoclastogenesis by upregulating TNFα and RANK expression, whereas OA increases triglyceride formation in osteoclasts
To investigate the mechanisms by which PA enhances osteoclastogenesis, we analyzed gene expression of markers for endoplasmic reticulum (ER) stress,(43) apoptosis,(44) and inflammation(45) that are linked with PA-mediated lipotoxicity. Osteoclast precursor cells were cultured in the presence of RANKL and either 0.2 mM PA or 0.2 mM OA. PA did not change the expression of CHOP, an ER stress marker, or caspase 9, an apoptosis marker (Fig. 2C). However, TNFα mRNA increased eightfold in PA-treated cultures but not in OA-treated cells compared with cells stimulated with RANKL only (Fig. 2C). OA led to a threefold increase in CHOP expression (Fig. 2C) compared with cells stimulated with RANKL only.
We next investigated whether increased osteoclastogenesis in PA-treated RAW 264.7 cultures could be the result of a change in RANKL/RANK expression. RANK expression was increased (fivefold) in PA-treated cultures but not in OA-treated cells (Fig. 2C). This suggests that PA-treated osteoclasts may be more susceptible to exogenous RANKL stimulation. Accordingly, primary BMC that were treated with RANKL/MCSF and PA had increased RANK expression levels (60%) compared with cells treated with RANKL/MCSF only (Supplemental Fig. S2B). As anticipated, RANKL mRNA was not detected in control as well as in PA and OA cultures of RAW 264.7 cells. Thus, PA increased TNFα and RANK expression, which both can enhance the differentiation of precursor cells into osteoclasts.
OA increases triglyceride formation in various cell culture models.(28,46,47) As shown by Oil-Red-O staining, triglyceride levels were increased in osteoclasts treated with RANKL and OA, which did not occur in the cells treated with RANKL and PA or in control RANKL-treated cells (Fig. 2D). Accordingly, gene expression of DGAT1, which catalyzes triglyceride synthesis,(48) was increased 3.7-fold in the OA-stimulated cells. PA treatment also increased DGAT1 mRNA levels, but this increase was lower (twofold) (Fig. 2C). Taken together, PA increases osteoclastogenesis and upregulates TNFα, which do not occur in OA-treated cultures that have increased triglyceride formation.
Combined PA and OA treatment attenuates PA-induced osteoclastogenesis
Combined treatment with PA and OA alleviates lipotoxicity of PA in various cell culture models.(49–51) Accordingly, we observed that combined PA and OA treatment in the presence of RANKL ameliorated the impact of PA and produced osteoclasts that were similar in number and size to RANKL only–treated control cells (Fig. 3A, B, and Supplemental Fig. S4). Additionally, combined PA and OA treatment reduced TRAP (Fig. 3C), PGC1β (Fig. 3C), TNFα (Fig. 3C), and RANK (Fig. 3C) mRNA levels compared with PA-treated cells. Furthermore, analysis of BMC isolated from C57BL/6 mice and cultured with RANKL/MCSF and combination of PA and OA showed a trend toward lower osteoclastic activity compared with PA-treated cells (Supplemental Fig. S5).
Fig. 3.
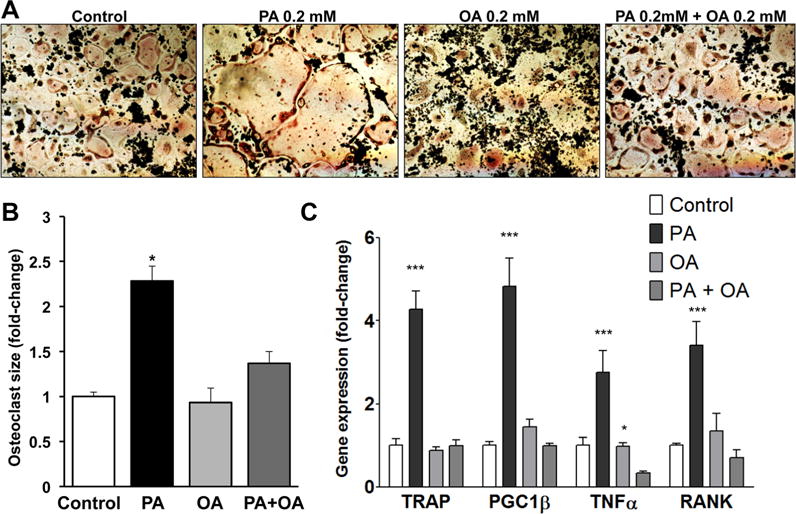
Combined treatment with PA and OA inhibits PA-enhanced osteoclastogenesis. (A) TRAP staining in osteoclasts (5 days post-stimulation with RANKL) treated with PA, OA, or PA and OA. (B) Average size of osteoclasts treated with PA, OA, or PA and OA. Average size was calculated from measurement of 173 osteoclasts in control treatment, 108 osteoclasts in PA-treated cultures, 109 osteoclasts in OA-treated cultures, and 133 osteoclasts in cultures treated with combination of PA and OA; *p < 0.05. (C) RT-PCR analysis for TRAP, PGC1β, TNFα, and RANK mRNAs; *p < 0.05, ***p < 0.001, n = 4 to 9.
PA induces osteoclastogenesis in the absence of RANKL
We then investigated whether PA can stimulate osteoclast differentiation even in the absence of RANKL because TNFα has been shown to induce osteoclastogenesis independent of the RANKL pathway.(4–8) Stimulation of RAW 264.7 cells with PA alone for 5 days in the absence of RANKL resulted in formation of large osteoclasts (Fig. 4Aa, b). However, cells in the control and OA cultures did not differentiate well (Fig. 4Aa, b, and Supplemental Fig. S6). Accordingly, PA increased TRAP (twofold) and TNFα (2.5-fold) mRNA levels (Fig. 4B). Of note, the degree of PA-mediated osteoclastogenesis in the absence of RANKL was lower compared with RANKL-stimulated osteoclast formation. Osteoclasts that formed in PA-treated cultures in the absence of RANKL were smaller in size and number with a less profound increase in TRAP expression during differentiation compared with osteoclasts that formed upon RANKL stimulation. Next, we observed that addition of OA to the PA cultures, which is known to attenuate the impact of PA in other cell culture models,(49–51) also blocked PA-induced enlargement of osteoclasts (Fig. 4Aa, b), TRAP, and TNFα gene expression levels (Fig. 4B).
Fig. 4.
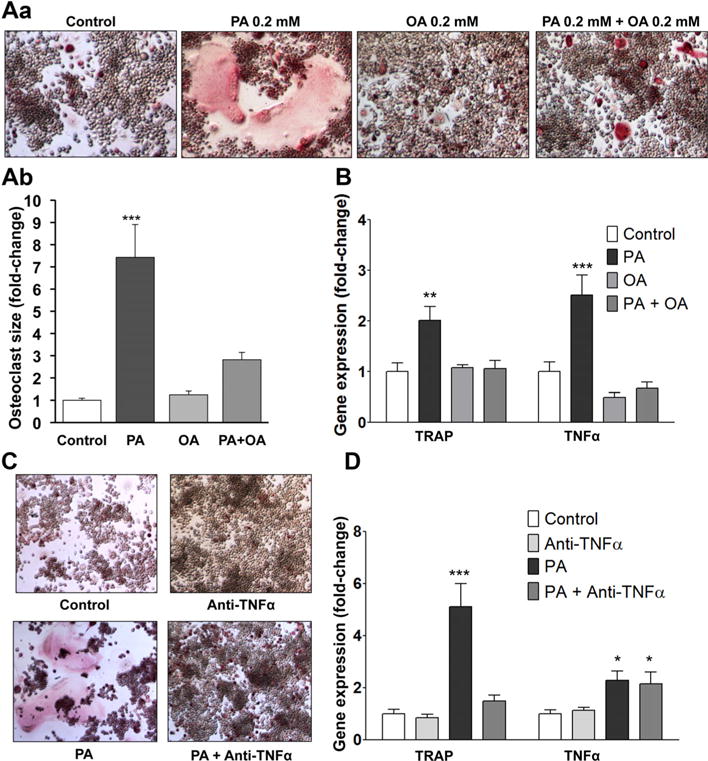
PA induces osteoclastogenesis in the absence of RANKL via increased TNFα expression, whereas combined treatment with PA and OA inhibits this effect. (A) a) TRAP staining for osteoclasts in RAW 264.7 cells after 5 days of treatment with PA, OA, or PA and OA. b) Average size of osteoclasts treated with PA, OA, or PA and OA. Average size was calculated from measurement of 173 osteoclasts in control treatment, 108 osteoclasts in PA-treated cultures, 109 osteoclasts in OA-treated cultures, and 133 osteoclasts in cultures treated with combination of PA and OA. (B) RT-PCR analysis for TRAP and TNFα mRNAs; **p < 0.01, ***p < 0.001, n = 4 to 9. (C) TRAP staining for osteoclasts in RAW 264.7 cells treated for 5 days with PA, anti-TNFα antibody, or PA and anti-TNFa antibody. (D) RT-PCR analysis for TRAP and TNFα mRNAs. *p < 0.05, ***p < 0.001, n = 3–9.
TNFα is the major mediator of PA-induced osteoclastogenesis
To address whether TNFα mediates PA-induced osteoclastogenesis, we treated RAW 264.7 cells with PA and a neutralizing anti-TNFα antibody (10 μg/mL) for 5 days. Anti-TNFα antibody inhibited PA-induced osteoclast formation (Fig. 4C) and prevented the increase in TRAP mRNA, but it did not affect TNFα gene expression levels (Fig. 4D).
PA-induced osteoclastogenesis is inhibited by adenovirus-mediated expression of DGAT1
OA increased DGAT1 expression and led to triglyceride accumulation in osteoclasts (Fig. 2C). This finding, combined with the fact that OA did not enhance osteoclastogenesis (Fig. 2A, B) and inhibited PA-induced formation of osteoclasts (Fig. 3A–C, Fig. 4A, B), prompted us to investigate whether triglyceride formation may protect from increased osteoclastogenesis. To address this hypothesis, we generated a recombinant adenovirus that contains a single plasmid that expresses independently both GFP and DGAT1, which catalyzes TG formation(52) (Fig. 5A) driven by separate CMV promoters (Ad-DGAT1). RAW 264.7 cells were infected with the Ad-DGAT1 (MOI: 250) or control Ad-GFP and were treated with PA to induce osteoclastogenesis. DGAT1 overexpression enhanced triglyceride formation in both control and PA-treated cells, as shown by Oil-Red-O staining (Fig. 5B), inhibited PA-induced osteoclastogenesis (Fig. 5B, C), and decreased TRAP and TNFα mRNA compared with cells treated with Ad-GFP and PA (Fig. 5D). RAW 264.7 cells exhibit relatively low infectivity by adenoviruses. Therefore, a number of cells remained uninfected by the Ad-DGAT1, as shown by lack of GFP expression. Notably, osteoclasts, which formed in cultures treated with Ad-DGAT1 and PA, were consistently non-GFP-expressing cells (Supplemental Fig. S7), ie, cells that did not overexpress DGAT1. This emphasizes the importance of DGAT1 expression in the prevention of PA-mediated differentiation of cells into osteoclasts. In contrast, cultures treated with PA and control Ad-GFP had fully mature GFP-expressing osteoclasts (Fig. 5C), confirming that GFP overexpression did not inhibit cell fusion and osteoclast differentiation. Taken together, adenovirus-mediated DGAT1 expression inhibits PA-induced formation of osteoclasts.
Fig. 5.
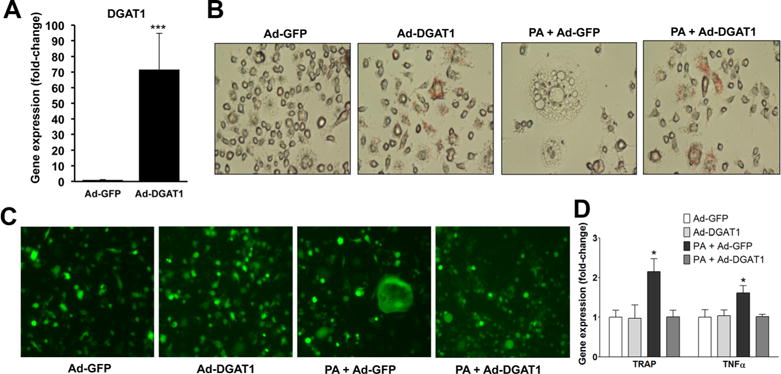
DGAT1 inhibits PA-induced osteoclastogenesis. (A) RT-PCR analysis for DGAT1 mRNA; ***p < 0.001, n = 6. (B, C) Neutral lipid staining with Oil-Red-O (B) and GFP fluorescence (C) in RAW 264.7 cells after 5 days of treatment with PA and Ad-GFP, or Ad-DGAT1 (MOI: 250). (D) RT-PCR analysis for TRAP and TNFα mRNAs; *p < 0.05, ***p < 0.001, n = 4 to 6.
DGAT1 gene deletion enhances osteoclastogenesis
Because DGAT1 inhibits PA-induced osteoclastogenesis, we hypothesized that DGAT1 deficiency would lead to increased osteoclastogenesis. To address this hypothesis, we isolated bone marrow cells from DGAT1 knockout mice (Dgat1−/−) and WT controls and stimulated them with MCSF and RANKL. BMC from Dgat1−/− mice that were stimulated with MCSF and RANKL produced larger multinucleated osteoclasts in comparison to osteoclasts from DGAT1-expressing mice (Fig. 6Aa, b, and Supplemental Fig. S8). Accordingly, TRAP and TNFα mRNA levels were increased by 30% and 50%, respectively, in Dgat1−/− derived osteoclasts (Fig. 6Ac). OC-STAMP mRNA levels of RANKL-treated Dgat1−/− cells were increased by 30% compared with WT control cells (CTRL: 1 ± 0.08, Dgat1−/−: 1.3 ± 0.1; p < 0.05). DC-STAMP (CTRL: 1 ± 0.12, Dgat1−/−: 1.06 ± 0.12) and Atp6v0d2 (CTRL: 1 ± 0.2, Dgat1−/−: 0.6 ± 0.1) mRNA levels were not increased in Dgat1−/− osteoclasts. To address whether these changes in osteoclastogenesis are the result of systemic changes of TNFα or RANKL, we measured these cytokines in serum of Dgat1−/− and WT mice. We detected lower serum levels of TNFα and RANKL in Dgat1−/− compared with WT controls (ELISA: Dgat1−/− versus WT: TNFα pg/mL 4.7 ± 0.3 versus 8.1 8 ± 0.3*, RANKL pg/mL: 594 ± 0.65 versus 732 ± 2.1*, *p < 0.0001, n = 6 to 7), indicating that the observed phenotype was not because of systemic inflammatory changes.
Fig. 6.
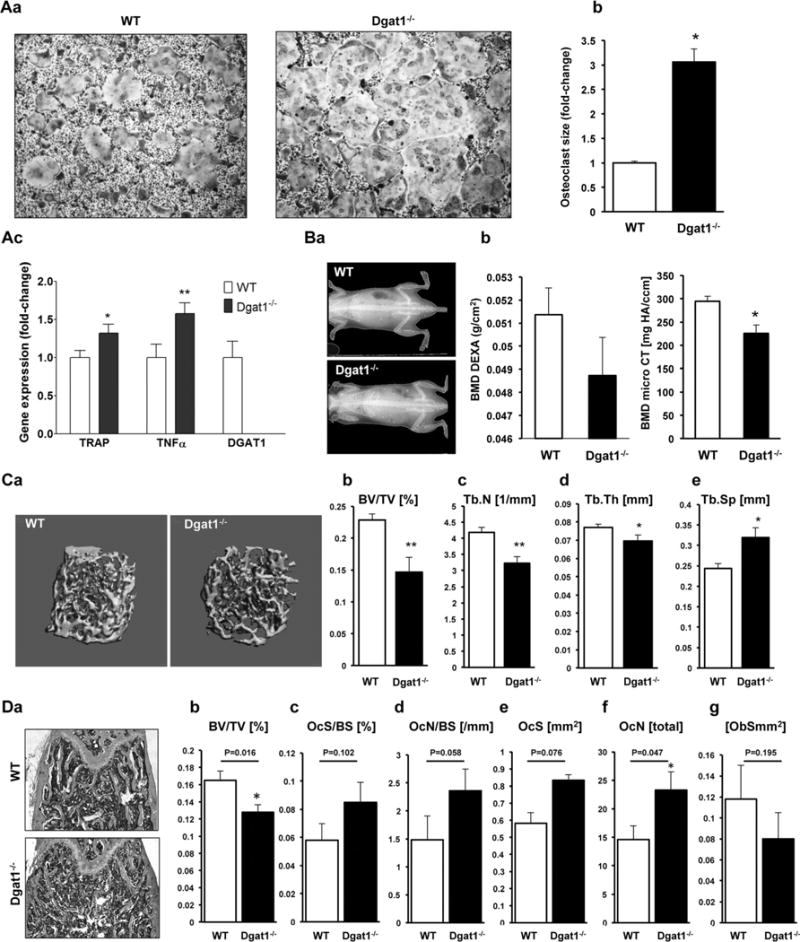
Osteoclastogenesis is increased and femoral bone volume is decreased in Dgat1−/− mice. (A) a) TRAP staining; b) average size of osteoclasts (*p < 0.05; average osteoclast size was calculated from measurement of 311 WT osteoclasts and 267 Dgat1−/− osteoclasts); and c) RT-PCR analysis for TRAP, TNFα, and DGAT1 mRNAs derived from bone marrow cells from 20-week-old Dgat1−/− mice and WT mice; *p < 0.05, **p < 0.01, n=6 to 9. (B) a) DXA scans of 12-week-old Dgat1−/− and WT mice. b, c) BMD of Dgat1−/− and WT mice measured from DXA scan (b, n = 7 to 8) and micro-CT (c, femur trabecular bone, n = 6 to 7, *p < 0.01). (C) a) 3D reconstruction of femoral trabecular bone in 12-week-old Dgat1−/− and WT mice. b–e) Morphometric indices calculated from micro-CT analysis of femurs in 12-week-old Dgat1−/− and WT mice, BV/TV (b), Tb.N (c), Tb.Th (d), and Tb.Sp (e). *p < 0.05, **p < 0.01, ***p < 0.001, n = 6 to 8. (D) Histomorphometric analysis. a) Longitudinal histological sections of femurs of Dgat1−/− and WT mice. b–g) Morphometric indices calculated from histomorphometric analysis of femurs derived from 12-week-old Dgat1−/− and wild-type mice. BV/TV (b), OcS/BS (c), OcN/BS (d), OCS (e), OCN (f), ObS (g). *p < 0.05, n = 5.
Bone quality is compromised in Dgat1-deficient mice
Using micro-CT and DXA, we analyzed bone mineral density (BMD) of Dgat1−/− mice and littermate controls (Fig. 6Ba, b). BMD measured in femur trabecular bone was significantly lower in Dgat1−/− mice, as shown in Fig. 6Bb. Dgat1−/− mice had a trend toward lower whole body BMD compared with WT controls. Three-dimensional reconstruction of trabecular bone with CT revealed reduced bone microarchitecture in the femurs of Dgat1−/− mice compared with littermate controls (Fig. 6C). The calculated morphometric indices of bone volume fraction (BV/TV), trabecular number (Tb.N), and trabecular thickness (Tb.Th) were reduced by 36% (Fig. 6Cb), 23% (Fig. 6Cc), and 10% (Fig. 6Cd), respectively, whereas trabecular spacing (Tb.Sp) was increased by 30% (Fig. 6Ce). Histomorphometric analysis showed that BV/TV (Fig. 6Db) was decreased (24%) and osteoclast number (OcN) (Fig. 6Df) was increased by 65% in Dgat1−/− mice compared with controls. In addition, osteoclast surface (OcS) (Fig. 6De), osteoclast surface per bone surface (OcS/BS) (Fig. 6Dc), and osteoclast number per bone surface (OcN/BS) (Fig. 6Dd) were marginally increased. However, these were only trends that did not reach statistical significance. Furthermore, bone formation marker serum type 1 procollagen N-terminal (P1NP) was lower in Dgat1−/− mice compared with WT controls (ELISA P1NP ng/μL: 228.41 ± 2.32 versus 482.71 ± 2.41, *p < 0.0001, n = 5/group) and osteoblast surface ObS was slightly, however, nonsignificantly decreased (Fig. 6Dg). Taken together, our experiments demonstrate that Dgat1-deficient mice have abnormal bone architecture and increased levels of osteoclast differentiation.
PA-enriched high-fat diet results in increased reduction of bone mass and loss of bone microarchitecture in overweight mice
We then investigated whether the FA profile of a high-fat diet can modulate bone microarchitecture during weight gain. C57BL/6 mice were fed isocaloric high-fat diets enriched in either OA or PA. After 12 weeks, all animals on FA-enriched diets weighed significantly more compared with animals on a normal caloric standard chow diet (31.7 ± 1.5 versus 41 ± 1.2*, 39.3 ± 1.0*, *p < 0.05) and lost bone over time (Fig. 7). However, the amount of bone loss was significantly greater in animals that were on a PA-enriched diet versus OA-enriched diet. PA-fed animals had lower BV/TV (Fig. 7Ba), BMD (Fig. 7Bb), and TbN (Fig. 7Bd) and higher TbSp (Fig. 7Bc) compared with OA-fed animals. These findings indicate that the FA profile of the diet rather than weight gain and obesity alone compromises bone density.
Fig. 7.
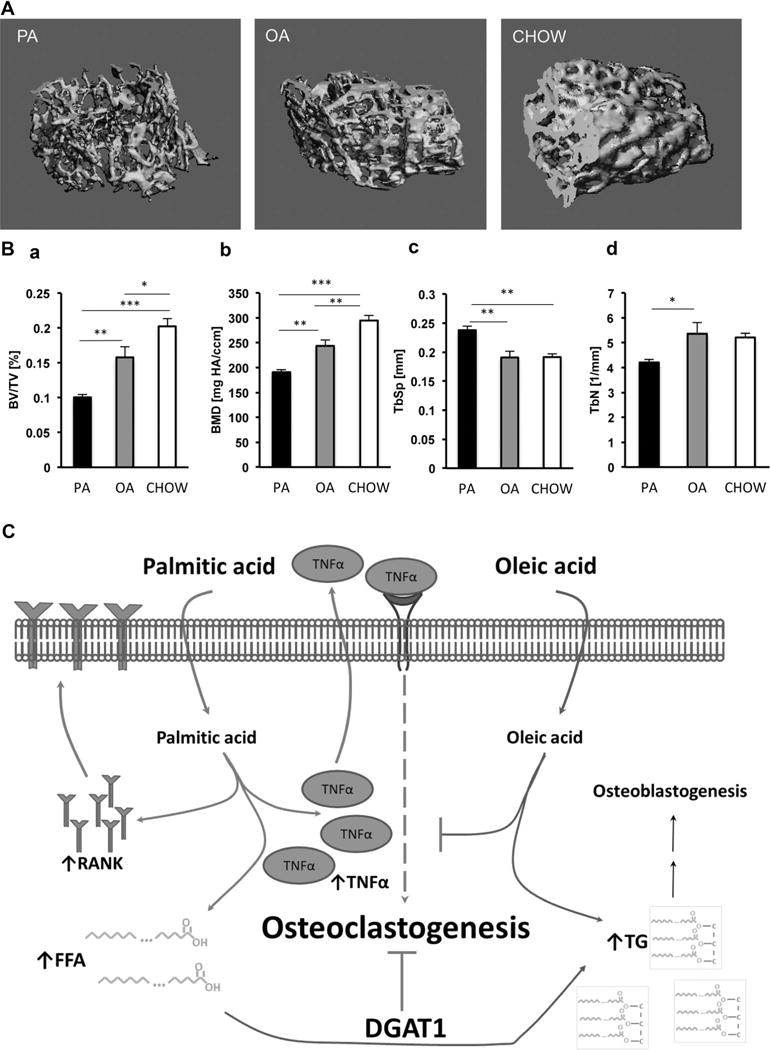
Mice on a PA-enriched high-fat diet lose more bone than mice on an OA-enriched diet. (A) Micro-CT analysis: 3D reconstruction of femoral trabecular bone from mice after being on a high-fat diet for 12 weeks. (B) a–d) Morphometric indices calculated from micro-CT analysis of femurs BV/TV (a), BMD (b), Tb.Sp (c), and Tb.Th (d); n = 9 (PA-, OA-HFD), n = 5 (NFD), *p < 0.05, **p < 0.01, ***p < 0.001. (C) Proposed pathway of how excess levels of PA and OA influence osteoclastogenesis. PA increases TNFα and RANK gene expression. Increased RANK renders cells more susceptible to exogenous RANKL stimulation and subsequent osteoclast differentiation. Increase in TNFα ignites osteoclastogenesis even by itself. OA supplementation or DGAT1 overexpression attenuates PA-mediated osteoclastogenesis by promoting triglyceride formation, which may also have an indirect effect on osteoblastogenesis.
Discussion
Bone health may be compromised by metabolic abnormalities, such as increased fat mass,(19,22–24) elevated blood glucose,(53) and lipid levels.(20,54) Our study focused on the impact of PA and OA, the most abundant saturated and monounsaturated FAs in the Western diet and in serum,(42) on osteoclastogenesis. The FA concentrations used for this study correspond to a molecular ratio of PA/OA:BSA = 1.32, which is a typical ratio found in obesity and hypertriglyceridemia.(49–52,55–57) We propose that PA induces a proinflammatory response via TNFα that increases osteoclastogenesis. Excess OA, on the other hand, inhibits a proinflammatory response by fostering neutral triglyceride formation. Many studies have demonstrated that PA promotes inflammation in several organs, as opposed to OA, which has anti-inflammatory properties.(58–61) Given the contribution of inflammation to bone degradation(6,7,9,11) and impaired bone formation,(62,63) the pro-inflammatory nature of PA may account for its aggravating impact on bone health by either promoting osteoclast or inhibiting osteoblast formation. PA increased expression of RANK, which may make cells more prone to RANKL stimulation. We also show that lack of DGAT1, which catalyzes the formation of TG, reduces bone mass indices and enhances formation of osteoclasts. Furthermore, we found significantly lower bone structure indices in mice that were on a PA-enriched diet compared with mice on an OA-enriched diet. Previous studies had shown an inverse correlation between weight gain-initiated fat mass accumulation and bone mass, mainly attributed to an increase in osteoclastogenesis and osteoclastic activity.(64,65) Thus, we propose that saturated FAs mediate a lipotoxic effect on the skeleton, via enhancement of osteoclast formation.
Several studies have shown that PA is more toxic than OA(28,46,47,66–68) because of the accumulation of toxic lipids, such as ceramide and diacylglycerol, and the induction of ER stress,(43) apoptosis,(44) or inflammation.(45) However, treatment of RAW 264.7 cells with ceramide,(69) as well as treatment of rat osteoclasts with diacylglycerol,(70) inhibits RANKL-mediated osteoclastogenesis and bone resorption. We show that PA directly increased TNFα mRNA but not markers of ER stress or apoptosis in osteoclasts. Earlier studies showed that TNFα suffices to induce osteoclastogenesis independently of the RANKL-RANK interaction.(6–10) In our study, administration of a neutralizing anti-TNFα antibody to PA-treated cells blocked PA-driven osteoclast formation. A previous study had suggested that combined treatment of RAW 264.7 cells with saturated FAs and differentiation factors inhibits osteoclastogenesis.(26) However, the authors had measured only absolute number of osteoclasts per culture regardless of size and multinuclearity of the cells. Consistent with this study,(26) our data show that because osteoclasts in cultures treated with PA and RANKL are bigger and occupy a larger space; actual cell number is smaller for the given area (Supplemental Figs. S3, S4, and S6). Similarly, another study showed that treatment of BMCs with saturated FAs, such as lauric acid or PA, enhanced osteoclast survival.(27)
OA is more efficiently converted to TG and does not cause a pro-inflammatory response the way PA does.(28,46,47) Consistently, treatment of RANKL-stimulated cells with OA increased triglyceride (TG) formation and did not enhance osteoclastogenesis, nor did it modulate RANK and TNFα gene expression. On the other hand, OA increased CHOP gene expression, an ER stress marker. This finding is consistent with previous studies showing association of prolonged OA treatment with ER stress(71) and indicates that ER stress may not enhance osteoclast formation. The benefit of OA in preventing lipotoxicity has been demonstrated with combined PA and OA cell treatment.(28,46,47) Similarly, combined treatment of RANKL-stimulated RAW 264.7 cells with PA and OA inhibited PA-induced enhancement of osteoclastogenesis and reduced RANK and TNFα gene expression. Thus, OA may prevent PA-induced osteoclastogenesis.
We also demonstrated that prevention of PA-induced osteoclastogenesis by OA may be attributed to the enhanced formation of TG as shown by adenovirus-mediated expression of DGAT1, the enzyme that catalyzes TG formation,(48) in PA-treated cells. This treatment increased TG, reduced TNFα mRNA, and inhibited PA-induced osteoclastogenesis. Consistent with the beneficial effect of DGAT1 in the inhibition of osteoclastogenesis, Dgat1−/− mice have decreased BMD and bone mass and increased RANKL-mediated differentiation of BMC to osteoclasts. Thus, DGAT1 may protect from osteoclastogenesis.
The association of saturated FAs with increased osteoclastogenesis links metabolic abnormalities, such as increased fat mass, diabetes, and dyslipidemia, with compromised bone health. Currently the relationship between obesity and bone mass is controversial. Although epidemiologic data show protection from bone loss in obesity,(72–76) patients with metabolic syndrome and diabetes mellitus have increased bone loss and fracture risk,(77–79) as well as reduced fracture healing because of increased osteoclastogenesis.(80,81) Increased bone mass in individuals with greater body mass may represent an indirect adaptive mechanism for greater load.(82) However, although increased body weight appears to prevent bone loss, increase in total body fat may be a risk factor for bone health.(83) Thus, the positive effects of increased body mass should be separated from effects of increased fat mass and the coexistence of metabolic derangements affecting bone turnover. Animal and human data for young(16–18,84) and adult individuals(19–25) reveal poor bone health and increased fracture risk with increased fat mass. Our data from high-fat-fed mice demonstrate that fat source determines the amount of bone loss in mice. However, obesity is a complex metabolic abnormality that includes multiple deregulations such as modulations in hormones and adipokines that may compromise bone remodeling. Therefore, additional effects of obesity on bone health may not be excluded. Future studies might also investigate whether the detected impact of excess PA and OA levels is specific to the complexity of a high-fat diet or can also be found in a normal caloric diet. Furthermore, several methodological limitations required that some of our in vitro experiments were performed only in RAW264.7-derived cultures. These results will ultimately need to be repeated in a primary cell model.
In conclusion, we show that saturated FAs can enhance RANKL-mediated osteoclast differentiation (Fig. 7) via upregulation of TNFα and RANK. Indirect effects of saturated FAs on bone formation may also not be excluded. Increased TG formation by OA supplementation or DGAT1 activation prevents PA-driven osteoclastogenesis, indicating potential therapeutic targets for increasing bone health.
Supplementary Material
Acknowledgments
This study was supported by an NIH T32 training grant (HL007343) (ZDT), K08DE018968-03 (USS), 5K23HL095742-03, P30 (PCS), HL45095, and 73029 (IJG). This work was also supported by AHA Postdoctoral Fellowship 10POST4440032 and NHLBI Pathway to Independence Award 1K99HL112853 (KD).
The authors thank Shuiqing Yu and Yunying Hu for technical assistance and Dr Panos Papapanou, Dr Stavroula Kousteni, and Dr Gerard Karsenty for editorial advice.
Authors’ roles: Study design: USS, KD, and PCS. Study conduct: ZDT and KD. Data collection: ZDT, KD, SG, YS, and SK. Data analysis: ZDT, KD, and USS. Data interpretation: ZDT, KD, USS, PCS, and IJG. Drafting manuscript: ZDT and KD. Revising manuscript content: ZDT, KD, TVD, IJG, PCS, and USS. Approving final version of manuscript: ZDT, KD, TVD, IJG, PCS, and USS. USS takes responsibility for the integrity of the data analysis.
Footnotes
Additional Supporting Information may be found in the online version of this article.
Disclosures
All authors state that they have no conflicts of interest.
References
- 1.Rodan GA, Martin TJ. Therapeutic approaches to bone diseases. Science. 2000;289(5484):1508–14. doi: 10.1126/science.289.5484.1508. [DOI] [PubMed] [Google Scholar]
- 2.Boyle WJ, Simonet WS, Lacey DL. Osteoclast differentiation and activation. Nature. 2003;423(6937):337–42. doi: 10.1038/nature01658. [DOI] [PubMed] [Google Scholar]
- 3.Xiong J, Onal M, Jilka RL, Weinstein RS, Manolagas SC, O’Brien CA. Matrix-embedded cells control osteoclast formation. Nat Med. 2011;17(10):1235–41. doi: 10.1038/nm.2448. [DOI] [PMC free article] [PubMed] [Google Scholar]
- 4.Nakashima T, Hayashi M, Fukunaga T, et al. Evidence for osteocyte regulation of bone homeostasis through RANKL expression. Nat Med. 2011;17(10):1231–4. doi: 10.1038/nm.2452. [DOI] [PubMed] [Google Scholar]
- 5.O’Brien CA. Control of RANKL gene expression. Bone. 2010;46(4):911–9. doi: 10.1016/j.bone.2009.08.050. [DOI] [PMC free article] [PubMed] [Google Scholar]
- 6.Kobayashi K, Takahashi N, Jimi E, et al. Tumor necrosis factor alpha stimulates osteoclast differentiation by a mechanism independent of the ODF/RANKL-RANK interaction. J Exp Med. 2000;191(2):275–86. doi: 10.1084/jem.191.2.275. [DOI] [PMC free article] [PubMed] [Google Scholar]
- 7.Azuma Y, Kaji K, Katogi R, Takeshita S, Kudo A. Tumor necrosis factor-alpha induces differentiation of and bone resorption by osteoclasts. J Biol Chem. 2000;275(7):4858–64. doi: 10.1074/jbc.275.7.4858. [DOI] [PubMed] [Google Scholar]
- 8.Fuller K, Murphy C, Kirstein B, Fox SW, Chambers TJ. TNFalpha potently activates osteoclasts, through a direct action independent of and strongly synergistic with RANKL. Endocrinology. 2002;143(3):1108–18. doi: 10.1210/endo.143.3.8701. [DOI] [PubMed] [Google Scholar]
- 9.Kim N, Kadono Y, Takami M, et al. Osteoclast differentiation independent of the TRANCE-RANK-TRAF6 axis. J Exp Med. 2005;202(5):589–95. doi: 10.1084/jem.20050978. [DOI] [PMC free article] [PubMed] [Google Scholar]
- 10.Kudo O, Fujikawa Y, Itonaga I, Sabokbar A, Torisu T, Athanasou NA. Proinflammatory cytokine (TNFalpha/IL-1alpha) induction of human osteoclast formation. J Pathol. 2002;198(2):220–7. doi: 10.1002/path.1190. [DOI] [PubMed] [Google Scholar]
- 11.Lam J, Takeshita S, Barker JE, Kanagawa O, Ross FP, Teitelbaum SL. TNF-alpha induces osteoclastogenesis by direct stimulation of macrophages exposed to permissive levels of RANK ligand. J Clin Invest. 2000;106(12):1481–8. doi: 10.1172/JCI11176. [DOI] [PMC free article] [PubMed] [Google Scholar]
- 12.Pacios S, Kang J, Galicia J, et al. Diabetes aggravates periodontitis by limiting repair through enhanced inflammation. FASEB J. 2012;26(4):1423–30. doi: 10.1096/fj.11-196279. [DOI] [PMC free article] [PubMed] [Google Scholar]
- 13.Alblowi J, Kayal RA, Siqueira M, et al. High levels of tumor necrosis factor-alpha contribute to accelerated loss of cartilage in diabetic fracture healing. Am J Pathol. 2009;175(4):1574–85. doi: 10.2353/ajpath.2009.090148. [DOI] [PMC free article] [PubMed] [Google Scholar]
- 14.Hannan MT, Felson DT, Anderson JJ. Bone mineral density in elderly men and women: results from the Framingham osteoporosis study. J Bone Miner Res. 1992;7(5):547–53. doi: 10.1002/jbmr.5650070511. [DOI] [PubMed] [Google Scholar]
- 15.Edelstein SL, Barrett-Connor E. Relation between body size and bone mineral density in elderly men and women. Am J Epidemiol. 1993;138(3):160–9. doi: 10.1093/oxfordjournals.aje.a116842. [DOI] [PubMed] [Google Scholar]
- 16.Mughal MZ, Khadilkar AV. The accrual of bone mass during childhood and puberty. Curr Opin Endocrinol Diabetes Obes. 2011;18(1):28–32. doi: 10.1097/MED.0b013e3283416441. [DOI] [PubMed] [Google Scholar]
- 17.Wosje KS, Khoury PR, Claytor RP, Copeland KA, Kalkwarf HJ, Daniels SR. Adiposity and TV viewing are related to less bone accrual in young children. J Pediatr. 2009;154(1):79–85e2. doi: 10.1016/j.jpeds.2008.06.031. [DOI] [PMC free article] [PubMed] [Google Scholar]
- 18.Pollock NK, Bernard PJ, Gutin B, Davis CL, Zhu H, Dong Y. Adolescent obesity, bone mass, and cardiometabolic risk factors. J Pediatr. 2011;158(5):727–34. doi: 10.1016/j.jpeds.2010.11.052. [DOI] [PMC free article] [PubMed] [Google Scholar]
- 19.Kim JH, Choi HJ, Kim MJ, Shin CS, Cho NH. Fat mass is negatively associated with bone mineral content in Koreans. Osteoporos Int. 2012;23(7):2009–16. doi: 10.1007/s00198-011-1808-6. [DOI] [PubMed] [Google Scholar]
- 20.Tintut Y, Morony S, Demer LL. Hyperlipidemia promotes osteoclastic potential of bone marrow cells ex vivo. Arterioscler Thromb Vasc Biol. 2004;24(2):e6–10. doi: 10.1161/01.ATV.0000112023.62695.7f. [DOI] [PubMed] [Google Scholar]
- 21.Greco EA, Fornari R, Rossi F, et al. Is obesity protective for osteoporosis? Evaluation of bone mineral density in individuals with high body mass index. Int J Clin Pract. 2010;64(6):817–20. doi: 10.1111/j.1742-1241.2009.02301.x. [DOI] [PubMed] [Google Scholar]
- 22.Fu X, Ma X, Lu H, He W, Wang Z, Zhu S. Associations of fat mass and fat distribution with bone mineral density in pre- and postmenopausal Chinese women. Osteoporos Int. 2011;22(1):113–9. doi: 10.1007/s00198-010-1210-9. [DOI] [PubMed] [Google Scholar]
- 23.Hsu YH, Venners SA, Terwedow HA, et al. Relation of body composition, fat mass, and serum lipids to osteoporotic fractures and bone mineral density in Chinese men and women. Am J Clin Nutr. 2006;83(1):146–54. doi: 10.1093/ajcn/83.1.146. [DOI] [PubMed] [Google Scholar]
- 24.Bhupathiraju SN, Dawson-Hughes B, Hannan MT, Lichtenstein AH, Tucker KL. Centrally located body fat is associated with lower bone mineral density in older Puerto Rican adults. Am J Clin Nutr. 2011;94(4):1063–70. doi: 10.3945/ajcn.111.016030. [DOI] [PMC free article] [PubMed] [Google Scholar]
- 25.Compston JE, Watts NB, Chapurlat R, et al. Obesity is not protective against fracture in postmenopausal women: GLOW. Am J Med. 2011;124(11):1043–50. doi: 10.1016/j.amjmed.2011.06.013. [DOI] [PMC free article] [PubMed] [Google Scholar]
- 26.Cornish J, MacGibbon A, Lin JM, et al. Modulation of osteoclastogenesis by fatty acids. Endocrinology. 2008;149(11):5688–95. doi: 10.1210/en.2008-0111. [DOI] [PubMed] [Google Scholar]
- 27.Oh SR, Sul OJ, Kim YY, et al. Saturated fatty acids enhance osteoclast survival. J Lipid Res. 2010;51(5):892–9. doi: 10.1194/jlr.M800626. [DOI] [PMC free article] [PubMed] [Google Scholar]
- 28.Drosatos K, Bharadwaj KG, Lymperopoulos A, et al. Cardiomyocyte lipids impair beta-adrenergic receptor function via PKC activation. Am J Physiol Endocrinol Metab. 2011;300(3):E489–99. doi: 10.1152/ajpendo.00569.2010. [DOI] [PMC free article] [PubMed] [Google Scholar]
- 29.Son NH, Park TS, Yamashita H, et al. Cardiomyocyte expression of PPARgamma leads to cardiac dysfunction in mice. J Clin Invest. 2007;117(10):2791–801. doi: 10.1172/JCI30335. [DOI] [PMC free article] [PubMed] [Google Scholar]
- 30.Drosatos K, Sanoudou D, Kypreos KE, Kardassis D, Zannis VI. A dominant negative form of the transcription factor c-Jun affects genes that have opposing effects on lipid homeostasis in mice. J Biol Chem. 2007;282(27):19556–64. doi: 10.1074/jbc.M700986200. [DOI] [PMC free article] [PubMed] [Google Scholar]
- 31.Parfitt AM, Drezner MK, Glorieux FH, et al. Bone histomorphometry: standardization of nomenclature, symbols, and units. Report of the ASBMR Histomorphometry Nomenclature Committee. J Bone Miner Res. 1987;2(6):595–610. doi: 10.1002/jbmr.5650020617. [DOI] [PubMed] [Google Scholar]
- 32.Darnay BG, Haridas V, Ni J, Moore PA, Aggarwal BB. Characterization of the intracellular domain of receptor activator of NF-kappaB (RANK). Interaction with tumor necrosis factor receptor-associated factors and activation of NF-kappab and c-Jun N-terminal kinase. J Biol Chem. 1998;273(32):20551–5. doi: 10.1074/jbc.273.32.20551. [DOI] [PubMed] [Google Scholar]
- 33.Kamei Y, Ohizumi H, Fujitani Y, et al. PPARgamma coactivator 1beta/ERR ligand 1 is an ERR protein ligand,whose expression induces a high-energy expenditure, antagonizes obesity. Proc Natl Acad Sci USA. 2003;100(21):12378–83. doi: 10.1073/pnas.2135217100. [DOI] [PMC free article] [PubMed] [Google Scholar]
- 34.St-Pierre J, Lin J, Krauss S, et al. Bioenergetic analysis of peroxisome proliferator-activated receptor gamma coactivators 1alpha and 1beta (PGC-1alpha and PGC-1beta) in muscle cells. J Biol Chem. 2003;278(29):26597–03. doi: 10.1074/jbc.M301850200. [DOI] [PubMed] [Google Scholar]
- 35.Bonnefont JP, Djouadi F, Prip-Buus C, Gobin S, Munnich A, Bastin J. Carnitine palmitoyltransferases 1 and 2: biochemical, molecular and medical aspects. Mol Aspects Med. 2004;25(5–6):495–520. doi: 10.1016/j.mam.2004.06.004. [DOI] [PubMed] [Google Scholar]
- 36.Murthy MS, Pande SV. Malonyl-CoA binding site and the overt carnitine palmitoyltransferase activity reside on the opposite sides of the outer mitochondrial membrane. Proc Natl Acad Sci USA. 1987;84(2):378–82. doi: 10.1073/pnas.84.2.378. [DOI] [PMC free article] [PubMed] [Google Scholar]
- 37.Eaton S, Bartlett K, Quant PA. Carnitine palmitoyl transferase I and the control of beta-oxidation in heart mitochondria. Biochem Biophys Res Commun. 2001;285(2):537–9. doi: 10.1006/bbrc.2001.5201. [DOI] [PubMed] [Google Scholar]
- 38.Love-Gregory L, Abumrad NA. CD36 genetics and the metabolic complications of obesity. Curr Opin Clin Nutr Metab Care. 2001;14(6):527–34. doi: 10.1097/MCO.0b013e32834bbac9. [DOI] [PMC free article] [PubMed] [Google Scholar]
- 39.Kim JM, Jeong D, Kang HK, Jung SY, Kang SS, Min BM. Osteoclast precursors display dynamic metabolic shifts toward accelerated glucose metabolism at an early stage of RANKL-stimulated osteoclast differentiation. Cell Physiol Biochem. 2007;20(6):935–46. doi: 10.1159/000110454. [DOI] [PubMed] [Google Scholar]
- 40.Larsen KI, Falany ML, Ponomareva LV, Wang W, Williams JP. Glucose- dependent regulation of osteoclast H(+)-ATPase expression: potential role of p38 MAP-kinase. J Cell Biochem. 2002;87(1):75–84. doi: 10.1002/jcb.10252. [DOI] [PubMed] [Google Scholar]
- 41.Williams JP, Blair HC, McDonald JM, et al. Regulation of osteoclastic bone resorption by glucose. Biochem Biophys Res Commun. 1997;235(3):646–51. doi: 10.1006/bbrc.1997.6795. [DOI] [PubMed] [Google Scholar]
- 42.Baylin A, Kabagambe EK, Siles X, Campos H. Adipose tissue biomarkers of fatty acid intake. Am J Clin Nutr. 2002;76(4):750–7. doi: 10.1093/ajcn/76.4.750. [DOI] [PubMed] [Google Scholar]
- 43.Borradaile NM, Han X, Harp JD, Gale SE, Ory DS, Schaffer JE. Disruption of endoplasmic reticulum structure and integrity in lipotoxic cell death. J Lipid Res. 2006;47(12):2726–37. doi: 10.1194/jlr.M600299-JLR200. [DOI] [PubMed] [Google Scholar]
- 44.Takahashi HK, Cambiaghi TD, Luchessi AD, et al. Activation of survival and apoptotic signaling pathways in lymphocytes exposed to palmitic acid. J Cell Physiol. 2006;227(1):339–50. doi: 10.1002/jcp.22740. [DOI] [PubMed] [Google Scholar]
- 45.Maloney E, Sweet IR, Hockenbery DM, et al. Activation of NF-kappaB by palmitate in endothelial cells: a key role for NADPH oxidase-derived superoxide in response to TLR4 activation. Arterioscler Thromb Vasc Biol. 2009;29(9):1370–5. doi: 10.1161/ATVBAHA.109.188813. [DOI] [PMC free article] [PubMed] [Google Scholar]
- 46.Listenberger LL, Han X, Lewis SE, et al. Triglyceride accumulation protects against fatty acid-induced lipotoxicity. Proc Natl Acad Sci USA. 2003;100(6):3077–82. doi: 10.1073/pnas.0630588100. [DOI] [PMC free article] [PubMed] [Google Scholar]
- 47.Maedler K, Oberholzer J, Bucher P, Spinas GA, Donath MY. Monounsaturated fatty acids prevent the deleterious effects of palmitate and high glucose on human pancreatic beta-cell turnover and function. Diabetes. 2003;52(3):726–33. doi: 10.2337/diabetes.52.3.726. [DOI] [PubMed] [Google Scholar]
- 48.Cases S, Smith SJ, Zheng YW, et al. Identification of a gene encoding an acyl CoA:diacylglycerol acyltransferase, a key enzyme in triacylglycerol synthesis. Proc Natl Acad Sci USA. 1998;95(22):13018–23. doi: 10.1073/pnas.95.22.13018. [DOI] [PMC free article] [PubMed] [Google Scholar]
- 49.Reitsma WD. The relationship between serum free fatty acids and blood sugar in non-obese and obese diabetics. Acta Med Scand. 1967;182(3):353–61. doi: 10.1111/j.0954-6820.1967.tb11535.x. [DOI] [PubMed] [Google Scholar]
- 50.Dole VP. A relation between non-esterified fatty acids in plasma and the metabolism of glucose. J Clin Invest. 1956;35(2):150–4. doi: 10.1172/JCI103259. [DOI] [PMC free article] [PubMed] [Google Scholar]
- 51.Bierman EL, Dole VP, Roberts TN. An abnormality of nonesterified fatty acid metabolism in diabetes mellitus. Diabetes. 1957;6(6):475–9. doi: 10.2337/diab.6.6.475. [DOI] [PubMed] [Google Scholar]
- 52.Taskinen MR, Bogardus C, Kennedy A, Howard BV. Multiple disturbances of free fatty acid metabolism in noninsulin-dependent diabetes. Effect of oral hypoglycemic therapy. J Clin Invest. 1985;76(2):637–44. doi: 10.1172/JCI112016. [DOI] [PMC free article] [PubMed] [Google Scholar]
- 53.Prisby RD, Swift JM, Bloomfield SA, Hogan HA, Delp MD. Altered bone mass, geometry and mechanical properties during the development and progression of type 2 diabetes in the Zucker diabetic fatty rat. J Endocrinol. 2008;199(3):379–88. doi: 10.1677/JOE-08-0046. [DOI] [PubMed] [Google Scholar]
- 54.Soares EA, Nakagaki WR, Garcia JA, Camilli JA. Effect of hyperlipidemia on femoral biomechanics and morphology in low-density lipoprotein receptor gene knockout mice. J Bone Miner Metab. 2012;30(4):419–25. doi: 10.1007/s00774-011-0345-x. [DOI] [PubMed] [Google Scholar]
- 55.Cistola DP, Small DM. Fatty acid distribution in systems modeling the normal and diabetic human circulation. A 13C nuclear magnetic resonance study. J Clin Invest. 1991;87(4):1431–41. doi: 10.1172/JCI115149. [DOI] [PMC free article] [PubMed] [Google Scholar]
- 56.Spector AA, Hoak JC. Letter: fatty acids, platelets, and microcirculatory obstruction. Science. 1975;190(4213):490–2. doi: 10.1126/science.1166323. [DOI] [PubMed] [Google Scholar]
- 57.Kissebah AH, Alfarsi S, Adams PW, Wynn V. Role of insulin resistance in adipose tissue and liver in the pathogenesis of endogenous hypertriglyceridaemia in man. Diabetologia. 1976;12(6):563–71. doi: 10.1007/BF01220632. [DOI] [PubMed] [Google Scholar]
- 58.Vassiliou EK, Gonzalez A, Garcia C, Tadros JH, Chakraborty G, Toney JH. Oleic acid and peanut oil high in oleic acid reverse the inhibitory effect of insulin production of the inflammatory cytokine TNF-alpha both in vitro and in vivo systems. Lipids Health Dis. 2009;8:25. doi: 10.1186/1476-511X-8-25. [DOI] [PMC free article] [PubMed] [Google Scholar]
- 59.Basu A, Devaraj S, Jialal I. Dietary factors that promote or retard inflammation. Arterioscler Thromb Vasc Biol. 2006;26(5):995–1001. doi: 10.1161/01.ATV.0000214295.86079.d1. [DOI] [PubMed] [Google Scholar]
- 60.Gupta S, Knight AG, Keller JN, Bruce-Keller AJ. Saturated long-chain fatty acids activate inflammatory signaling in astrocytes. J Neurochem. 2012;120(6):1060–71. doi: 10.1111/j.1471-4159.2012.07660.x. [DOI] [PMC free article] [PubMed] [Google Scholar]
- 61.Huang S, Rutkowsky JM, Snodgrass RG, et al. Saturated fatty acids activate TLR-mediated proinflammatory signaling pathways. J Lipid Res. 2012;53(9):2002–13. doi: 10.1194/jlr.D029546. [DOI] [PMC free article] [PubMed] [Google Scholar]
- 62.Walsh NC, Reinwald S, Manning CA, et al. Osteoblast function is compromised at sites of focal bone erosion in inflammatory arthritis. J Bone Miner Res. 2009;24(9):1572–85. doi: 10.1359/jbmr.090320. [DOI] [PubMed] [Google Scholar]
- 63.Tomomatsu N, Aoki K, Alles N, et al. LPS-induced inhibition of osteogenesis is TNF-alpha dependent in a murine tooth extraction model. J Bone Miner Res. 2009;24(10):1770–81. doi: 10.1359/jbmr.090410. [DOI] [PubMed] [Google Scholar]
- 64.Halade GV, El Jamali A, Williams PJ, Fajardo RJ, Fernandes G. Obesity- mediated inflammatory microenvironment stimulates osteoclastogenesis and bone loss in mice. Exp Gerontol. 2011;46(1):43–52. doi: 10.1016/j.exger.2010.09.014. [DOI] [PMC free article] [PubMed] [Google Scholar]
- 65.Kyung TW, Lee JE, Phan TV, Yu R, Choi HS. Osteoclastogenesis by bone marrow-derived macrophages is enhanced in obese mice. J Nutr. 2009;139(3):502–6. doi: 10.3945/jn.108.100032. [DOI] [PubMed] [Google Scholar]
- 66.Chavez JA, Summers SA. Characterizing the effects of saturated fatty acids on insulin signaling and ceramide and diacylglycerol accumulation in 3T3-L1 adipocytes and C2C12 myotubes. Arch Biochem Biophys. 2003;419(2):101–9. doi: 10.1016/j.abb.2003.08.020. [DOI] [PubMed] [Google Scholar]
- 67.Okere IC, Chandler MP, McElfresh TA, et al. Differential effects of saturated and unsaturated fatty acid diets on cardiomyocyte apoptosis, adipose distribution, and serum leptin. Am J Physiol Heart Circ Physiol. 2006;291(1):H38–44. doi: 10.1152/ajpheart.01295.2005. [DOI] [PubMed] [Google Scholar]
- 68.Yu C, Chen Y, Cline GW, et al. Mechanism by which fatty acids inhibit insulin activation of insulin receptor substrate-1 (IRS-1)-associated phosphatidylinositol 3-kinase activity in muscle. J Biol Chem. 2002;277(52):50230–6. doi: 10.1074/jbc.M200958200. [DOI] [PubMed] [Google Scholar]
- 69.Bao X, Ogawa T, Se S, et al. Acid sphingomyelinase regulates osteoclastogenesis by modulating sphingosine kinases downstream of RANKL signaling. Biochem Biophys Res Commun. 2011;405(4):533–7. doi: 10.1016/j.bbrc.2011.01.061. [DOI] [PubMed] [Google Scholar]
- 70.Moonga BS, Stein LS, Kilb JM, Dempster DW. Effect of diacylglycerols on osteoclastic bone resorption. Calcif Tissue Int. 1996;59(2):105–8. doi: 10.1007/s002239900095. [DOI] [PubMed] [Google Scholar]
- 71.Ota T, Gayet C, Ginsberg HN. Inhibition of apolipoprotein B100 secretion by lipid-induced hepatic endoplasmic reticulum stress in rodents. J Clin Invest. 2008;118(1):316–32. doi: 10.1172/JCI32752. [DOI] [PMC free article] [PubMed] [Google Scholar]
- 72.Felson DT, Zhang Y, Hannan MT, Anderson JJ. Effects of weight and body mass index on bone mineral density in men and women: the Framingham study. J Bone Miner Res. 1993;8(5):567–73. doi: 10.1002/jbmr.5650080507. [DOI] [PubMed] [Google Scholar]
- 73.Marcus R, Greendale G, Blunt BA, et al. Correlates of bone mineral density in the postmenopausal estrogen/progestin interventions trial. J Bone Miner Res. 1994;9(9):1467–76. doi: 10.1002/jbmr.5650090920. [DOI] [PubMed] [Google Scholar]
- 74.Mazess RB, Barden HS, Ettinger M, et al. Spine and femur density using dual-photon absorptiometry in US white women. J Bone Miner Res. 1987;2(3):211–9. [PubMed] [Google Scholar]
- 75.Ravn P, Cizza G, Bjarnason NH, et al. Low body mass index is an important risk factor for low bone mass and increased bone loss in early postmenopausal women. Early Postmenopausal Intervention Cohort (EPIC) study group. J Bone Miner Res. 1999;14(9):1622–7. doi: 10.1359/jbmr.1999.14.9.1622. [DOI] [PubMed] [Google Scholar]
- 76.Reid IR, Ames R, Evans MC, et al. Determinants of total body and regional bone mineral density in normal postmenopausal women—a key role for fat mass. J Clin Endocrinol Metab. 1992;75(1):45–51. doi: 10.1210/jcem.75.1.1619030. [DOI] [PubMed] [Google Scholar]
- 77.Jeon YK, Lee JG, Kim SS, et al. Association between bone mineral density, metabolic syndrome in pre-, postmenopausal women. Endocr J. 2011;58(2):87–93. doi: 10.1507/endocrj.k10e-297. [DOI] [PubMed] [Google Scholar]
- 78.Adami S. Bone health in diabetes: considerations for clinical management. Curr Med Res Opin. 2009;25(5):1057–72. doi: 10.1185/03007990902801147. [DOI] [PubMed] [Google Scholar]
- 79.Suzuki K, Kurose T, Takizawa M, et al. Osteoclastic function is accelerated in male patients with type 2 diabetes mellitus: the preventive role of osteoclastogenesis inhibitory factor/osteoprotegerin (OCIF/OPG) on the decrease of bone mineral density. Diabetes Res Clin Pract. 2005;68(2):117–25. doi: 10.1016/j.diabres.2004.08.006. [DOI] [PubMed] [Google Scholar]
- 80.Kayal RA, Tsatsas D, Bauer MA, et al. Diminished bone formation during diabetic fracture healing is related to the premature resorption of cartilage associated with increased osteoclast activity. J Bone Miner Res. 2007;22(4):560–8. doi: 10.1359/jbmr.070115. [DOI] [PMC free article] [PubMed] [Google Scholar]
- 81.Loder RT. The influence of diabetes mellitus on the healing of closed fractures. Clin Orthop Relat Res. 1988;(232):210–6. [PubMed] [Google Scholar]
- 82.Zhao LJ, Liu YJ, Liu PY, Hamilton J, Recker RR, Deng HW. Relationship of obesity with osteoporosis. J Clin Endocrinol Metab. 2007;92(5):1640–6. doi: 10.1210/jc.2006-0572. [DOI] [PMC free article] [PubMed] [Google Scholar]
- 83.Migliaccio S, Greco EA, Fornari R, Donini LM, Lenzi A. Is obesity in women protective against osteoporosis? Diabetes Metab Syndr Obes. 2011;4:273–82. doi: 10.2147/DMSO.S11920. [DOI] [PMC free article] [PubMed] [Google Scholar]
- 84.Woo DG, Lee BY, Lim D, Kim HS. Relationship between nutrition factors and osteopenia: effects of experimental diets on immature bone quality. J Biomech. 2009;42(8):1102–7. doi: 10.1016/j.jbiomech.2009.02.020. [DOI] [PubMed] [Google Scholar]
Associated Data
This section collects any data citations, data availability statements, or supplementary materials included in this article.