Abstract
Purpose
To develop and prove preliminary validation of a fast in vivo T2 mapping technique for mouse heart.
Materials and Methods
MRI experiments were performed on a 7T animal scanner. The standard Carr-Purcell-Meiboom-Gill (CPMG) sequence was modified to minimize the effect of stimulated echoes for accurate T2 quantification. The acquisition was further accelerated with the compressed sensing approach. The accuracy of the proposed method was first validated with both phantom experiments and numerical simulations. In vivo T2 measurement was performed on seven mice in a manganese-enhanced MRI study.
Results
In phantom studies, T2 values obtained with the modified CPMG sequence are in good agreement with the standard spin-echo method (P > 0.05). Numerical simulations further demonstrated that with the application of the compressed sensing approach, fast T2 quantification with a spatial resolution of 2.3 mm can be achieved at a high temporal resolution of one minute per slice. With the proposed technique, an average T2 value of 25 msec was observed for mouse heart at 7T and this number decreased significantly after manganese infusion (P < 0.001).
Conclusion
A rapid T2 mapping technique was developed and assessed, which allows accurate T2 quantification of mouse heart at a temporal resolution of one minute per slice.
Keywords: T2 mapping, CPMG sequence, compressed sensing, cardiac imaging, manganese-enhanced MRI
INTRODUCTION
Quantification of proton transverse relaxation time T2 provides important information in a variety of pathological conditions. Multiple T2 mapping techniques have been developed and their applications in various cardiovascular diseases have been investigated (1–4). Kellman et al. have shown that quantitative T2 measurement can provide more accurate assessment of acute myocardial infarction as compared to standard myocardial T2-weighted images (5). Multiple studies have also demonstrated that quantitative T2 mapping is less sensitive to B0 inhomogeneity and therefore provides a reliable assessment of cardiac iron overload as compared to T2* mapping, especially at 3T systems (3, 6).
However, due to the small size of a mouse heart and its fast heart rate, accurate T2 measurement of mouse myocardium in vivo is challenging. T2 mapping using standard spin-echo sequence suffers from long acquisition time and relative motion in images acquired with different echo times (7). Recently, a multi-slice T2 mapping technique has been proposed that combines a T2-preparation module with fast imaging with a steady-state processing (FISP) readout (8). High-quality T2 maps can be achieved with this approach which is immune of B0 and B1 field inhomogeneities. However, the total acquisition time for one T2 measurement with three slices is about 30 min (4.5 min for each echo), which hinders its application in fast dynamic contrast MRI studies. The goal of this study was to develop a rapid T2 mapping method for mouse heart using the Carr-Purcell-Meiboom-Gill (CPMG) sequence in combined with compressed sensing (CS) reconstruction (9, 10).
MATERIALS AND METHODS
Pulse Sequence and T2 Mapping
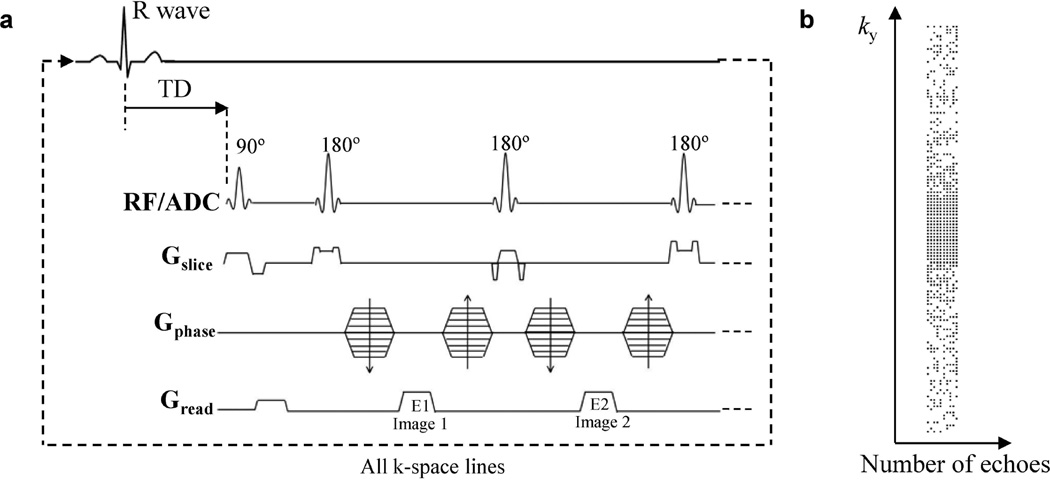
MRI experiments were conducted on a 7T Bruker (Billerica, MA) horizontal bore scanner with a volume coil. The standard CPMG sequence was modified for T2 mapping as shown in Fig. 1a. Specifically, variable crusher gradients were used before and after the 180° pulses to minimize the stimulated echo effects (11). The slice thickness of the 180° pulses was adjusted to three times of the excitation pulse to ensure a uniform refocusing across the imaging slice (12). A minimum TE of 4.4 msec was achieved by reducing the gradient encoding times (readout dephasing gradient, 0.40 msec; phase-encoding gradient, 0.40 msec; readout gradient, 1.27 msec) and RF pulse durations (90° pulse, 1.00 msec; 180° pulse, 0.63 msec). With the reduced minimum TE, more images with different echo times can be acquired during the diastolic phase (~40–50 msec) to achieve robust T2 fitting. For in vivo T2 measurement, after the detection of R wave, a trigger delay (TD) of about 60% of the cardiac cycle was applied before the excitation pulse. This ensures that all images were acquired in mid- to end-diastole to minimize motion artifact and signal dropout. After each excitation, eight to ten echoes with TE ranging from 4.4 to 44 msec were acquired, which were used to form eight to ten T2-weighted images to generate a T2 map.
Figure 1.
(a) Pulse sequence diagram. After the detection of R wave, a trigger delay (TD) of about 60% of the cardiac interval was used before the excitation pulse. (b) The variable density undersampling pattern for compressed sensing acquisition of 10 echoes with an acceleration factor of 2. Each black dot represents a sampled k-space line in the readout direction (kx).
Phantom Validation
The accuracy of T2 measurement was first validated using a multi-compartment phantom of MnCl2 solution in water at various concentrations (50 to 300 µM). T2 values measured with a long-TR, spin-echo sequence were used as the gold standard reference. The imaging parameters were: TR, 5 s; TE, 8 to 200 msec (10 TEs); FOV, 3 cm; slice thickness, 1 mm; matrix size, 128×128; number of averages, 2. For the modified CPMG sequence, acquisitions with both long TR (1 s) and short TR (0.5 s) were examined. Ten echoes with TE ranging from 10 msec to 100 msec were acquired. Other imaging parameters were the same as the standard spin-echo acquisition.
CS Reconstruction and Implementation
Further acceleration of image acquisition was achieved with pseudo-random under-sampling of the k-space lines with an acceleration factor of 2 (R = 2), followed by image reconstruction using the CS algorithm (9, 10, 13). To ensure random under-sampling for the multi-echo acquisition, a sampling pattern with variable density along the phase-encoding direction and uniform density along the echo direction was generated using numerical simulations (Fig. 1b; 13). Two CS methods were applied to reconstruct images from the under-sampled dataset. The first method exploited the exponential T2-decay at different echo times and used an iterative reconstruction procedure as proposed by Doneva et al. (9). Briefly, a mono-exponential model was used to describe the transverse relaxation at multiple echo times. Based on this model, a dictionary was generated that included signal evolutions for T2 values ranging from 1 msec to 1000 msec with a dictionary resolution of 1 msec. The multi-echo signals of each voxel from the undersampled images were then matched to the dictionary using orthogonal matching pursuit (OMP) (14). For each voxel, four entries with the highest correlation to the measured signal were selected. The signal evolution of this voxel was then calculated as a weighted summation of the selected entries, using weights determined by the OMP operation (9, 13). The second method used the nonlinear conjugated gradient (CG) to reconstruct the under-sampled images (10). The reconstructed images were then fit to the exponential model to yield pixel-wise T2 values. The two methods are referred as the OMP method and CG method, respectively, in the following text.
The accuracy of the two reconstruction methods was first evaluated using numerical simulations with a digital phantom. A theoretical T2 map was created using a Shepp-Logan digital phantom with different T2 values ranging from 10 to 60 msec. This T2 range was representative of the physiological T2 values typically encountered in the in vivo cardiac imaging at 7T. Based on this theoretical T2 map, 15 T2-weighted images were generated with an echo spacing of 4.4 msec and a matrix size of 128×128. The T2-weighted images were transformed to k-space and the fully sampled data were retrospectively under-sampled using the pre-generated sampling patterns. Different levels of Gaussian noise were added into the k-space data, which yielded four datasets with signal-to-noise ratios (SNR) ranging from 10 to 40. Monte Carlo simulations with 100 repetitions were then performed for each SNR. The performance of both OMP and CG methods was evaluated and the reconstructed T2 maps were compared to the theoretical T2 map. Further evaluation of the CS reconstruction methods was also performed using fully-sampled in vivo dataset acquired from a mouse heart. T2 maps were obtained from retrospectively undersampled dataset (R = 2) using both reconstruction methods and the results were then compared to those obtained from fully sampled dataset.
The random under-sampling protocol for the CS method was further implemented and tested on a Bruker 7T scanner. A gradient table based on the under-sampling pattern generated above (R = 2) was used to replace the default phase-encoding scheme for fully sampled k-space data.
In Vivo MRI
The proposed T2 mapping method was applied in a dynamic manganese-enhanced MRI (MEMRI) study with male FVB mice (3 months old). The animal protocol was approved by the Institutional Animal Care and Use Committee. Animals were anesthetized with 2.0% isoflurane with supplemented O2 in an isoflurane induction chamber. A 26G-3/4” Abbocath®-T catheter (TW Medical, Lago Vista, TX) was inserted into the tail vein and connected to an infusion pump (Braintree Scientific, Braintree, MA) for MnCl2 administration. The animal was then moved into the magnet and kept under anesthesia with 1.5% isoflurane delivered via a nose cone. The body temperature was maintained at 35.0 ± 0.2°C by blowing hot air into the magnet through a feedback control system. ECG triggering was performed through an MR-compatible small animal gating and monitoring system (SA Instruments, Stony Brook, NY).
In vivo T2 mapping was performed on seven mice with either MnCl2 infusion (n = 5) or saline infusion (n = 2). For each animal, a T2 map of a mid-ventricular slice was first acquired under baseline conditions using both fully sampled and under-sampled (R = 2) approaches. Afterwards, the animal was continuously infused with MnCl2 solution (126 mM) or saline through the tail vein catheter at a rate of 0.2 mL/h for 30 minutes, followed by a 10-minute washout period. T2 maps were acquired continuously during Mn2+ infusion and washout. Image acquisition was triggered at every four heart beats, corresponding to a TR of 400 to 600 msec. This triggering scheme allowed substantial signal recovery after each excitation; meanwhile it can also minimize fluctuation of the steady-state due to heart rate variation. Total data acquisition time was around two minutes for a fully-sampled dataset and only one minute for the under-sampled method (R = 2). Other imaging parameters were: minimal TE, 4.4 msec; number of echoes, 8~10; matrix size, 128×128 (128×64 for under-sampled acquisitions); FOV, 3 cm; slice thickness, 1.5 mm; number of averages, 2. The under-sampled images were reconstructed using both OMP and CG methods described above. The dynamic changes in transverse relaxation rate (R2) induced by MnCl2 infusion (n = 5) were computed and compared to the results acquired with saline injection (fully-sampled; n=2).
Statistical Analysis
Both phantom and in vivo MR images were reconstructed and analyzed offline using custom-built software written in Matlab (MathWorks, Natick, MA). Squared correlation coefficient was also computed to examine the quality of curve fitting for each voxel. To assess the quality of the CS reconstruction in the Shepp-Logan phantom, the normalized Root Mean Square Error (NRMSE) between the reconstructed T2 map and the theoretical T2 map was calculated. For phantom and in vivo studies, T2 maps from the fully sampled datasets were used to calculate NRMSE.
All the results are presented as mean ± SD. A one-way analysis of variance (ANOVA) was performed to examine the difference in the baseline T2 values from the fully sampled dataset and the two CS reconstructed datasets. In phantom experiments, the transverse relaxivity was obtained by linear regression between the transverse relaxation rate R2 (=1/T2) and Mn2+ concentration. Two-tailed Student’s t-test was employed to investigate the difference between two linear regression lines. P value less than 0.05 was considered as significantly different.
RESULTS
Phantom Validation
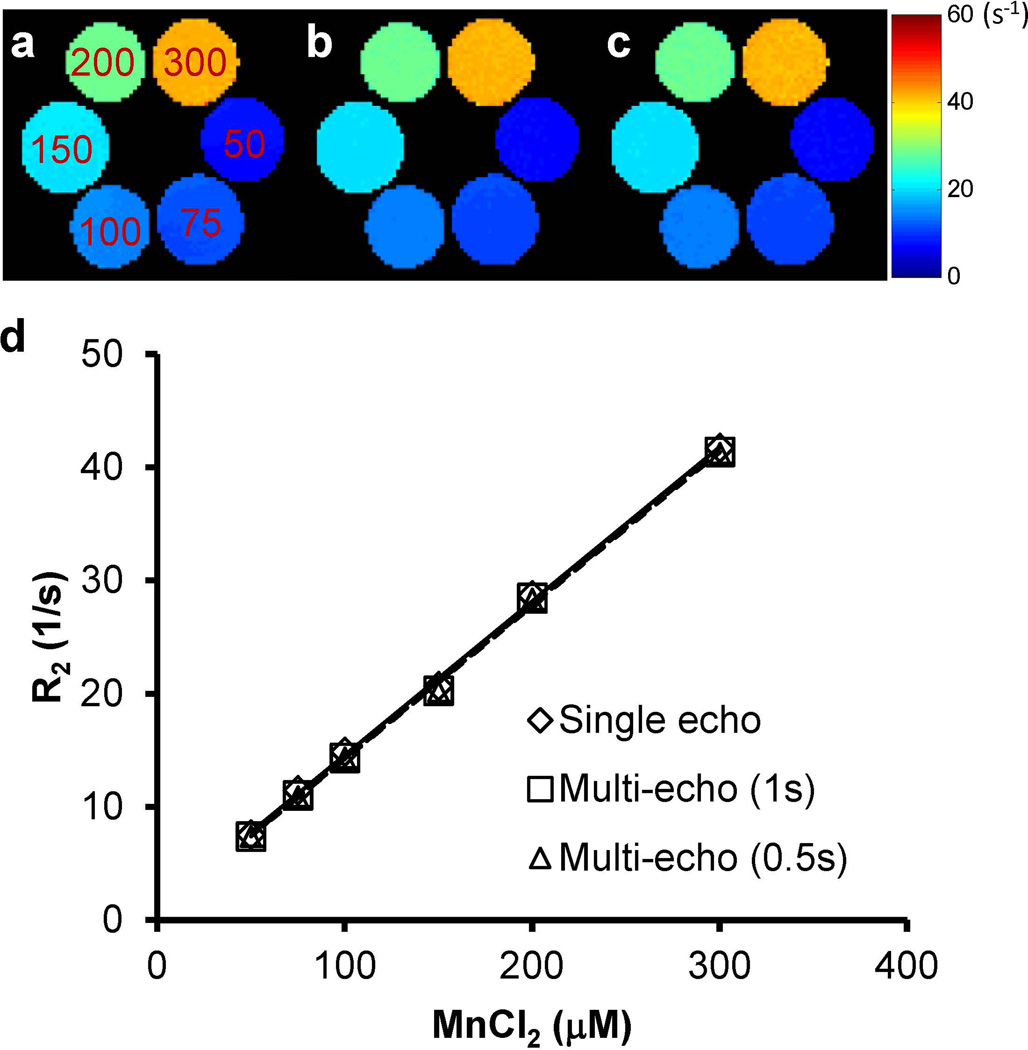
The results show that the transverse relaxation rate R2 acquired with the multi-echo CPMG sequence agreed well with the results from the standard spin-echo sequence (Fig. 2). For the CPMG method, both the short-TR (0.5 s) and long-TR (1 s) protocols yielded similar R2 maps (Figs. 2b&c) and the maximum percentage difference of the mean R2 values from the six vials was 2.8%. A linear correlation between R2 and Mn2+ concentration was observed (Fig. 2d). The transverse relaxivity for the long-TR and short-TR CPMG protocols was 136.1 and 135.7 s−1mM−1, respectively. Both numbers are in close agreement with that from the spin-echo acquisition (136.0 s−1mM−1; P > 0.05 for both TRs).
Figure 2.
Maps of the transverse relaxation rate (R2 = 1/T2) of MnCl2 solutions (50 ~ 300 µM). (a) Single-echo sequence with 5-s TR. (b) Multi-echo CPMG sequence with 1-s TR. (c) Multi-echo CPMG sequence with 0.5-s TR. (d) R2 versus Mn2+ concentration.
T2 Mapping of Mouse Heart with Fully Sampled Dataset
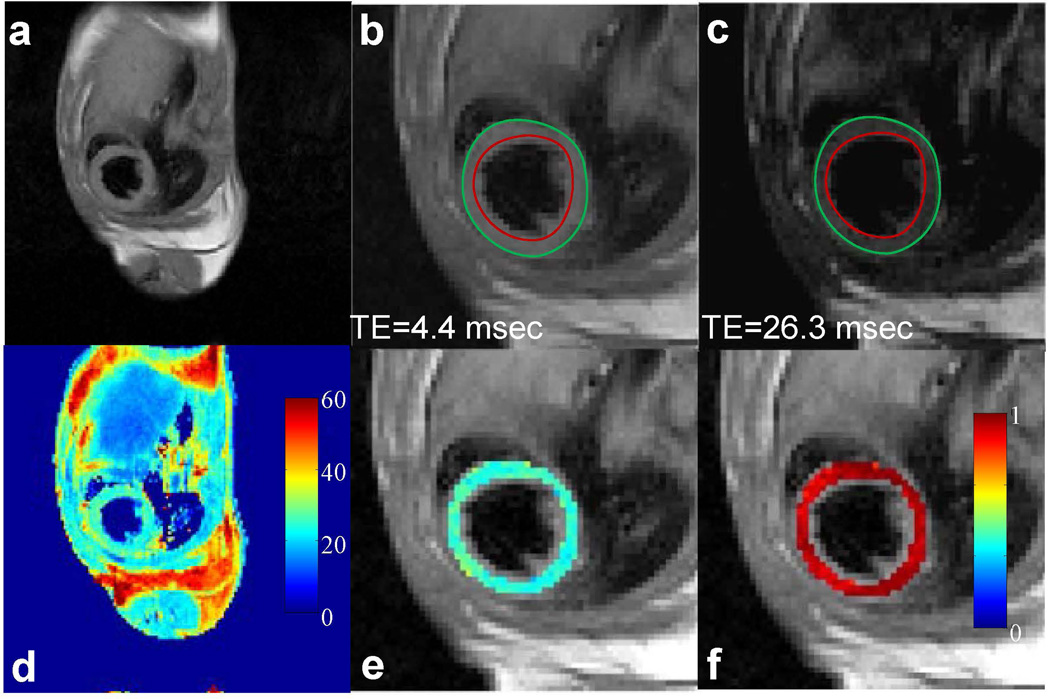
Fig. 3 shows representative T2-weighted images and the corresponding T2 map of a mouse heart using fully sampled data acquired in two minutes. No notable myocardium wall motion was observed in the images acquired at different echo times, as was indicated by the endocardial and epicardial contours traced from the first echo image (Figs. 3b&c). A smooth T2 map was observed across the myocardium (Fig. 3e). The average T2 value for the whole imaging slice was 25.1 ± 2.5 msec. Pixel-wise squared correlation coefficient was used to examine the quality of the exponential fitting and a mean value of 0.94 ± 0.04 was observed across the myocardium as shown in Fig. 3f.
Figure 3.
In vivo T2 mapping of a mouse heart using fully-sampled dataset. (a) Full FOV image of the first echo (TE: 4.4 msec). (b&c) Enlarged images of the heart from the first and sixth echo, respectively. Red and green circles represent endocardial and epicardial contours drawn from the first echo image, respectively. (d) The corresponding T2 map for the whole image. (e) Enlarged T2 map for the mouse heart. (f) Map of squared correlation coefficient for the exponential T2 fitting.
CS Reconstruction with Retrospective Under-sampling
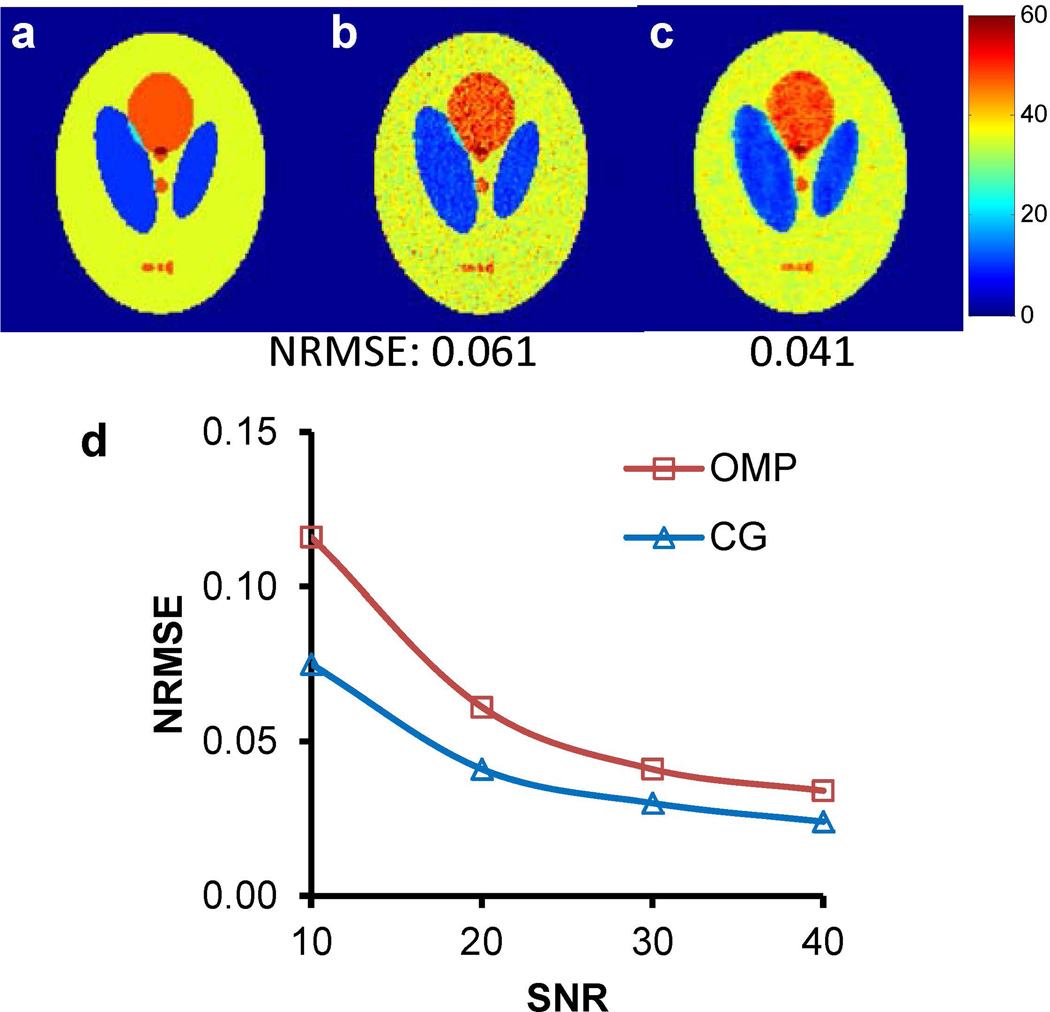
The acquisition was further accelerated by under-sampling the k-space and using CS in image reconstruction. The accuracy of this approach was first examined using numerical simulations. Fig. 4 shows the results of the simulation with an SNR of 20. With an acceleration factor of 2, T2 maps obtained from both OMP and CG reconstruction methods agreed well with the theoretical T2 map (Figs. 4a-c). Results from the Monte-Carlo simulation further demonstrated a monotonic decrease in the NRMSE with increased SNR for both reconstruction methods (Fig. 4d). Between the two methods, a consistently lower NRMSE was observed with the CG-reconstructed images for all SNR values (mean absolute difference, 0.021 ± 0.014).
Figure 4.
Simulation of CS reconstruction with the Shepp-Logan phantom. (a) Theoretical T2 map. (b) T2 map obtained with the OMP method (SNR = 20). (c) T2 map obtained with the CG method (SNR = 20). NRMSE values are presented at the bottom of each image. (d) Effect of SNR on NRMSE values.
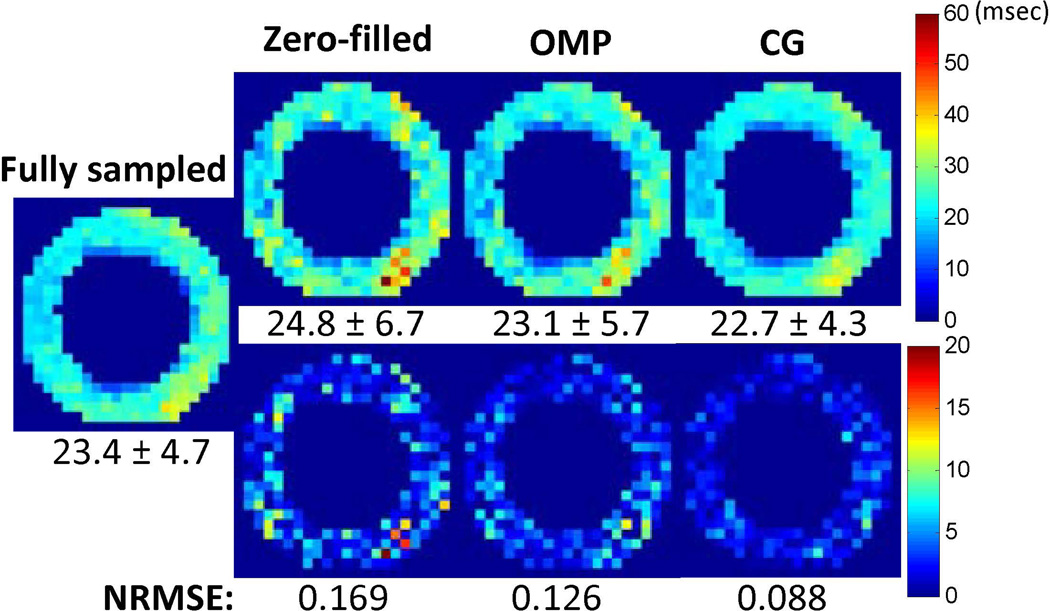
The accuracy of CS reconstruction was also examined with retrospectively under-sampled in vivo dataset (Fig. 5). Compared to the zero-filled method, both OMP and CG methods provided more accurate T2 quantification demonstrated as reduced NRMSE values and less residue artifacts. Between the two CS reconstruction methods, a lower NRMSE was achieved with the CG method (0.088 vs. 0.126), which is similar to the phantom simulations.
Figure 5.
Compressed sensing reconstruction from retrospectively under-sampled in vivo images. (Top) T2 maps obtained from zero-filled method, OMP method and CG method. Average T2 values (msec) across the myocardium are shown at the bottom of each image. (Bottom) Difference maps as compared to the result from fully-sampled case. The NRMSE values are presented at the bottom of each image.
Rapid T2 Mapping with Mn2+ Infusion
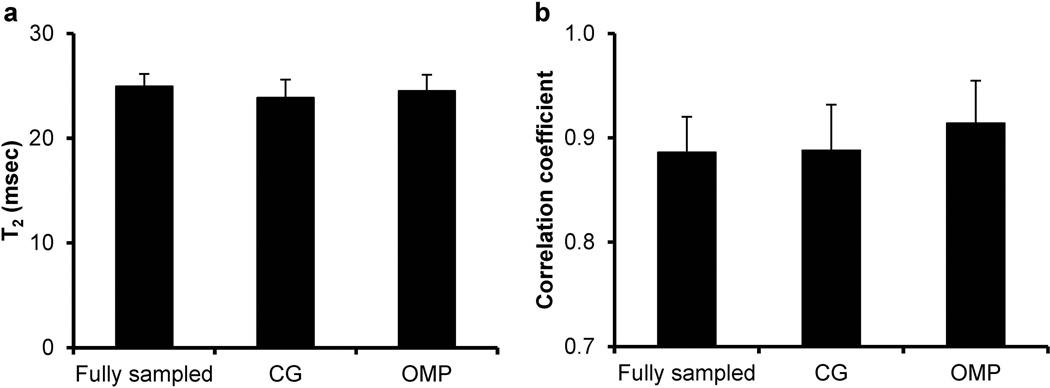
Fig. 6 shows the average T2 value and squared correlation coefficient acquired at the baseline condition with both fully-sampled method and under-sampled method using two different CS reconstruction algorithms. No significant difference was observed in either T2 or squared correlation coefficient among the three groups (P < 0.05).
Figure 6.
Average T2 values (a) and squared correlation coefficients (b) for mouse hearts obtained at the baseline condition.
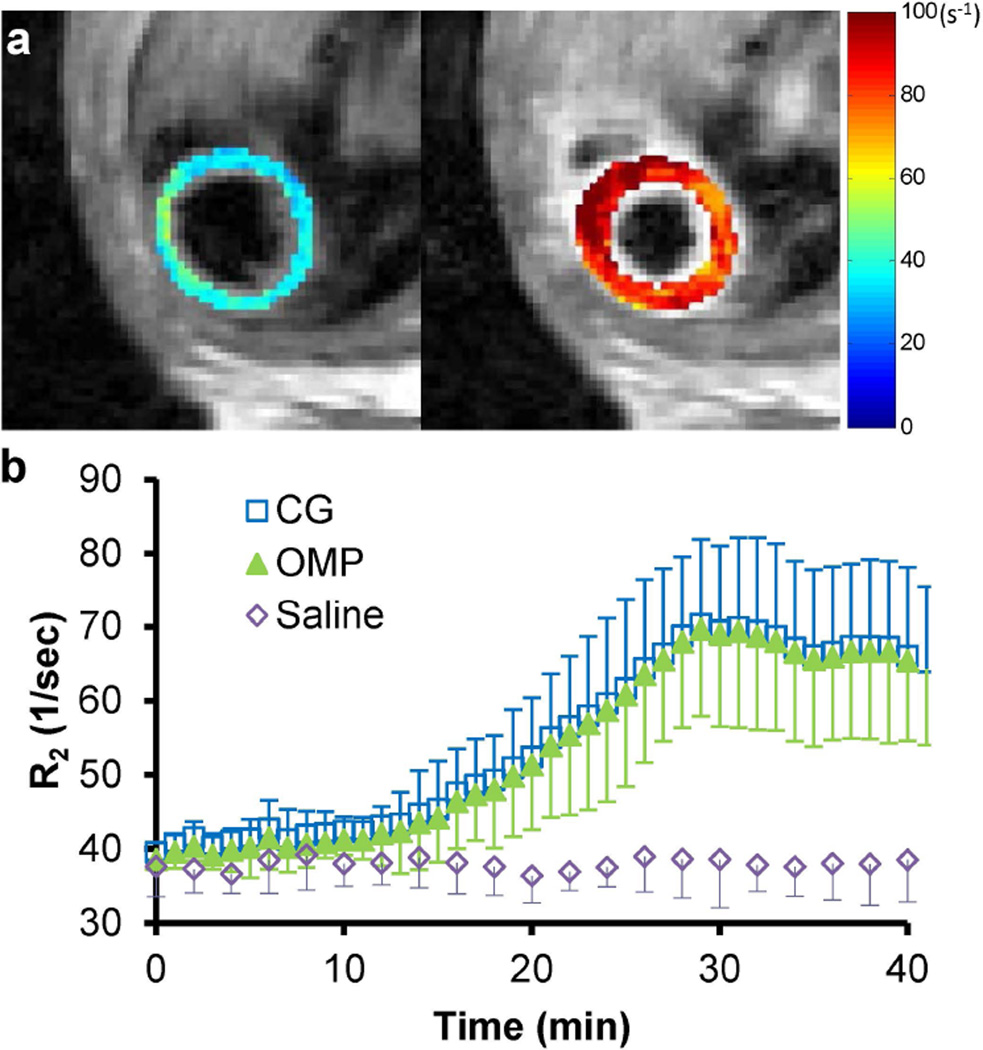
Representative R2 maps before and after Mn2+ infusion from the same mouse heart are shown in Fig. 7a. Compared to the results with saline infusion, significant increase in R2 (76.0 ± 32.7%; P < 0.001) was observed after 30-min Mn2+ infusion and it gradually reduced to 67.2 ± 27.5% after the 10-min washout (Fig. 7b). Similar R2 changes were captured with either OMP or CG reconstruction method (P > 0.05 for all the time points).
Figure 7.
Dynamic R2 changes during Mn2+ infusion. (a) Representative R2 maps of the same mouse heart under the baseline condition (left) and after 30-min Mn2+ infusion (right). (b) Time courses of R2 changes for both Mn2+ infusion (under-sampled) and saline infusion (fully sampled).
DISCUSSION
In this study, a modified CPMG sequence was developed for fast T2 mapping of mouse heart in vivo. Rapid data acquisition was achieved with random under-sampling and CS reconstruction. The accuracy of this method was examined with simulation and phantom studies. The utility of the method was demonstrated in an MEMRI study, which shows that fast T2 mapping for mouse heart can be achieved at a temporal resolution of one minute per slice.
Several rapid T2 mapping methods have been proposed for clinical studies. The most common method is to combine T2 preparation module with a single-shot SSFP readout train (4, 5). However, the short R-R interval of mouse heart limits the number of echoes that can be acquired after each T2 preparation. A longer myocardium T1 relaxation time is also expected at high field, which requires a longer recovery time between consecutive preparation modules and thus further lowers scan efficiency. Additionally, this method suffers from the banding artifacts due to B0 inhomogeneity, which is more problematic with high-field systems. Recently, Sussman et al. proposed a rapid single spin-echo T2 mapping method with a much shorter repetition time (15). However, to achieve accurate T2 measurement with this method, a constant difference between different echo times and repetition time is required, which is not feasible in cardiac imaging with rhythmic heart beats.
The CPMG pulse sequence was proposed for fast T2 measurement over six decades ago (16, 17). It uses refocusing pulses repeatedly to acquire multiple echoes after each excitation. For cardiac T2 quantification, the number of echoes can be flexibly adjusted based on the heart rate. However, it is known that CPMG sequence suffers from imperfect refocusing pulses that can induce stimulated echoes and affect the accuracy of T2 measurement (12, 15). In the current study, two modifications in the traditional CPMG pulse sequence were made to reduce the effect of stimulated echoes to achieve accurate T2 quantification. A refocusing pulse with three-times the slice thickness of the excitation pulse was used to ensure a more uniform spin inversion within the imaging slice. This method has shown improved T2 accuracy and precision as compared to the traditional CPMG method on a 3T clinical system (12). The drawback of this modification is that it restricts the application of the CPMG method for multi-slice T2 measurement, especially for the small mouse heart. In addition, T2 error due to B1 inhomogeneity is not corrected by this approach. Therefore, a second modification was made in this study to replace the constant crusher gradients around the refocusing pulses with variable crusher gradients, which has been shown to provide more effective elimination of stimulated echoes induced by imperfect RF pulses (11).
The average T2 value of 25.0 msec for mouse heart obtained at 7T in the present study is in agreement with the findings from previous studies (7, 8). At higher field strength, Schneider et al. reported a T2 relaxation of 18.5 msec at 11.7T and Coolen et al. observed a T2 of 23.2 msec at 9.4T. The close agreement of our results as compared to these studies suggests that the modifications made to the CPMG sequence were effective in eliminating stimulated echoes and allowed accurate measurement of T2 relaxation time in mouse heart.
Instead of eliminating the stimulated echoes of the CPMG acquisition, advanced post-processing algorithms have been proposed to take into account the existence of stimulated echoes to achieve accurate T2 quantification. Ben-Eliezer et al. have simulated all different signal pathways due to B1 inhomogeneity and used a matching algorithm to estimate T2 values (18). A novel MR imaging and post-processing method, termed MR fingerprinting, has been proposed recently, which can provide simultaneous T1 and T2 quantification in spite of field inhomogeneities (19). The application of this novel technique for mouse brain and body imaging has been recently reported (20), but its application for T2 mapping in fast-beating mouse heart remains to be demonstrated.
Besides the fast CPMG sequence, the CS algorithm was also applied to achieve a rapid T2 mapping in this study and two different reconstruction methods were evaluated. A previous study has shown improved performance with the model-based OMP method as compared to the CG method (9). However, in our current study, lower NRMSE was achieved with the CG method in simulations with either a digital phantom or retrospectively undersampled in vivo data. This difference is possibly due to different numbers of echoes used. While 32 echoes were acquired from human brains in the previous study, only 8-10 echoes were acquired in our current study because of the short duration of the diastole phase of a mouse heart (~40 to 50 msec). While 8 to 10 echoes provided sufficient number of data points for a reliable T2 fitting, more time points with different echo times are likely needed to achieve better quantification with the model-based OMP method. It is worthy to note that even though the CG method produces more accurate T2 quantification with consistent lower NRMSEs, the mean T2 values from the OMP method could be closer to that obtained from fully sampled data for some cases. However, this finding was not consistent in all the cases and no clear trend was observed in the numerical simulations with either the Shepp-Logan phantom or the retrospectively undersampled data.
The in vivo MEMRI study demonstrates that a fast T2 mapping of one minute per slice can be achieved with a reduction factor of two. While higher acceleration with the CS algorithm is limited due to the small number of echoes (8~10) and matrix size (128x128), faster T2 mapping is possible with shorter TRs. To ensure a satisfactory image quality, a TR of 400~600 msec was used in this study, which was achieved by triggering on every four heart beats. Further acceleration of ~30 sec per slice can be achieved by triggering on every other heart beat, at the cost of a lower SNR.
Development of a rapid and accurate cardiac T2 mapping method in mouse can find applications in the investigation of cardiovascular diseases using murine models. For example, rapid T2 mapping can be used for in vivo quantification of Ca2+ uptake in myocardium by MEMRI (21, 22). Fast T2 mapping is also necessary to investigate mitochondria oxidation in mouse hearts using 17O MRI, where the relaxation rate R2 of myocardial tissue is linearly dependent on the concentration of metabolic H217O generated after breathing 17O2 gas (23). While our current study demonstrated the utility of our technique in following the dynamic uptake of Mn2+ in myocardium at a high temporal resolution, a major limitation of the current study is the lack of validation with diseased mouse models. Future work will be performed to apply the proposed technique to mouse models to study different cardiovascular diseases (8, 24).
One limitation of the current study is the lack of direct validation using the standard method for in vivo measurements. T2 mapping using the standard single spin-echo sequence was attempted on mouse heart in vivo. However, relative wall motion was noticed in T2-weighted images acquired with different echo times, which was likely caused by changes in heart rate due to prolonged image acquisition time (data not shown). As a result, no reliable T2 map was obtained. A similar image registration approach as developed for cardiac T1 mapping is needed for a reliable T2 mapping with the standard method (25). In addition, the effect of B1 field inhomogeneity on the accuracy of T2 quantification remains to be investigated. While it is out of the scope of the current study, more advanced image acquisition and post-processing methods can be used to explore this in the future (18, 19).
In conclusion, we developed and assessed a rapid T2 mapping method for mouse heart using the CPMG sequence in combination with the CS algorithm, which allowed accurate T2 quantification with a high temporal resolution of one minute per slice.
Acknowledgments
Grant Support: NIH grants 1R01HL73315, 1R01 HL86935, and 2KL2TR000440. American Heart Association postdoctoral fellowship 09POST2080107.
We would like to thank Dr. Michael Lustig for sharing the Sparse MRI software online.
REFERENCES
- 1.Feng L, Otazo R, Jung H, et al. Accelerated cardiac T2 mapping using breath-hold multiecho fast spin-echo pulse sequence with k-t FOCUSS. Magn Reson Med. 2011;65:1661–1669. doi: 10.1002/mrm.22756. [DOI] [PMC free article] [PubMed] [Google Scholar]
- 2.He T, Gatehouse PD, Anderson LJ, et al. Development of a novel optimized breathhold technique for myocardial T2 measurement in thalassemia. J Magn Reson Imaging. 2006;24:580–585. doi: 10.1002/jmri.20681. [DOI] [PubMed] [Google Scholar]
- 3.Guo H, Au WY, Cheung JS, et al. Myocardial T2 quantitation in patients with iron overload at 3 Tesla. J Magn Reson Imaging. 2009;30:394–400. doi: 10.1002/jmri.21851. [DOI] [PMC free article] [PubMed] [Google Scholar]
- 4.Giri S, Chung Y-C, Merchant A, et al. T2 quantification for improved detection of myocardial edema. J Cardiovasc Magn Reson. 2009;11:56. doi: 10.1186/1532-429X-11-56. [DOI] [PMC free article] [PubMed] [Google Scholar]
- 5.Kellman P, Aletras AH, Mancini C, McVeigh ER, Arai AE. T2-prepared SSFP improves diagnostic confidence in edema imaging in acute myocardial infarction compared to turbo spin echo. Magn Reson Med. 2007;57:891–897. doi: 10.1002/mrm.21215. [DOI] [PMC free article] [PubMed] [Google Scholar]
- 6.Feng Y, He T, Carpenter JP, et al. In vivo comparison of myocardial T1 with T2 and T2* in thalassaemia major. J Magn Reson Imaging. 2013;38:588–593. doi: 10.1002/jmri.24010. [DOI] [PubMed] [Google Scholar]
- 7.Schneider JE, Cassidy PJ, Lygate C, et al. Fast, High-Resolution in Vivo Cine Magnetic Resonance Imaging in Normal and Failing Mouse Hearts on a Vertical 11.7 T System. J Magn Reson Imaging. 2003;18:691–701. doi: 10.1002/jmri.10411. [DOI] [PubMed] [Google Scholar]
- 8.Coolen BF, Simonis FFJ, Geelen T, et al. Quantitative T2 mapping of the mouse heart by segmented MLEV phase-cycled T2 preparation. Magn Reson Med. 2014;72:409–417. doi: 10.1002/mrm.24952. [DOI] [PubMed] [Google Scholar]
- 9.Doneva M, Börnert P, Eggers H, Stehning C, Sénégas J, Mertins A. Compressed sensing reconstruction for magnetic resonance parameter mapping. Magn Reson Med. 2010;64:1114–1120. doi: 10.1002/mrm.22483. [DOI] [PubMed] [Google Scholar]
- 10.Lustig M, Donoho D, Pauly JM. Sparse MRI: The application of compressed sensing for rapid MR imaging. Magn Reson Med. 2007;58:1182–1195. doi: 10.1002/mrm.21391. [DOI] [PubMed] [Google Scholar]
- 11.Poon CS, Henkelman MR. Practical T2 quantitation for clinical applications. J Magn Reson Imaging. 1992;2:541–553. doi: 10.1002/jmri.1880020512. [DOI] [PubMed] [Google Scholar]
- 12.Pell GS, Briellmann RS, Waites AB, Abbott DF, Lewis DP, Jackson GD. Optimized clinical T2 relaxometry with a standard CPMG sequence. J Magn Reson Imaging. 2006;23:248–252. doi: 10.1002/jmri.20490. [DOI] [PubMed] [Google Scholar]
- 13.Li W, Griswold M, Yu X. Fast cardiac T1 mapping in mice using a model-based compressed sensing method. Magn Reson Med. 2012;68:1127–1134. doi: 10.1002/mrm.23323. [DOI] [PMC free article] [PubMed] [Google Scholar]
- 14.Tropp JA, Gilbert AC. Signal recovery from random measurements via orthogonal matching pursuit. IEEE Trans Inf Theory. 2007;53:4655–4666. [Google Scholar]
- 15.Sussman MS, Vidarsson L, Pauly JM, Cheng HLM. A technique for rapid single-echo spin-echo T2 mapping. Magn Reson Med. 2010;64:536–545. doi: 10.1002/mrm.22454. [DOI] [PubMed] [Google Scholar]
- 16.Carr H, Purcell E. Effects of Diffusion on Free Precession in Nuclear Magnetic Resonance Experiments. Phys Rev. 1954;94:630–638. [Google Scholar]
- 17.Meiboom S, Gill D. Modified Spin-Echo Method for Measuring Nuclear Relaxation Times. Rev Sci Instrum. 1958;29:688. [Google Scholar]
- 18.Ben-Eliezer N, Sodickson DK, Block KT. Rapid and accurate T2 mapping from multi-spin-echo data using Bloch-simulation-based reconstruction. Magn Reson Med. 2015;73:809–817. doi: 10.1002/mrm.25156. [DOI] [PMC free article] [PubMed] [Google Scholar]
- 19.Ma D, Gulani V, Seiberlich N, et al. Magnetic resonance fingerprinting. Nature. 2013;495:187–192. doi: 10.1038/nature11971. [DOI] [PMC free article] [PubMed] [Google Scholar]
- 20.Gao Y, Chen Y, Ma D, et al. Preclinical MR fingerprinting (MRF) at 7 T: effective quantitative imaging for rodent disease models. NMR Biomed. 2015;28:384–394. doi: 10.1002/nbm.3262. [DOI] [PMC free article] [PubMed] [Google Scholar]
- 21.Chen Y, Payne K, Perara VS, et al. Inhibition of the sodium-calcium exchanger via SEA0400 altered manganese-induced T1 changes in isolated perfused rat hearts. NMR Biomed. 2012;25:1280–1285. doi: 10.1002/nbm.2799. [DOI] [PMC free article] [PubMed] [Google Scholar]
- 22.Wendland MF. Applications of manganese-enhanced magnetic resonance imaging (MEMRI) to imaging of the heart. NMR Biomed. 2004;17:581–594. doi: 10.1002/nbm.943. [DOI] [PubMed] [Google Scholar]
- 23.Zhu XH, Chen W. In vivo oxygen-17 NMR for imaging brain oxygen metabolism at high field. Prog Nucl Magn Reson Spectrosc. 2011;59:319–335. doi: 10.1016/j.pnmrs.2011.04.002. [DOI] [PMC free article] [PubMed] [Google Scholar]
- 24.Bun S-S, Kober F, Jacquier A, et al. Value of In Vivo T2 Measurement for Myocardial Fibrosis Assessment in Diabetic Mice at 11.75 T. Invest Radiol. 2012;47:319–323. doi: 10.1097/RLI.0b013e318243e062. [DOI] [PubMed] [Google Scholar]
- 25.Xue H, Shah S, Greiser A, et al. Motion correction for myocardial T1 mapping using image registration with synthetic image estimation. Magn Reson Med. 2012;67:1644–1655. doi: 10.1002/mrm.23153. [DOI] [PMC free article] [PubMed] [Google Scholar]


