Abstract
Emitters placed in an optical cavity experience an environment that changes their coupling to light. In the weak-coupling regime light extraction is enhanced, but more profound effects emerge in the single-molecule strong-coupling regime where mixed light-matter states form1,2. Individual two-level emitters in such cavities become non-linear for single photons, forming key building blocks for quantum information systems as well as ultra-low power switches and lasers3–6. Such cavity quantum electrodynamics has until now been the preserve of low temperatures and complex fabrication, severely compromising their use5,7,8. Here, by scaling the cavity volume below 40 nm3 and using host-guest chemistry to align 1-10 protectively-isolated methylene-blue molecules, we reach the strong-coupling regime at room temperature and in ambient conditions. Dispersion curves from >50 plasmonic nanocavities display characteristic anticrossings, with Rabi frequencies of 300 meV for 10 molecules decreasing to 90 meV for single molecules, matching quantitative models. Statistical analysis of vibrational spectroscopy time-series and dark-field scattering spectra provide evidence of single-molecule strong coupling. This dressing of molecules with light can modify photochemistry, opening up the exploration of complex natural processes such as photosynthesis9 and pathways towards manipulation of chemical bonds10.
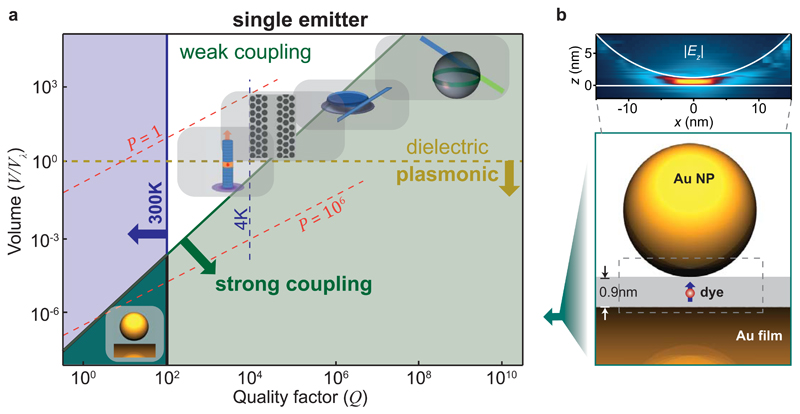
Creating strongly-coupled mixed states from visible light and individual emitters is severely compromised by the hundred-fold difference in their spatial localisation. To overcome this, high-quality cavities are used to boost interaction times and enhance coupling strengths. However in larger cavities the longer round trip for photons to return to the same emitter decreases the coupling, which scales as with the effective cavity volume V. This coupling has to exceed both the cavity loss rate κ and the emitter scattering rate γ, in order for energy to cycle back and forth between matter and light components, requiring 2g > γ, κ.11 For cryogenic emitters5,6 (laser-cooled atoms, vacancies in diamond, or semiconductor quantum dots), the suppressed emitter scattering allows large cavities (with high quality factor Q ∝ κ−1) to reach strong coupling. Severe technical challenges however restrict energy, bandwidth, size and complexity of devices. Progress towards room temperature is limited by the unavoidable increase in emitter scattering, and the difficulty of reducing the volume of dielectric-based microcavities at wavelength λ and refractive index n below Vλ = (λ/n)3. At room temperature, typical scattering rates for embedded dipoles γ ∼ kBT, implying Q<100 which requires cavities < 10-5 Vλ (Figure 1a, dark green shaded).
Figure 1. Comparing single molecule optical cavities.
a, Cavity Q-factors and effective volumes (compared to Vλ = (λ/n)3), showing strong-coupling (green), room-temperature (blue), and plasmonic (orange) regimes for single emitters. Icons (from right) show whispering gallery sphere, microdisk, photonic crystal, micropillar, and nanoparticle on mirror geometry (NPoM), with Purcell factor P (red) in µm−3. b, Schematic of NPoM, blue arrow in gap locates emitter transition dipole moment. Inset: simulated near-field of coupled gap plasmon in dashed box with maximum electric field enhancement ∼400, oriented vertically (z).
Improved confinement uses surface plasmons (Figure 1a) combining oscillations of free electrons in metals with electromagnetic waves12. While structured metal films can couple molecular aggregates of high oscillator strength, far too many molecules are involved for quantum optics. Recent studies reach 1000 molecules13–15, still far above 1-10 molecules that access quantum effects at room temperature.
To create such small nanocavities and orient single molecules precisely within them, we use bottom-up nano-assembly. Although field volumes of individual plasmonic nanostructures are too large1,2, stronger field enhancements occur within sub-nanometre gaps between paired plasmonic nanoparticles. We utilise the promising nanoparticle-on-mirror (NPoM) geometry16, placing emitters in the gap between nanoparticles and a mirror underneath (Figure 1b). This gap is accurately controlled to sub-nm, easily made by depositing monodisperse metal nanoparticles onto a metal film, straightforward to characterise, scalable, and repeatable17,18. The intense interaction between each nanoparticle and its image forms a dimer-like construct with enhancements |E|/|E0| ≃ 103 and an ultralow mode volume. We use 40 nm diameter gold nanoparticles (AuNP) on a 70 nm thick Au film, separated by a 0.9 nm molecular spacer (see below). The coupled plasmonic dipolar mode is localised in the gap (Figure 1b), with electric field oriented vertically (z). The resonant wavelength is determined by nanoparticle size and gap thickness, allowing it to be tuned from λ = 600 − 1200 nm17.
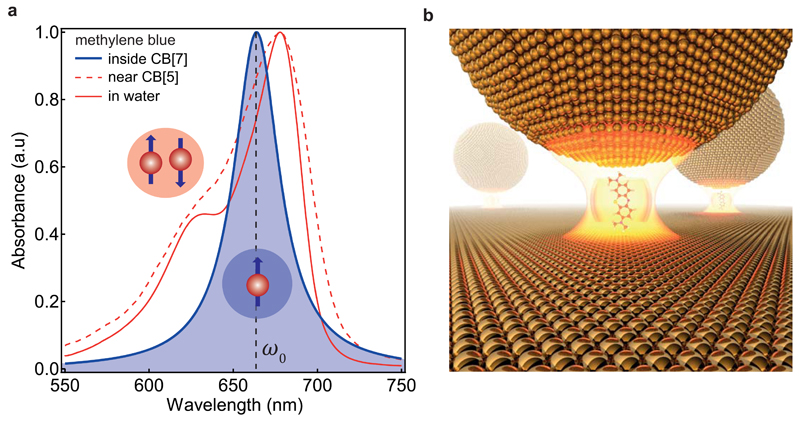
Several key aspects are critical to position a quantum emitter inside these small gaps. One is to prevent molecular aggregation, which commonly occurs. Second is to ensure the transition dipole μm is perfectly aligned with the gap plasmon (along z). We use a common dye molecule methylene blue (MB) with molecular transition at 665 nm, to which our plasmons are tuned. To avoid aggregation of the dye molecules and to assemble them in the proper orientation, we utilize the host-guest chemistry of macrocyclic cucurbit[n]uril molecules. These are pumpkin-shaped molecules with different hollow hydrophobic internal volume determined by the number of units in the ring n, in which guest molecules can sit (Fig.S1)19. Cucurbit[7]uril (CB[7]) is water soluble and can accommodate only one MB molecule inside. Encapsulation of MB inside CB[7] is confirmed from absorption spectroscopy (Figure 2a) since MB dimers (additional peak at 625nm, red) disappear on mixing low MB concentrations with CB[7] (1:10 molar ratio) (blue). Control experiments with smaller CB[5] molecules (into which MB cannot fit) do not remove this shoulder peak (dashed), ruling out parasitic binding. Placing single MB molecules in CB[7] thus avoids any aggregation. Carbonyl portals at either end of the 0.9 nm-high CB[n] molecules bind them with their rims flat onto the Au surface (Fig.2b). When a monolayer of CB[7] is first deposited on the gold mirror and suitably filled with MB molecules, Au NPs bind on top to form the desired filled nanocavity (Figure 2b, Methods) with the MB molecule aligned vertically in the gap.19 Previous studies with empty CBs show the gap is 0.9 nm with refractive index of 1.417.
Figure 2. Plasmonic nanocavity containing dye molecule.
a, Absorption spectrum of methylene blue (MB) in water, with (blue) and without (red) encapsulation in CBs of different diameter. b, Illustration of a MB molecule in cucurbit[n]uril guest in the nanoparticle on mirror geometry used.
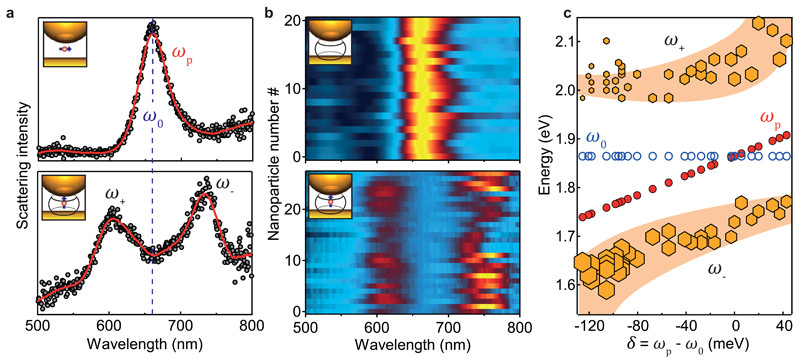
Dark-field scattering spectra from individual NPoMs show the effect of aligning the emitter in different orientations (Figure 3a). With μm parallel to the mirror (top, without CB the MB lies flat on the metal surface), the resonant scattering plasmonic peak is identical to NPoMs without any emitters. Instead, with μm perpendicular to the mirror (bottom), the spectra show two split peaks (ω+ and ω−) from the strong interaction between emitters and plasmon. We contrast three types of samples. Without dye (Figure 3b, top), a consistent gap plasmon (ωp) at 660±10 nm is seen. Small fluctuations in peak wavelength are associated with ±5 nm variations in nanoparticle size (SI Fig.S2). When this NPoM is partially filled with MB inside the CB[7], two peaks at 610 and 750 nm are seen either side of the absorption peak of MB at ω0 (Figure 3b, bottom), corresponding to formation of hybrid plasmon-exciton (‘plexciton’) branches, ω± = ω0 ± g/2. This yields a Rabi frequency g=380meV, confirmed by full 3D finite-difference time-domain (FDTD) simulations (SI Fig.S3). Unlike studies13,14 that show significant variations in ω±, we obtain highly consistent results, with no spectral wandering observed on individual NPoMs. With dye molecules perpendicular to the plasmon field (without CBs), only a gap-plasmon is seen (SI Fig.S4c). Molecules of MB self-assembling on Au orient flat to the surface, due to π-stacking interactions between the conjugated phenyl rings and the metal film20. Such controlled studies are essential to prove molecular coupling to the gap plasmon.
Figure 3. Strong coupling seen in scattering spectra of individual NPoMs.
a, Scattering spectra from isolated NPoM coupled with dye μm oriented (top) perpendicular and (bottom) parallel to |Ez| of gap plasmon (blue dashed line indicates dye absorption wavelength). b, Comparison of scattering spectra from different NPoMs (schematics inset), with gaps filled by CB[7] monolayer which are (top) empty, or (bottom) encapsulating MB dye molecules. c, Resonant positions of MB (ω0), plasmon (ωp) and hybrid modes (ω+ and ω−) as a function of extracted detuning. Marker size depicts the amplitude in scattering spectra.
To map the dispersion curve, we combine scattering spectra from different-sized nanoparticles plotted according to their detuning from the absorption (‘exciton’) resonance. Simulations from 40-60 nm nanoparticles in NPoMs (SI Fig.S5) show gap plasmons tuning across the exciton. A simple coupled-oscillator model matches the quantum mechanical Jaynes-Cummings picture13:
with plasmon and exciton resonance energies ωp and ω0, and detuning δ = ωp − ω0. Extracting ω± from the scattering spectra allows ωp to be calculated (knowing ω0 which does not show any spectral wandering). This fitting reveals typical anticrossing behaviour (Figure 3c) with g = 305 ± 8 meV at δ = 0. We find 2g/γpl ∼ 5, far into the strong coupling regime. A key figure of merit is the Purcell factor P = Q/V characterising different cavity systems (Figure 1a). For our plasmonic nanocavities P ∼ 3.5 × 10⁶) (SI Fig.S6), over an order of magnitude larger than state of the art photonic crystal cavities5 which have reached 105, while state-of-the-art planar micropillars21,22 attain 3×10⁵. The ultralow cavity volume arises here because field penetration into the gold is strongly reduced for such nanometre gaps (Fig.S9e). Such Purcell factors imply photon emission times below 100fs, seen as the ħ/Ω ∼30fs Rabi flopping, but unfeasibly short to measure directly.
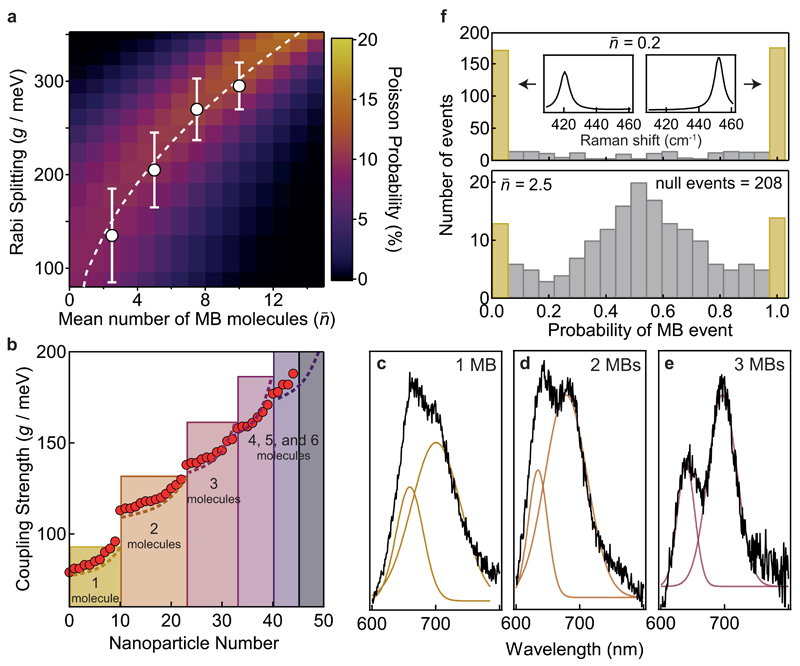
To probe single molecule strong coupling, we systematically decrease the number of MB molecules by reducing the ratio of MB:CB[7]. Previous studies and simple area estimates imply 100 CB[7] molecules lie inside each nanocavity (SI Fig.S9). With initial 1:10 molar ratio of MB:CB[7] the mean number of MB molecules within each mode volume is thus . We explore many plasmonic nanocavities with this mean dye number and below (Figure 4a). From the resulting spectra, we extract coupling strengths at different mean MB molecule numbers , and plot these along with the predicted coupling strength:
where μm = 3.8 D is the transition dipole moment of isolated MB molecules23. The probability of finding each coupling strength (Figure 4a, colour map) follows the Poisson distribution for n molecules under each nanoparticle. The range of Rabi splittings seen for which exceed thermal- and cavity-loss rates at room temperature, are consistent with our plasmonic nanocavity supporting single molecule strong coupling. Reassuringly the range of Rabi frequencies observed increases as the molecular concentration is reduced, as expected since similarly increases as observed in Fig.4a colour map.
Figure 4. Rabi splitting from few molecules.
a, Energy of Rabi oscillations (g) vs mean number of MB molecules (). Experimental (white) points with range of measured coupling strengths (error bars) and theoretical curve (dashed), colours represent expectation from Poisson probability distribution of n. b, Coupling strength extracted from different NPoMs in sample of . Theoretical coupling strength in perfect model (shaded bars) and random placement model (dashed lines). c-e, Scattering spectra for one, two and three molecules corresponding to b, with fits. f, Single-molecule probability histograms for derived from modified principal component analysis (SI S13), yellow bars show single molecule events. Inset shows the signature of the two different probabilities.
Direct proof of single molecule strong coupling is seen from the coupling strengths extracted from the lowest density samples () which show distinct systematic jumps matching the expected increase of gn from n = 1 − 3 molecules (Figure 4b, NPoMs sorted by increasing Rabi splitting). The range in each gn arises because single molecules are located at different lateral positions within the gap plasmon, thus coupling with different strengths (predictions shown as dashed lines). Experimentally, we find excellent agreement (with no fitting parameters) showing that a single MB molecule in our nanocavities gives 80-95 meV Rabi splittings. Further, we plot the scattering spectrum from n=1−3 molecules exhibiting clear increases in coupling strength. Additional proof of the single-molecule strong coupling is seen from the anti-crossing of plasmon and exciton modes for the subset with n=1 (see SI Fig.S20).
Fluorescence emitted by weakly coupled single-molecules follows the Purcell factor24–26. However such measurements fail here because resonantly pumping the molecular absorption also generates strong surface-enhanced resonant Raman scattering (SERRS) consisting of sharp lines with a strong background, that cannot be uniquely separated from photoluminescence (Figure 4c). This also obscures g(2) measurements typically used to confirm single photon emission from individual chromophores. Here we find extremely strong emission even though the dye molecules are within 0.5nm of absorptive gold27, due to the high radiative efficiency of our nanocavities. We harvest these strong SERS peaks to construct ‘chemical’ by using the well-established bianalyte technique with a second near-identical but distinguishable molecule to prove single-molecule statistics (Fig.4f and details in SI S15-17). As clearly evident, at the lowest concentrations we find that two molecules are almost never found at the same time, and we are truly in the single molecule regime. While this does not guarantee direct correlation with single-molecule strong coupling situations it proves the statistical probability of single-molecules at this concentration. Convincing proof of single-molecules is also seen from the spectral diffusion of vibrational lines in time-series SERS scans from nanoparticles exhibiting single-molecule strong coupling (SI Fig.S18,S19).
Combining the gap plasmon with oriented host-guest chemistry in aqueous solution to easily create enormous numbers of strongly-coupled few-molecule nanocavities at room temperature, ambient conditions, and which are optically addressable, is of major utility. We expect applications in many fields, including single photon emitters, photon blockade9, quantum chemistry28–30, nonlinear optics, and molecular reactions.
Supplementary Information
Supplementary Information accompanies this paper at www.nature.com/nature
Acknowledgements
We acknowledge financial support from EPSRC grants EP/G060649/1 and EP/I012060/1, and ERC grant LINASS 320503. RC acknowledges support from the Dr. Manmohan Singh scholarship from St. John’s College. FB acknowledges support from the Winton Programme for the Physics of Sustainability. SJB acknowledges support from the European Commission for a Marie Curie Fellowship (NANOSPHERE, 658360).
Footnotes
Contributions
JJB and RC conceived and designed the experiments. RC performed the experiments with inputs from FB and BdN. RC performed the simulation and analytical modal with inputs from JJB, PF, OH, AD and ER. RC and JJB analysed the data. SJB and OAS synthesized cucurbit[n]uril and provided inputs on fabrication and characterisation of samples. RC and JJB wrote the manuscript with input from all authors.
Author information
Research data supporting “Single-molecule strong coupling at room temperature in plasmonic nanocavities” https://www.repository.cam.ac.uk/handle/1810/254579
Competing financial interests: The authors declare no competing financial interests.
References
- 1.Tame MS, et al. Quantum plasmonics. Nat Phys. 2013;9:329–340. [Google Scholar]
- 2.Koenderink AF, Alù A, Polman A. Nanophotonics: Shrinking light-based technology. Science. 2015;348:516–521. doi: 10.1126/science.1261243. [DOI] [PubMed] [Google Scholar]
- 3.Sato Y, et al. Strong coupling between distant photonic nanocavities and its dynamic control. Nat Photonics. 2012;6:56–61. [Google Scholar]
- 4.Liu X, et al. Strong light–matter coupling in two-dimensional atomic crystals. Nat Photonics. 2015;9:30–34. [Google Scholar]
- 5.Yoshie T, et al. Vacuum Rabi splitting with a single quantum dot in a photonic crystal nanocavity. Nature. 2004;432:200–203. doi: 10.1038/nature03119. [DOI] [PubMed] [Google Scholar]
- 6.Thompson JD, et al. Coupling a Single Trapped Atom to a Nanoscale Optical Cavity. Science. 2013;340:1202–205. doi: 10.1126/science.1237125. [DOI] [PubMed] [Google Scholar]
- 7.Faraon A, et al. Coherent generation of non-classical light on a chip via photon-induced tunnelling and blockade. Nat Phys. 2008;4:859–863. [Google Scholar]
- 8.Gröblacher S, et al. An experimental test of non-local realism. Nature. 2007;446:871–875. doi: 10.1038/nature05677. [DOI] [PubMed] [Google Scholar]
- 9.Coles DM, et al. Strong coupling between chlorosomes of photosynthetic bacteria and a confined optical cavity mode. Nat Commun. 2014;5 doi: 10.1038/ncomms6561. [DOI] [PubMed] [Google Scholar]
- 10.Shalabney A, et al. Coherent coupling of molecular resonators with a microcavity mode. Nat Commun. 2015;6 doi: 10.1038/ncomms6981. [DOI] [PMC free article] [PubMed] [Google Scholar]
- 11.Törmä P, Barnes WL. Strong coupling between surface plasmon polaritons and emitters: a review. Rep Prog Phys. 2015;78:013901. doi: 10.1088/0034-4885/78/1/013901. [DOI] [PubMed] [Google Scholar]
- 11.Novotny L, Hecht B. Principles of Nano-Optics. Cambridge University Press; 2006. [Google Scholar]
- 13.Zengin G, et al. Realizing Strong Light-Matter Interactions between Single-Nanoparticle Plasmons and Molecular Excitons at Ambient Conditions. Phys Rev Lett. 2015;114:157401. doi: 10.1103/PhysRevLett.114.157401. [DOI] [PubMed] [Google Scholar]
- 14.Zengin G, et al. Approaching the strong coupling limit in single plasmonic nanorods interacting with J-aggregates. Sci Rep. 2013;3 doi: 10.1038/srep03074. [DOI] [PMC free article] [PubMed] [Google Scholar]
- 15.Schlather AE, Large N, Urban AS, Nordlander P, Halas NJ. Near-Field Mediated Plexcitonic Coupling and Giant Rabi Splitting in Individual Metallic Dimers. Nano Lett. 2013;13:3281–3286. doi: 10.1021/nl4014887. [DOI] [PubMed] [Google Scholar]
- 16.Ciracì C, et al. Probing the Ultimate Limits of Plasmonic Enhancement. Science. 2012;337:1072–1074. doi: 10.1126/science.1224823. [DOI] [PMC free article] [PubMed] [Google Scholar]
- 17.de Nijs B, et al. Unfolding the contents of sub-nm plasmonic gaps using normalising plasmon resonance spectroscopy. Faraday Discuss. 2015 doi: 10.1039/C4FD00195H. [DOI] [PubMed] [Google Scholar]
- 18.Benz F, et al. Nanooptics of Molecular-Shunted Plasmonic Nanojunctions. Nano Lett. 2015;15:669–674. doi: 10.1021/nl5041786. [DOI] [PMC free article] [PubMed] [Google Scholar]
- 19.Kasera S, Herrmann LO, Barrio J del, Baumberg JJ, Scherman OA. Quantitative multiplexing with nano-self-assemblies in SERS. Sci Rep. 2014;4 doi: 10.1038/srep06785. [DOI] [PMC free article] [PubMed] [Google Scholar]
- 20.Netzer FP, Ramsey MG. Structure and orientation of organic molecules on metal surfaces. Crit Rev Solid State Mater Sci. 1992;17:397–475. [Google Scholar]
- 21.Vahala KJ. Optical microcavities. Nature. 2003;424:839–846. doi: 10.1038/nature01939. [DOI] [PubMed] [Google Scholar]
- 22.Khitrova G, Gibbs HM, Kira M, Koch SW, Scherer A. Vacuum Rabi splitting in semiconductors. Nat Phys. 2006;2:81–90. [Google Scholar]
- 23.Patil K, Pawar R, Talap P. Self-aggregation of Methylene Blue in aqueous medium and aqueous solutions of Bu4NBr and urea. Phys Chem Chem Phys. 2000;2:4313–4317. [Google Scholar]
- 24.Akselrod GM, et al. Probing the mechanisms of large Purcell enhancement in plasmonic nanoantennas. Nat Photonics. 2014;8:835–840. [Google Scholar]
- 25.Anger P, Bharadwaj P, Novotny L. Enhancement and Quenching of Single-Molecule Fluorescence. Phys Rev Lett. 2006;96:113002. doi: 10.1103/PhysRevLett.96.113002. [DOI] [PubMed] [Google Scholar]
- 26.Kinkhabwala A, et al. Large single-molecule fluorescence enhancements produced by a bowtie nanoantenna. Nat Photonics. 2009;3:654–657. [Google Scholar]
- 27.Kravtsov V, Berweger S, Atkin JM, Raschke MB. Control of Plasmon Emission and Dynamics at the Transition from Classical to Quantum Coupling. Nano Lett. 2014;14:5270–5275. doi: 10.1021/nl502297t. [DOI] [PubMed] [Google Scholar]
- 28.Hutchison JA, Schwartz T, Genet C, Devaux E, Ebbesen TW. Modifying Chemical Landscapes by Coupling to Vacuum Fields. Angew Chem Int Ed. 2012;51:1592–1596. doi: 10.1002/anie.201107033. [DOI] [PubMed] [Google Scholar]
- 29.Galego J, Garcia-Vidal FJ, Feist J. Cavity-induced modifications of molecular structure in the strong coupling regime. arXiv:1506.03331 [quant-ph] 2015 [Google Scholar]
- 30.Feist J, Garcia-Vidal FJ. Extraordinary exciton conductance induced by strong coupling. Phys Rev Lett. 2015;114 doi: 10.1103/PhysRevLett.114.196402. [DOI] [PubMed] [Google Scholar]
Associated Data
This section collects any data citations, data availability statements, or supplementary materials included in this article.


