

Abstract
Background
Understanding individual patient host-response to viruses is key to designing optimal personalized therapy. Unsurprisingly, in vivo human experimentation to understand individualized dynamic response of the transcriptome to viruses are rarely studied because of the obviously limitations stemming from ethical considerations of the clinical risk.
Objective
In this rhinovirus study, we first hypothesized that ex vivo human cells response to virus can serve as proxy for otherwise controversial in vivo human experimentation. We further hypothesized that the N-of-1-pathways framework, previously validated in cancer, can be effective in understanding the more subtle individual transcriptomic response to viral infection.
Method
N-of-1-pathways computes a significance score for a given list of gene sets at the patient level, using merely the ‘omics profiles of two paired samples as input. We extracted the peripheral blood mononuclear cells (PBMC) of four human subjects, aliquoted in two paired samples, one subjected to ex vivo rhinovirus infection. Their dysregulated genes and pathways were then compared to those of 9 human subjects prior and after intranasal inoculation in vivo with rhinovirus. Additionally, we developed the Similarity Venn Diagram, a novel visualization method that goes beyond conventional overlap to show the similarity between two sets of qualitative measures.
Results
We evaluated the individual N-of-1-pathways results using two established cohort-based methods: GSEA and enrichment of differentially expressed genes. Similarity Venn Diagrams and individual patient ROC curves illustrate and quantify that the in vivo dysregulation is recapitulated ex vivo both at the gene and pathway level (p-values≤0.004).
Conclusion
We established the first evidence that an interpretable dynamic transcriptome metric, conducted as an ex vivo assays for a single subject, has the potential to predict individualized response to infectious disease without the clinical risks otherwise associated to in vivo challenges. These results serve as foundational work for personalized “virograms”.
Keywords: personal transcriptome, rhinovirus, PBMC, genomic response, virogram, Similarity Venn Diagrams
Introduction
Transcriptomic analysis of the response to a virus can be used for various purposes, involving the understanding of its relationship to disease progression or severity. In the context of respiratory diseases such as Influenza, Human rhinovirus (HRV), or Respiratory syncytial virus (RSV), many studies involve finding the viral response of infected hosts. However, in many cases, the course of a virus infection may be relatively short. This implies high difficulties for obtaining genetic data in a timely manner. Probably for ethical reasons, most of those studies rely on animal models [1–3] infected with virus to assess the within-host evolution of the virus. Other studies overlook the progression of already infected patients [4]. Less than five studies go as far as inoculating healthy human patients with those viruses to study in vivo the progression of the disease [5] and procuring transcriptomes. Although ex vivo experiments are often undertaken before and after virus infection, they are usually performed for the analysis of a handful of single-locus gene expression. Few human cell transcriptome derived from ex vivo with paired samples before and after virus infection were available and deposited [6] in the Gene Expression Omnibus database (GEO).
Interestingly, antibiograms are well-established assays that provide precision antibiotherapy to patients. They involve cultivating bacteria infecting a specific organ of a patient, and subjecting them to a number of tests to characterize the pathogen and its resistance to a number of distinct antibiotics. In contrast, the field of infectious disease has not produced similar assays to test the host (human subject) exposed to viruses. Therefore, there is an opportunity to improve precision medicine by establishing the personal response to viruses that may impact one’s disease treatment (e.g. Chronic Obstructive Lung Disease). We conceived the following ex vivo assays and expression analysis methods in order to provide tools that would allow systematic non-invasive investigations of the dynamic transcriptome response to viruses. As viruses infect cells, the viral transformation of these cells caused by the introduction of viral DNA or RNA is associated with substantial regulatory changes leading to favoring virus replication over normal cell functions. We thus use the dynamics transcriptomic response as a proxy for the sum of all upstream regulatory disruption caused by the viral infection, an assessment of the viral regulome specific to a personal genome – or simply said: “virogram”.
In this study, we aimed at analyzing the transcriptomic response of ex vivo virus-exposed Peripheral Blood Mononuclear Cells (PBMC) human cells, and compare it to the in vivo response in the same conditions. We hypothesized that ex vivo analyses can recapitulate in vivo dysregulation in this experimental context. To this end, we used well-established enrichment methodologies such as GSEA, to assess the pathways at play in presence of a virus. However, those methods of analysis use cohort-based models, which create predictive models based on average/commonly found features across patients, thus overlooking individualized transcriptomic response to stressors that may reveal the summative effect of common as well as private (i) genetic polymorphisms and (ii) epigenetic modifications.
N-of-1-pathways is a framework dedicated to the personalized medicine field that we initially proposed in the context of cancer analyses [7, 8]. It was successfully applied to lung adenocarcinoma visualization of single patient survival and proved to unveil biologically significant dysregulated pathways by using only one pair of samples taken from the same patient in two different conditions [7] (such as before and after treatment or uninvolved vs tumoral cells). It was also applied in ovarian and breast cancer cell lines to confirm the unsupervised identification of dysregulated pathways after a knockdown of PTBP1 and PTBP2 genes that control alternative splicing [8]. In the current study, we aimed at showing that the same N-of-1-pathways framework can be used in very different conditions than cancer such as the transcriptomic response of virus stress.
One component of N-of-1-pathways design relies on the calculation of the semantic similarity of pathways. Therefore, we focused our analyses on the Gene Ontology (GO) database, which regroups genes into biologically meaningful gene sets, connected through an ontology tree. Several tools were developed for analyzing those “GO Terms”, involving measures of similarity based on the topology of the ontology. In this paper, we propose a novel Similarity Venn Diagram representation for helping readers to understand not only the overlap between two lists of GO Terms, but also their similarity, based on an information-theory equation measuring the semantic similarity between two GO Terms. Further, we demonstrated that this representation could also be used in a more general comparison of two lists where a measure of similarity exists for comparing its elements.
Therefore, the major goals of this study are i) to characterize the mechanistic response to rhinovirus, ii) to validate our patient-centered framework, N-of-1-pathways, in alternative conditions, and iii) to extend the representation of classic Venn diagrams from simple overlap to more complex similarity comparisons.
Materials and methods
PBMCs incubated with viruses that generated the “Human ex vivo infected” dataset
The live PBMCs had been isolated from blood samples collected from four human subjects under a protocol approved by The University of Arizona Internal Review Board. Whole blood was obtained from donors and placed in Becton Dickenson’s CPT tubes that were centrifuged according to standard protocols to obtain PBMCs, and then each aliquoted in two paired samples. Each sample of the pair was subsequently exposed to and incubated with either (i) Human Rhinovirus serotype 16 (ex vivo infected sample) or to (ii) sterile medium (control ex vivo non-infected sample) and incubated at 37°C in 5% CO2 for 24 hours. This protocol resulted in 4 ex vivo infected + 4 ex vivo controls = 8 paired samples. RNA was extracted from these samples, amplified, tagged, and hybridized on Affymetrix Human Gene 1.0 ST microarrays according to standard operating procedures. Gene expression data were submitted to Gene Expression Omnibus (GEO; GSE60153, http://www.ncbi.nlm.nih.gov/geo/) and thus generated the “Human ex vivo infected” dataset (Table 1).
Table 1.
Gene expression dataset description.
| Dataset | Human ex vivo infected dataset | Human in vivo infected dataset | |
|---|---|---|---|
| References | Authors | Gardeux V, Bosco A, et al. (present paper) | Zaas A. K. et al. Cell Press 2009 [5] |
| Source (GEO) | GSE60153 (new dataset) | GSE17156 | |
|
| |||
| Platform | Affymetrix GeneChip® Human Gene 1.0ST | Affymetrix Human Gene U133A 2.0 | |
|
| |||
| Probes measured | 33297 | 22277 | |
| Genes mapped to probes | 19915 | 14288 | |
|
| |||
| Human Subjects (paired samples) | Total | 4 | 9 |
| Control | 4P PBMCs incubated with control medium | 9P PBMCs collected 24hrs prior to infection | |
| Case | 4P PBMCs incubated ex vivo with virus | 9P PBMCs collected at peak symptoms post intranasal virus inoculation (6hrs – 3days). | |
|
| |||
| Viral infection experiment | Live human PBMC cells infected ex vivo & incubated with Human Rhinovirus serotype 16 (ATCC® VR-283) | Human subjects inoculated in vivo intra-nasally with Human Rhinovirus serotype 39 (Charles River Lab; Malvern, PA) | |
Indicates paired samples derived from the same individual rhinovirus-exposed with matched non-exposed PBMCs samples.
Dataset and preprocessing
Robust Multiple-array Average (RMA) normalization [9] was applied on each patient data independently (2 paired samples at a time to avoid bias in the single-patient experiments) using Affymetrix Power Tools (APT) [10]. We also used an external dataset downloaded from the GEO repository on 07/14/2014 comprising a cohort of 20 healthy patients who were inoculated with the rhinovirus. Blood samples were taken before inoculation and during the peak of symptoms on the disease. Among those 20 patients, 10 were defined as symptomatic and the other 10 as asymptomatic. We used the 9 microarrays available paired data from the symptomatic patients and normalized them using the same RMA normalization technique. Table 1 recapitulates the content of each of those two datasets.
Gene sets
We aggregated genes into pathway-level mechanisms using the org.Hs.eg.db package [11] (Homo Sapiens) of Bioconductor [12], available for R statistical software [13]. We used two different gene sets databases:
Gene Ontology (GO) Biological Processes (GO-BP) [14, 15]. Hierarchical GO terms were retrieved using the org.Hs.egGO2ALLEGS database (downloaded on 05/15/2013), which contains a list of genes annotated to each GO term (gene set) along with all of its child nodes according to the hierarchical ontology structure.
KEGG pathways [16, 17] were retrieved using the org.Hs.egPATH database (download 05/15/2013).
Gene sets included in the study comprised between 15 and 500 genes (among the genes measured by the microarray). This led to a total of 3234 GO-BP gene sets and 205 KEGG pathway gene sets. This filtering protocol follows the default one used in GSEA and a protocol we have previously identified as optimal for these studies [7, 8, 18–21].
Gene Sets Enrichment Analysis (GSEA)
Gene set enrichment analysis was conducted on both datasets. The GSEA v2.0.10 software [22] was used with the default parameters except for the permutation parameter selection, which was set to “gene set” instead of “phenotype”. Gene set permutation was chosen to achieve enough statistical power for permutation resampling due to the small number of samples. Only dysregulated GO-BP terms and KEGG pathways reaching the False Discovery Rate (FDR)≤5% significance threshold were retained for further analysis. It resulted in a list of 399 dysregulated GO-BP terms between the non-exposed and rhinovirus-exposed samples for the ex vivo dataset, and 194 GO-BP terms and 11 KEGG pathways for the in vivo dataset. The complete lists of results from GSEA are available as Supplement File 1 – GSEA.
Differentially Expressed Genes (DEG) Calculation
Differentially expressed genes (DEG) between non-exposed and rhinovirus-exposed samples were calculated using the SAMR package in R statistical software [23]. Genes reaching the FDR≤5% threshold were considered significantly dysregulated between the two conditions. Those protocols resulted in a list of 458 differentially expressed genes (DEG) found significantly dysregulated in the ex vivo dataset and 709 DEG in the in vivo dataset. The complete lists of DEG are available as Supplement File 2 – DEG+Enrichment.
DEG enriched into GO-BP terms (DEG+Enrichment)
Differentially expressed genes (DEG) were enriched into GO-BP terms using the DAVID website [24, 25]. GO-BP terms reaching the FDR≤5% threshold were considered significantly enriched. It resulted in a list of 111 dysregulated GO-BP terms between the non-exposed and rhinovirus-exposed samples for the ex vivo dataset, and 20 GO-BP terms for the in vivo dataset. The complete lists of enriched pathways from DEG are available as Supplement File 2 – DEG+Enrichment.
Information Theoretic Similarity (GO-ITS)
We calculated the similarity between GO-BP terms using Jiang’s information theoretic similarity [26] that ranges from 0 (no similarity) to 1 (perfect match). We have previously shown that a GO-ITS score ≥ 0.7 robustly corresponds to highly similar GO terms using different computational biological validations: protein interaction [27, 28], human genetics [29], and Genome-Wide Association Studies [30]. GO-ITS was calculated on each distinct pair among the 3234 GO terms of size ≥15 and ≤500, leading to 10,458,756 pairs of which 59,577 have a GO-ITS ≥ 0.7 (≈5.6 out of 1,000).
Novel Similarity Venn Diagram
In order to compare the different list of dysregulated GO-BP terms, we computed uncommon Venn Diagrams. Since every two GO-BP terms possess a measurable degree of similarity (see GO-ITS definition), it is possible to compare the two sets not only by direct overlap but also by degree of similarity. For each Similarity Venn Diagram, we calculated the number of GO-BP terms similar to each of the two sets using a strong similarity GO-ITS threshold ≥ 0.7 (≈0.0056 pairs of all GO terms pairs meet this stringent criteria). This leads, for each Similarity Venn Diagram, to two additional values: the number of pathways (i) belonging to the set A and similar to the set B and (ii) vice-versa. If we take only the intersection of those two sets, we obtain the traditional Venn Diagram overlap. Of note, this technique may be extended to as many sets as needed, and different representations can be used. Figure 1 shows three possible representations of those Novel Similarity Venn Diagrams, the first one (Panel A) being the one we chose for this paper, because of its practicality for two sets studies. The source code and GO-GO similarity matrix used for computing the Similarity Venn Diagrams in this manuscript are available at http://lussierlab.org/publications/SimilarityVenn.
Figure 1. Similarity Venn Diagrams.
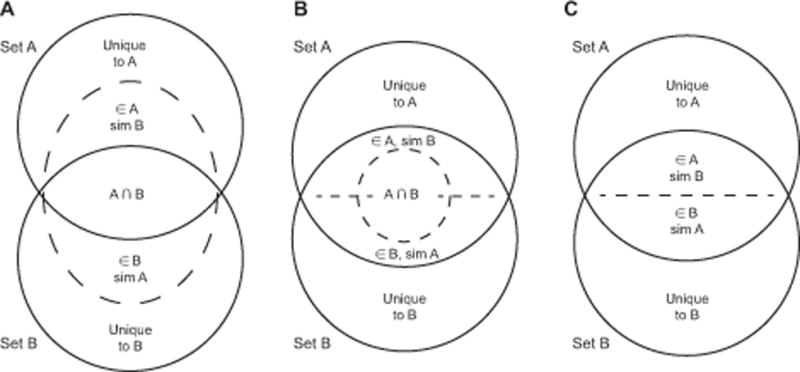
This Figure shows three possible representations of Similarity Venn Diagrams. Panels A and B are an extension of the traditional Venn Diagram representation. They contain the same overlapping number of entities in the middle and also two extra numbers describing the similarity of each set to the other. This similarity depends on a threshold chose for assessing two entities to be significantly similar (in the following paper, we chose GO-ITS ≥ 0.7). While Panel A is the most ergonomic representation with 2 sets, Panels B and C are easier to represent and apprehend in higher dimensions (see Supp. Figure S1 for a few possible extensions with 3 sets). Panel C is the simplest representation overall, but merges the overlap with the similarity, which displays less information.
Similarity Contingency Table
Further, we can calculated the statistical significance of the similarity for the Similarity Venn Diagrams between two sets (here called A and B). We proposed a statistic based on the following two steps: 1) among all elements in set A and all elements in set B, taken from the statistical universe Ω, identify similar pairs among “every possible pair combinations from set A and set B” (denoted “A×B”), and 2) compare this value against all the pairs that are similar in Ω × Ω. To this end, we propose a Similarity Contingency Table in which conventional calculations of Odds Ratio and enrichment can be calculated (such as Fisher’s Exact Test). Table 2 shows this Similarity Contingency Table in detail, with a numeric example taken from Figure 2.
Table 2. Similarity Contingency Table for computing significance of the similarity in a Similarity Venn Diagram.
This table shows a numeric example from Figure 2, where we have two sets of GO-Terms A (|A| = 399) and B (|B| = 111). There are 399×111 possible pairs between sets A and B (|A×B| = 44,289) among which we found 1,730 pairs that have an ITS≥0.7. Moreover, the statistical universe Ω contains 3,234 GO-Terms which leads to a total number of possible pairs of |Ω × Ω| = 10,458,756, among which we found 58,577 pairs that have a GO-ITS≥0.7. A Fisher’s Exact Test gives an Odds Ratio of 7.28 and a very significant p-value < 1.0E-100, which implies that the similarity between the two sets is high.
| Pair with similar elements | Pair with NOT similar elements | |
|---|---|---|
| Pair in Venn (∈ A×B) | 1,730 | 42,559 |
| Pair NOT in Venn (∉ A×B) | 57,847 | 10,356,620 |
LEGEND: ∈ “is an element of”; ∉ “is not an element of”; Background = total number of possible pairs (|Ω × Ω|)
Figure 2. Robustness of pathways enriched separately in the two datasets is confirmed by consistency of GSEA and DEG+Enrichment.
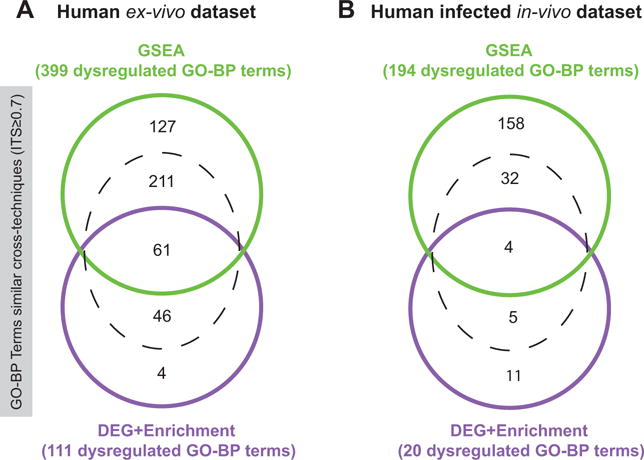
Those specifically-designed Similarity Venn Diagrams were obtained by two different enrichment techniques tested subsequently in two distinct datasets: human in vivo infection and human ex vivo infection. Their particularity is to show both overlap and similarity across two lists of enriched GO-BP terms (Methods: Similarity Venn Diagrams). Hence, by taking each list as reference reciprocally, this leads to two different numbers of similarities (one from the perspective of each list, visible in the additional dotted-delimited space). For example, in Panel A, 61 GO-BP terms are found overlapping between the two methods, and an additional 211 (among the 399 dysregulated GO-BP terms unveiled by GSEA) are similar to the list of pathways unveiled by the DEG+Enrichment method in the ex vivo dataset (GO-ITS cutoff ≥ 0.7). The complete lists of overlapping and similar pathways from the two diagrams are available as Supplement File 5 – Figure 2. Of note, only ~5.6 out of 1000 pairs of GO terms are found with GO-ITS≥0.7 among all possible pairs of GO-BP terms (Methods: GO-ITS), thus the “observed” similarity of the above Venn Diagrams far surpasses the “expected” one and is very significant (Panel A: Similarity Odds Ratio≈7.28, p<10−100; Panel B: Similarity Odds Ratio≈2.33, p=9.73 × 10⁻⁸).
GO-Modules
We previously developed GO-Module [31] to synthesize and visualize enriched GO terms as a network. GO-Module reduces the complexity of nominal lists of GO results into compact modules organized in two distinct ways: by (i) constructing modules from significant GO terms based on hierarchical knowledge, and (ii) refining the GO terms in each module to distinguish the most significant terms (key terms of the module), subsumed terms to the Key term and terms of lesser importance (grey in Figure 3).
Figure 3. Concordance of ex vivo and in vivo human studies.
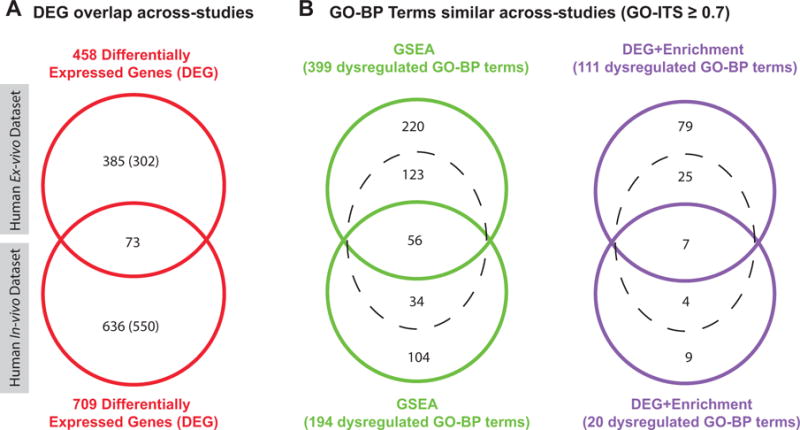
These Venn Diagrams show the overlap and similarity of results unveiled across the two studies. Panel A shows the overlap between the two lists of dysregulated genes found using SAMR method (Methods: DEG calculation). Since the two studies used two different microarray chips, we showed in parenthesis the number of dysregulated genes that can be found in the common background of both chips (common background = 12819 genes). The overlap is very significant (Fisher’s Exact Test p=3.41E-25; Odds Ratio=5.226). Panel B shows the GO-BP terms that are overlapping or similar across both datasets by two different techniques: GSEA and DEG+Enrichment. The complete lists of overlapping and similar pathways/DEG from the three diagrams are available as Supplement File 6 – Figure 3.
N-of-1-pathways framework
N-of-1-pathways [7, 8] is a methodology unveiling dysregulated pathways from only two paired samples. In this study, it was applied independently for each patient, on the paired non-exposed and rhinovirus-exposed samples in both in vivo and ex vivo datasets. The N-of-1-pathways framework and software identifying the dysregulated pathways (the scoring method) are modular and several different models can be substituted for the “pathway identification module”:
Wilcoxon model. The “Wilcoxon” model was already validated on a retrospective lung adenocarcinoma survival prediction study [7] and in vitro using both ovarian and breast cancer cell lines to identify an experimentally knocked down pathway [8]. This model starts by restricting the gene expression data to the genes belonging to the considered gene set. Then it applies a Wilcoxon signed-rank test of the two restricted vectors of gene expressions to assess the dysregulation of this gene set. Basically, this model recognizes gene sets having an over-representation of up-regulated genes compared to down-regulated genes, or vice versa. Two different methods were used to adjust p‐values for multiple comparisons: Bonferroni (for a more stringent set of results) and Benjamini and Hochberg (False Discovery Rate; FDR) [32]. In each paired sample, only dysregulated pathways with adjusted p-values following FDR≤5% or Bonf.≤5% were retained for further analysis. The complete lists of dysregulated pathways unveiled from the Wilcoxon model for each patient are available as Supplement File 3 – Wilcoxon.
Single-Sample GSEA or ssGSEAFC model. The ssGSEA software is available from the GSEA portal (http://www.broadinstitute.org/gsea/index.jsp) and does not have a publication describing how its single sample method differs from the described cross-sample GSEA v2.0.10 software [22]. Although without published evaluation (simulation or experimental) by the method’s developers, ssGSEA was utilized on single samples [33]. We have previously extended the use of ssGSEA in the context of paired samples within the N-of-1-pathways framework as an alternative to the Wilcoxon model. In our implementation, we used the “ssGSEAPreranked” version that is applied on a pre-ranked list of genes and computes a permutation-based p-value for each gene set. In the context of our paired samples framework we pre-ranked the genes according to their Fold Change (FC) between non-exposed and rhinovirus-exposed samples calculated separately for every patient. This usage of ssGSEA was never formally described, so we called this model ssGSEAFC in order to show its specific application to Fold Change (FC) in paired data. The complete lists of dysregulated pathways obtained from this ssGSEAFC model for each patient are available as Supplement File 4 – ssGSEA.
Principal Component Analysis (PCA)
The PCA was computed using the “FactoMineR” package in R (with default parameters). We first computed the matrix of p-values computed for every pathway assessed for each patient. Then, these p-values were transformed into Z-scores using an inverse standard Normal distribution (Z-score = abs(qnorm(p-value/2)) in R. The PCA was finally applied on this matrix of Z-scores.
Results
Comparison of cohort-based results within the ex vivo and in vivo studies
We compared the concordance of the results unveiled from cohort-based methods (conventional) across four patients. We applied two well-established, cohort-level methods: GSEA (Methods: GSEA) and DEG+Enrichment (Methods: DEG+Enrichment) in the two datasets by comparing the virus-exposed to the non-exposed samples. In order to visualize their concordance, we plotted Similarity Venn Diagrams (Methods: Similarity Venn Diagram) between the results unveiled by GSEA and DEG+Enrichment (at FDR≤5%), separately within the ex vivo and the in vivo datasets. Figure 2 shows the overlap as well as the similarity between the two techniques. Supplement Tables S1&S2 recapitulate the pathways found dysregulated by both techniques.
Comparison of the individual results to cohort-based results across the ex vivo and in vivo studies
After having established the concordance of results of the two cohort-level methods within each study, we aimed at comparing the two studies together. Figure 3, Panel A shows a standard Venn Diagram comparing the differentially expressed genes unveiled in each study (Methods: DEG calculation). It reveals a very strong overlap between the in vivo and ex vivo studies. The full list of overlapping DEG can be found in Supplement Table S3. Figure 3, Panel B contains two Similarity Venn Diagrams, the green one representing the overlap and similarity between the GO-BP terms unveiled by GSEA across the two studies, and the purple one representing the same information, but when applying the DEG+Enrichment method. The intersections of the two lists of dysregulated pathways -whether differentially expressed genes or dysregulated pathways- are very significant (Panel A: Odds Ratio≈5.226, p=3.41 × 10⁻²⁵; Panel B-Green Diagram: Similarity Odds Ratio≈1.95, p=3.69 × 10−68; Panel B-Purple Diagram: Similarity Odds Ratio≈3.04, p=5.85 × 10⁻⁹).
In order to understand the biological relevancy of the GO-BP terms unveiled across the two studies (in vivo and ex vivo), we displayed the 56 GO-BP Terms found dysregulated by the GSEA method as a network (Figure 4). The connections between the GO-BP Terms are inferred from the ontology topology, which helps to see the groups of terms interconnected. Table 3 also recapitulates the seven GO-BP terms concordantly found dysregulated by the DEG+Enrichment method.
Figure 4. Overlapping GO-BP Terms between ex vivo and in vivo studies by GSEA method.
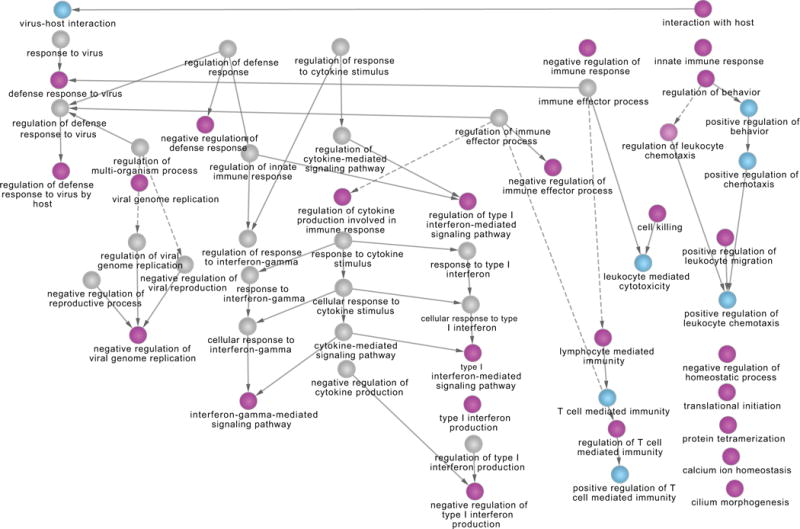
This network represents the GO-BP terms found commonly dysregulated between the ex vivo and in vivo studies by GSEA (Figure 2, left of Panel B). For better readability, we first reduced the size of the network using the GO-Module (Methods: GO-Module) method. The majority of the network shows a competent host innate immune response, with the subset of interferons I and Gamma among cytokines (center) and the cellular response of T-cells lymphocytes among leucocytes (right). The host-response to virus is shown in the hierarchies of the leftmost part of the network, and a few dissociated terms are left in the bottom right part.
Table 3. Overlapping GO-BP Terms between ex vivo and in vivo studies when DEG+Enrichment is applied.
These terms correspond to the overlap in the rightmost (Purple, right of Panel B) Similarity Venn Diagram of Figure 3.
| GO Term | Description |
|---|---|
| GO:0009615 | response to virus |
| GO:0006955 | immune response |
| GO:0007267 | cell-cell signaling |
| GO:0008285 | negative regulation of cell proliferation |
| GO:0009719 | response to endogenous stimulus |
| GO:0009725 | response to hormone stimulus |
| GO:0010033 | response to organic substance |
Concordant dysregulated pathways unveiled between infected and uninfected samples
We applied the Wilcoxon model of the N-of-1-pathways framework for each patient’s paired data between the control sample and the one subject to rhinovirus (Methods: N-of-1-pathways). The aim of this particular comparison was to identify the pathways dysregulated ex vivo in presence of a virus for each patient independently. Then, we aggregated the dysregulated pathways obtained for each patient to identify the pathways commonly dysregulated. Table 4 shows the whole list of GO-BP Terms and KEGG pathways (Methods: Gene sets) found significantly dysregulated across the four patients (Bonf.≤5%). The results are structured according to the ontology structure for better clarity. We can see pathways such as “response to virus” or “Cytosolic DNA-sensing pathway”, which are obviously biologically relevant regarding the studied phenotype. Taken together, those results show that: 1) the experimental protocol used is viable, and 2) the N-of-1-pathways methodology is able to uncover relevant pathways in this context. Moreover, we can see a certain “concordance” in the direction of dysregulation unveiled in all those pathways. For example, the “response to virus” pathway is found up-regulated in the rhinovirus (RV) sample, i.e., the majority of the genes included in the pathway are up-regulated in the RV sample. In comparison, the KEGG pathways, “Oxidative phosphorylation” and “Huntington’s disease,” are found down-regulated, and “Olfactory transduction” is the only pathway showing different “directions” between the four patients.
Table 4. GO-BP terms and KEGG pathways found dysregulated in all four patients’ PBMC cells infected ex vivo, using N-of-1-pathways analysis of the dynamic transcriptome (Wilcoxon model; Bonf.≤5%; RMA Normalization).
The “Size” column corresponds to the number of genes in the gene set/pathway.
| Identifier | Description | Size | Dysregulation |
|---|---|---|---|
| GO:0009615 | response to virus | 247 | ↑ |
| GO:0019221 | cytokine-mediated signaling pathway | 341 | ↑ |
| GO:0045087 | innate immune response | 527 | ↑ |
| GO:0034340 | response to type I interferon | 73 | ↑ |
| ├ GO:0071357 | cellular response to type I interferon | 72 | ↑ |
| └ GO:0060337 | type I interferon-mediated signaling pathway | 72 | ↑ |
|
| |||
| hsa04623 | Cytosolic DNA-sensing pathway | 56 | ↑ |
| hsa00190 | Oxidative phosphorylation | 132 | ↓ |
| hsa04740 | Olfactory transduction | 388 | 2↓ 2↑ |
| hsa05016 | Huntington’s disease | 183 | ↓ |
A proxy Gold Standard based on the in vivo data for comparison at the patient-level
Verifying experimentally all predicted pathways is rate-limiting and extremely expansive. Therefore, identifying a gold standard for studies generating dozens of GO terms and KEGG pathways is unrealistic. On the other hand, similarity to previously obtained results in comparable context allows for generating proxy Gold Standards. Since we aimed at finding if the N-of-1-pathways single-patient framework was able to uncover pathways significant in individual patients, we created a “proxy Gold Standard” using the list of dysregulated pathways unveiled by GSEA in the in vivo dataset in order to obtain a global picture of the pathways we should find dysregulated. We used FDR ≤ 5% as a cutoff to fix the list of dysregulated gene sets, which lead to 194 GO-BP terms and 11 KEGG pathways found significantly dysregulated in the in vivo dataset. Then, we ran the N-of-1-pathways framework on each patient of the ex vivo dataset and compared the results with this proxy Gold Standard. This comparison allow us to see the individual transcriptomic response similarity between the ex vivo and in vivo protocols. As a matter of comparison, we used both the Wilcoxon and the ssGSEAFC models (Methods: N-of-1-pathways). Figure 5 shows the ROC curves corresponding to this comparison.
Figure 5. ROC curves showing robustness of the N-of-1-pathways predictions in each ex vivo infected PBMC confirmed by in vivo human infection study.
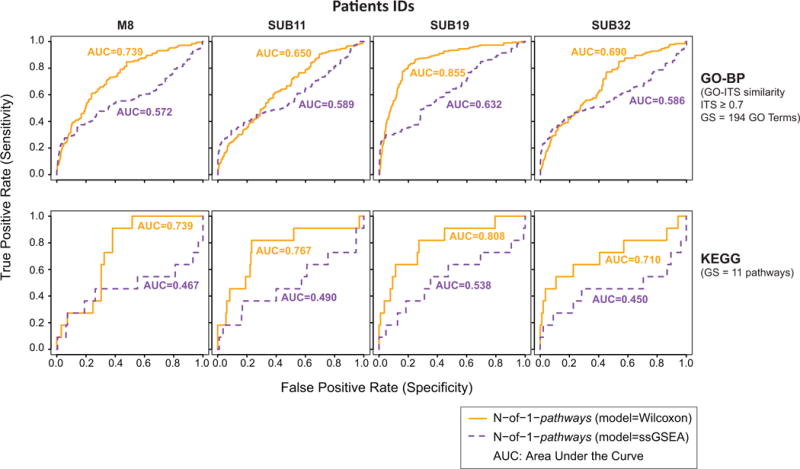
ROC curves are calculated with different nominal p-value cutoffs for each patient. As measured by the Area Under the Curves (AUC), N-of-1-pathways’ Wilcoxon model outperforms the ssGSEAFC model in every instance (one-tailed Wilcoxon matched paired signed rank test p=0.0039). As the theoretical random AUC is 0.5, we tested the significance of each models of N-of-1-pathways by pooling GO-BP and KEGG results: Wilcoxon Model p=0.004; ssGSEAFC Model p=ns (using the one-tailed Wilcoxon signed rank test).
N-of-1-pathways scores naturally split the in vivo patients by phenotype
In order to demonstrate the scalability of the method to other viruses and to show the individualized pathway scores could predict the clinical outcome (symptomatic vs asymptomatic infections), we performed an additional study. We used more samples from the in vivo dataset [5] than the 9 symptomatic patients. Indeed, the dataset also contains 10 patients that were exposed to the rhinovirus but remained asymptomatic. We ran the N-of-1-pathways Wilcoxon model on those extra 10 patients and looked for differences in the individual representation of the dysregulated pathways between the two groups. Of note, for those asymptomatic patients, the “exposed sample” was extracted after 72 hours of exposure, which corresponds to the median time for peak symptoms from symptomatic patient post inoculation. Figure 6 shows a Principal Component Analysis that clearly clusters the two groups of patients without any supervision or pre-treatment of the N-of-1-pathways scores. This protocol was applied for the Rhinovirus as well as Influenza, which were both studied in the in vivo dataset [5]. Of note, the ssGSEAFC model also clusters the data but the clusters are less visible (data not shown).
Figure 6. Principal Component Analysis of N-of-1-Pathways Scores discriminates asymptotic patients from symptomatic infected patients in vivo (PBMC expression).
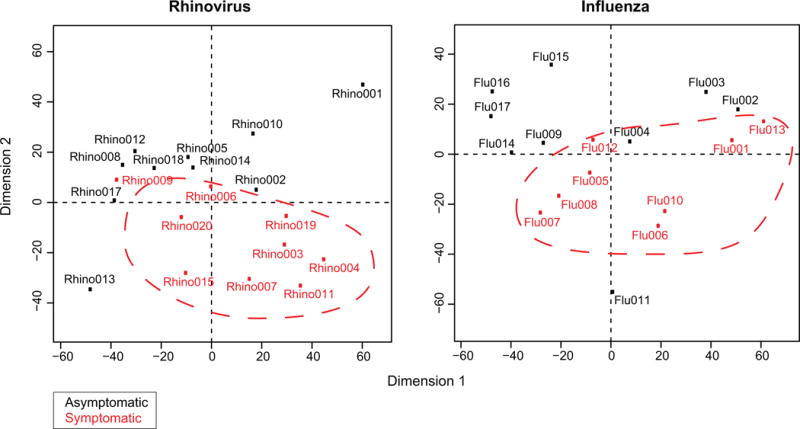
The PCA analysis was conducted on the Z-scores matrix (Patients × GO-BP) produced by the Wilcoxon model within the N-of-1-pathways framework (Methods: PCA) in the context of two different virus exposures (Rhino=rhinovirus; Flu=Influenza). Each data point is a distinct patient for which all GO-BP Z-scores were presented to the PCA. In both PCA plots, we can see that the two first components cluster the symptomatic patients together. Of note, the PCA method is totally unsupervised, which suggests that N-of-1-pathways produces relevant p-values for each GO-BP term.
Discussion
Overall, this study shows that the biology is concordant between ex vivo and in vivo assays, showing a significantly high similarity of biologically relevant functions to viral infection. Indeed, Figures 2&3 show that conventional cohort-level methods (GSEA and enrichment of DEG) obtain very concordant results both within each study and across ex vivo and in vivo studies. Concerning the biological meaning of the results, Figure 4 probably synthetizes best their range. Cytokines are broad categories of small proteins that are important in cell signaling. Among them, interferons are released by host cells in response of pathogens. Here, the ex vivo and in vivo studies corroborate in viral response specificity. Specifically, Figure 4 shows that the cytokine regulation leads to only interferons Type I and Gamma (γ) to be dysregulated. Type I interferons are well-studied molecules that play an essential role in viral functions, such as inducing direct anti-viral effects, as well as regulating innate and adaptive autoimmune systems [34]. Interferon γ is crucial for immunity against viral infections and is produced rapidly by natural killer cells in viral infection and at a later stage by differentiation of T cells [35]. Additionally, to the rightmost part of Figure 4, the network shows a strong cellular innate immune response of leukocyte migration in response to chemotaxis signal, leucocyte mediated cytotoxicity. Among leukocytes, multiple GO terms specify T cell lymphocytes mediated immunity. Since rhinovirus infections are the most frequent cause of the common cold, it is not surprising that the in-vivo study shows a response of T cells (e.g. memory T cells) as a result of acquired immune response from previous rhinovirus infections.
In the context of precision medicine, Table 4 recapitulates the main biological processes dysregulated between the virus-exposed and control samples. Unsurprisingly, every patient harbors dysregulated pathways such as “response to virus” or “innate immune response”. The motivating part is that N-of-1-pathways is able to uncover this dysregulation at the single subject level. Moreover, Figure 5 shows that the patient-level results obtained by the N-of-1-pathways framework are concordant with conventional cohort-level methods. On the methodological aspect, we have shown again that the Wilcoxon model of the N-of-1-pathways framework was more accurate than the ssGSEAFC model when the individual results are compared to a proxy gold standard. Further, Zaas et al. established the separation of the asymptomatic from symptomatic phenotype of a rhinovirus infection through supervised studies [5], suggesting that the feasibility is not trivial. Here, we show that integrating both the uninfected and virus-exposed PBMC transcriptome states into a single dynamic transcriptome interpretation probably increases the sensitivity since an unsupervised PCA can identify this phenotype on its two first components (Figure 6). Future studies are required to develop and test improved models even though the lack of similarity of pathways dysregulated on an individual level with a “consensus” proxy gold standard can be explained by individual variation. Since we pioneered single subjects transcriptome analyses, very few studies report individual pathway variations. In our previous study in cancer, individual similarity to a gold standard varied considerably and a higher dissimilarity was significantly associated with poor patient survival [7]. We had initially hypothesized this outcome as clonal cancer cell selection in response to therapy would likely favor cancer cell having more therapeutic escape mechanisms (in other words more dysregulated). Additional studies comprising infected hosts symptoms would provide evidence to the reliability of the N-of-1-pathways framework to unveil individual subject mechanisms of resistance or sensitivity to infections.
This new application of the N-of-1-pathways framework differs in many ways with our previous applications in cancer. The obvious first difference is the biology: cancer transcriptome is a consequence of inherited and acquired human gene mutations as well as epigenetic changes between the normal and cancer tissues, while a viral infection consists of the introduction of a foreign regulatory apparatus comprising non-human nucleotides (RNA or DNA) and proteins without mutations to human genes (at least initially). Previously, we showed that the dynamic transcriptome analysis of uninvolved vs solid tumoral tissue could be predictive of survival at the single patient level. Here, we show that the same framework could be used to unveil relevant individual pathway dysregulation in white bloods cells of the PBMC samples. Since the concept can be extended to different tissues and conditions, it shifts the clinical implications of the results. In follow-up studies, we are translating this process to clinical practice: a single blood sample followed by a transcriptomic analysis of the ex vivo assay is enough to predict future outcome (predictive virogram). Moreover, in our previous studies, the N-of-1-pathways framework was validated using straightforward discovery techniques such as hierarchical clustering and principal component analysis as well as survival curves. In this study, we extended the analysis of the results thanks to a more elaborated Similarity Venn Diagram framework (which could also be used independently). The similarity metrics and visualization tools provide a more comprehensive set of results as well as a straightforward visualization in order to rapidly grasp the results and their meaning. Finally, the present study could be considered as a preliminary step towards the future development of ex vivo assays for precision medicine. And here this term is unequivocal since we can unveil dysregulated pathways at the single patient level.
We are aware that the current Wilcoxon model of the N-of-1-pathways framework may not be accurate in certain conditions. For example, if a batch effect is present between the two-paired samples, we hypothesized that the Wilcoxon test may produce False Positives results (FPs), due to the shift of the mean. While conventional batch effect correction models could adjust FPs across several samples, the analytical innovation required is challenging when dealing with only two samples. Further studies involving designing the of new models for producing statistical significance of dysregulated pathways with a mere two samples may circumvent this issue.
We also presented in this study an extended representation of classic Venn Diagrams. We showed that those Similarity Venn Diagrams could display the simple overlap between two lists of terms, as well as their similarity. We believe that this kind of representation is scalable to any field comprising sets of terms from which a similarity metric can be obtained, such as BIG DATA results, Google™ queries, etc. Of particular interest are the suites of analytical packages applicable to the associated Similarity Contingency Tables we propose (e.g. Odds Ratio, enrichment studies, etc).
Conclusions
In conventional comparative study analyses, many samples of different human subjects are required for achieving sufficient statistical power to draw conclusions at the level of the studied population. The N-of-1-pathways framework does not require a cohort for reaching sufficient statistical power. The transcriptomic dysregulation induced by a virus is more subtle than the one induced by cancer. Thereforem these results underline the scalability of N-of-1-pathways to many clinical conditions such as “before vs after treatment”, “paired single cell studies”, etc. It also provides a way of analyzing studies previously considered underpowered due to the scarcity of patients as well as a strong framework for patient-centered precision medicine.
This paper is the first of its kind to report a personal ex vivo dynamic transcriptome assay that recapitulates an in vivo infection –a foundational work for developing virograms for clinical practice. This is a step forward for precision medicine since such ex vivo assays can be extended to interpret individualized response to infections or putative therapies in high throughput. In other words, these analyses are required to multiplex systematically alternate dynamic transcriptome responses of the host conditions in a way analogous as those conventionally conducted on pathogens in microbiology (e.g. antibiogram). The unveiled pathways are biologically meaningful and can be recapitulated by several well-established, cohort-level methods. Moreover, this concordance can be found at a lower level, since we also found a strong overlap of differentially dysregulated genes between the two conditions. Therefore, this raises the question of considering ex vivo studies when in vivo studies are either unethical and/or clinically unadvisable.
Supplementary Material
Acknowledgments
We thank the Genomics Shared Service of the Arizona Cancer Center for arraying the paired samples. We thank Dr. Ikbel Achour for her revision of the manuscript. This manuscript is an original publication that extends a peer-reviewed presentation held at the 4th Translational Bioinformatics Conference (ISB/TBC 2014), organized by the Chinese Academy of Sciences and Qingdao University held in Qingdao, China, October 24–27, 2014. We thank the leadership of the conference for selecting and recommending this work for publication.
Funding/Support. Drs. Martinez, Gardeux, and Lussier are supported in part by the The Arizona Health Sciences Center and The BIO5 Institute. Dr. Lussier is also supported by The National Library of Medicine (K22 LM008308-04) and The University of Arizona Cancer Center (P30CA023074).
Footnotes
Supplement data and files: http://Lussierlab.org/publications/Ex-vivo-ViralAssay
Competing interests. The authors declare that they have no competing interests.
References
- 1.Murcia PR, et al. Intra- and interhost evolutionary dynamics of equine influenza virus. J Virol. 2010;84(14):6943–54. doi: 10.1128/JVI.00112-10. [DOI] [PMC free article] [PubMed] [Google Scholar]
- 2.Murcia PR, et al. Evolution of an Eurasian Avian-like Influenza Virus in Naïve and Vaccinated Pigs. PLoS Pathog. 2012;8(5):e1002730. doi: 10.1371/journal.ppat.1002730. [DOI] [PMC free article] [PubMed] [Google Scholar]
- 3.Hong JY, et al. Macrophage activation state determines the response to rhinovirus infection in a mouse model of allergic asthma. Respir Res. 2014;15:63. doi: 10.1186/1465-9921-15-63. [DOI] [PMC free article] [PubMed] [Google Scholar]
- 4.Mejias A, et al. Whole Blood Gene Expression Profiles to Assess Pathogenesis and Disease Severity in Infants with Respiratory Syncytial Virus Infection. PLoS Med. 2013;10(11):e1001549. doi: 10.1371/journal.pmed.1001549. [DOI] [PMC free article] [PubMed] [Google Scholar]
- 5.Zaas AK, et al. Gene expression signatures diagnose influenza and other symptomatic respiratory viral infections in humans. Cell Host Microbe. 2009;6(3):207–17. doi: 10.1016/j.chom.2009.07.006. [DOI] [PMC free article] [PubMed] [Google Scholar]
- 6.Rubins KH, et al. Stunned Silence: Gene Expression Programs in Human Cells Infected with Monkeypox or Vaccinia Virus. PLoS ONE. 2011;6(1):e15615. doi: 10.1371/journal.pone.0015615. [DOI] [PMC free article] [PubMed] [Google Scholar]
- 7.Gardeux V, et al. ‘N-of-1-pathways’ unveils personal deregulated mechanisms from a single pair of RNA-Seq samples: towards precision medicine. Journal of the American Medical Informatics Association. 2014 doi: 10.1136/amiajnl-2013-002519. [DOI] [PMC free article] [PubMed] [Google Scholar]
- 8.Gardeux V, et al. Concordance of deregulated mechanisms unveiled in underpowered experiments: PTBP1 knockdown case study. BMC Medical Genomics. 2014;7(Suppl 1):S1. doi: 10.1186/1755-8794-7-S1-S1. [DOI] [PMC free article] [PubMed] [Google Scholar]
- 9.Irizarry RA, et al. Exploration, normalization, and summaries of high density oligonucleotide array probe level data. Biostatistics. 2003;4(2):249–264. doi: 10.1093/biostatistics/4.2.249. [DOI] [PubMed] [Google Scholar]
- 10.Affymetrix Power Tools. http://www.affymetrix.com/partners_programs/programs/developer/tools/powertools.affx.
- 11.Carlson M. org.Hs.eg.db: Genome wide annotation for Human [Google Scholar]
- 12.Gentleman RC, et al. Bioconductor: open software development for computational biology and bioinformatics. Genome Biol. 2004;5(10):R80. doi: 10.1186/gb-2004-5-10-r80. [DOI] [PMC free article] [PubMed] [Google Scholar]
- 13.R: Development core team. R: A language and enviroment for statistical computing. R foundation for statistical computing; Vienna, Austria: 2004. [Google Scholar]
- 14.Ashburner M, et al. Gene ontology: tool for the unification of biology. The Gene Ontology Consortium. Nat Genet. 2000;25(1):25–9. doi: 10.1038/75556. [DOI] [PMC free article] [PubMed] [Google Scholar]
- 15.Gene Ontology, C. The Gene Ontology in 2010: extensions and refinements. Nucleic Acids Res. 2010;38:D331–5. doi: 10.1093/nar/gkp1018. (Database issue) [DOI] [PMC free article] [PubMed] [Google Scholar]
- 16.Kanehisa M, Goto S. KEGG: kyoto encyclopedia of genes and genomes. Nucleic Acids Res. 2000;28(1):27–30. doi: 10.1093/nar/28.1.27. [DOI] [PMC free article] [PubMed] [Google Scholar]
- 17.Kanehisa M, et al. Data, information, knowledge and principle: back to metabolism in KEGG. Nucleic Acids Res. 2014;42:D199–205. doi: 10.1093/nar/gkt1076. (Database issue) [DOI] [PMC free article] [PubMed] [Google Scholar]
- 18.Yang X, et al. Single sample expression-anchored mechanisms predict survival in head and neck cancer. PLoS Comput Biol. 2012;8(1):e1002350. doi: 10.1371/journal.pcbi.1002350. [DOI] [PMC free article] [PubMed] [Google Scholar]
- 19.Yang X, et al. Towards mechanism classifiers: expression-anchored Gene Ontology signature predicts clinical outcome in lung adenocarcinoma patients. AMIA Annu Symp Proc. 2012;2012:1040–9. [PMC free article] [PubMed] [Google Scholar]
- 20.Perez-Rathke A, Li H, Lussier YA. Interpreting personal transcriptomes: personalized mechanism-scale profiling of RNA-seq data. Pac Symp Biocomput. 2013:159–70. [PMC free article] [PubMed] [Google Scholar]
- 21.Chen JL, et al. Curation-free biomodules mechanisms in prostate cancer predict recurrent disease. BMC Med Genomics. 2013;6(Suppl 2):S4. doi: 10.1186/1755-8794-6-S2-S4. [DOI] [PMC free article] [PubMed] [Google Scholar]
- 22.Subramanian A, et al. Gene set enrichment analysis: A knowledge-based approach for interpreting genome-wide expression profiles. Proc Natl Acad Sci. 2005;102:15545–15550. doi: 10.1073/pnas.0506580102. [DOI] [PMC free article] [PubMed] [Google Scholar]
- 23.Tibshirani R, et al. SAMR: SAM: Significance Analysis of Microarrays. 2011 [Google Scholar]
- 24.Huang da W, Sherman BT, Lempicki RA. Systematic and integrative analysis of large gene lists using DAVID bioinformatics resources. Nat Protoc. 2009;4(1):44–57. doi: 10.1038/nprot.2008.211. [DOI] [PubMed] [Google Scholar]
- 25.Huang da W, Sherman BT, Lempicki RA. Bioinformatics enrichment tools: paths toward the comprehensive functional analysis of large gene lists. Nucleic Acids Res. 2009;37(1):1–13. doi: 10.1093/nar/gkn923. [DOI] [PMC free article] [PubMed] [Google Scholar]
- 26.Jiang J, Conrath D. Multi-word complex concept retrieval via lexical semantic similarity. Information Intelligence and Systems, 1999. Proceedings. 1999 International Conference on. 1999 [Google Scholar]
- 27.Li H, et al. Complex-disease networks of trait-associated single-nucleotide polymorphisms (SNPs) unveiled by information theory. J Am Med Inform Assoc. 2012;19(2):295–305. doi: 10.1136/amiajnl-2011-000482. [DOI] [PMC free article] [PubMed] [Google Scholar]
- 28.Tao Y, et al. Information theory applied to the sparse gene ontology annotation network to predict novel gene function. Bioinformatics. 2007;23(13):i529–38. doi: 10.1093/bioinformatics/btm195. [DOI] [PMC free article] [PubMed] [Google Scholar]
- 29.Regan K, et al. Translating Mendelian and complex inheritance of Alzheimer’s disease genes for predicting unique personal genome variants. J Am Med Inform Assoc. 2012;19(2):306–16. doi: 10.1136/amiajnl-2011-000656. [DOI] [PMC free article] [PubMed] [Google Scholar]
- 30.Lee Y, et al. Biomolecular Systems of Disease Buried Across Multiple GWAS Unveiled by Information Theory and Ontology. AMIA Summits Transl Sci Proc. 2010;2010:31–5. [PMC free article] [PubMed] [Google Scholar]
- 31.Yang X, et al. GO-Module: functional synthesis and improved interpretation of Gene Ontology patterns. Bioinformatics. 2011;27(10):1444–6. doi: 10.1093/bioinformatics/btr142. [DOI] [PMC free article] [PubMed] [Google Scholar]
- 32.Benjamini Y, Hochberg Y. Controlling the false discovery rate: a practical and powerful approach to multiple testing. Journal of the Royal Statistical Society Series B (Methodological) 1995:289–300. [Google Scholar]
- 33.Barbie DA, et al. Systematic RNA interference reveals that oncogenic KRAS-driven cancers require TBK1. Nature. 2009;462(7269):108–12. doi: 10.1038/nature08460. [DOI] [PMC free article] [PubMed] [Google Scholar]
- 34.Perry AK, et al. The host type I interferon response to viral and bacterial infections. Cell Res. 2005;15(6):407–22. doi: 10.1038/sj.cr.7290309. [DOI] [PubMed] [Google Scholar]
- 35.Schoenborn JR, Wilson CB. Regulation of interferon-gamma during innate and adaptive immune responses. Adv Immunol. 2007;96:41–101. doi: 10.1016/S0065-2776(07)96002-2. [DOI] [PubMed] [Google Scholar]
Associated Data
This section collects any data citations, data availability statements, or supplementary materials included in this article.