Abstract
Aims
To assess the test–retest, intra- and inter-reader reliability of thoracic aorta measurements by magnetic resonance imaging (MRI).
Methods and results
Twenty-five participants underwent aortic MRI twice over 13 ± 7 days. All aortic variables from baseline and repeat MR were analysed using a semi-automated method by the ARTFUN software. To assess the inter-study reproducibility of aortic variables, we calculated intraclass correlation coefficient (ICC) for individual aortic measurements. Intra- and inter-observer variability was also assessed using the baseline MR data. Mean ascending aortic strain had moderate inter-study reproducibility (11.53 ± 6.44 vs. 10.55 ± 6.64, P = 0.443, ICC = 0.53, P < 0.01). Mean descending aortic strain and arch pulse wave velocity (PWV) had good inter-study reproducibility (descending aortic strain: 8.65 ± 5.30 vs. 8.35 ± 5.26, P = 0.706, ICC = 0.74, P < 0.001; PWV: 9.92 ± 4.18 vs. 9.94 ± 4.55, P = 0.968, ICC = 0.77, P < 0.001, respectively). All aortic variables had excellent intra- and inter-observer reproducibility (intra-: ICC range, 0.87–0.99, inter-: ICC range, 0.56–0.99, respectively).
Conclusion
Inter-study reproducibility of all aortic variables was acceptable. Intra- and inter-observer reproducibility of all aortic variables was excellent. MRI can provide a repeatable method of measuring aortic structural and functional parameters.
Keywords: aorta, reproducibility, pulse wave velocity, strain, MRI, phase contrast
Introduction
Arterial stiffness, an indicator of increased systolic blood pressure and pulse pressure, has also shown to be associated with aging, atherosclerosis, cardiovascular disease,1–3 and heart failure.2 The central aorta, it is believed, accounts for a majority of the global arterial stiffening and atherosclerotic burden.4 The value of arterial pulse wave velocity (PWV) as a marker of arterial stiffness to predict fatal and non-fatal cardiovascular events over traditional risk factors has been established in numerous studies in patients and in the general population5–7 and has the advantage of being less technically challenging than local stiffness measurements. Aortic stiffness is independently associated with manifestations of cerebral small-vessel disease in hypertensive patients,8 and it is increased in patients with type 1 DM independently of renal dysfunction.9 PWV is associated with the presence of carotid intraplaque haemorrhage and with plaque composition.10
Magnetic resonance imaging (MRI) has the unique ability to combine in a single exam the assessment of ventricular geometry, myocardial function, and central aortic stiffness (distensibility and PWV). MRI has a distinct advantage over ultrasound in that full three-dimensional visualization of the aorta is possible. This enables placement of the imaging plane perpendicular to the aorta in a reproducible fashion. Another particular advantage of MRI is in the measurement of aortic distensibility from MRI as a change in two-dimensional aortic wall circumference or lumen area instead of one-dimensional wall diameter as seen in M-mode echocardiography. Furthermore, depending on the imaging protocol, velocity data and PWV can be acquired simultaneously with just one acquisition in two aortic locations (ascending and descending) precisely.11
ARTFUN, an automated aortic analysis software, has been used and validated in both phantom and several human studies previously.12 The only user intervention required in analysis is to point the centre of the aorta and, when necessary, another point close to the vessel wall on one image of the cine series, with automated border detection and fitting for the entire cardiac cycle performed automatically.
However, the reproducibility of the results when the MR study is repeated a few days from the baseline MR study has not been examined yet. This is an important issue with regard to the quality of results obtained in the Multi-Ethnic Study of Atherosclerosis (MESA). In order to draw conclusions on temporal trends in aortic measures from the MESA data, understanding test–retest reproducibility between the exams becomes essential. In MESA, aortic variables were sampled with the transverse section image at the level of pulmonary artery bifurcation. The MESA protocol includes qualitative alignment of slice positions between previous and current exams but misregistration between slices remains a potential source of variation which has not been assessed.
Methods
Study population
MESA was a prospective, population-based, epidemiological study to investigate the progression and prevalence of subclinical cardiovascular disease in a multi-ethnic cohort (Caucasian, African American, Hispanic, and Chinese) of men and women 45–84 years of age. The characteristics of MESA subjects have been described previously.13 During the MESA follow-up exam (2008–09), 25 participants were available and consented to two aortic phase contrast (PC) cine examinations. No restrictions on diet were placed prior to the scans and participants did not receive any medications before the exam. The examinations were performed within a period of no expected clinical change—13 ± 7 days (range, 7–28 days) of each other. The local institutional review board committee approved the study.
Imaging acquisition
The studies were performed on a similar 1.5 T MR Systems (MAGNETOM Avanto; Siemens Healthcare, Erlangen, Germany) with a body-matrix coil and a spine-matrix coil using 12 coil elements. To visualize the thoracic aorta, images in the sagittal planes were acquired using electrocardiogram-gated Steady State Free Precession acquisition with breath hold. Then, one transverse plane at the level of pulmonary artery bifurcation was acquired using a PC sequence with breath hold. PC cine images were acquired using segmented k-space; electrocardiogram-gated PC pulse sequence. The parameters for PC images included the following: field of view 400 × 300 mm (frequency × phase), slice thickness 8 mm, repetition time 29.8 ms, echo time 3.5 ms, flip angle 20°, bandwidth 245 Hz/pixel, acquisition matrix size 256 × 192 (frequency × phase), phase-encoding direction was anterior to posterior, phase-encoding views per segment 2, spatial resolution 0.78 × 0.78 × 8 mm according to post processing by interpolation. The number of images was 30 per cardiac cycle. Maximal velocity encoding was 150 cm/s. The temporal resolution of acquisition was 29.8 ms. The technologists were previously trained on the MESA protocol and appropriate instructions were provided for the PC sequences. To better approximate a practical clinical scenario where the sequential scans could be performed by different technologists, no additional steps other than the standard procedures were followed for the follow-up exams. The technologists were blinded to the previously acquired study.
Image analysis
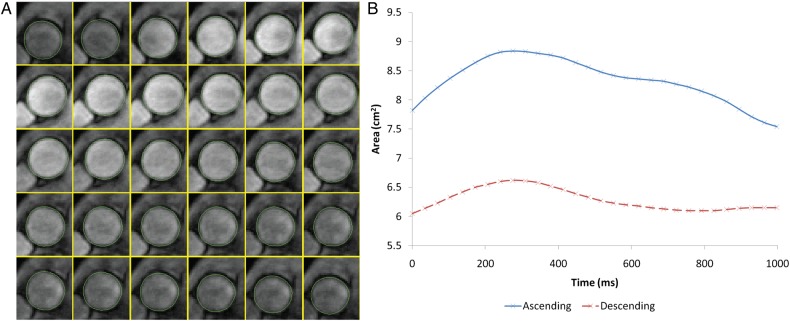
The ascending and proximal descending aortic contours throughout the cardiac cycle were semi-automatically obtained on both the modulus and cine images of the PC acquisition (Figure 1) using the ARTFUN software (INSERM UMR-S 1146). The general user intervention was to identify the centre of the aorta on one image of the cine series, with subsequent border detection for the entire cycle being completely automatic. When the vessel wall was not automatically detected with sufficient accuracy, the reader drew the border manually for each image based on the cine images.
Figure 1.
Aortic strain assessment with MRI. (A) Automatic tracking of aortic contour. (B) Temporal curve of aortic area obtained after automatic tracking.
The maximum (Amax) and minimum (Amin) aortic lumen areas and relative change in area (aortic strain) obtained14 were defined as shown in Eq. (1).
| 1 |
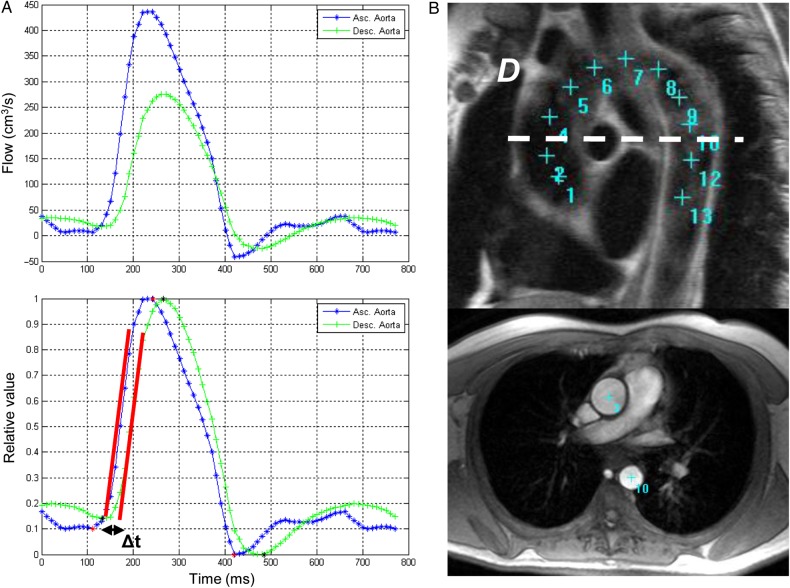
Aortic arch PWV was calculated as a ratio of the distance (D) between the ascending and descending aortic locations of the phase-contrast acquisition and the transit time (Δt) from the flow curves using the modulus images (see Eq. (2)).
| 2 |
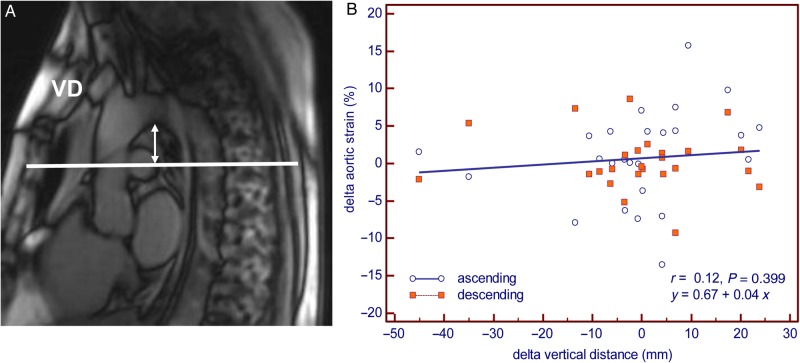
The transit time was calculated as the average time difference between the ascending and descending aortic systolic upslopes. A least-squares method was used to estimate the upslopes from all the data points as shown in Figure 2. Peak flow normalization preceded this estimation process.15 The distance travelled by the pulse wave was measured as the centreline of the aorta using 13–15 markers on the sagittal planes of the aortic arch—starting from the centre of the ascending aortic imaging plane and ending at the descending aortic plane (Figure 2). To assess for differences in slice location between scans, the vertical distance (VD) was measured between plane and aortic arch using AZE Phoenix (AZE, Ltd. Tokyo, Japan) DICOM workstation.
Figure 2.
Aortic arch PWV method. (A) Transit time (Δt) method of peak flow between ascending and descending aortic location. Before peak flow normalization (upper) and after peak flow normalization (lower). Δt was estimated as the time shift providing the highest correlation between ascending and descending aortic velocity. (B) Measurement of the transit distance (D) in the aortic arch. Aortic arch view (upper) and PC cine transverse view (lower) on MRI.
To evaluate the effect of spatial resolution, the images were down-sampled from their original 256 × 256 matrix size to 192 × 192 (25% reduction) and 128 × 128 (50% reduction) using bicubic interpolation (MATLAB function ‘imresize’, Mathworks, Natick, MA). To evaluate the effect of temporal resolution, every alternate image was chosen from the imaged cardiac cycle to obtain a perceived temporal resolution of 50% of the original.
Intra reader reproducibility was established by one reader who performed analysis of the studies twice to generate aortic structural and functional parameters, the interval between the two analyses was at least 15 days. The reader was blinded to the first read while performing the second read. Inter-reader reproducibility was assessed by two readers who analysed the same cases using ARTFUN to generate aortic data. The second reader was blinded to the results of the first reader. Inter-study reproducibility was performed by the same reader with at least 7 days between reading of the first and second exams, and being blinded to the first exam while reading the second exam.
Statistical analysis
The difference in aortic measurements between two exams was represented by the mean difference and the standard deviation of the mean difference between the exams. Reliability was assessed using the intraclass correlation coefficient (ICC) with a model of absolute agreement; absolute measurement error was estimated by the standard error of measurement (SEM) and smallest detectable change (SDC).16 The SEM quantified the within-subject variability and the SDC in the measurement that can be reliably assessed accounting for measurement errors.
| 3 |
| 4 |
Bland–Altman analysis and Passing–Bablok regression17 were performed to visualize the agreement and measurement error between the repeated studies. The degree of agreement between the two studies was determined by the mean difference and 95% confidence intervals of the mean difference.18 Study sample sizes required to show a 10% absolute change in aortic parameters with a power of 80%, an α error of 0.05 and inter-study standard deviation were calculated.19 Statistical analysis was performed using SPSS statistical software version 20 (SPSS Inc., Chicago). Bland–Altman analysis and Passing–Bablok regression were performed using MedCalc, version 13.2.0.0 (MedCalc Software, Mariakerke, Belgium). All continuous variables were represented by mean ± SD and categorical data were presented as percentages. Paired t-test was used to determine the differences in continuous variables. All tests were two-tailed and a P-value <0.05 was considered to be statistically significant.
Results
Participant characteristics
The population consisted of 18 males and 7 females with a mean age of 66 ± 7 years (range 53–80 years), Caucasians 64%, and African Americans 36%. Of these, 28% had diabetes mellitus, 56% were hypertensive, 64% were current smokers, and 16% had hyperlipidaemia. There was no significant difference between the heart rates at the time of the examination (62.1 ± 13.5 at Exam 1, 63.4 ± 15.2 at Exam 2 with a P value of 0.43). Image quality was adequate for analysis in all studies (only 6 of 50 cases required manual aorta delineation) in all the subjects.
Intra- and inter-observer reproducibility
Intra- and inter-observer reproducibility of aortic parameters is presented in Table 1. Intra- and inter-observer reproducibility was excellent for aortic area, transit time, transit distance, descending aortic strain, and PWV (ICC range 0.84–0.99). Ascending aortic strain had excellent intra-observer reproducibility (ICC = 0.87) and fair inter-observer agreement (11.53 ± 6.44 vs. 9.44 ± 5.24, P = 0.058, ICC = 0.56, P < 0.01).
Table 1.
Intra- and inter-observer reproducibility of aortic parameters (n = 25)
| Aortic parameters | Intra-observer ICC | Inter-observer ICC |
|---|---|---|
| Max. Asc. aortic area (cm2) | 0.98** | 0.96** |
| Min. Asc. aortic area (cm2) | 0.98** | 0.95** |
| Max. Desc. aortic area (cm2) | 0.99** | 0.99** |
| Min. Desc. aortic area (cm2) | 0.99** | 0.99** |
| Transit time (ms) | 0.99** | 0.96** |
| Transit distance (mm) | 0.98** | 0.84** |
| Asc. aortic strain (%) | 0.87** | 0.56* |
| Desc. aortic strain (%) | 0.96** | 0.93** |
| Pulse wave velocity (m/s) | 0.99** | 0.94** |
ICC, intraclass correlation coefficient; Max., maximum; Min., minimum; Asc., ascending; Desc., descending.
*P < 0.01.
**P < 0.001.
Inter-study reproducibility
The average aortic area, transit time, transit distance, aortic strain, PWV, and VD were similar in both exams (P > 0.05) (Table 2). All aortic parameters had superior intra- and inter-observer reproducibility compared with inter-study reproducibility. The inter-study reproducibility of aortic measurements was still fairly high for most parameters. ICC, SEM, and SDC of all aortic variables are shown in Table 2.
Table 2.
Inter-study reproducibility of aortic parameters (n = 25)
| Aortic parameters | Exam 1 | Exam 2 | P-valuea | Mean difference | ICC | SEM | SDC | Sample sizes |
|---|---|---|---|---|---|---|---|---|
| Max. Asc. area (cm2) | 10.53 ± 1.91 | 10.61 ± 1.89 | 0.663 | −0.07 ± 0.83 | 0.91** | 0.25 | 0.70 | 7 |
| Min. Asc. area (cm2) | 9.47 ± 1.72 | 9.59 ± 1.48 | 0.452 | −0.12 ± 0.77 | 0.89** | 0.26 | 0.72 | 8 |
| Max. Desc. area (cm2) | 5.56 ± 1.24 | 5.57 ± 1.25 | 0.911 | −0.01 ± 0.25 | 0.98** | 0.03 | 0.09 | 4 |
| Min. Desc. area (cm2) | 5.14 ± 1.19 | 5.14 ± 1.16 | 0.891 | −0.01 ± 0.26 | 0.98** | 0.04 | 0.11 | 4 |
| Transit time (ms) | 16.52 ± 5.00 | 16.80 ± 5.44 | 0.721 | −0.28 ± 3.87 | 0.73** | 1.99 | 5.53 | 45 |
| Transit distance (mm) | 148.25 ± 27.59 | 146.90 ± 26.44 | 0.827 | 1.34 ± 30.43 | 0.38* | 23.92 | 66.32 | 36 |
| Asc. aortic strain (%) | 11.53 ± 6.44 | 10.55 ± 6.64 | 0.443 | 0.99 ± 6.32 | 0.53* | 4.29 | 11.89 | 260 |
| Desc. aortic strain (%) | 8.65 ± 5.30 | 8.35 ± 5.26 | 0.706 | 0.30 ± 3.90 | 0.74** | 2.01 | 5.56 | 168 |
| PWV (m/s) | 9.92 ± 4.18 | 9.94 ± 4.55 | 0.968 | −0.02 ± 3.03 | 0.77** | 1.46 | 4.04 | 76 |
| VD (mm) | 27.91 ± 12.52 | 28.52 ± 13.21 | 0.845 | −0.61 ± 15.42 | 0.30 | 12.91 | 35.78 | 237 |
Values are mean ± SD. SD, standard deviation; ICC, intraclass correlation coefficient; SEM, standard error of measurement; SDC, smallest detectable change; Max., maximum; Min., minimum; Asc., ascending; Desc., descending; PWV, pulse wave velocity; VD, vertical distance between plane and aortic arch. Sample sizes were calculated by a power of 80%, an α error of 0.05 and a SD of the mean difference.
aPaired t-test.
*P < 0.05.
**P < 0.001.
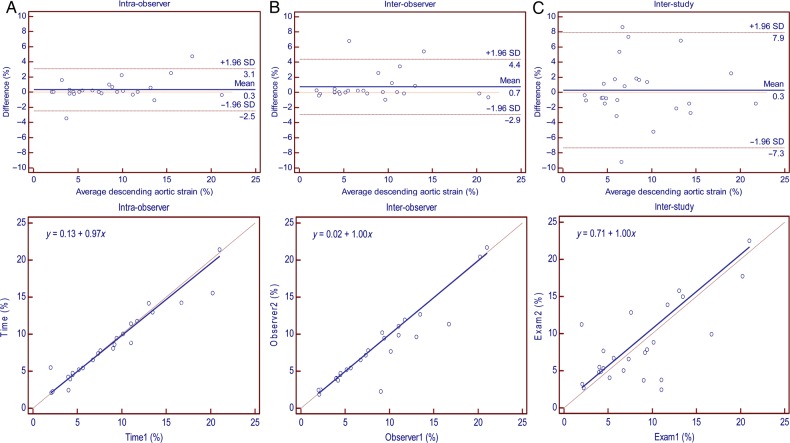
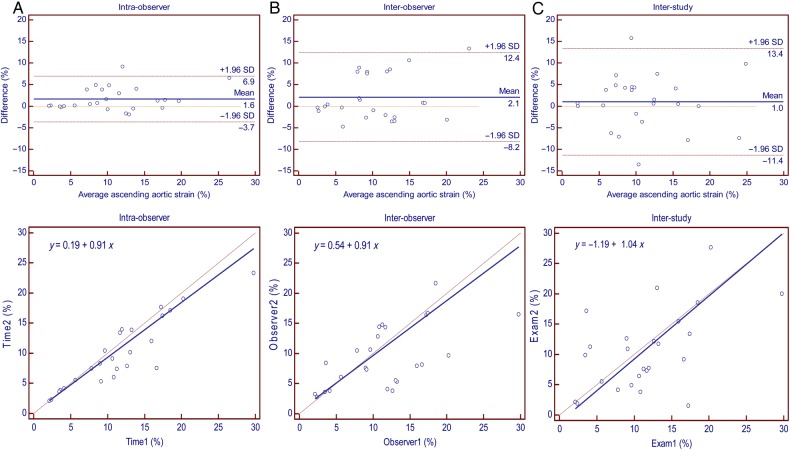
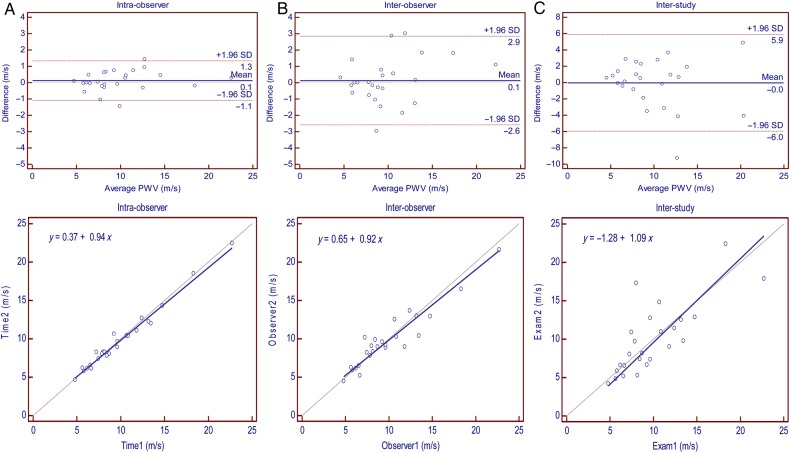
Ascending and descending aortic areas had excellent inter-study reproducibility at maximum and minimum areas (ICC = 0.91 and 0.89; SDC = 0.70 and 0.72 for ascending aortic area while ICC = 0.98 and 0.98; SDC = 0.09 and 0.11 for descending aortic area, respectively) (Table 2). Ascending aortic strain had moderate inter-study reproducibility (ICC = 0.53; SDC = 11.89). Descending aortic strain and PWV had good inter-study reproducibility (ICC = 0.74 and 0.77; SDC = 5.56 and 4.04, respectively). Intra-, inter-observer, and inter-study reproducibility of ascending aortic strain, descending aortic strain, and PWV are demonstrated by Bland–Altman and regression plots in Figures 3–5. Transit distance had moderate inter-study reproducibility (ICC = 0.38, SDC = 66.32); however, VD was not reproducible.
Figure 4.
Reproducibility of descending aortic strain: Bland–Altman plot (upper) and Passing–Bablok regression (lower); SD, standard deviation. (A) Intra-observer. (B) Inter-observer. (C) Inter-study.
Figure 3.
Reproducibility of ascending aortic strain: Bland–Altman plot (upper) and Passing–Bablok regression (lower); SD, standard deviation. (A) Intra-observer. (B) Inter-observer. (C) Inter-study.
Figure 5.
Reproducibility of aortic arch PWV: Bland–Altman plot (upper) and Passing–Bablok regression (lower); SD, standard deviation. (A) Intra-observer. (B) Inter-observer. (C) Inter-study.
Delta VD (Exam 2 – Exam 1) and delta transit distance had a high positive correlation (r = 0.92, P < 0.0001). However, delta aortic strain had no correlation (r = 0.12, P = 0.399) with delta VD (Figure 6).
Figure 6.
Assessment of slice location difference. (A) Method of measuring VD. (B) Correlation plot of slice location difference and aortic strain change. Delta strain (Exam 2 – Exam 1) and VD were calculated by initial scan minus repeat scan.
The estimated sample sizes required for longitudinal assessment of 10% change in variables are presented in Table 2 (power 80%, α = 0.05).
Effect of spatial and temporal under sampling
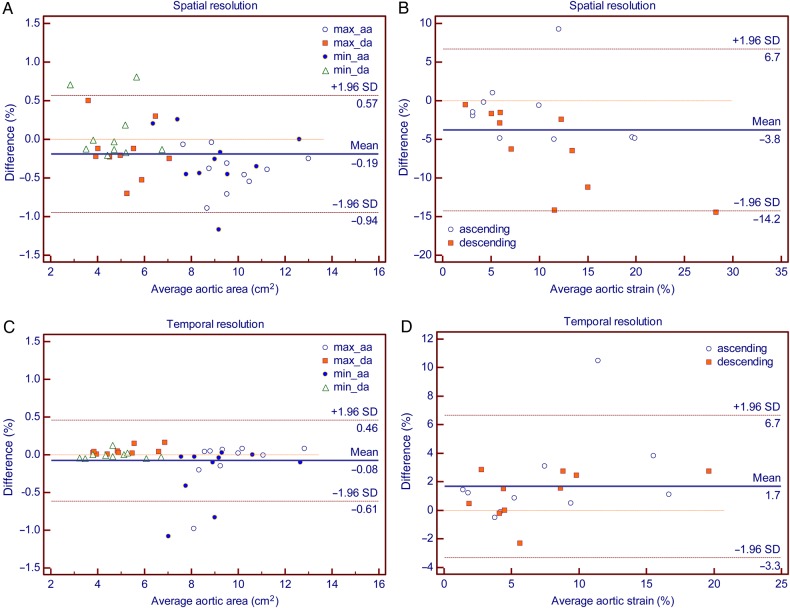
Table 3 and Figure 7 show the comparison of aortic parameters between the standard acquisitions and the low spatial resolution images on the one hand and between the low temporal resolution images on the other hand. The area measured was slightly greater in lower spatial resolutions. The strain observed was also significantly greater, particularly when in plane resolution was reduced to 50% of the original (8.20 ± 5.81 at standard, 11.95 ± 8.45, P = 0.005). The PWV was not significantly different at lower resolutions. While the measured aortic areas were not significantly different at lower temporal resolution, the observed aortic (ascending and descending) strain was shown smaller. The PWV again was not significantly different.
Table 3.
Statistical analysis of spatial and temporal under sampling subject data (n = 10)
| Aortic parameters | Standard | Reduced in-plane (by 25%) | P-valuea | Reduced in-plane (by 50%) | P-valuea | Reduced temporal (by 50%) | P-valuea |
|---|---|---|---|---|---|---|---|
| Area (cm2) | 7.06 ± 2.60 | 7.23 ± 2.68 | <0.0001 | 7.25 ± 2.77 | 0.004 | 7.14 ± 2.63 | 0.085 |
| Strain (%) | 8.20 ± 5.81 | 8.41 ± 5.76 | 0.784 | 11.95 ± 8.45 | 0.005 | 6.51 ± 4.81 | 0.008 |
| PWV (m/s) | 9.60 ± 5.11 | 9.24 ± 4.49 | 0.168 | 9.13 ± 4.56 | 0.056 | 13.31 ± 14.51 | 0.295 |
Value are mean ± SD. SD, standard deviation. Area is included all aortic areas (maximum ascending area, minimum ascending area, maximum descending area, and minimum descending area). Strain is included ascending aortic strain and descending aortic strain. PWV: pulse wave velocity. Standard: original data. Reduced in-plane: number of matrix was reduced. Reduced temporal: under sampling of images by 50% from standard. Number of images is 15 per cycle.
aPaired t-test.
Figure 7.
Reproducibility of aortic arch area and strain in under sampling: Difference = original – undersampled. SD, standard deviation; aa, ascending aorta; da, descending aorta. (A) Aortic area in standard vs. 50% reduction in in-plane resolution. (B) Aortic strain in standard vs. 50% reduction in in-plane resolution. (C) Aortic area in 30 images per beat vs. 15 images per beat. (D) Aortic strain in 30 images per beat vs. 15 images per beat.
Discussion
This study was conducted to evaluate the reproducibility of functional aortic measurements obtained by phase-contrast cine MRI. The results of the current study demonstrate that intra- and inter-observer reproducibility of all aortic parameters is excellent, with the exception of the inter-observer reproducibility of ascending aortic strain, which is moderate. As demonstrated by ICC, SEM, and SDC, aortic areas have excellent inter-study reproducibility. Transit distance is moderately reproducible between the studies. Descending aortic strain and PWV have good inter-study reproducibility, whereas ascending aortic strain is moderately reproducible between the studies.
Reproducible and clinically meaningful quantitative measures of arterial stiffness are important and necessary for monitoring patients' response to therapeutic interventions and identifying novel therapeutic mechanisms. Estimation of the sample size in clinical trials, where serial measurements of endpoints are performed, also necessitates prior determination of measurement reproducibility. To this end, identification of the physiological variation in aortic measures is necessary for the determination of measurable longitudinal change. In this study, by performing two exams within a single month on each participant, we ensured that there was no expected clinical change. To eliminate variability arising from the scanner (magnetic field strength, magnet vendor, and site), the studies were obtained at the same site and scanner. Specific to aortic measurements, maintaining consistency in image acquisition parameters such as temporal and spatial resolution, slice location and slice orientation play a crucial role in reducing variability. To this end, a standardized imaging protocol was used. The technologists, however, were blinded to the previously chosen slice position and orientation on sagittal localizers to approximate a practice clinical scenario.
All aortic function measures by ARTFUN had good-to-excellent intra- and inter-observer, and inter-study reproducibility, with the exception of ascending aortic strain. Ascending aortic strain showed variation both with respect to inter-observer and inter-study variability. While the difference in the measured aortic strain was minimal, the ICC was moderate at best. The shifting of the phase-contrast imaging plane and its' effect on the estimated strain was assessed. The lack of a relationship between the difference in the distance of the imaging planes from the aortic arch and the difference in aortic strains between exams suggested that this effect was minimal. The resulting aortic strain was similar to the different study acquisitions, indicating that minimal alterations in slice location play a negligible role in the variability of aortic strain and PWV measurements. Strain is variable by the patient's blood pressure.12 Distensibility (aortic strain divided by pulse pressure) is usually used for assessment of aortic stiffness and is perhaps a more accurate identifier of inter-study variability of strains as it accounts for change in blood pressures. These, however, do not explain the low inter-observer variability seen here as well. The accuracy of ARTFUN for automated contour segmentation of the aorta with respect to area has been explored.20 While in our study, the maximum and minimum areas and descending aortic strain remained highly reproducible, ascending area strain was not. One reason could be the significantly higher in-plane movement over the cardiac cycle of the ascending aorta when compared with the descending aorta. This may introduce slight errors in area and strain assessments. The sample size estimates to assess 10% longitudinal change in parameters was low for aortic size measurement. Sample sizes for strain and PWV, which are derivative of flow and size (ratios), are substantially larger.
In-plane image resolution and temporal resolution may play a major role in longitudinal monitoring of change in parameters. The aortic strain measures were influenced when the in-plane resolution was reduced or when the temporal resolution was increased, indicating the importance of maintaining the same imaging parameters. When the in-plane resolution was reduced a higher strain value was observed, perhaps because of the decreased ability to resolve small changes in area which are close to the order of the image resolution. Similarly, a decreased temporal resolution results in a reduced ability to resolve the true maximums and minimums over the cardiac cycle.
Clinical implications
Several studies have been conducted using similar imaging protocols for aortic distensibility, a measure of local stiffness, and PWV, a consolidated measure of arterial stiffness, demonstrating the clinical utility of aortic function. A significant association was observed between aortic distensibility and diabetes mellitus.21 Aortic wall thickness and distensibility are related to cardiovascular risk factors.22 Aortic stiffness is strongly associated with ageing23 and the incidence of cardiovascular events24 and hypertension.25 Longitudinal assessment of sophisticated parameters such as aortic distensibility and PWV may help in successful detection of the effect of early arterial remodelling, before clinically overt disease appears. It is in this setting that the excellent inter-study reproducibility in the current study of PWV and aortic area should be interpreted allowing for their use in a diagnostic capacity in clinical and/or subclinical cardiovascular disease. While echocardiography is the most popular approach for aorta evaluation currently, it is an operator-dependent technique and limited by patient's acoustic window. Cardiac magnetic resonance, even if more expensive and not as widely available as ultrasound, offers accurate measurements with excellent reproducibility, ideal for serial evaluation. Similar to a clinical setting, the participants in the current study had a mean age of 66 years and had underlying subclinical cardiovascular risk.
Limitations
The major limitation of the study was the lack of in-exam blood pressure data that were required to ascertain aortic distensibility. Our study population may differ from other populations (both epidemiological and clinical) in terms of cardiovascular risk and consequently aortic parameter values, and hence the results of this study must be considered with appropriate context. An unexplained data limitation of this sub-study performed within the multi-centre MESA is that while participants were chosen randomly (from a single centre) for repeat MRI, considering the sample size, the participant characteristics may not be representative of the overall MESA population. Another limitation is the lack of inclusion of severe aortic abnormalities such as aortic aneurysm or larger aorta as seen in clinical practice, and hence the results of this study cannot be extended to all patients.
Conclusions
In conclusion, our results demonstrate that PC cine yields excellent intra-, inter-observer, and inter-study reproducibility of aortic structure and function in participants without overt or advanced aortic disease. The good reproducibility of this technique will enable MRI to isolate meaningful trends in aortic functional parameters in large cohorts of participants, such as the MESA.
Acknowledgements
This study was supported by contracts N01-HC-95159 through N01-HC-95169 from the National Heart, Lung, and Blood Institute and by grants UL1-RR-024156 and UL1-RR-025005 from NCRR. The authors thank the other investigators, staff, and participants of the MESA for their valuable contributions. A full list of participating MESA investigators and institutions can be found at http://www.mesa-nhlbi.org.
References
- 1.Mattace-Raso FUS, Van Der Cammen TJM, Hofman A, Van Popele NM, Bos ML, Schalekamp MADH et al. Arterial stiffness and risk of coronary heart disease and stroke: the Rotterdam Study. Circulation 2006;113:657–63. [DOI] [PubMed] [Google Scholar]
- 2.Giannattasio C, Achilli F, Failla M, Capra A, Vincenzi A, Valagussa F et al. Radial, carotid and aortic distensibility in congestive heart failure: effects of high-dose angiotensin-converting enzyme inhibitor or low-dose association with angiotensin type 1 receptor blockade. J Am Coll Cardiol 2002;39:1275–82. [DOI] [PubMed] [Google Scholar]
- 3.Boutouyrie P, Tropeano AI, Asmar R, Gautier I, Benetos A, Lacolley P et al. Aortic stiffness is an independent predictor of primary coronary events in hypertensive patients: a longitudinal study. Hypertension 2002;39:10–5. [DOI] [PubMed] [Google Scholar]
- 4.Laurent S, Cockcroft J, Van Bortel L, Boutouyrie P, Giannattasio C, Hayoz D et al. Expert consensus document on arterial stiffness: methodological issues and clinical applications. Eur Heart J 2006;27:2588–605. [DOI] [PubMed] [Google Scholar]
- 5.Laurent S, Boutouyrie P. Arterial stiffness: a new surrogate end point for cardiovascular disease? J Nephrol 2007;20(Suppl. 12):S45–50. [PubMed] [Google Scholar]
- 6.Willum-Hansen T, Staessen JA, Torp-Pedersen C, Rasmussen S, Thijs L, Ibsen H et al. Prognostic value of aortic pulse wave velocity as index of arterial stiffness in the general population. Circulation 2006;113:664–70. [DOI] [PubMed] [Google Scholar]
- 7.Hansen TW, Li Y, Staessen JA, Jeppesen J, Rasmussen S, Wang JG et al. Independent prognostic value of the ambulatory arterial stiffness index and aortic pulse wave velocity in a general population. J Hum Hypertens 2008;22:214–6. [DOI] [PubMed] [Google Scholar]
- 8.Henskens LHG, Kroon AA, Van Oostenbrugge RJ, Gronenschild EHBM, Fuss-Lejeune MMJJ, Hofman PAM et al. Increased aortic pulse wave velocity is associated with silent cerebral small-vessel disease in hypertensive patients. Hypertension 2008;52:1120–6. [DOI] [PubMed] [Google Scholar]
- 9.Van Elderen SGC, Westenberg JJM, Brandts A, Van Der Meer RW, Romijn JA, Smit JWA et al. Increased aortic stiffness measured by MRI in patients with type 1 diabetes mellitus and relationship to renal function. Am J Roentgenol 2011;196:697–701. [DOI] [PubMed] [Google Scholar]
- 10.Selwaness M, Van Den Bouwhuijsen Q, Mattace-Raso FUS, Verwoert GC, Hofman A, Franco OH et al. Arterial stiffness is associated with carotid intraplaque hemorrhage in the general population: the Rotterdam Study. Arterioscler Thromb Vasc Biol 2014;34:927–32. [DOI] [PubMed] [Google Scholar]
- 11.Cavalcante JL, Lima JAC, Redheuil A, Al-Mallah MH. Aortic stiffness: current understanding and future directions. J Am Coll Cardiol 2011;57:1511–22. [DOI] [PubMed] [Google Scholar]
- 12.Redheuil A, Yu WC, Wu CO, Mousseaux E, De Cesare A, Yan R et al. Reduced ascending aortic strain and distensibility: earliest manifestations of vascular aging in humans. Hypertension 2010;55:319–26. [DOI] [PMC free article] [PubMed] [Google Scholar]
- 13.Bild DE, Bluemke DA, Burke GL, Detrano R, Diez Roux AV, Folsom AR et al. Multi-ethnic study of atherosclerosis: objectives and design. Am J Epidemiol 2002;156:871–81. [DOI] [PubMed] [Google Scholar]
- 14.Herment A, Lefort M, Kachenoura N, De Cesare A, Taviani V, Graves MJ et al. Automated estimation of aortic strain from steady-state free-precession and phase contrast MR images. Magn Reson Med 2011;65:986–93. [DOI] [PubMed] [Google Scholar]
- 15.Dogui A, Redheuil A, Lefort M, DeCesare A, Kachenoura N, Herment A et al. Measurement of aortic arch pulse wave velocity in cardiovascular MR: comparison of transit time estimators and description of a new approach. J Magn Reson Imaging 2011;33:1321–9. [DOI] [PubMed] [Google Scholar]
- 16.Weir JP. Quantifying test-retest reliability using the intraclass correlation coefficient and the SEM. J Strength Cond Res 2005;19:231–40. [DOI] [PubMed] [Google Scholar]
- 17.Ludbrook J. Linear regression analysis for comparing two measurers or methods of measurement: but which regression? Clin Exp Pharmacol Physiol 2010;37:692–9. [DOI] [PubMed] [Google Scholar]
- 18.Martin Bland J, Altman D. Statistical methods for assessing agreement between two methods of clinical measurement. Lancet 1986;327:307–10. [PubMed] [Google Scholar]
- 19.Grothues F, Smith GC, Moon JCC, Bellenger NG, Collins P, Klein HU et al. Comparison of interstudy reproducibility of cardiovascular magnetic resonance with two-dimensional echocardiography in normal subjects and in patients with heart failure or left ventricular hypertrophy. Am J Cardiol 2002;90:29–34. [DOI] [PubMed] [Google Scholar]
- 20.Herment A, Kachenoura N, Lefort M, Bensalah M, Dogui A, Frouin F et al. Automated segmentation of the aorta from phase contrast MR images: validation against expert tracing in healthy volunteers and in patients with a dilated aorta. J Magn Reson Imaging 2010;31:881–8. [DOI] [PubMed] [Google Scholar]
- 21.Stacey RB, Bertoni AG, Eng J, Bluemke DA, Hundley WG, Herrington D. Modification of the effect of glycemic status on aortic distensibility by age in the multi-ethnic study of atherosclerosis. Hypertension 2010;55:26–32. [DOI] [PMC free article] [PubMed] [Google Scholar]
- 22.Malayeri AA, Natori S, Bahrami H, Bertoni AG, Kronmal R, Lima JAC et al. Relation of aortic wall thickness and distensibility to cardiovascular risk factors (from the Multi-Ethnic Study of Atherosclerosis [MESA]). Am J Cardiol 2008;102:491–6. [DOI] [PMC free article] [PubMed] [Google Scholar]
- 23.Teixido G, Chugh A, Redheuil A, Liu CY, Stacey R, Wu C et al. Aortic biomechanics by MRI: relation with age, gender and traditional cardiovascular risk factors. A cross-sectional and longitudinal study: the Multi-Ethnic Study of Atherosclerosis (MESA). J Am Coll Cardiol 2012;59(13s1):E1069–69. [Google Scholar]
- 24.Vlachopoulos C, Aznaouridis K, Stefanadis C. Prediction of cardiovascular events and all-cause mortality with arterial stiffness: a systematic review and meta-analysis. J Am Coll Cardiol 2010;55:1318–27. [DOI] [PubMed] [Google Scholar]
- 25.Peralta CA, Adeney KL, Shlipak MG, Jacobs D Jr., Duprez D, Bluemke D et al. Structural and functional vascular alterations and incident hypertension in normotensive adults: the Multi-Ethnic Study of Atherosclerosis. Am J Epidemiol 2010;171:63–71. [DOI] [PMC free article] [PubMed] [Google Scholar]


