Abstract
Studies of individual T cells receptors (TCRs) have shed some light on structural features that underlie self-reactivity. However, general rules that predict whether TCRs are self-reactive have not been fully elucidated. Analyses of thymocytes expressing all Vβ family members show that the interfacial hydrophobicity of amino acids at positions 6 and 7 of the CDR3β segment robustly promotes the development of self-reactive TCRs. An index based on these findings distinguishes Vβ2+, Vβ6+ and Vβ8.2+ regulatory T cells from conventional T cells, as well as T cells selected on a major histocompatibility complex (MHC) allele associated with mouse type-1 diabetes from those selected on a non-autoimmune promoting MHC. These results provide a means for distinguishing normal and autoimmune-prone T cell repertoires.
The ability of αβ T cell repertoires to target pathogen-derived peptides displayed on major histocompatibility complex (MHC) molecules is acquired through the highly regimented process of T cell development. CD4+CD8+ double positive (DP) thymocytes express a unique T cell receptor (TCR) comprised of a TCRα and TCRβ chain, each generated through variable-diversity-joining (V(D)J) recombination1. This process creates repertoires of TCRs that have a graded scale of reactivity for self-peptides presented by host MHC molecules (self-pMHC). DP thymocytes expressing these receptors are then subject to thymic selection2, 3, 4, 5.
TCR transgenic models and in vivo reporters of TCR signaling, including those tracking the expression of the immediate early gene Nr4a1 (Nur77) and CD5, suggest that positive selection matures thymocytes with a range of moderate self-pMHC avidities or affinities4, 5. Naïve T cells are thought to mature following relatively weak TCR-self-pMHC interactions, whereas on average, anti-inflammatory lineages such as regulatory T cells (Treg cells) are thought to require increased TCR signals than naïve T cells for development2, 3, 4. DP thymocytes that fail to signal through engagement with self-pMHC, or receive very strong TCR signals are eliminated by developmental arrest and negative selection, respectively. Self-pMHC driven positive selection allows mature T cells to be MHC restricted, and results in a T cell repertoire that continually interacts with self-pMHC ligands4, 5, 6. As such, T cell homeostatic cues derived from self-pMHC interactions maintain T cell functionality; naïve T cells that receive the strongest homeostatic signals from self-pMHC ligands are optimally poised for responses to pathogens7, 8, 9 and Treg cells require continuous signaling through the TCR to limit the intrinsic auto-reactivity within the conventional T cell repertoire10, 11.
Given the immense diversity of MHC alleles and self-peptides12, how structural features of TCRs and T cell signaling networks coalesce to produce a graded scale of self-reactivity is less clear6, 13, 14, 15, 16, 17. To gain insights into the structural properties of TCR self-reactivity, we studied individual T cells and TCRs with distinct self-pMHC recognition properties. These include two TCRs, YAe62 and B3K506, which are reactive to a model foreign peptide, 3K, a variant of the Eα52–68 peptide in which the P2, P5 and P8 residues carry a lysine, presented by IAb. DP thymocytes expressing the B3K506 TCR differentiate into naïve CD4+ T cells in C57BL/6 mice. In contrast, DP thymocytes expressing the YAe62 TCR are eliminated by negative selection in C57BL/6 mice18. Structural analyses showed that the YAe62 TCR primarily uses TCRβ residues to bind to IAb-3K, whereas the B3K506 TCR more evenly uses both the TCRα and TCRβ chains19. Observing that the YAe62 TCR is self-reactive and binds IAb-3K primarily using TCRβ-pMHC interactions, has led us to hypothesis that variable residues within TCRβ chains can bias fully rearranged TCRs to be self-reactive. Although the mechanisms by which TCR sequence might influence the self-reactivity of T cells remains unclear, previous experimental and computational studies suggest that particular amino acid residues within the TCR-pMHC interface may promote pMHC cross-reactivity18, 20, 21, 22.
Here we tested whether biochemical features of complementary determining region 3 in the TCRβ chain (CDR3β) influenced the ability of TCRs to recognize self-pMHC ligands. We identified key “signature sequences” at positions 6 and 7 of TCR CDR3β that promote or limit self-reactivity. We observed that the frequency at which self-reactive T cell receptors were generated directly correlated with the interfacial hydrophobicity of these residues. This finding allowed the skewing events of T cell positive and negative selection to be indexed based on the biochemical features and usage of each of the 400 possible CDR3β P6–7 doublets. Examination of C57BL/6 mice revealed that positive selection enriches the naïve CD4+ and CD8+ T cell repertoires with TCRs that carry CDR3β P6–7 doublets that promote moderate self-reactivity. CD4+ Treg cell and naïve CD4+ T cell repertoires that develop in NOD mice or mice expressing the NOD MHC showed a further enrichment in TCRs carrying hydrophobic CDR3β P6–7 doublets that promote self-reactivity, as compared to naïve CD4+ T cells in C57BL/6 mice. These results provide insights into the mechanism by which repertoires of TCRs are created with differing strengths of self-reactivity, and reveal how self-reactivity biases are reflected in normal and autoimmunity-prone T cell repertoires.
Results
YAe62β+ DP thymocytes strongly react with self-pMHC
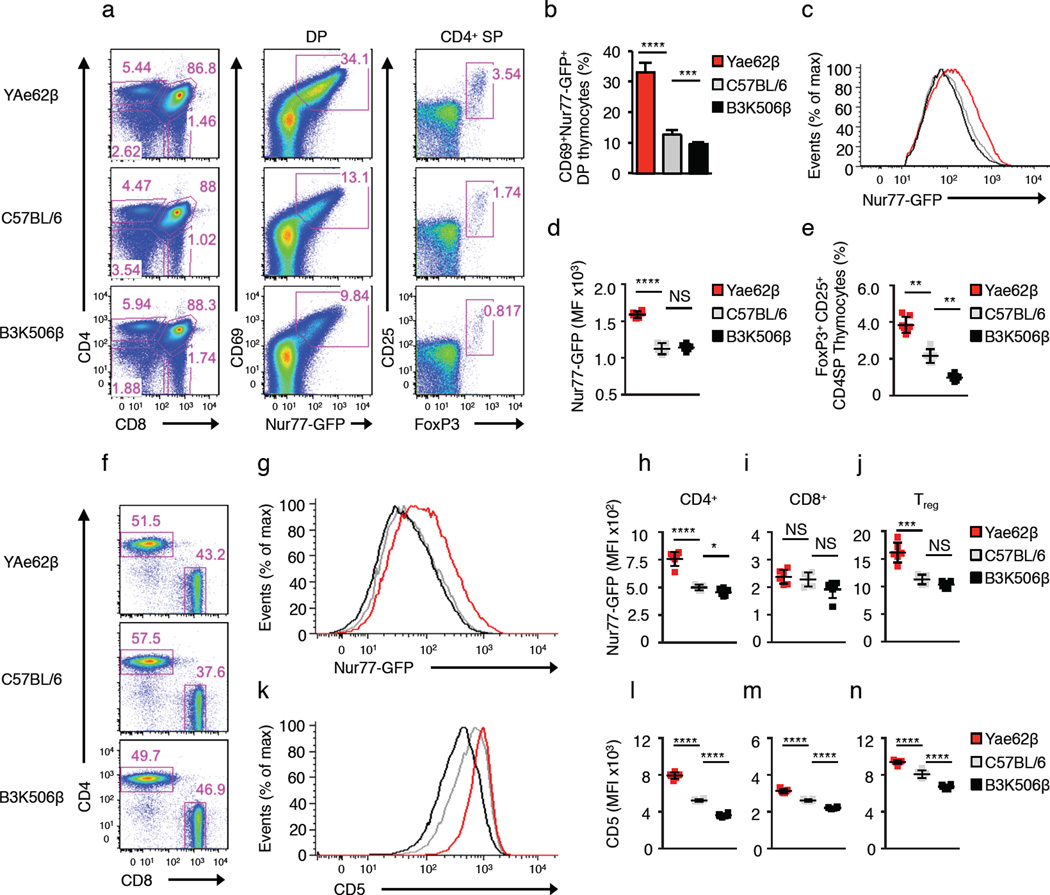
We hypothesized that the YAe62β chain biases TCRs to recognize self-pMHC ligands. To test this, we compared DP thymocyte activation and the development of mature T cells in transgenic mice that express the YAe62β chain or the B3K506β chain (YAe62β and B3K506β mice, respectively). In YAe62β mice, approximately one third of the DP thymocytes expressed the activation markers CD69 and Nur77-GFP, a nuclear proxy of the strength of TCR signals23, indicating they had received robust TCR signals from self-pMHC ligands, and are thus defined as self-reactive.
The frequency of self-reactive YAe62β+ DP thymocytes is three-fold and four-fold increased relative to DP thymocytes in wild-type C57BL/6 mice and B3K506β mice, respectively (Fig. 1a,b). As measured by Nur77-GFP expression, YAe62β+ DP thymocytes interacting with self-pMHC generated increased TCR signals compared to wild-type C57BL/6 and B3K506β+ DP thymocytes, (Fig. 1c,d). However, because the total number of mature CD4+ or CD8+ single positive thymocytes generated in YAe62β and B3K506β mice was similar, many of the self-reactive YAe62β+ thymocytes may be undergoing negative selection. Mirroring the DP thymocyte self-reactivity profiles, the number of CD4+ CD25+ Foxp3+ thymic Treg cells produced by YAe62β mice was 4-fold more than B3K506β mice (Fig. 1e). In addition, splenic CD44lo CD62L+ naïve CD4+ T cells from YAe62β mice, and to a lesser extent naïve CD8+ T cells and Treg cells, expressed higher levels of Nur77-GFP (Fig. 1f–j) and CD5 (Fig. 1k–n), as compared to equivalent T cells in B3K506β mice. These data suggest that T cells expressing the YAe62β chain have a higher affinity or avidity for self-pMHC in the H-2b background as compared to B3K506β+ T cells.
Figure 1.
The YAe62β chain predisposes TCRs to interact with H-2b self-pMHC ligands. (a) Flow cytometric analysis of CD4 and CD8-expressing thymocyte subsets in YAe62β, C57BL/6 and B3K506β mice show hierarchical generation of DP cells that co-express CD69 and Nur77-GFP, and CD4+ Foxp3+ Treg cells. (b) Percentages of DP thymocytes expressing CD69 and Nur77-GFP and (c,d) expression level of Nur77-GFP in Nur77+CD69+ in YAe62β (red), C57BL/6 (gray) and B3K506β (black) DP thymocytes. (e) Quantification of CD4+ SP thymocytes expressing CD25 and Foxp3. (f–n) Flow cytometric analysis of TCR+ B220− splenic subsets from YAe62β, C57BL/6 and B3K506β mice. (f) Representative dot plots of CD4+ and CD8+ T cell frequencies. (g–j) Expression of Nur77-GFP expression in (g,h) CD4+ (i) CD8+ and (j) Treg cell subsets. (k–n) CD5 expression level in (k,l) CD4+ (m) CD8+ and (n) Treg cell subsets. NS, not statistically significant, *P <0.05; **P < 0.01; ***P < 0.001; ****P < 0.0001 (unpaired two-tailed Student’s t-test). Data are combined from two independent experiments with a total of n = 6 (b–e, h-n mean ± s.e.m.), 6–8 week old YAe62β, C57BL/6 and B3K506β mice. Dot plots shown are representative of each experiment.
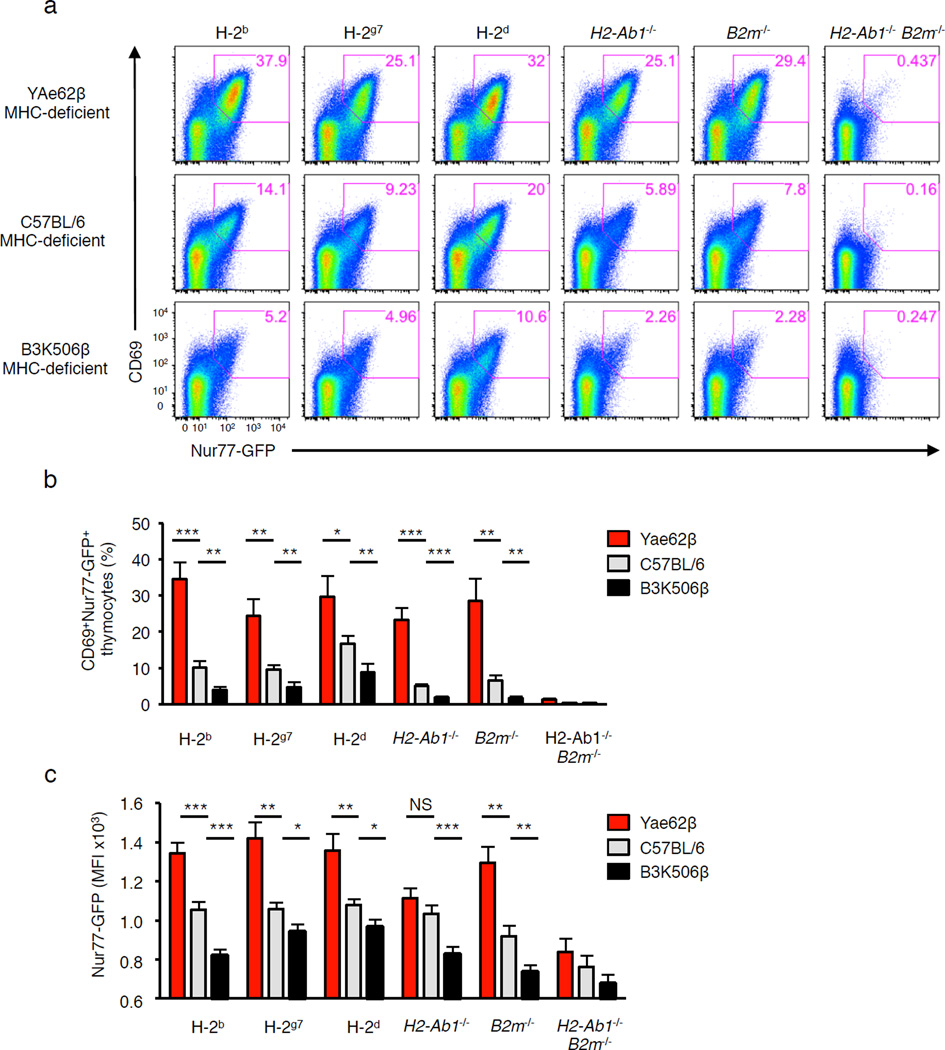
We next tested whether the inclusion of YAe62β chain into TCRs induces self-reactivity only on an IAb background, or promotes a broader self-pMHC recognition to different MHC alleles. To address this question, we analyzed the expression of CD69 and Nur77-GFP on YAe62β+, wild-type C57BL/6 and B3K506β+ DP thymocytes, isolated from B2m−/− H2-Ab1−/− (MHC-deficient) mice, following incubation with bone marrow-derived dendritic cells (BMDC) expressing various MHC haplotypes. TCR+ CD69neg Nur77-GFPneg DP thymocytes isolated from B2m−/− H2-Ab1−/− mice (defined as pre-selection thymocytes) were used to ensure they had not previously engaged self-pMHC molecules. Approximately 25–35% of YAe62β+ pre-selection thymocytes were reactive to BMDC expressing H-2b, as well as H-2g7 and H-2d MHC molecules (Fig. 2a,b). In contrast, only 5–10% of the B3K506β+ pre-selection thymocytes showed responses to BMDC expressing each of the MHC haplotypes tested, with pre-selection thymocytes expressing polyclonal TCRβ chains in between. Furthermore, ~25% of YAe62β+ pre-selection thymocytes expressed CD69 and Nur77-GFP following incubation with B2m−/− and H2-Ab1−/− BM-DC (Fig. 2a,b), indicating that the ability of the YAe62β chain to promote recognition self-pMHC ligands is not MHC class specific. In addition, self-pMHC activated YAe62β+ pre-selection thymocytes expressed higher levels of Nur77-GFP, as compared to similarly activated B3K506β+ pre-selection thymocytes (Fig. 2c). These data argue that properties encoded in the YAe62β chain promote a high frequency of randomly paired TCRs to engage self-pMHC ligands that is independent of MHC allele being recognized.
Figure 2.
Thymocytes expressing the YAe62β chain are biased to react with self-peptides presented by multiple haplotypes of MHC. (a) Pre-selection TCRβ+ DP thymocytes derived from 4–6 week old H2-Ab1−/− B2m−/− (MHC-deficient) YAe62β, C57BL/6 and B3K506β mice were cultured with BM-DC generated from C57BL/6 (H2b), NOD (H2g7), Balb/c (H2d), C57BL/6.H2-Ab1−/− (MHCII-deficient), C57BL/6.B2m−/− (MHCI-deficient), or C57BL/6.H2-Ab1−/−B2m−/− (MHC-deficient) mice, and analyzed for the expression of CD69 and Nur77-GFP. Representative dot plots are shown from two independent experiments. (b) Quantification of the frequency at which DP thymocytes express CD69 and Nur77-GFP following culture with BM-DC. (c) Nur77-GFP expression levels on activated (Nur77+CD69+) DP thymocytes. *P <0.05; **P < 0.01; ***P < 0.001; ****P < 0.0001 (unpaired two-tailed Student’s t-test). Data are combined from two independent experiments for (n = 6) YAe62β, C57BL/6 and B3K506β mice (b,c mean ± s.e.m.).
The CDR3β P6–7-doublet FW promotes TCR recognition of self-pMHC
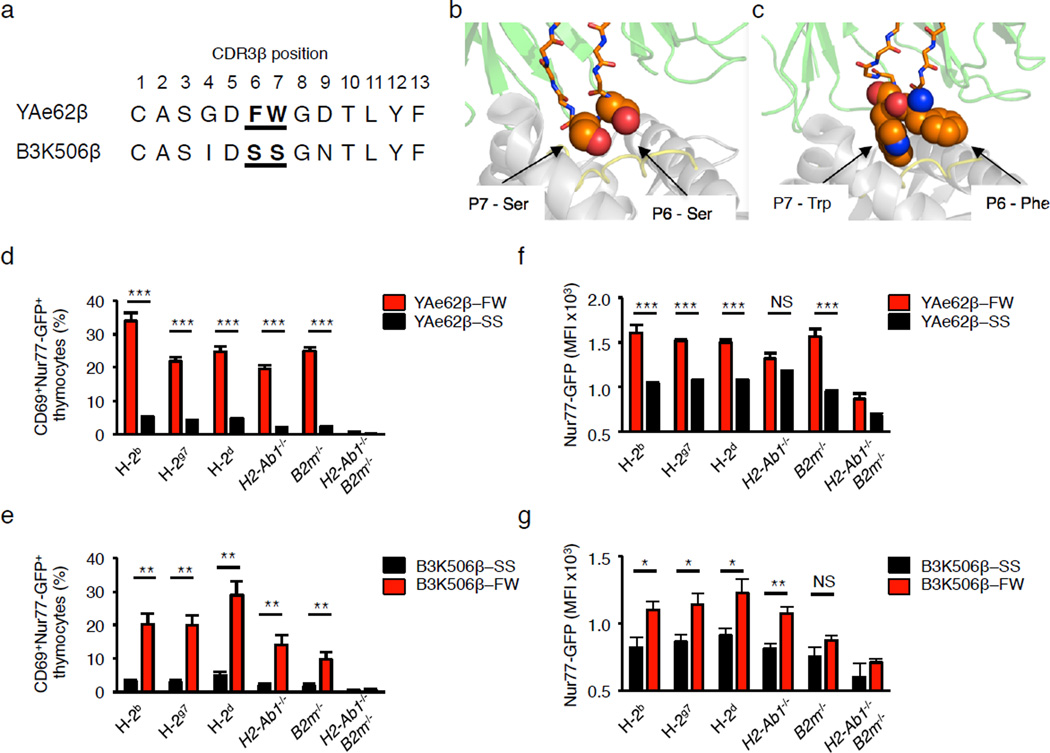
To identify features that can predispose TCRs to recognize self-pMHC ligands, we compared the YAe62β and B3K506β chain sequences. The TCRβ chains are members of the Vβ8 family – the YAe62β is a Vβ8.2 while the B3K506β is a Vβ8.1 – and have CDR3β segments comprised of 13 amino acids counting from the conserved Vβ Cys to Jβ Phe. The major difference occurs within the CDR3β at positions 6 and 7; the YAe62β chain carries a Phe and Trp (FW), whereas the B3K506β chain carries two Ser (SS) (Fig. 3a). These two residues are important for ligand recognition, as they are centrally located within the TCR-pMHC interface (Fig. 3b,c).
Figure 3.
B3K506β+ pre-selection thymocytes expressing the CDR3β P6–7 doublet, FW, show increased recognition of self-pMHC ligands. (a) Alignment of CDR3β sequences from Yae62 and B3K506 TCRs, with residues P6 and P7 sequences in bold. (b,c) The YAe62 (b) and B3K506 (c) CDR3β residues P6 and P7 (orange) interact with amino acids of the peptide (yellow) and MHCII (white), PDB 3C6L, 3C5Z. (d,e) Quantification of the frequency at which pre-selection thymocytes express CD69 and Nur77-GFP following culture with BM-DC. (f,g) Nur77-GFP expression levels on activated Nur77+CD69+ pre-selection thymocytes from TCRβ retrogenic mice expressing the YAe62β chain (d,f) or the B3K506β chain (e,g) carrying the CDR3β P6–7 doublet, FW or SS, following incubation with BM-DC. BM-DC were derived from C57BL/6 (H2b), NOD (H2g7), Balb/c (H2d), C57BL/6.H2-Ab1−/−, C57BL/6.B2m−/−, or C57BL/6.H2-Ab1−/−B2m−/− mice. NS, not statistically significant, *P <0.05; **P < 0.01; ***P < 0.001; ****P < 0.0001 (unpaired two-tailed Student’s t-test). Data are combined from two independent experiments YAe62β-FW (n = 8), YAe62β-SS (n = 10), B3K506β-SS (n = 4), B3K506β-FW (n = 7) retrogenic mice were analyzed four weeks post-reconstitution (d–g, mean ± s.e.m.).
If the CDR3β residues 6 and 7 (referred to as CDR3β P6–7 doublet) have a deterministic role in regulating self-pMHC recognition, swapping the CDR3β P6–7 doublet between YAe62β and B3K506β chains should reverse the intrinsic self-reactivity associated with these chains. To test this, TCRβ retrogenic mice were constructed using TCRB−/− B2m−/− H2-Ab1−/− donor BM and recipient hosts, that expressed the YAe62β and B3K506β chains carrying either the FW or SS CDR3β P6–7 doublet (YAe62β-FW, YAe62β-SS, B3K506β-FW and B3K506β-SS mice, respectively). Pre-selection thymocytes isolated from these mice were then cultured with BMDC expressing various MHC haplotypes. We observed that only 4–6% of YAe62β-SS pre-selection thymocytes expressed CD69 and Nur77-GFP following culture with BMDC expressing H-2b, H-2g7 and H-2d MHC molecules (Fig. 3d). In contrast, 20–30% of B3K506β-FW pre-selection thymocytes were activated by similar BMDC (Fig. 3e). In addition, self-pMHC activated YAe62β-FW and B3K506β-FW pre-selection thymocytes expressed greater amounts of Nur77-GFP as compared to similar thymocytes expressing the YAe62β-SS and B3K506β-SS chains (Fig. 3. f,g). Thus, the CDR3β P6–7-doublet FW increases the frequency and the affinity or avidity of TCR recognition of self-pMHC ligands.
CDR3β P6–7 doublets routinely interact with pMHC residues
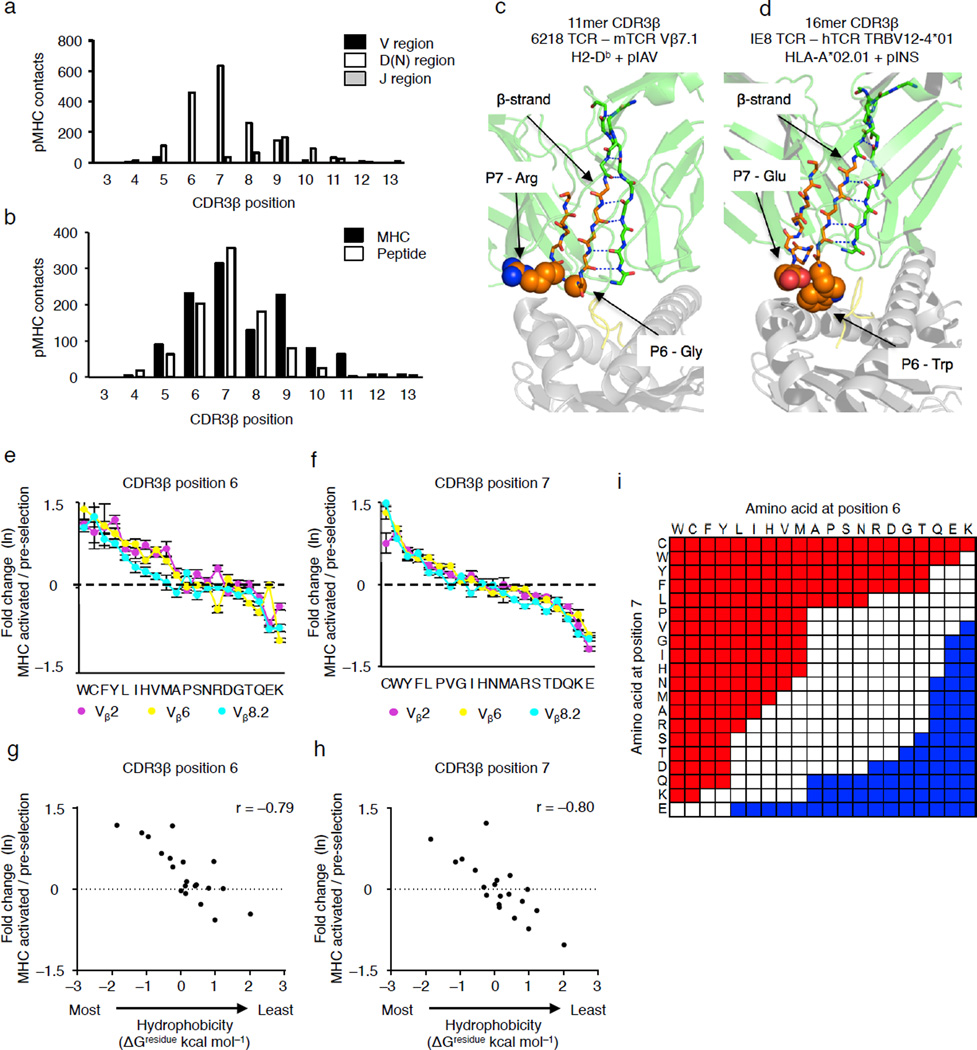
We next investigated whether the positioning of the CDR3β P6–7 doublet within the TCR-pMHC interface is dependent upon the TCR Vβ or CDR3β length. 53 human and mouse TCRs that express a range of Vβs and CDR3β lengths, bound to MHC class I and MHC class II ligands were analyzed (Supplementary Table 1). Within this group, all 53 TCRs used either CDR3β P6 or P7 to contact the pMHC, and in 43 structures, both residues interact with the pMHC (Fig. 4a and Supplementary Table 1). These CDR3β P6–7 doublet residues collectively make a similar number of contacts with the peptide and with the MHC (Fig. 4b).
Figure 4.
Generation of a self-reactivity index based on the identity of the amino acid residues at CDR3β positions 6 and 7. (a,b) Summation of atom-atom contacts from 53 mouse and human TCR-pMHC complexes created by CDR3β residues, categorized by TCR: Vβ, Dβ-N and Jβ (a), or by MHC and peptide residues (b). (c,d) A β-strand places the CDR3β residues P6 and P7 (orange) within the TCR-pMHC interface, PDB:3PQY50 (c) and PDB:3UTS (d). (e,f) Rank order plots of the fold change in amino acid usage for Vβ2+ (purple), Vβ6+ (yellow) and Vβ8.2+ (cyan) pre-selection thymocytes expressing TCR with CDR3β of 13–15 amino acids long. The fold change is the ratio at which an amino acid is expressed in self-pMHC activated CD69+Nur77-GFP+ pre-selection thymocytes compared to unstimulated pre-selection thymocytes, with values plotted as the natural log (ln). (g,h) Scatter plot of CDR3β P6 and P7 fold change in usage and the interfacial hydrophobicity values (ΔGresidue kcal mol−1) of each amino acid. (i) Self-reactivity index, calculated by multiplying the fold change of single amino acid usage values, shown in e and f. CDR3β P6–7 doublets that promote self-reactivity (red) are defined as having a fold change > e0.4, doublets that limit self-reactivity (blue) are defined as having a fold change < e−0.35 (see Supplementary Fig. 3c). Spearman correlation coefficients, r, were calculated using GraphPad Prism software. Data are combined from three biological replicates (e–h) (e,f, mean ± s.e.m.).
Analyses further revealed at least two structural constraints within TCRs that underpin the localization of the CDR3β P6–7 doublet within TCR-pMHC interfaces. Within Vβ domains, residues 87–93, which include the first four amino acids of the CDR3β, are part of the conserved β sheet structure defining the Ig domain and are locked in an anti-parallel β strand with Vβ residues 29–35 via a hydrogen-bonding network (Fig 4c,d). This positioning of the Vβ 87–93 β strand is secured by an internal disulfide bond between Vβ Cys21 and Cys90, which connects the Vβ B and F strands at the center of the Ig domain (Supplementary Fig. 1)24. These results suggest that the locations of these structural elements are conserved throughout TCRs, and as such the CDR3β P6–7 doublet was consistently located at a surface-exposed position within the TCR binding site.
Hydrophobicity of CDR3β P6–7 doublets predicts self-reactivity
CDR3β P6–7 doublets were highly diverse in the 53 TCR-pMHC structures analyzed, as they are primarily derived from the Dβ gene segment and random N-additions1. To test if CDR3β P6–7 doublets function as a tunable measure (or index) of self-reactivity of the TCR repertoire, we used next-generation sequencing to identify the frequency at which each amino acid is expressed at CDR3β residues P6 and P7 on pre-selection thymocytes and pre-selection thymocytes that expressed CD69 and Nur77-GFP following incubation with fibroblasts that express H2-Kb, H2-Db, H2-Kd, I-Ab, I-Ad or I-Ag7 (classified as self-reactive). We initially analyzed thymocytes repertoires expressing mouse Vβ2, Vβ6 and Vβ8.2, to identify motifs that promote the development of self-reactive TCRs (Supplementary Table 2). This approach was used such that confirmatory experiments could test whether identified motifs that regulate self-reactivity are dependent or independent of TCR expressing a particular Vβ family.
We observed that similar amino acids were enriched or depleted, up to ~e±1.5-fold at CDR3β P6 and P7, in pre-selection thymocytes that upregulated CD69 and Nur77-GFP following culture with MHC-expressing fibroblasts, as compared to unstimulated pre-selection thymocytes, irrespective of whether the thymocytes express a Vβ2+, Vβ6+ or Vβ8.2+ TCR (Fig. 4e,f and Supplementary Table 3). The frequency at which pre-selection thymocytes were activated by self-pMHC correlated with the interfacial hydrophobicity of CDR3β P6 and P7 residues, as well as octanol/water partitioning, a classic measure of the hydrophobic effect (Fig. 4g,h and Supplementary Fig. 2)25.
A self-reactivity index that accounts for the amino acids expressed at both CDR3β P6 and P7 was developed. We multiplied the fold change in amino acid usage at CDR3β P6 and P7 (defined in Fig. 4e,f) for each of the 20 amino acids. This resulted in a self-reactivity index value for the 400 potential CDR3β P6–7 doublets (Fig. 4e–i). This approach was used because TCR rearrangement creates many CDR3β P6–7 doublets at very low frequencies (<10−6), which precludes observing differential expression due to statistical uncertainties (Supplementary Fig. 3a,b). Because the level of self-reactivity is a continuous scale, accuracy and completeness equations were used to identify threshold values of e0.4 and e−0.375 to categorize CDR3β P6–7 doublets as ones that promote, are equal to, or reduce the level of self-reactivity that naturally occurs in the pre-selection thymocytes repertoire (Supplementary Fig. 3c,d and Methods). These threshold values were chosen because they provided >96% accuracy, and simultaneously retained 73% of CDR3β P6–7 doublets that show significant enrichment and 52% of CDR3β P6–7 doublets that show significant depletion (Supplementary Figs. 3c,d and 4).
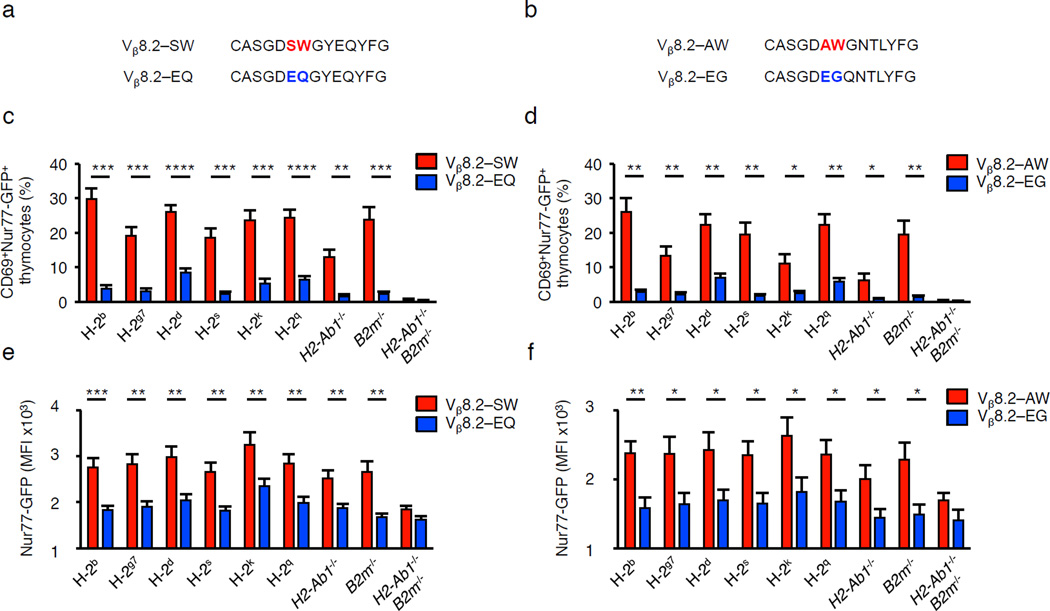
To initially test the predictive value of the self-reactivity index, we constructed and analyzed Vβ8.2-SW, Vβ8.2-EQ, Vβ8.2-AW and Vβ8.2-EG retrogenic mice using TCRB−/− B2m−/− H2-Ab1−/− donor BM and recipient hosts. The Vβ8.2-SW and Vβ8.2-EQ, as well as the Vβ8.2-AW and Vβ8.2-EG TCRβ chains differ only at the CDR3β P6–7 doublets (Fig. 5a,b). 13–30% of pre-selection thymocytes isolated from Vβ8.2-SW or Vβ8.2-AW mice upregulated CD69 and Nur77-GFP expression following culture with BMDC expressing the H-2b, H-2g7, H-2d, H-2k and H-2q haplotypes (Fig. 5c,d). In contrast, only 2–6% of pre-selection thymocytes carrying the Vβ8.2-EQ or Vβ8.2-EG chains expressed CD69 and Nur77-GFP. In addition, self-pMHC activated pre-selection thymocytes expressed higher amounts of Nur77-GFP when carrying the Vβ8.2-SW or Vβ8.2-AW TCRβ chain, when compared to pre-selection thymocytes carrying Vβ8.2-EQ or Vβ8.2-EG chains (Fig. 5e,f).
Figure 5.
The identical CDR3β P6–7 doublets promote or limit pre-selection DP thymocytes to react with multiple haplotypes and alleles of MHC. (a–f) Sequence (a,b), quantification of the frequency at which CD4+CD8+ thymocytes express CD69 and Nur77-GFP (c,d), and Nur77-GFP expression levels on activated Nur77+CD69+ DP thymocytes isolated from TCRβ retrogenic mice (e,f) that express Vβ8.2-Jβ2.4 TCRs carrying the CDR3β P6–7 doublet, AW or EG, or Vβ8.2-Jβ2.7 TCRs carrying SW or EQ, following culture with BM-DC that express the H-2b, H-2g7, H-2s, H-2k, H-2q, H-2d, H2-Ab1−/−, B2m−/− or H2-Ab1−/− and B2m−/− (MHC-deficient) haplotype. *P <0.05; **P < 0.01; ***P < 0.001; ****P < 0.0001 (unpaired two-tailed Student’s t-test). Data are combined from two independent experiments for (SW n = 6, AW, EQ, EG n = 5) mice (b–f, mean ± s.e.m.).
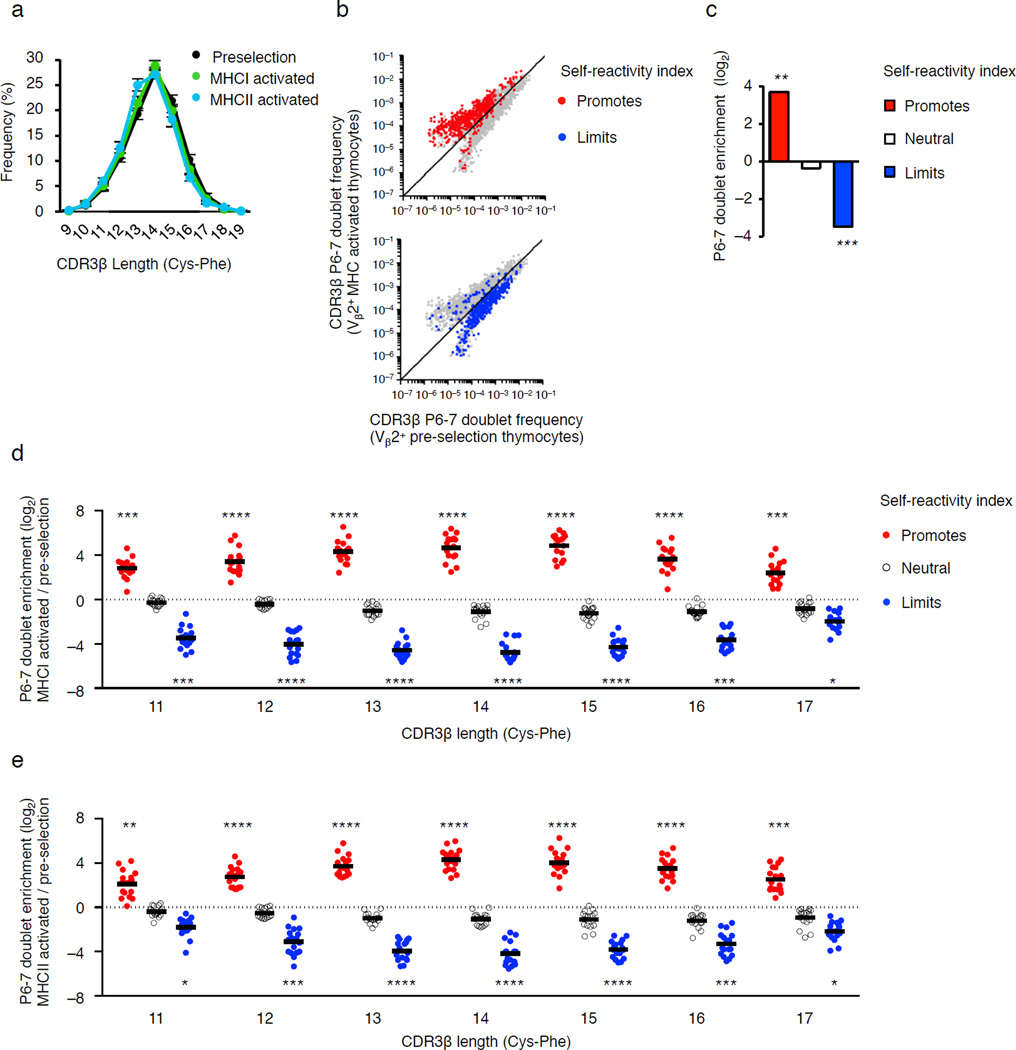
We next tested the fidelity of the self-reactivity index for Vβ1–Vβ20 TCRs. We first evaluated the length of CDR3β segments carried by pre-selection thymocytes and self-reactive pre-selection thymocytes. We observed that ~98% of all pre-selection thymocytes, as well as pre-selection thymocytes that expressed CD69 and Nur77-GFP following incubation with H2-Ab1−/− BM-DC (MHCI activated) or B2m−/− BM-DC (MHCII activated), carried CDR3β segments that range from 11–17 amino acids (Fig. 6a). Based on these findings, we analyzed TCRs carrying CDR3β segments that range from 11–17 amino acids. Comparing the frequency of different doublets in the same repertoire is not informative (see Methods). Therefore, we then employed Bayesian statistics (see Methods) to identify and plot CDR3β P6–7 doublets whose frequencies in Vβ2+ pre-selection thymocytes were significantly enriched or depleted as compared to MHCI- and MHCII-activated Vβ2+ pre-selection thymocytes (Fig. 6b). A hypergeometric test of these plots revealed that CDR3β P6–7 doublets predicted to promote self-reactivity by our calculated index were significantly enriched in MHCI- and MHCII-activated repertoires, while CDR3β P6–7 doublets predicted to limit self-reactivity were significantly depleted (Fig. 6c). This approach was then used to individually analyze and plot the enrichment of CDR3β doublets expressed by Vβ1-Vβ20+ TCRs, partitioned by CDR3β length, in MHCI-activated (Fig. 6d) and MHCII-activated pre-selection thymocytes (Fig. 6e), as compared to unstimulated pre-selection thymocytes. Hypergeometric test of the data revealed that CDR3β P6–7 doublets predicted to promote self-reactivity by our calculated index were significantly enriched in Vβ1–Vβ20+ pre-selection thymocytes that react with MHC class I or MHC class II alleles, compared to unstimulated pre-selection DP thymocytes. In contrast, CDR3β P6–7 doublets predicted to limit self-reactivity were depleted from the MHCI- and MHCII-activated pre-selection thymocytes repertoires (Fig. 6d,e). Thus, the self-reactivity index identifies self-reactivity biases of TCRs irrespective of the Vβ, CDR3β length or the MHC class or allele being recognized.
Figure 6.
CDR3β P6–7 doublets regulate DP thymocyte reactivity to self-pMHC irrespective Vβ family or CDR3β length. (a) Frequency of TCR CDR3β lengths expressed by pre-selection thymocytes isolated from H2-Ab1−/− and B2m−/− (MHC-deficient) mice (black), or pre-selection thymocytes that express CD69 and Nur77-GFP following culture with H2-Ab1−/− BMDC (MHCI-activated, green) or B2m−/− BMDC (MHCII-activate, blue). (b) Scatter plot of the CDR3β P6–7 doublets that are differentially expressed between Vβ2+ pre-selection thymocytes versus BM-DC activated pre-selection thymocytes. CDR3β P6–7 doublets indexed as promoting (red) or limiting (blue) self-reactivity are highlighted. (c) Fold change in the number of differentially expressed CDR3β P6–7 doublets that promote, are neutral or limit self-reactivity expressed by BMDC activated Vβ2+ pre-selection thymocytes compared to Vβ2+ pre-selection thymocytes. (d,e) Differential expression of CDR3β P6–7 doublets by TCRs carrying 17 different mouse Vβs arranged by CDR3β length. The self-pMHC activated thymocytes responded to BM-DC derived from H2-Ab1−/− (d) or B2m−/− (e) mice. Note each dot is a particular Vβ family with bars indicating the average fold change among the 17 Vβs. *P < 10−4, **P < 10−25, ***P < 10−50, ****P < 10−100 (hypergeometric test, red or blue doublets compared to total population). Data are summation derived from Vβ2+, Vβ6+ and Vβ8+ TCRs with CDR3β loops of 11–17 amino acids (c) or TCRs carrying one of 17 individual Vβ families (d,e). For each Vβ, data are the average frequency from three independent biological replicates (a–e). (a, mean ± s.e.m.).
Differential usage of CDR3β P6–7 doublets by T cells subsets
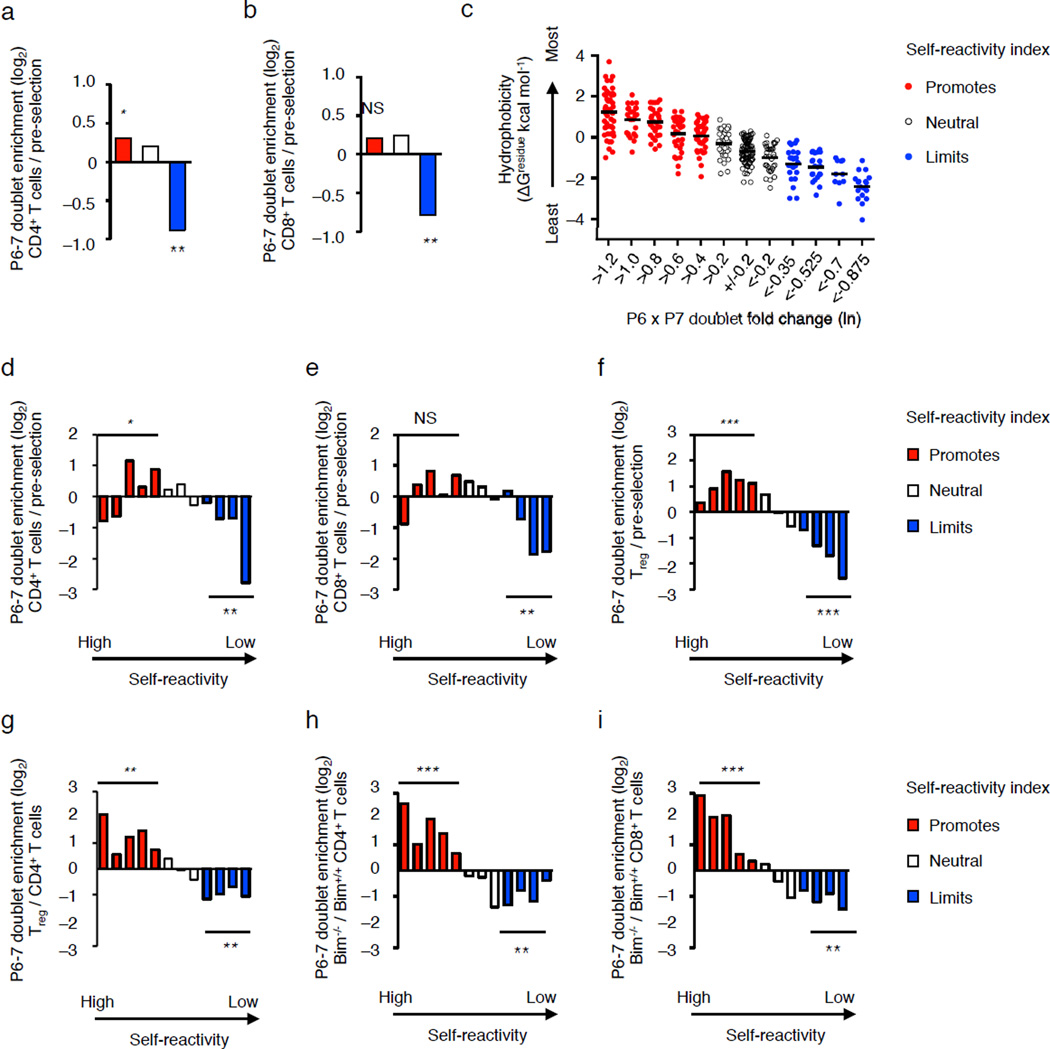
Thymic selection may bias mature T cell repertoires to carry TCR with certain types of amino acids within the antigen-binding site. To test this, we compared the frequency of CDR3β P6–7 doublets expressed on pre-selection thymocytes, isolated from B2m−/− H2-Ab1−/− mice, with those expressed on mature CD4+ and CD8+ T cells isolated from MHC expressing mice. Compared to pre-selection thymocytes, Vβ2+, Vβ6+ and Vβ8.2+ TCRs expressed by splenic naïve CD4+ and CD8+ T cell isolated from C57BL/6 mice were depleted of the CDR3β P6–7 doublets that limit self-reactivity (Fig. 7a,b). We further partitioned the CDR3β P6–7 doublets into twelve groups, based on e0.2-fold changes in self-reactivity index enrichment factors, which correlates with the interfacial hydrophobicity of the doublet (Fig. 7c). This approach indicated that naïve CD4+ and CD8+ T cell repertoires in C57BL/6 mice were enriched in CDR3β P6–7 doublets that moderately promote self-reactivity, and are depleted of CDR3β P6–7 doublets with the weakest interfacial hydrophobicity (Fig. d,e). These data suggest that positive selection matures thymocytes with a range of moderate self-pMHC avidity or affinity4, 5.
Figure 7.
Thymic selection biases the CDR3β P6–7 doublet usage of mature Vβ2+, Vβ6+ and Vβ8.2+ T cells. (a,b) Fold change in the number of differentially expressed doublets that promote (red), are neutral (white) or limit (blue) self-reactivity among naïve CD4+ (a), and CD8+ T cells (b) in C57BL/6 mice as compared to pre-selection DP thymocytes. (c) Average interfacial hydrophobicity of CDR3β P6–7 doublet partitioned into 12 groups based on e0.2-fold changes in the self-reactivity, each dot represents a particular CDR3β P6–7 doublet. (d–f) Fold change in the number of differentially expressed doublets for naïve CD4+ T cells (d), naïve CD8+ T cells (e) or Treg cells (f), compared to pre-selection thymocytes. (g–i) Fold change in the number of differentially expressed doublets for Treg cells (f) or Bim−/− CD4+ T cells compared to C57BL/6 CD4+ T cells, and (i) Bim−/− CD8+ T cells compared to C57BL/6 CD8+ T cells. NS, not statistically significant, *P < 10−4, **P < 10−10, ***P < 10−25 (hypergeometric test, all red or all blue doublets compared to total population). Data are summation derived from Vβ2+, Vβ6+ and Vβ8.2+ TCRs with CDR3β loops of 11–17 amino acids, obtained by the average frequencies from three independent biological replicates (a,b,d–i). (c) Bar represents average hydrophobicity within the group.
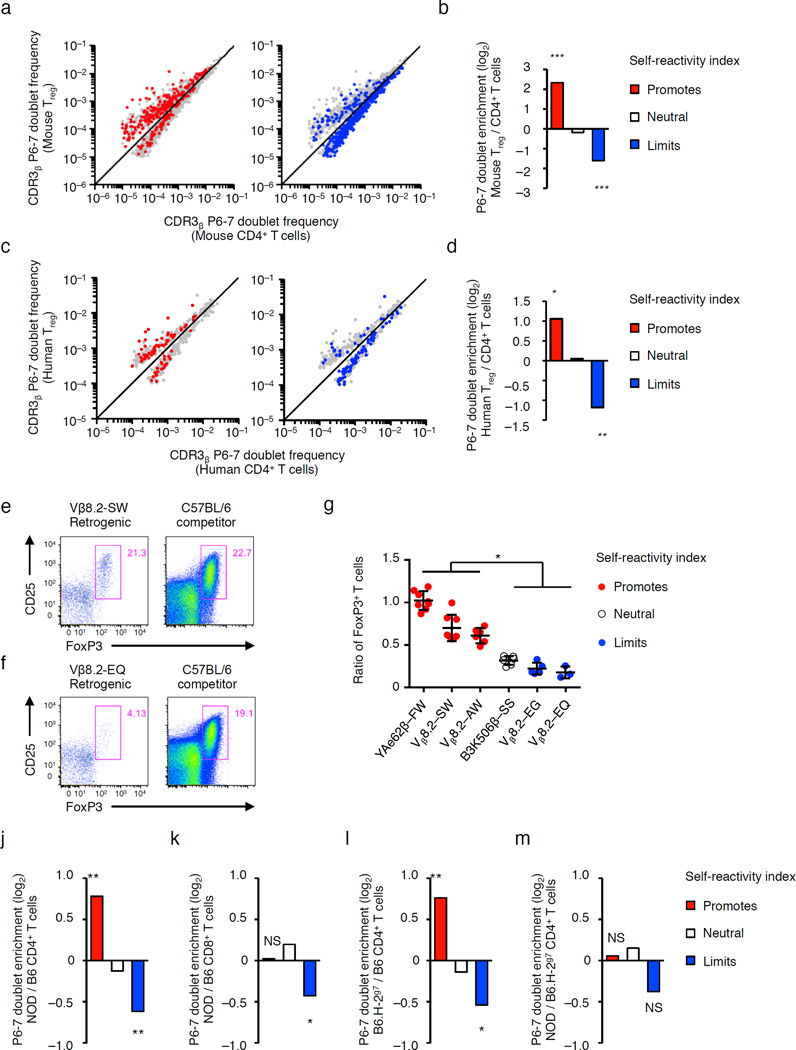
TCRs expressed on splenic CD25+ Foxp3+ CD4+ Treg cells isolated from C57BL/6 mice (and three other genetic backgrounds) carried increased frequencies of hydrophobic CDR3β P6–7 doublets that promote self-reactivity, compared to pre-selection thymocytes (Fig. 7f), and CD4+ T cells isolated from the same mice (Fig. 7g and Supplementary Fig. 5a). TCRs expressed on splenic CD4+ and CD8+ T cells isolated from Bim−/− mice26, which have deficiencies in thymic negative selection, were enriched in the most hydrophobic CDR3β P6–7 doublets compared to TCRs expressed on splenic T cells isolated from C57BL/6 mice (Fig. 7 h,i). Importantly, biased usage of CDR3β P6–7 doublets by mouse CD4 T cells or Treg cells was observed across the full range of TCR rearrangement frequencies (Fig. 8a,b). In addition, TRBV10+, TRBV19+ and TRBV28+ TCRs, which are homologues of mouse Vβ8.1, Vβ6 and Vβ7, respectively, expressed on human CD4+ CD127lo CD25+ Treg cells isolated from the blood of seven donors also showed significant enrichment in hydrophobic CDR3β P6–7 doublets and were depleted in CDR3β P6–7 doublets that limit self-reactivity as compared to naïve CD4+ CD25−CD45RO− CD27+ CCR7+ CD95− T cells isolated from the same donors (Fig. 8c,d and Supplementary Table 4).
Figure 8.
Mouse and human Treg cells and CD4+ T cells in NOD mice are enriched in CDR3β P6–7 doublets that promote self-reactivity. (a–d) Scatter plot and fold change of CDR3β P6–7 doublets differentially expressed by mouse (a,b), and human Treg cells versus naive CD4+ T cells (c,d). (e–f) Representative CD25 and Foxp3 expression in CD4+ T cells that develop in mixed TCR Vβ8.2-SW (e) or Vβ8.2-EQ (f) retrogenic plus C57BL/6 bone marrow chimeric mice. (g) Ratio of retrogenic- to C57BL/6-derived Treg cells in mixed chimeras where the retrogenic TCRβ chain (or Tg TCRβ) carries different CDR3β P6–7 doublets. (h–k), Fold change of differentially expressed CDR3β P6–7 doublets in (h) NOD versus C57BL/6 (B6) CD4+ T cells, (i) NOD versus B6 CD8+ T cells, (j) B6.H-2g7 versus B6 CD4+ T cells, and (k) NOD versus B6.H-2g7 CD4+ T cells. NS, not statistically significant, *P < 10−4; **P < 10−10; ***P < 10−25 (b,d,j–m hypergeometric test, red or blue doublets compared to total population g, multiple 2 tailed t tests). Data are summation derived from Vβ2+, Vβ6+ and Vβ8.2+ TCRs with CDR3β loops of 11–17 amino acids from three independent biological replicates (a,b,j–m), or human TRBV10+, TRBV19+ and TRBV28+ TCRs with CDR3β loops of 13–15 amino acids from seven individuals (c,d). (g) Data are derived from two independent experiments for YAe62β FW (n=8), Vβ8.2 SW (n=8), Vβ8.2 AW (n=6), B3K506β SS (n=6), Vβ8.2 EG (n=5), Vβ8.2 EQ (n=3) mice. (g, mean ± s.e.m.).
To further validate the hypothesis that CDR3β P6–7 doublets affect the maturation of CD4+ T cell populations, we reconstitute irradiate TCRB−/− mice with YAe62β-FW, B3K506β-SS, Vβ8.2-SW, Vβ8.2-EQ, Vβ8.2-AW or Vβ8.2-EG retrogenic bone marrow mixed 50/50 with T cell depleted bone marrow from C57BL/6 mice. Splenic CD4+ T cells expressing a YAe62-FW, Vβ8.2-SW and Vβ8.2-AW chain expressed higher levels of CD5, as compared to similar CD4 T cells expressing a B3K506-SS, Vβ8.2-EQ or Vβ8.2-EG chain (Supplementary Fig. 5b). In addition, 15–25% of the peripheral CD4+ T cells that express a YAe62-FW, Vβ8.2-SW or Vβ8.2-AW chain, but only 3–5% of CD4 T cells expressing a B3K506-SS, Vβ8.2-EQ or Vβ8.2-EG chain had a Treg cell phenotype (Fig. 8e–g). Thus, the identity of the CDR3β P6–7 doublet affects thymocytes maturation and differentiation into conventional CD4+ T cell versus Treg cell repertoires.
NOD CD4+ T cells are enriched in hydrophobic CDR3β P6–7 doublets
To investigate if the self-reactivity index could reveal autoimmune-prone T cell repertoire in mice, splenic naïve CD4+ and CD8+ T cells were isolated from non-obese diabetes (NOD) mice and C57BL/6 mice, and Vβ2+, Vβ6+ and Vβ8.2+ TCRs were sequenced. Compared to C57BL/6 CD4+ T cells, splenic NOD CD4+ T cells were enriched in CDR3β P6–7 doublets that promote self-reactivity (P < 10−19) and depleted in P6–7 doublets that limit self-reactivity (P < 10−11) (Fig. 8j). In contrast, NOD CD8+ T cell repertoires did not show and increased usage of self-reactivity promoting CDR3β P6–7 doublets in comparison to C57BL/6 CD8 T cells (Fig 8k). Because a general defect in thymic deletion in NOD mice would be predicted to affect both CD4+ and CD8+ T cell repertoires, the specific effect on NOD CD4+ T cells suggested that the phenotype is mediated by the autoimmunity-promoting, I-Ag7, MHC molecule.
To address the role of the NOD MHC, we compared CDR3β P6–7 doublet usage by splenic CD4 T cells isolated from the reciprocal MHC congenic B6.NOD-(D17Mit21-D17Mit10)/LtJ (B6.H-2g7), NOD.B10Sn-H2b/J (NOD.H-2b), NOD and C57BL/6 mice. Vβ2+, Vβ6+ and Vβ8.2+ CD4+ T cells that develop in B6.H-2g7 mice were enriched in CDR3β P6–7 doublets that promote self-reactivity, relative to similar CD4+ T cells that develop in C57BL/6 mice (P < 10−16, Fig. 8l). In contrast, NOD CD4 T cells were not enriched in CDR3β P6–7 doublets that promote self-reactivity, relative to CD4 T cells that develop in B6.H-2g7 mice (Fig. 8m). These data, combined with only modest differences in CDR3β P6–7 doublets that promote (P < 10−4) or limit self-reactivity (P < 10−8) between NOD and NOD.H-2b CD4+ T cells (Supplementary Fig. 6), argue that T cell development on the NOD MHC enriches the CD4+ T cell repertoire in hydrophobic CDR3β P6–7 doublets that promote self-reactivity.
Discussion
Despite the enormous diversity of self-peptides and MHC alleles12, 10–20% of pre-selection DP thymocytes express TCRs that recognize host self-pMHC complexs27, 28, 29. These findings imply that self-pMHC recognition is not a random happenstance of TCR rearrangement30. Here we elucidate part of the mechanism that endows TCRs with different affinities for self-pMHC ligands. For most TCRβ chains, V(D)J recombination inserts Dβ and N-region additional amino acids within the middle of the CDR3β, including at P6 and P7. A conserved β strand within the TCR Vβ Ig domain localizes the CDR3β P6–7 doublet at a surface exposed, central location within the TCR’s ligand binding site, ideally positioned to engage peptide and MHC residues. This placement allows the intrinsic biochemical properties of these residues to influence the binding properties of TCRs, with the ultimate specificity being derived from the complete TCRα and TCRβ sequences.
We observed that the frequency at which self-reactive TCRs are created directly correlates with the extent of interfacial hydrophobicity of CDR3β P6–7 doublets. Hydrophobic residues are often found within the center of protein-protein interfaces, forming high affinity focused hotspots of binding that can result from the hydrophobic effect25, 31, 32,33. These findings are consistent with our previous computational prediction that cross-reactive and self-reactive TCRs should be enriched in ‘strongly interacting’ amino acids in the CDR3 region21, 22.
Consistent with differential affinity and avidity models of thymic selection4, 5, we observed that TCRs expressed on CD4+ and CD8+ T cells in C57BL/6 mice carry reduced frequencies of the least hydrophobic CDR3β P6–7 doublets. As these types of CDR3β P6–7 doublets limit self-reactivity, many DP thymocytes expressing these TCRs likely fail positive selection. Concurrently, peripheral CD4+ and CD8+ T cells in C57BL/6 mice are also reduced in the most hydrophobic CDR3β P6–7 doublets in C57BL/6 mice. Several findings argue that that this occurs due to negative selection or diversion into the Treg cell lineage; hydrophobic CDR3β P6–7 doublets increase the frequency and strength at which randomly assembled TCRs engage self-pMHC and are enriched in the both the Treg cell repertoire and the CD4+ and CD8+ T cell repertoires in Bim−/− mice. Enriched usage of an aliphatic residue versus acidic residue at position 5 of the CDR3β has been noted in Vβ8.2+ Treg cells versus CD4+ T in a TCRα chain transgenic system34. However, a re-analysis of a set of MOG-specific CD4+ T cells and Treg cells that expand following immunization34 does not reveal biased usage of CDR3β P6–7 doublets, suggesting that the antigen-specificity of a T cell response may dominate over repertoire-wide selection biases.
Structural analyses focused on understanding why TCRs are biased to recognize pMHC ligands have proposed that specific CDR1 and CDR2 residues have been evolutionarily selected for MHC binding14, 15, and that there exists, albeit weak, shape complementarity between the TCR binding site and pMHC35, 36. Our current findings are consistent with observations that specific amino acids, such as tyrosines often present at the tips of CDR1 and CDR2 loops, can promote TCR recognition of pMHC ligands19, 37, 38. As CDR3β P6 and P7 residues are highly variable and can engage the peptide or the MHC, the continuum of self-reactivity that is generated by pairing TCR germline and hyper-variable residues allows thymic selection to create T cell repertoires with the requisite peptide plus host-MHC recognition properties2, 3, 4, 5, 39.
Studies suggest that NOD mice carry increased frequencies of auto-reactive T cells as compared to C57BL/6 mice40, 41. Whether this arises from a loss in tolerance to particular auto-antigens, or reflects repertoire-wide defects in thymic selection is less clear42, 43, 44. Observing that CD4+ T cells in H-2g7 expressing mice are enriched in hydrophobic CDR3β P6–7 doublets, relative to H-2b expressing mice, supports the hypothesis that the unique peptide binding properties of I-Ag7 MHC molecule affects the overall NOD CD4+ T cell repertoire45. Whether CD4+ T cells carrying hydrophobic CDR3β P6–7 doublets are directly linked to type-1 diabetes onset remains unresolved. The prototypical diabetogenic T cell, BDC 2.5, carries the CDR3β P6–7 doublet, GG46. Analysis of a study of twelve NOD β-islet-infiltrating CD4 T cells47, however, suggests that T cells carrying hydrophobic CDR3β P6–7 doublets are more efficient at inducing insulitis and type-1 diabetes, as compared to T cells carrying only small and charged CDR3β P6–7 doublets. Thus, altered T cell repertoire formation as well as auto-antigen display may explain why certain MHC class II alleles provide the most significant genetic risk for developing T1D and several other autoimmune diseases48, 49.
In summary, the interfacial hydrophobicity of CDR3β P6–7 doublets influences the frequency and strength TCR self-reactivity, irrespective of the Vβ family or CDR3 length. Furthermore, indexing T cell repertoires based on the identity of the CDR3β P6–7 doublets reveals thymic selection biases in normal and type-1 diabetes-prone mouse T cell repertoires.
Supplementary Material
Acknowledgments
This work was supported by funds from the NIH to E.S.H. (RO1-DK095077, U19 AI109858) and B.D.S. (T32 AI 007349). E.S.H. is a member of the UMass DERC (grant DK32520). I.G.T. is a Marie Curie Research Fellow and has received support from Fundacion Barrie. M.P. receives support from the National Institute for Health Research (NIHR) Biomedical Research Centre based at Guy's and St Thomas' NHS Foundation Trust and King's College London. A.K.C. is funded by the Ragon Institute of Massachusetts General Hospital, Massachusetts Institute of Technology, and Harvard.
Footnotes
TCR sequence data is deposited in the NCBI Sequence Read Archive (SRA) SUB-XXXXXXX
Author Contributions
B.D.S., K.S., A.K.S., M.P., A.K.C and E.S.H. conceived various aspects of the project, designed, and interpreted experiments. TCR sequencing experiments were performed by B.D.S. and statistical analyses were performed by B.D.S. and K.S. Experiments were performed by B.D.S., K.S., I.G-T., J.J., K.S., and E.S.H. The manuscript was written by B.D.S., K.S., A.K.C and E.S.H.
The authors have no competing financial interests.
References
- 1.Davis MM, Bjorkman PJ. T-cell antigen receptor genes and T-cell recognition. Nature. 1988;334(6181):395–402. doi: 10.1038/334395a0. [DOI] [PubMed] [Google Scholar]
- 2.Sakaguchi S, Yamaguchi T, Nomura T, Ono M. Regulatory T cells and immune tolerance. Cell. 2008;133(5):775–787. doi: 10.1016/j.cell.2008.05.009. [DOI] [PubMed] [Google Scholar]
- 3.Josefowicz SZ, Lu LF, Rudensky AY. Regulatory T cells: mechanisms of differentiation and function. Annu Rev Immunol. 2012;30:531–564. doi: 10.1146/annurev.immunol.25.022106.141623. [DOI] [PMC free article] [PubMed] [Google Scholar]
- 4.Hogquist KA, Jameson SC. The self-obsession of T cells: how TCR signaling thresholds affect fate 'decisions' and effector function. Nat Immunol. 2014;15(9):815–823. doi: 10.1038/ni.2938. [DOI] [PMC free article] [PubMed] [Google Scholar]
- 5.Vrisekoop N, Monteiro JP, Mandl JN, Germain RN. Revisiting thymic positive selection and the mature T cell repertoire for antigen. Immunity. 2014;41(2):181–190. doi: 10.1016/j.immuni.2014.07.007. [DOI] [PMC free article] [PubMed] [Google Scholar]
- 6.Van Laethem F, Tikhonova AN, Pobezinsky LA, Tai X, Kimura MY, Le Saout C, et al. Lck availability during thymic selection determines the recognition specificity of the T cell repertoire. Cell. 2013;154(6):1326–1341. doi: 10.1016/j.cell.2013.08.009. [DOI] [PMC free article] [PubMed] [Google Scholar]
- 7.Mandl JN, Monteiro JP, Vrisekoop N, Germain RN. T cell-positive selection uses self-ligand binding strength to optimize repertoire recognition of foreign antigens. Immunity. 2013;38(2):263–274. doi: 10.1016/j.immuni.2012.09.011. [DOI] [PMC free article] [PubMed] [Google Scholar]
- 8.Persaud SP, Parker CR, Lo WL, Weber KS, Allen PM. Intrinsic CD4+ T cell sensitivity and response to a pathogen are set and sustained by avidity for thymic and peripheral complexes of self peptide and MHC. Nat Immunol. 2014;15(3):266–274. doi: 10.1038/ni.2822. [DOI] [PMC free article] [PubMed] [Google Scholar]
- 9.Fulton RB, Hamilton SE, Xing Y, Best JA, Goldrath AW, Hogquist KA, et al. The TCR's sensitivity to self peptide-MHC dictates the ability of naive CD8(+) T cells to respond to foreign antigens. Nat Immunol. 2015;16(1):107–117. doi: 10.1038/ni.3043. [DOI] [PMC free article] [PubMed] [Google Scholar]
- 10.Levine AG, Arvey A, Jin W, Rudensky AY. Continuous requirement for the TCR in regulatory T cell function. Nat Immunol. 2014;15(11):1070–1078. doi: 10.1038/ni.3004. [DOI] [PMC free article] [PubMed] [Google Scholar]
- 11.Vahl JC, Drees C, Heger K, Heink S, Fischer JC, Nedjic J, et al. Continuous T cell receptor signals maintain a functional regulatory T cell pool. Immunity. 2014;41(5):722–736. doi: 10.1016/j.immuni.2014.10.012. [DOI] [PubMed] [Google Scholar]
- 12.Trowsdale J, Knight JC. Major histocompatibility complex genomics and human disease. Annual review of genomics and human genetics. 2013;14:301–323. doi: 10.1146/annurev-genom-091212-153455. [DOI] [PMC free article] [PubMed] [Google Scholar]
- 13.Beringer DX, Kleijwegt FS, Wiede F, van der Slik AR, Loh KL, Petersen J, et al. T cell receptor reversed polarity recognition of a self-antigen major histocompatibility complex. Nat Immunol. 2015 doi: 10.1038/ni.3271. [DOI] [PubMed] [Google Scholar]
- 14.Yin L, Scott-Browne J, Kappler JW, Gapin L, Marrack P. T cells and their eons-old obsession with MHC. Immunol Rev. 2012;250(1):49–60. doi: 10.1111/imr.12004. [DOI] [PMC free article] [PubMed] [Google Scholar]
- 15.Garcia KC. Reconciling views on T cell receptor germline bias for MHC. Trends Immunol. 2012;33(9):429–436. doi: 10.1016/j.it.2012.05.005. [DOI] [PMC free article] [PubMed] [Google Scholar]
- 16.Wucherpfennig KW, Call MJ, Deng L, Mariuzza R. Structural alterations in peptide-MHC recognition by self-reactive T cell receptors. Curr Opin Immunol. 2009;21(6):590–595. doi: 10.1016/j.coi.2009.07.008. [DOI] [PMC free article] [PubMed] [Google Scholar]
- 17.Rossjohn J, Gras S, Miles JJ, Turner SJ, Godfrey DI, McCluskey J. T cell antigen receptor recognition of antigen-presenting molecules. Annu Rev Immunol. 2015;33:169–200. doi: 10.1146/annurev-immunol-032414-112334. [DOI] [PubMed] [Google Scholar]
- 18.Huseby ES, White J, Crawford F, Vass T, Becker D, Pinilla C, et al. How the T cell repertoire becomes peptide and MHC specific. Cell. 2005;122(2):247–260. doi: 10.1016/j.cell.2005.05.013. [DOI] [PubMed] [Google Scholar]
- 19.Dai S, Huseby ES, Rubtsova K, Scott-Browne J, Crawford F, Macdonald WA, et al. Crossreactive T Cells spotlight the germline rules for alphabeta T cell-receptor interactions with MHC molecules. Immunity. 2008;28(3):324–334. doi: 10.1016/j.immuni.2008.01.008. [DOI] [PMC free article] [PubMed] [Google Scholar]
- 20.Huseby ES, Crawford F, White J, Marrack P, Kappler JW. Interface-disrupting amino acids establish specificity between T cell receptors and complexes of major histocompatibility complex and peptide. Nat Immunol. 2006;7(11):1191–1199. doi: 10.1038/ni1401. [DOI] [PubMed] [Google Scholar]
- 21.Kosmrlj A, Jha AK, Huseby ES, Kardar M, Chakraborty AK. How the thymus designs antigen-specific and self-tolerant T cell receptor sequences. Proc Natl Acad Sci U S A. 2008;105(43):16671–16676. doi: 10.1073/pnas.0808081105. [DOI] [PMC free article] [PubMed] [Google Scholar]
- 22.Kosmrlj A, Read EL, Qi Y, Allen TM, Altfeld M, Deeks SG, et al. Effects of thymic selection of the T-cell repertoire on HLA class I-associated control of HIV infection. Nature. 2010;465(7296):350–354. doi: 10.1038/nature08997. [DOI] [PMC free article] [PubMed] [Google Scholar]
- 23.Moran AE, Holzapfel KL, Xing Y, Cunningham NR, Maltzman JS, Punt J, et al. T cell receptor signal strength in Treg and iNKT cell development demonstrated by a novel fluorescent reporter mouse. J Exp Med. 2011;208(6):1279–1289. doi: 10.1084/jem.20110308. [DOI] [PMC free article] [PubMed] [Google Scholar]
- 24.Garcia KC, Degano M, Stanfield RL, Brunmark A, Jackson MR, Peterson PA, et al. An alphabeta T cell receptor structure at 2.5 A and its orientation in the TCR-MHC complex. Science. 1996;274(5285):209–219. doi: 10.1126/science.274.5285.209. [DOI] [PubMed] [Google Scholar]
- 25.White SH, Wimley WC. Membrane protein folding and stability: physical principles. Annual review of biophysics and biomolecular structure. 1999;28:319–365. doi: 10.1146/annurev.biophys.28.1.319. [DOI] [PubMed] [Google Scholar]
- 26.Bouillet P, Purton JF, Godfrey DI, Zhang LC, Coultas L, Puthalakath H, et al. BH3-only Bcl-2 family member Bim is required for apoptosis of autoreactive thymocytes. Nature. 2002;415(6874):922–926. doi: 10.1038/415922a. [DOI] [PubMed] [Google Scholar]
- 27.Zerrahn J, Held W, Raulet DH. The MHC reactivity of the T cell repertoire prior to positive and negative selection. Cell. 1997;88(5):627–636. doi: 10.1016/s0092-8674(00)81905-4. [DOI] [PubMed] [Google Scholar]
- 28.Merkenschlager M, Graf D, Lovatt M, Bommhardt U, Zamoyska R, Fisher AG. How many thymocytes audition for selection? J Exp Med. 1997;186(7):1149–1158. doi: 10.1084/jem.186.7.1149. [DOI] [PMC free article] [PubMed] [Google Scholar]
- 29.van Meerwijk JP, Marguerat S, Lees RK, Germain RN, Fowlkes BJ, MacDonald HR. Quantitative impact of thymic clonal deletion on the T cell repertoire. J Exp Med. 1997;185(3):377–383. doi: 10.1084/jem.185.3.377. [DOI] [PMC free article] [PubMed] [Google Scholar]
- 30.Jerne NK. The somatic generation of immune recognition. Eur J Immunol. 1971;1(1):1–9. doi: 10.1002/eji.1830010102. [DOI] [PubMed] [Google Scholar]
- 31.Baker BM, Gagnon SJ, Biddison WE, Wiley DC. Conversion of a T cell antagonist into an agonist by repairing a defect in the TCR/peptide/MHC interface: implications for TCR signaling. Immunity. 2000;13(4):475–484. doi: 10.1016/s1074-7613(00)00047-9. [DOI] [PubMed] [Google Scholar]
- 32.Chandler D. Interfaces and the driving force of hydrophobic assembly. Nature. 2005;437(7059):640–647. doi: 10.1038/nature04162. [DOI] [PubMed] [Google Scholar]
- 33.Bogan AA, Thorn KS. Anatomy of hot spots in protein interfaces. J Mol Biol. 1998;280(1):1–9. doi: 10.1006/jmbi.1998.1843. [DOI] [PubMed] [Google Scholar]
- 34.Liu X, Nguyen P, Liu W, Cheng C, Steeves M, Obenauer JC, et al. T cell receptor CDR3 sequence but not recognition characteristics distinguish autoreactive effector and Foxp3(+) regulatory T cells. Immunity. 2009;31(6):909–920. doi: 10.1016/j.immuni.2009.09.023. [DOI] [PMC free article] [PubMed] [Google Scholar]
- 35.Ysern X, Li H, Mariuzza RA. Imperfect interfaces. Nature structural biology. 1998;5(6):412–414. doi: 10.1038/nsb0698-412. [DOI] [PubMed] [Google Scholar]
- 36.Housset D, Malissen B. What do TCR-pMHC crystal structures teach us about MHC restriction and alloreactivity? Trends Immunol. 2003;24(8):429–437. doi: 10.1016/s1471-4906(03)00180-7. [DOI] [PubMed] [Google Scholar]
- 37.Feng D, Bond CJ, Ely LK, Maynard J, Garcia KC. Structural evidence for a germline-encoded T cell receptor-major histocompatibility complex interaction 'codon'. Nat Immunol. 2007;8(9):975–983. doi: 10.1038/ni1502. [DOI] [PubMed] [Google Scholar]
- 38.Scott-Browne JP, White J, Kappler JW, Gapin L, Marrack P. Germline-encoded amino acids in the alphabeta T-cell receptor control thymic selection. Nature. 2009;458(7241):1043–1046. doi: 10.1038/nature07812. [DOI] [PMC free article] [PubMed] [Google Scholar]
- 39.Stadinski BD, Trenh P, Smith RL, Bautista B, Huseby PG, Li G, et al. A role for differential variable gene pairing in creating T cell receptors specific for unique major histocompatibility ligands. Immunity. 2011;35(5):694–704. doi: 10.1016/j.immuni.2011.10.012. [DOI] [PMC free article] [PubMed] [Google Scholar]
- 40.Kanagawa O, Martin SM, Vaupel BA, Carrasco-Marin E, Unanue ER. Autoreactivity of T cells from nonobese diabetic mice: an I-Ag7-dependent reaction. Proc Natl Acad Sci U S A. 1998;95(4):1721–1724. doi: 10.1073/pnas.95.4.1721. [DOI] [PMC free article] [PubMed] [Google Scholar]
- 41.Ridgway WM, Ito H, Fasso M, Yu C, Fathman CG. Analysis of the role of variation of major histocompatibility complex class II expression on nonobese diabetic (NOD) peripheral T cell response. J Exp Med. 1998;188(12):2267–2275. doi: 10.1084/jem.188.12.2267. [DOI] [PMC free article] [PubMed] [Google Scholar]
- 42.Kishimoto H, Sprent J. A defect in central tolerance in NOD mice. Nat Immunol. 2001;2(11):1025–1031. doi: 10.1038/ni726. [DOI] [PubMed] [Google Scholar]
- 43.Liston A, Lesage S, Gray DH, O'Reilly LA, Strasser A, Fahrer AM, et al. Generalized resistance to thymic deletion in the NOD mouse; a polygenic trait characterized by defective induction of Bim. Immunity. 2004;21(6):817–830. doi: 10.1016/j.immuni.2004.10.014. [DOI] [PubMed] [Google Scholar]
- 44.Mingueneau M, Jiang W, Feuerer M, Mathis D, Benoist C. Thymic negative selection is functional in NOD mice. J Exp Med. 2012;209(3):623–637. doi: 10.1084/jem.20112593. [DOI] [PMC free article] [PubMed] [Google Scholar]
- 45.Suri A, Levisetti MG, Unanue ER. Do the peptide-binding properties of diabetogenic class II molecules explain autoreactivity? Curr Opin Immunol. 2008;20(1):105–110. doi: 10.1016/j.coi.2007.10.007. [DOI] [PMC free article] [PubMed] [Google Scholar]
- 46.Candeias S, Katz J, Benoist C, Mathis D, Haskins K. Islet-specific T-cell clones from nonobese diabetic mice express heterogeneous T-cell receptors. Proc Natl Acad Sci U S A. 1991;88(14):6167–6170. doi: 10.1073/pnas.88.14.6167. [DOI] [PMC free article] [PubMed] [Google Scholar]
- 47.Lennon GP, Bettini M, Burton AR, Vincent E, Arnold PY, Santamaria P, et al. T cell islet accumulation in type 1 diabetes is a tightly regulated, cell-autonomous event. Immunity. 2009;31(4):643–653. doi: 10.1016/j.immuni.2009.07.008. [DOI] [PMC free article] [PubMed] [Google Scholar]
- 48.Todd JA. Etiology of type 1 diabetes. Immunity. 2010;32(4):457–467. doi: 10.1016/j.immuni.2010.04.001. [DOI] [PubMed] [Google Scholar]
- 49.Marson A, Housley WJ, Hafler DA. Genetic basis of autoimmunity. J Clin Invest. 2015;125(6):2234–2241. doi: 10.1172/JCI78086. [DOI] [PMC free article] [PubMed] [Google Scholar]
- 50.Day EB, Guillonneau C, Gras S, La Gruta NL, Vignali DA, Doherty PC, et al. Structural basis for enabling T-cell receptor diversity within biased virus-specific CD8+ T-cell responses. Proc Natl Acad Sci U S A. 2011;108(23):9536–9541. doi: 10.1073/pnas.1106851108. [DOI] [PMC free article] [PubMed] [Google Scholar]
Associated Data
This section collects any data citations, data availability statements, or supplementary materials included in this article.


