Abstract
Dried blood spot (DBS) antibiotic assays can facilitate pharmacokinetic (PK)/pharmacodynamic (PD) studies in situations where venous blood sampling is logistically difficult. We sought to develop, validate, and apply a DBS assay for rifampin (RIF), fusidic acid (FUS), and ciprofloxacin (CIP). These antibiotics are considered active against organisms in biofilms and are therefore commonly used for the treatment of infections associated with prosthetic implants. A liquid chromatography-mass spectroscopy DBS assay was developed and validated, including red cell partitioning and thermal stability for each drug and the rifampin metabolite desacetyl rifampin (Des-RIF). Plasma and DBS concentrations in 10 healthy adults were compared, and the concentration-time profiles were incorporated into population PK models. The limits of quantification for RIF, Des-RIF, CIP, and FUS in DBS were 15 μg/liter, 14 μg/liter, 25 μg/liter, and 153 μg/liter, respectively. Adjusting for hematocrit, red cell partitioning, and relative recovery, DBS-predicted plasma concentrations were comparable to measured plasma concentrations for each antibiotic (r > 0.95; P < 0.0001), and Bland-Altman plots showed no significant bias. The final population PK estimates of clearance, volume of distribution, and time above threshold MICs for measured and DBS-predicted plasma concentrations were comparable. These drugs were stable in DBSs for at least 10 days at room temperature and 1 month at 4°C. The present DBS antibiotic assays are robust and can be used as surrogates for plasma concentrations to provide valid PK and PK/PD data in a variety of clinical situations, including therapeutic drug monitoring or studies of implant infections.
INTRODUCTION
Pharmacokinetic (PK)/pharmacodynamic (PD) studies of infectious diseases explore the triangular relationship between antibiotic exposure, the antibiotic susceptibility of the infecting organism (taken as the MIC), and predefined clinical outcomes (1). This allows estimation of microbiological susceptibility “breakpoints,” facilitates the design of optimal dosing regimens (2), and provides data relating to the emergence of drug-resistant organisms (3, 4). Most PK/PD studies are performed in animal models or in highly selected samples of adults, such as patients in intensive care units, for whom sequential sampling of sufficient volumes of venous blood is both feasible and ethical. In contrast, PK/PD studies are rarely performed on other hospitalized or ambulatory patient populations due to difficulties associated with blood sampling. Relevant examples include patients receiving treatment for implant infections, young children, and patients treated in nonurban or resource-poor settings.
Measurement of drug concentrations in dried blood spots (DBSs) represents a new approach to overcome the limitations of traditional therapeutic drug monitoring and PK/PD studies. DBSs are a convenient and inexpensive means of sampling and storage of whole blood for subsequent assays. Low-volume finger prick samples (10 to 20 μl) are taken on filter paper, a method which could enable patients to collect their own samples in a domiciliary setting. Recent studies demonstrated that accurate measurement of drug concentrations in DBSs is feasible in animal models and human studies of antibiotics (5–7) and other drugs (8–10). Finger or heel prick samples can be taken serially and stored with a desiccant, without the need for processing and freezing of plasma. A small-diameter disc, or chad, can be subsequently punched out from the filter paper, and the drug can be eluted into a liquid matrix prior to a liquid chromatography-mass spectrometry (LC-MS) assay (6, 8, 10). However, there are few studies that have demonstrated that DBS drug concentrations can be applied in PK/PD studies as reliable surrogates for plasma concentrations.
In the setting of implant infections, different combinations of rifampin (RIF), ciprofloxacin (CIP), and fusidic acid (FUS) are commonly used for infections of joint arthroplasty and other orthopedic, cochlear, intracardiac, and vascular implants. The excellent penetration of these drugs into biofilms surrounding infected implants is seen as a major advantage over conventional antibiotics such as beta-lactams or glycopeptides, which have relatively poor penetration that can contribute to clinical failure (11). Nevertheless, there are limited data related to the optimal PK/PD parameters associated with successful treatment in this situation. Available PK/PD data for these antibiotics in other clinical settings suggest that variability in antibiotic exposure, with high and/or low plasma concentrations in relation to the MIC of the infecting organism, might contribute to low cure rates and/or toxicity when implant infections are treated (12).
A relevant example is rifampin, which has substantial interindividual variability in clearance and volume of distribution (13) and delayed absorption in some individuals (14) and induces its own metabolism (15). A high rifampin area under the concentration-time curve from 0 to 24 h (AUC0–24) has been associated with cure of pulmonary tuberculosis, while a low AUC0–24 is associated with the development of de novo resistance (16). Indeed, PK variability of antitubercular medications is thought to contribute more than poor medication adherence to clinical failure (17). Where tuberculosis is uncommon, such as in resource-rich environments like Australia, rifampin is used to treat implant infections, but comorbidities such as diabetes (18) and obesity (14) may have a clinically important impact on its disposition.
In the light of this paucity of data, we have developed DBS assays for RIF, desacetyl rifampin (Des-RIF), CIP, and FUS and conducted a PK study in healthy adult volunteers. The drug concentrations generated by these assays have been comprehensively validated against equivalent plasma concentrations by using population PK modeling to ensure broad application of this approach in different clinical settings.
MATERIALS AND METHODS
Approvals, patients, and sample collection.
The present study was approved by the Fremantle Hospital Human Research Ethics Committee (14/44). Ten healthy adult employees at Fremantle Hospital (Western Australia) were recruited. All subjects had no history of allergy (including anaphylaxis) or other adverse reactions to RIF, FUS, and CIP; had no history of diabetes or psychiatric, cardiac, renal, or hepatic disease; and were not pregnant, breastfeeding, or taking hormonal contraceptives. All subjects gave witnessed informed consent to study procedures. Each subject was examined, and height and weight were measured. An intravenous (i.v.) cannula was inserted, and a baseline heparinized blood sample was taken for drug assays as well as routine biochemical and hematological tests, including venous hematocrit. Each participant was then given supervised single oral doses of 300 mg RIF (Rifadin; Sanofi-Aventis, Bridgewater, NJ, USA), 500 mg FUS (Fusidin; Leo Pharma, Ballerup, Denmark), and 500 mg CIP (Sandoz, Holzkirchen, Germany) taken on an empty stomach. Further 5-ml heparinized venous blood samples were drawn at 0.5, 1, 2, 4, and 8 h. The cannula was removed, and the final 24-h venous blood sample was collected by venipuncture.
Blood samples were centrifuged promptly. Plasma was separated and placed on dry ice before storage at −80°C. At each sampling time point, duplicate DBSs were collected onto filter paper cards (Whatman 903 Protein Saver cards; GE Healthcare Australia Pty. Ltd., Parramatta, NSW, Australia) from the venous blood sample. In addition, mixed capillary blood from a finger prick was taken at the same time as the venous blood was drawn. Each finger prick sample was both collected into a heparinized capillary tube and spotted onto filter paper directly from the finger. In both these situations, blood was drawn by capillary action into the tube and for distribution evenly over the filter paper. The DBS cards were air dried at room temperature for 1 to 2 h, placed into an airtight foil envelope with a single desiccant sachet, and transported on dry ice before storage at −80°C.
Analytical materials and reagents.
RIF (molecular weight [MW] = 822.9), FUS (MW = 516.7), and CIP (MW = 331.35) were purchased from Sigma-Aldrich Chemicals (St. Louis, MO, USA). The metabolite Des-RIF (MW = 780.9) and deuterated internal standards (RIF-d4, Des-RIF-d4, and CIP-d8) were purchased from TLC Pharmaceutical Standards Ltd. (Voughan, Ontario, Canada). FUS-d6 was purchased from Toronto Research Chemicals (Toronto, Ontario, Canada). LC-MS-grade formic acid was purchased from Fisher Scientific (Fair Lawn, NJ, USA). EDTA and deferoxamine mesylate (DFX) were purchased from Sigma-Aldrich Ltd. (Gillingham, Dorset, United Kingdom). LC-MS-grade acetonitrile, methanol, and water were purchased from Fisher Scientific (Fair Lawn, NJ, USA). All other chemicals were of analytical grade.
Instrumentation and chromatographic conditions.
A triple-quadrupole mass spectrometer (LCMS-8030; Shimadzu, Kyoto, Japan) was used for all assays. The instrument comprised a Nexera ultrahigh-performance liquid chromatography (UHPLC) pump (LC-30A), a degasser (model DGU-20A5), an autosampler (SIL-30A), and a column oven (CTO-30A). Interface sources, electrospray ionization (ESI), and atmospheric pressure chemical ionization (APCI) were included in the system. All authentic standards (RIF, Des-RIF, FUS, and CIP) and internal standards (RIF-d4, Des-RIF-d4, CIP-d8, and FUS-d6) were scanned for parent and product ions. The identified precursor and product ions of all drugs were further allowed to auto-optimize in the instrument. This gave a more specific precursor-product ion pair and collision energy for each compound of interest (Table 1). Quantitation was performed by multiple-reaction monitoring (MRM) in the ESI-positive (ESI+) mode for RIF, Des-RIF, and CIP, while FUS was quantified by using MRM in the ESI-negative mode. The optimized mass spectra were acquired with an interface voltage of 4.5 kV, a detector voltage of 1.0 kV, a heat block temperature of 400°C, and a desolvation temperature of 250°C. Nitrogen was used as the nebulizer gas at a flow rate of 2 liters/min and as the drying gas at a flow rate of 15 liters/min. Argon was used as the collision gas at 230 kPa.
TABLE 1.
LC-tandem MS parameters for ciprofloxacin, fusidic acid, rifampin and desacetyl rifampin and their deuterated internal standards
| Compound | Mode | Precursor-product ion pair m/z | Collision energy (V) |
|---|---|---|---|
| Ciprofloxacin | ESI positive | 332.2 > 314.2 | −20.1 |
| Ciprofloxacin-d8 | ESI positive | 340.2 > 322.2 | −21.4 |
| Desacetyl rifampin | ESI positive | 781.5 > 749.35 | −13 |
| Desacetyl rifampin-d4 | ESI positive | 785.5 > 753.4 | −11.6 |
| Rifampin | ESI positive | 823.3 > 791.55 | −19 |
| Rifampin-d4 | ESI positive | 827.30 > 795.45 | −20.2 |
| Fusidic acid | ESI negative | 515.3 > 455.30 | 19.1 |
| Fusidic acid-d6 | ESI negative | 521.47 > 461.40 | 19.7 |
Chromatographic separation was performed simultaneously for all drugs on a Waters Aquity T3 ultraperformance liquid chromatography (UPLC) C18 column (2.1 by 50 mm, 1.7 μm) connected to a Vanguard Aquity UPLC C18 precolumn (2.1 by 5 mm, 1.7 μm) (Waters Corp., Wexford, Ireland) at a column oven temperature of 40°C. The mobile phase comprised solvent A (water plus 0.1% [wt/vol] formic acid) and solvent B (methanol plus 0.1% [wt/vol] formic acid). The flow rate was 0.4 ml/min, and the mobile phase was run in gradient modes of 0.5 to 3.5 min (solvent B, 10 to 95%) and 3.6 to 5 min (solvent B, 10%), for a total run time of 5 min. The sample injection volume was 10 μl. Retention times were 2.19, 2.17, 2.45, and 1.9 min for RIF, Des-RIF, FUS, and CIP, respectively.
Sample preparation.
RIF and Des-RIF stock solutions were prepared separately at 5 mg/ml in methanol. The matching deuterated internal standards were prepared at 1 mg/ml in methanol. A stock solution of CIP was prepared at 5 mg/ml in 1% (wt/vol) formic acid, and CIP-d8 was prepared at 1 mg/ml in 1% (wt/vol) formic acid. A FUS stock solution was prepared at 10 mg/ml in methanol, and its deuterated internal standard (FUS-d6) was prepared at 1 mg/ml in methanol. All the stock solutions were stored at −80°C. The working standards were prepared by serial dilution from the primary stock.
Standard curves and quality control samples (QCSs) for the blood and plasma were prepared by using 10 μl of relevant working standards, spiked into 1 ml of each matrix, in order to maintain consistency of added volumes. QCSs were prepared in blank plasma or DBSs at concentrations of 0.1, 1, 5, and 10 mg/liter for RIF; 0.05, 0.1, 0.5, and 5 mg/liter for Des-RIF; 0.1, 1, 5, and 10 mg/liter for CIP; and 1, 10, 30, and 50 mg/liter for FUS. All the QCSs were stored at −80°C prior to use. Standard curve ranges were 0.01 to 20 mg/liter for RIF, 0.01 to 5 mg/liter for Des-RIF, 0.03 to 20 mg/liter for CIP, and 0.2 to 100 mg/liter for FUS.
DBSs for standard curves and QCSs were prepared by spotting 50 μl of spiked venous blood onto a Whatman 903 Protein Saver card (GE Healthcare BioScience Corp.) and air drying for 2 to 3 h at room temperature (∼20°C). The dried samples were then sealed within a Whatman foil bag with silica gel desiccants and stored at −80°C until analysis.
Extraction.
The extraction method for plasma and DBSs was adapted from a previously reported method (19), in which chelation agents were added to prevent RIF binding to ferrous and ferric ions. Plasma was extracted by using a protein precipitation method. Plasma (20 μl) was added to 50 μl of EDTA and DFX solutions (stock, 2 g/liter) and precipitated by the addition of 300 μl acetonitrile and methanol (50:50) containing the internal standards RIF-d4, Des-RIF-d4, FUS-d6, and CIP-d8. Samples were vortexed for 1 min and centrifuged at 1,500 × g for 10 min. The supernatant (200 μl) was separated for LC-MS assays. Subsequent sample preparations were adapted to a deep-well-plate method using 20 μl plasma and the above-described steps (same volumes). The plate was shaken on a Thermomixer C instrument (catalog number AG-22331; Eppendorf, Hamburg, Germany) at 1,000 rpm for 30 min. The plate was centrifuged in a Heraeus Megafuge 16R centrifuge using a plate bucket (model M-20; Thermo Fisher Scientific Inc., Waltham, MA, USA) at 2,000 × g for 10 min and then processed in the same manner as the method described above.
DBS extraction was performed by using a single 6-mm disc (chad) punched from the middle of the spot using a manual punching device. The chad was placed into a glass tube, followed by the addition of 50 μl of EDTA and DFX solutions (stock, 2 g/liter) and 300 μl of acetonitrile and methanol (50:50) containing the deuterated internal standards. The sample was sonicated for 30 min and centrifuged at 1,500 × g for 10 min before the supernatant (200 μl) was separated for LC-MS assays. This method was also adapted to a deep-well plate by extracting analytes from the 6-mm chads as described above. The plate was then shaken at 1,000 rpm on a Thermomixer C instrument for 1 h and centrifuged at 2,000 × g for 10 min, and 200 μl of the supernatant was separated for LC-MS assays.
Method validation.
All samples were within the calibration ranges, and all standard curves were linear (r2 ≥ 0.998). Chromatographic data were processed by using LAB Solution (version 5.56; Shimadzu, Japan). Matrix effects (ion suppression/enhancement), absolute recovery, and process efficiency were determined for three concentrations of RIF and CIP (0.1, 1, and 10 μg/ml), Des-RIF (0.05, 0.5, and 5 μg/ml), and FUS (1, 10, and 50 μg/ml) (20). Three sets of matrix were prepared: set 1 comprised blank plasma or DBSs first spiked and then extracted, set 2 comprised blank plasma or blank DBS first extracted and then spiked postextraction, and set 3 comprised pure solutions of the analyte in acetonitrile and water. The matrix effect (percent) was determined as (set 2 response × 100)/(set 3 response). The process efficiency (percent) was determined as (set 1 response × 100)/(set 3 response). The absolute recovery (percent) was determined as (set 1 response × 100)/(set 2 response). The accuracy of the method was measured from a QCS run in each batch. The lower limit of quantification (LOQ) was determined at a signal-to-noise ratio of 10:1, and the lower limit of detection (LOD) was based on a signal-to-noise ratio of 3:1.
Effect of hematocrit on matrix, process efficiency, and recovery.
A range of low to high hematocrit values (0.28 to 0.64) was artificially prepared by adding plasma or red cells to whole blood. The matrix effect, process efficiency, and recovery were assessed as described above.
Blood-to-plasma partition ratio.
The blood-to-plasma partition ratio was studied at four different concentrations for each drug (0.1, 0.5, 1, and 10 mg/liter for RIF, Des-RIF, and CIP and 1, 10, 30, and 50 mg/liter for FUS). The blood sample was divided into two groups: (i) blank blood, which was centrifuged first, with plasma being separated and spiked with the appropriate concentrations of drugs, and (ii) blank blood spiked with drugs and processed as whole blood. The samples were incubated at 37°C in a water bath for 1 h to optimize the equilibration of the respective drugs within plasma and blood.
The blood-to-plasma partition ratio was determined by using the following equation (21): partition ratio = {(blood [drug])/(plasma [drug]) − (1 − hematocrit)}/hematocrit.
Thermal stability in dried blood spots.
Human whole blood (freshly collected into lithium heparin tubes) was spiked with CIP, RIF, and FUS at concentrations of 2, 5, and 20 mg/liter, respectively (these concentrations were relevant to and based on clinical sample concentrations in the present study). Aliquots (50 μl) were spotted onto blood collection cards and air dried at room temperature for ∼3 h. The dried spot cards were then placed into a Whatman foil bag with a mini-silica gel and stored at 35°C (incubator), 21°C (room temperature, monitored), 4°C (laboratory refrigerator), and −20°C until analysis. Extraction and processing of samples were performed as described above. Samples (n = 3) were analyzed at predetermined times over a 4-week pilot study period, and the mean concentrations (± standard deviations [SD]) were used to determine stability data. The first-order degradation rate constants (in kilodaltons) were determined by fitting a single exponential equation to the concentration-time data. For the purposes of pharmacokinetic studies, the stability of drugs in a biological matrix was set at the time for degradation to 95% of the original concentration (t95).
Statistical methods.
Correlations between plasma and DBS concentrations are provided and were assessed by using Spearman's rank correlation coefficient (rs). Bland-Altman plots were constructed by using plasma concentrations as a reference standard (GraphPad Prism version 6.05; GraphPad Software Inc., La Jolla, CA, USA).
Pharmacokinetic modeling.
Loge plasma concentration-time data sets for CIP, FUS, and RIF with Des-RIF in plasma and DBS samples were analyzed simultaneously by nonlinear mixed-effects modeling using NONMEM (v 7.2.0; Icon Development Solutions, Ellicott City, MD, USA) with an Intel Visual Fortran 10.0 compiler. The first-order conditional estimation (FOCE) with interaction estimation method was used. Allometric scaling was employed a priori, with volume terms being multiplied by (WT/70)1.0 and clearance terms being multiplied by (WT/70)0.75, where WT is body weight (22). Two structures for residual variability (RV), equivalent to proportional and combined RV structures on the normal scale, were tested for the log-transformed data. Secondary pharmacokinetic parameters, including areas under the curve (AUC0–∞) and elimination half-lives (t1/2) for the participants, were obtained from post hoc Bayesian prediction in NONMEM using the final model parameters. Base models were parameterized by using ka (absorption rate constant), VC/F (central volume of distribution), CL/F (clearance), and VP/F and Q/F (peripheral volumes of distribution[s] and their respective intercompartmental clearance rate[s]). For Des-RIF, analyzed simultaneously with RIF, parameters were relative to the bioavailability of RIF (FRIF) and the metabolic conversion rate (FMET), represented as F*D-RIF (equal to FRIF × FMET). The minimum objective function value (OFV); goodness-of-fit plots, including conditional weighted residuals (CWRESs); and condition number (<1,000) were used to choose suitable models during the model-building process. A significance level of a P value of <0.01 was set for comparison of OFVs for nested models using a chi-squared distribution.
One-, two-, and three-compartment models (ADVAN-1, -3, and -11) with zero-, first-, and mixed-order absorption were tested. A transit compartment model for absorption, previously used successfully for anti-infective agents (23–25), was also tested given the significant variability in the absorption phase. For the RIF/Des-RIF model, additional compartments for Des-RIF were added after the structure of the RIF model was obtained. After the model structure was established, interindividual variability (IIV) and correlations between IIV terms were estimated, where supported by the data. To enable comparison of the plasma and DBS data, an additional parameter was included to enable estimation of the difference in each fixed and random parameter for the DBS model. The addition of a relative bioavailability parameter was also tested for each analyte. Finally, relationships between model parameters and age, albumin level, hematocrit value, and creatinine clearance rate were assessed through inspection of scatterplots and box plots of eta versus the covariate and subsequently evaluated with NONMEM. A stepwise forward-inclusion-and-backward-elimination method was used, with a P value of <0.05 being required for the inclusion of a covariate relationship and a P value of <0.01 being required to retain a covariate relationship.
Model evaluation.
A bootstrap analysis using Perl speaks NONMEM (PSN) with 1,000 samples was performed, and the parameters derived from this analysis were summarized as median and 2.5th and 97.5th percentiles (95% empirical confidence interval [CI]) to facilitate evaluation of final model parameter estimates. In addition, prediction-corrected visual predictive checks (pcVPCs) were performed with 1,000 data sets simulated from the final models by using PSN. The observed 10th, 50th, and 90th percentiles were plotted with their respective simulated 95% CIs. Numerical predictive checks (NPCs) were performed to complement the pcVPCs in assessing the predictive performance of the model. For FUS and Des-RIF, VPCs included the simulated median and 80% prediction interval for the fraction of below-the-LOQ (BLQ) data at each time point given that each contained >10% BLQ data (26).
RESULTS
Subject characteristics.
Seven male and three female volunteers were recruited. Their median (range) age, body mass index, hematocrit value, and serum creatinine level were 28 (26 to 47) years, 23.3 (19.5 to 32.3) kg/m2, 0.445 (0.39 to 0.49), and 85 (66 to 104) μmol/liter, respectively.
Assay validation.
The calibration curves for the plasma assays for all drugs were accurate (r2 > 0.99). Chromatograms are provided in the supplemental material. The LOQ and LOD values for both plasma and DBS assays are shown in Table 2. Matrix effects, process efficiency, absolute recovery, intraday variation, interday variation, and accuracy for plasma and DBS assays are shown in Tables 3 and 4. Changes in hematocrit values from 0.28 to 0.64 did not have a significant impact on the matrix effect, process efficiency, or recovery of drugs from DBSs (data not shown).
TABLE 2.
LOQ and LOD values for plasma and dried blood spot assays for rifampin, desacetyl rifampin, ciprofloxacin, and fusidic acid
| Assay type | Rifampin |
Desacetyl rifampin |
Ciprofloxacin |
Fusidic acid |
||||
|---|---|---|---|---|---|---|---|---|
| LOQ (μg/liter) | LOD (μg/liter) | LOQ (μg/liter) | LOD (μg/liter) | LOQ (μg/liter) | LOD (μg/liter) | LOQ (μg/liter) | LOD (μg/liter) | |
| Plasma | 8 | 3 | 8 | 3 | 19 | 6 | 105 | 45 |
| Dried blood spot | 15 | 5 | 14 | 5 | 25 | 10 | 153 | 62 |
TABLE 3.
Validation data for rifampin and desacetyl rifampin in plasma and dried blood spots
| Sample type and parameter | Value for medication |
|||||||
|---|---|---|---|---|---|---|---|---|
| Rifampin at concn (mg/liter) of: |
Desacetyl rifampin at concn (mg/liter) of: |
|||||||
| 0.1 | 1 | 5 | 10 | 0.05 | 0.1 | 0.5 | 5 | |
| Plasma | ||||||||
| Mean matrix effect (%) ± SD (n = 5) | 111 ± 2 | 95 ± 4 | 97 ± 6 | 115 ± 4 | 108 ± 5 | 105 ± 8 | ||
| Mean process efficiency (%) ± SD (n = 5) | 90 ± 4 | 84 ± 8 | 85 ± 6 | 89 ± 5 | 87 ± 6 | 83 ± 6 | ||
| Mean absolute recovery (%) ± SD (n = 5) | 82 ± 4 | 89 ± 8 | 87 ± 7 | 77 ± 3 | 80 ± 3 | 79 ± 3 | ||
| Interday variation (RSD%) (n = 5) | 6.5 | 7.5 | 4.1 | 4.6 | 7.7 | 9.15 | 6.7 | 8.1 |
| Intraday variation (RSD%) (n = 15) | 9.2 | 6.7 | 5.7 | 5.9 | 4.0 | 5.0 | 7.3 | 6.3 |
| Mean accuracy (%) ± SD (n = 15) | 106 ± 10 | 118 ± 13 | 105 ± 3 | 102 ± 7 | 109 ± 8 | 106 ± 7 | 109 ± 9 | 101 ± 6 |
| Red cell partition ratioa | 0.87 | 0.81 | 0.70 | 2.3 | 1.7 | |||
| Dried blood spots | ||||||||
| Mean matrix effect (%) ± SD (n = 5) | 91 ± 13 | 103 ± 7 | 103 ± 6 | 97 ± 8 | 91 ± 3 | 104 ± 11 | ||
| Mean process efficiency (%) ± SD (n = 5) | 79 ± 5 | 83 ± 5 | 81 ± 6 | 80 ± 4 | 81 ± 2 | 82 ± 5 | ||
| Mean absolute recovery (%) ± SD (n = 5) | 88 ± 10 | 80 ± 8 | 79 ± 5 | 84 ± 8 | 89 ± 5 | 79 ± 5 | ||
| Interday variation (RSD%) (n = 5) | 8.5 | 7.2 | 8.3 | 6.3 | 7.7 | 9.98 | 6.5 | 5.2 |
| Intraday variation (RSD%) (n = 15) | 7.0 | 5.8 | 5.1 | 4.3 | 7.8 | 8.43 | 5.9 | 3.9 |
| Mean accuracy (%) ± SD (n = 15) | 105 ± 8 | 114 ± 11 | 106 ± 11 | 96 ± 6 | 109 ± 8 | 106 ± 7 | 109 ± 9 | 101 ± 6 |
The red cell partition ratio for rifampin at 0.5 mg/liter was 0.63, and that for desacetyl rifampin at both 1 and 10 mg/liter was 0.97.
TABLE 4.
Validation data for ciprofloxacin and fusidic acid in plasma and dried blood spots
| Sample type and parameter | Value for medication |
|||||||
|---|---|---|---|---|---|---|---|---|
| Ciprofloxacin at concn (mg/liter) of: |
Fusidic acid at concn (mg/liter) of: |
|||||||
| 0.1 | 1 | 5 | 10 | 1 | 10 | 30 | 50 | |
| Plasma | ||||||||
| Mean matrix effect (%) ± SD (n = 5) | 91 ± 8 | 89 ± 6 | 92 ± 7 | 101 ± 10 | 94 ± 8 | 108 ± 6 | ||
| Mean process efficiency (%) ± SD (n = 5) | 78 ± 6 | 79 ± 4 | 86 ± 8 | 83 ± 8 | 86 ± 9 | 93 ± 3 | ||
| Mean absolute recovery (%) ± SD (n = 5) | 86 ± 3 | 89 ± 3 | 93 ± 8 | 82 ± 5 | 92 ± 10 | 87 ± 4 | ||
| Interday variation (RSD%) (n = 5) | 10.2 | 8.8 | 6.2 | 5.6 | 10.7 | 5.5 | 4.2 | 7.0 |
| Intraday variation (RSD%) (n = 15) | 8.9 | 6.2 | 8.1 | 7.2 | 9.4 | 8.4 | 6.8 | 5.2 |
| Mean accuracy (%) ± SD (n = 15) | 103 ± 12 | 105 ± 14 | 107 ± 11 | 97 ± 10 | 106 ± 14 | 104 ± 11 | 106 ± 5 | 98 ± 7 |
| Red cell partition ratioa | 1.4 | 1.7 | 1.6 | 1.3 | 1.2 | 1.4 | 1.3 | |
| Dried blood spots | ||||||||
| Mean matrix effect (%) ± SD (n = 5) | 80 ± 2 | 105 ± 7 | 107 ± 3 | 105 ± 7 | 103 ± 7 | 113 ± 5 | ||
| Mean process efficiency (%) ± SD (n = 5) | 104 ± 7 | 84 ± 4 | 86 ± 3 | 83 ± 5 | 79 ± 7 | 86 ± 2 | ||
| Mean absolute recovery (%) ± SD (n = 5) | 77 ± 5 | 80 ± 5 | 81 ± 3 | 79 ± 4 | 77 ± 5 | 76 ± 4 | ||
| Interday variation (RSD%) (n = 5) | 8.4 | 9.5 | 9.3 | 10.3 | 9.7 | 9.0 | 5.5 | 5.7 |
| Intraday variation (RSD%) (n = 15) | 5.8 | 8.2 | 9.5 | 8.9 | 6.4 | 5.9 | 7.4 | 4.0 |
| Mean accuracy (%) ± SD (n = 15) | 102 ± 8 | 110 ± 10 | 104 ± 9 | 102 ± 10 | 106 ± 8 | 104 ± 9 | 105 ± 6 | 98 ± 7 |
The red cell partition ratio for ciprofloxacin at 0.5 mg/liter was 1.4.
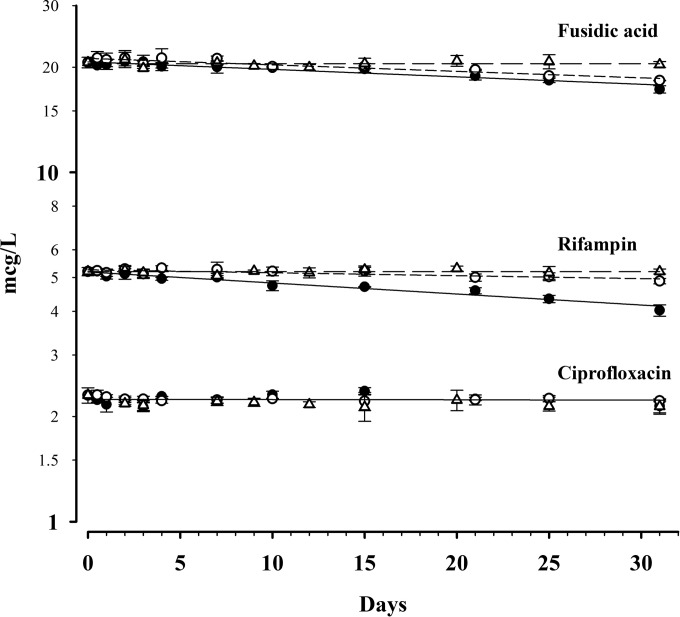
Thermal stability for CIP and RIF in DBSs at 35°C, 21°C, and 4°C is shown in Fig. 1. All drugs showed negligible degradation after 1 month at −20°C (data not shown). The duration of ciprofloxacin stability exceeded 1 month at all temperatures, with <2% degradation after 1 month at 35°C and 21°C (data for degradation at 4°C were inconclusive but indicate <4% degradation after 1 month). The t95 values for RIF at 35°C, 21°C, and 4°C were 7 days, 26 days, and >3 months, respectively. The t95 values for FUS at 35°C, 21°C, and 4°C were 10 days, 12 days, and >3 months, respectively.
FIG 1.
Concentration-time data for ciprofloxacin, rifampin, and fusidic acid at concentrations of 2, 5, and 20 mg/liter, respectively. Data for storage at 35°C (●), 21°C (○), and 4°C (△) are shown.
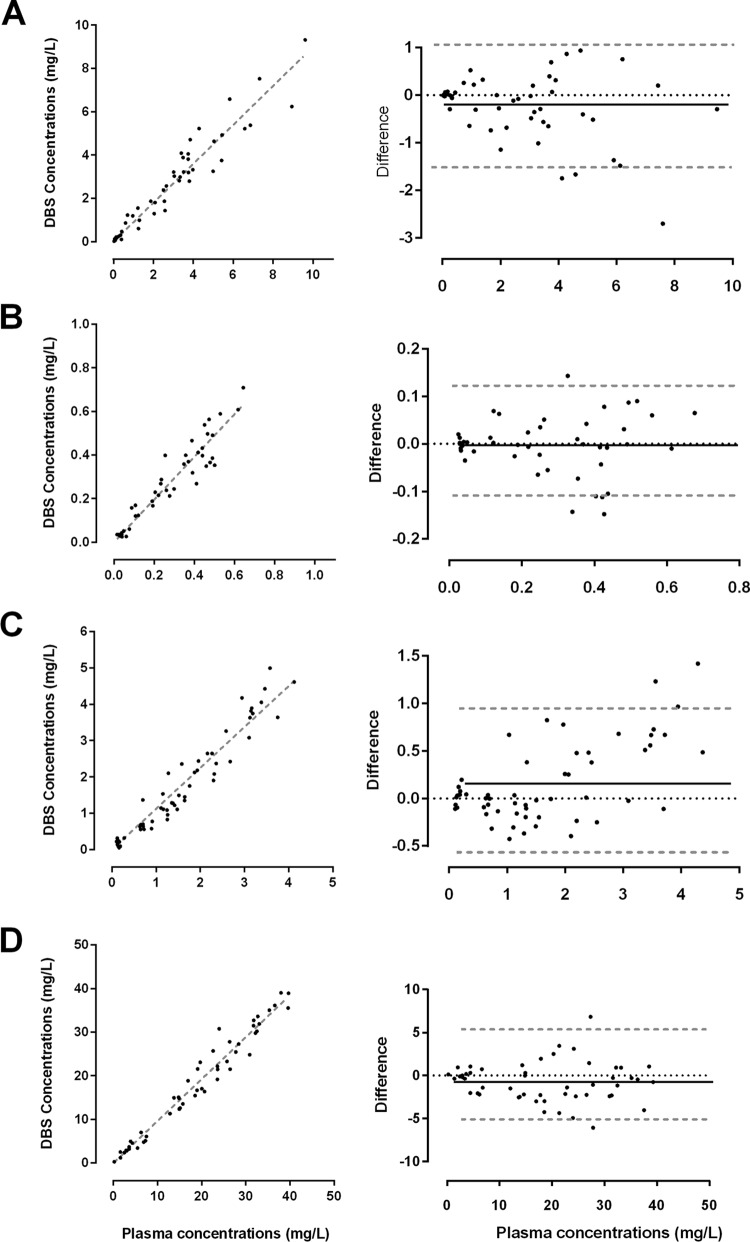
The relationships between plasma concentrations and whole blood taken directly from finger prick samples onto filter paper with their associated Bland-Altman plots for each of the four drugs are shown in Fig. 2. Plasma concentrations correlated well with DBS concentrations in samples taken directly from the finger (rs = 0.97, 0.92, 0.96, and 0.98 for RIF, Des-RIF, CIP, and FUS, respectively). DBS concentrations from mixed capillary blood collected into a heparinized capillary tube and directly from the finger onto filter paper were also highly correlated (r = 0.97). The slopes (95% CIs) of the linear regression lines for unadjusted DBS concentrations in samples collected directly from the finger were 0.90 (0.85 to 0.94), 0.97 (0.02 to 1.03), 1.12 (1.07 to 1.18), and 0.96 (0.93 to 0.99) for RIF, Des-RIF, CIP, and FUS, respectively.
FIG 2.
Relationship between plasma and raw DBS measurements from finger prick and plasma concentrations of rifampin (A), desacetyl rifampin (B), ciprofloxacin (C), and fusidic acid (D) from healthy volunteers. Linear regression lines (dashed gray lines) are provided. Bland-Altman plots show the mean differences (solid black lines) and 95% confidence intervals (dashed gray lines).
Pharmacokinetic modeling.
One participant, a healthy 26-year-old woman, had a different concentration-time profile than those of the other participants, with delayed absorption for each of the drugs (Fig. 3). This was attributed to the fact that she had been recruited during a night shift and consequently had her drugs and sampling schedule late in the evening and in the early hours of the next morning (27). As a result of her discordant data, she was subsequently excluded from PK analyses. For the remaining 9 individuals, there were 54 individual plasma and DBS concentrations available for analysis for each drug. There were 2%, 13%, 6%, and 22% of data points that were BLQ for CIP, FUS, RIF, and Des-RIF, respectively.
FIG 3.
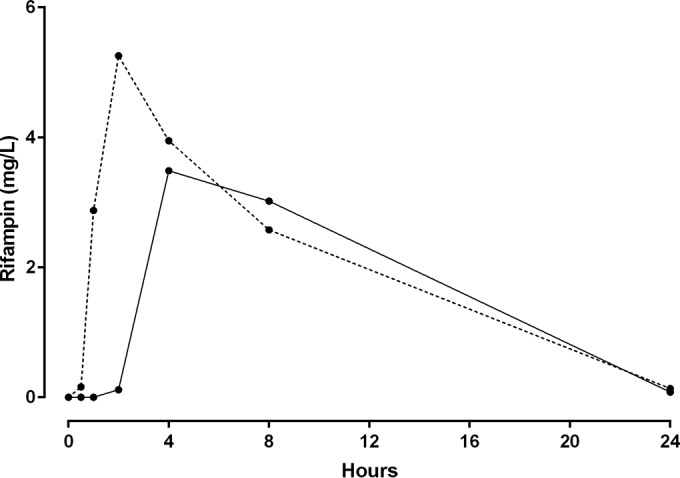
Rifampin time-concentration profiles for 9 participants (mean, dashed line) and one excluded patient (solid line) who took the medication during a nightshift. This demonstrates possible delayed gastric emptying and warranted exclusion from the population pharmacokinetic model.
For FUS and RIF, a single-compartment model was sufficient to represent the concentration-time data, while CIP and Des-RIF were better modeled with two compartments, with significant improvements in the OFV (P < 0.01) and reductions of the bias evident in goodness-of-fit plots. All models performed significantly better with the use of a transit compartment model (P < 0.01). Final model results for CIP, FUS, and RIF/Des-RIF are presented in Tables 5 to 7, respectively.
TABLE 5.
Final population pharmacokinetic estimates from bootstrap results for ciprofloxacin plasma concentrations and dried blood spot concentrations in samples from nine healthy volunteersa
| Parameter | Value |
P value | |||
|---|---|---|---|---|---|
| Plasma parameter |
Relative difference in DBS parameter |
||||
| Estimate | 95% CI | Estimate | 95% CI | ||
| Objective function value | −194.677 | −251.926 to −160.894 | |||
| Structural model parameters | |||||
| MTTCIP (h) | 0.57 | 0.33 to 0.667 | 0.98 | 0.87 to 1.06 | 0.46 |
| NNCIP | 7.3 | 1.9 to 12.8 | 0.78 | 0.57 to 1.89 | 0.55 |
| CL/FCIP (liters/h/70 kg) | 24.1 | 22.3 to 27.6 | 1.05 | 0.96 to 1.15 | 0.30 |
| VC/FCIP (liters/70 kg) | 108.1 | 87.5 to 131.1 | 0.79 | 0.68 to 0.95 | 0.032 |
| Q/FCIP (liters/h/70 kg) | 36.6 | 23.7 to 60.6 | 0.87 | 0.51 to 1.36 | 0.52 |
| VP/FCIP (liters/70 kg) | 81.7 | 62.8 to 111.5 | 1.24 | 0.97 to 1.61 | 0.09 |
| Variable model parameters (shrinkage %) | |||||
| IIV in MTTCIP (%) | 25 | 12 to 93 | 0.95 | 0.75 to 1.33 | 0.73 |
| IIV in NNCIP (%) | 171 | 2 to 271 | 0.96 | 0.25 to 1.23 | 0.75 |
| RV for ciprofloxacin (%) | 18 | 13 to 21 | 1.53 | 1.08 to 2.01 | 0.024 |
MTTCIP, mean transit time for CIP; NNCIP, number of transit compartments for CIP; CL/FCIP, clearance relative to bioavailability for CIP; VC/FCIP, central volume of distribution relative to bioavailability for CIP; Q/FCIP, intercompartmental clearance relative to bioavailability for CIP; VP/FCIP, peripheral volume of distribution relative to bioavailability for CIP; IIV, interindividual variability; RV, residual variability. IIV is presented as .
TABLE 6.
Final population pharmacokinetic estimates from bootstrap results for fusidic acid plasma concentrations and dried blood spot concentrations for nine healthy volunteersa
| Parameter | Value |
P value | |||
|---|---|---|---|---|---|
| Plasma parameter |
Relative difference in DBS parameter |
||||
| Estimate | 95% CI | Estimate | 95% CI | ||
| Objective function value | −170.551 | −217.904 to −153.882 | |||
| Structural model parameters | |||||
| ka, FUS (/h) | 2.71 | 1.26 to 7.99 | 0.80 | 0.11 to 1.17 | 0.20 |
| MTTFUS (h) | 1.03 | 0.86 to 1.20 | 1.09 | 1.01 to 1.16 | 0.03 |
| NNFUS | 12.6 | 11.1 to 14.5 | 1.01 | 0.96 to 1.08 | 0.62 |
| CL/FFUS (liters/h/70 kg) | 0.87 | 0.60 to 1.40 | 0.91 | 0.82 to 1.05 | 0.15 |
| VC/FFUS (liters/70 kg) | 8.90 | 5.10 to 15.1 | 1.30 | 0.61 to 1.99 | 0.38 |
| Variable model parameters (shrinkage %) | |||||
| IIV in CL/FFUS (%) | 22 | 6 to 35 | 0.89 | 0.53 to 1.31 | 0.47 |
| IIV in MTTFUS (%) | 49 | 27 to 62 | 1.04 | 0.89 to 1.18 | 0.62 |
| IIV in ka, FUS (%) | 86 | 12 to 157 | 0.92 | 0.14 to 1.7 | 0.62 |
| RV for fusidic acid (%) | 15 | 12 to 18 | 1.11 | 0.86 to 1.47 | 0.38 |
ka, FUS, absorption rate constant for FUS; MTTFUS, mean transit time for FUS; NNFUS, number of transit compartments for FUS; CL/FFUS, clearance relative to bioavailability for FUS; VC/FFUS, central volume of distribution relative to bioavailability for FUS; IIV, interindividual variability; RV, residual variability. IIV is presented as .
TABLE 7.
Final population pharmacokinetic estimates from bootstrap results for rifampin and desacetyl rifampin plasma concentrations and dried blood spot concentrations for nine healthy volunteersa
| Parameter | Value |
P value | |||
|---|---|---|---|---|---|
| Plasma parameter |
Relative difference in DBS parameter |
||||
| Estimate | 95% CI | Estimate | 95% CI | ||
| Objective function value | −183.8335 | −284.4266 to −118.4457 | |||
| Structural model parameters | |||||
| ka, RIF (/h) | 3.69 | 1.85 to 15.14 | 1.36 | 0.8 to 1.97 | 0.30 |
| MTTRIF (h) | 0.84 | 0.66 to 1.14 | 0.94 | 0.87 to 1.02 | 0.11 |
| NNRIF | 19.2 | 90.0 to 39.0 | 1.23 | 0.92 to 1.59 | 0.19 |
| CL/FRIF (liters/h/70 kg) | 7.65 | 5.88 to 9.80 | 1.18 | 1.06 to 1.33 | <0.01 |
| VC/FRIF (liters/70 kg) | 40.6 | 32.8 to 50.5 | 1.15 | 1.03 to 1.31 | <0.01 |
| CL/F*D-RIF (liters/h/70 kg) | 60.7 | 42 to 72.6 | 1.02 | 0.92 to 1.54 | 0.73 |
| VC/F*D-RIF (liters/70 kg) | 19.8 | 6.6 to 34.0 | 1.3 | 0.47 to 2.53 | 0.40 |
| Q/F*D-RIF (liters/h/70 kg) | 37.7 | 29.1 to 65.7 | 1.09 | 0.60 to 1.87 | 0.71 |
| VP/F*D-RIF (liters/70 kg) | 157 | 98 to 383 | 1.05 | 0.25 to 1.67 | 0.84 |
| Variable model parameters (shrinkage %) | |||||
| IIV in ka, RIF (%) | 118 | 50 to 225 | 1.11 | 0.82 to 1.39 | 0.41 |
| IIV in MTTRIF (%) | 32 | 12 to 42 | 1.02 | 0.93 to 1.09 | 0.58 |
| IIV in CL/FRIF (%) | 19 | 2 to 27 | 0.58 | 0.22 to 1.00 | 0.06 |
| IIV in CL/F*D-RIF (%) | 13 | 4 to 38 | 1.45 | 0.57 to 2.92 | 0.19 |
| IIV in VC/F*D-RIF (%) | 84 | 17 to 167 | 0.58 | 0.2 to 1.19 | 0.13 |
| RV for rifampin (%) | 25 | 19 to 31 | 1.12 | 0.85 to 1.36 | 0.56 |
| RV for desacetyl rifampin (%) | 31 | 19 to 39 | 0.91 | 0.71 to 1.09 | 0.29 |
ka, RIF, absorption rate constant for RIF; MTTRIF, mean transit time for RIF; NNRIF, number of transit compartments for RIF; CL/FRIF, clearance relative to bioavailability for RIF; VC/FRIF, central volume of distribution relative to bioavailability for RIF; CL/F*D-RIF, clearance relative to bioavailability and metabolic conversion for Des-RIF; VC/F*D-RIF, central volume of distribution relative to bioavailability and metabolic conversion for Des-RIF; Q/F*D-RIF, intercompartmental clearance and metabolic conversion for Des-RIF; VP/F*D-RIF, peripheral volume of distribution relative to bioavailability and metabolic conversion for Des-RIF; IIV, interindividual variability; RV, residual variability. IIV and RV are presented as .
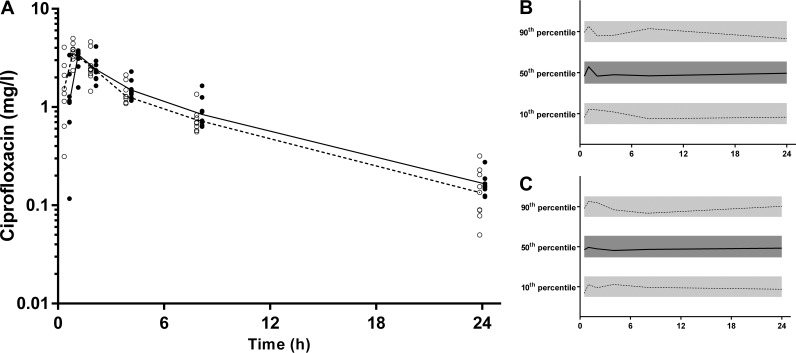
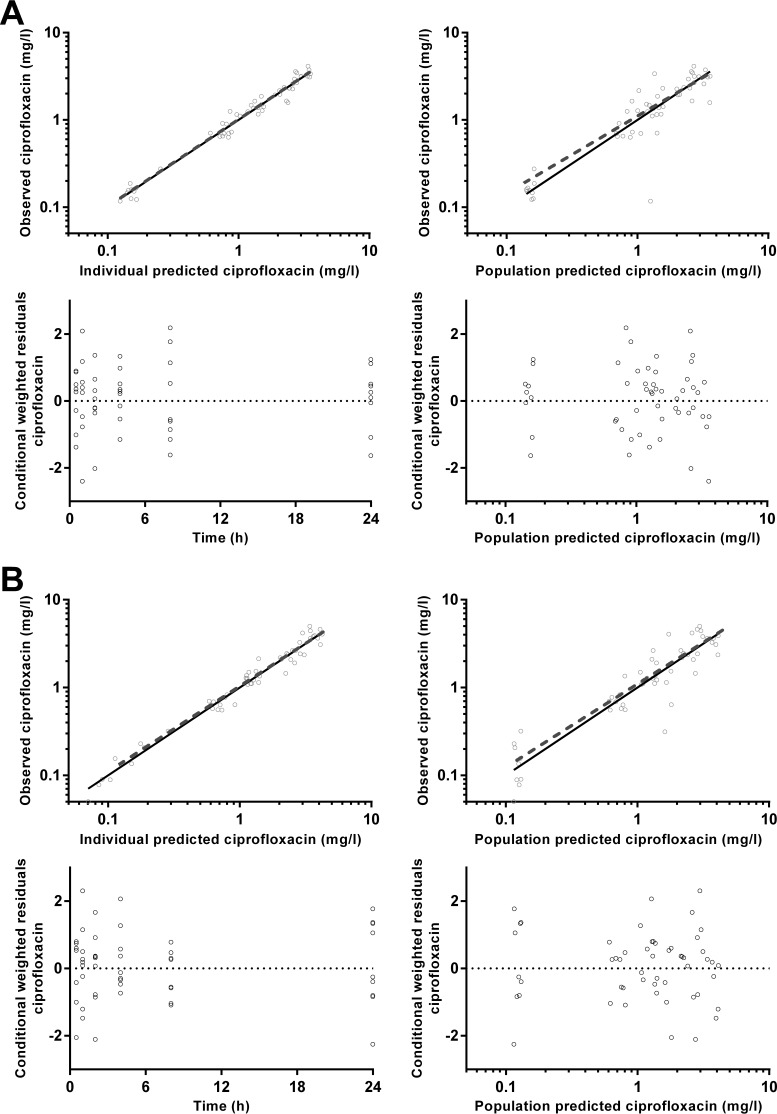
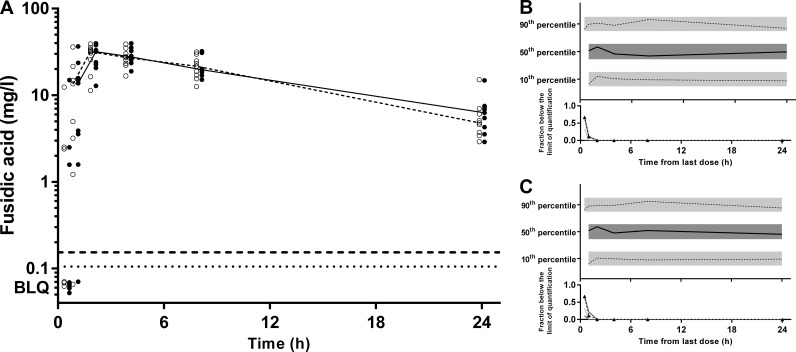
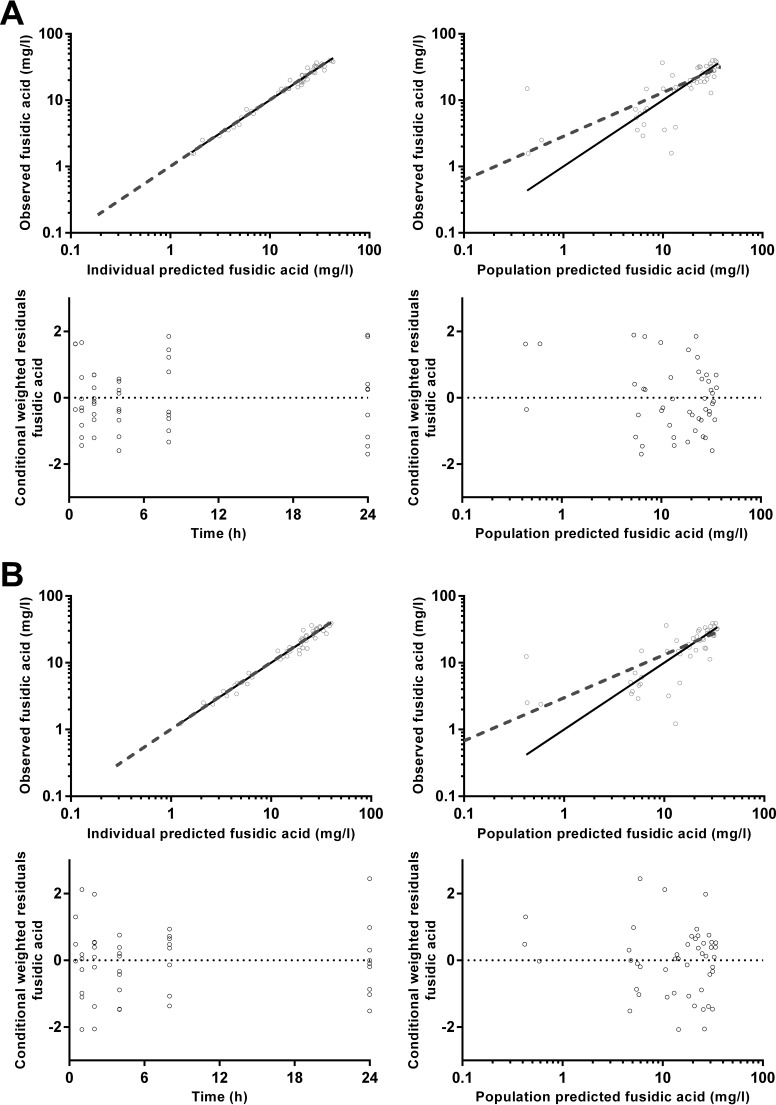
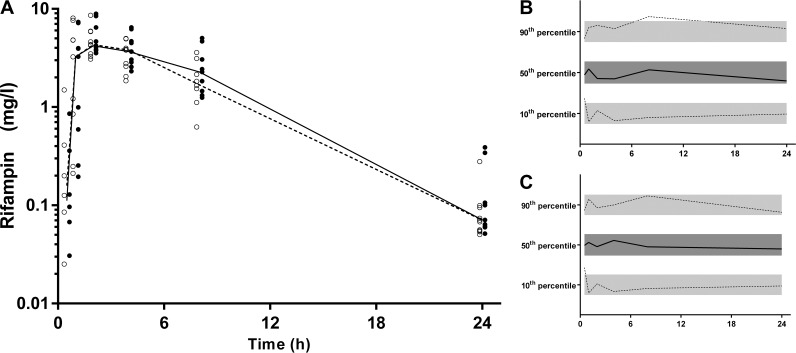
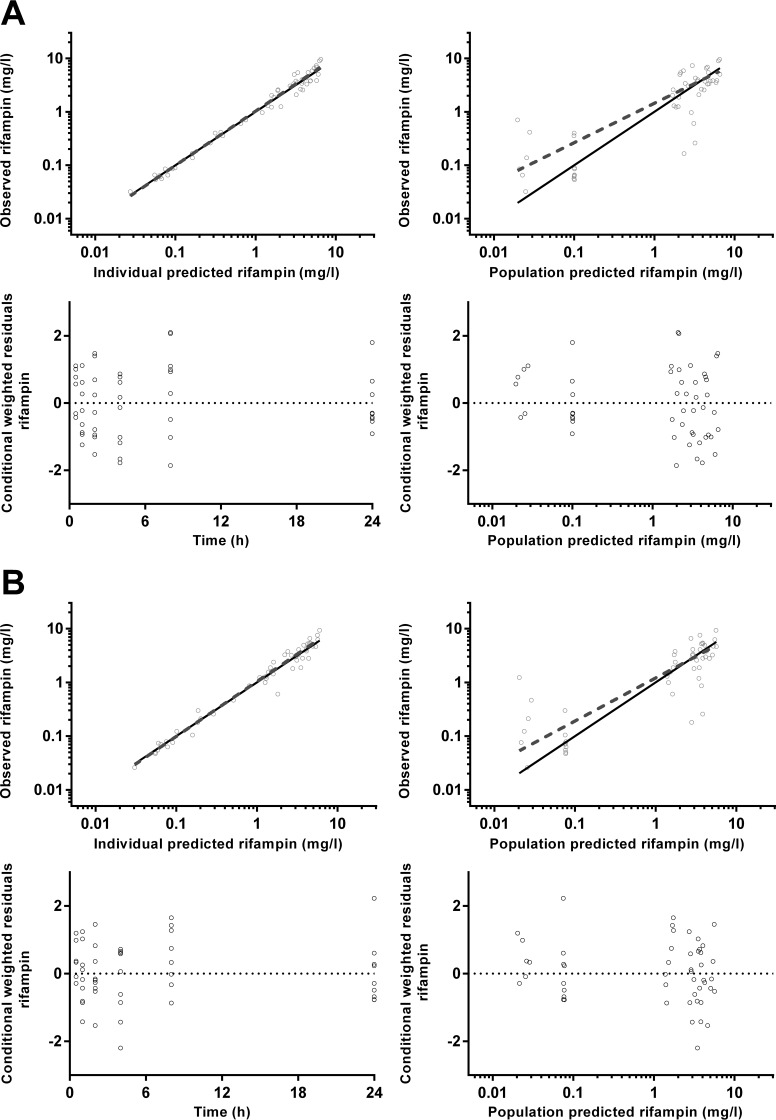
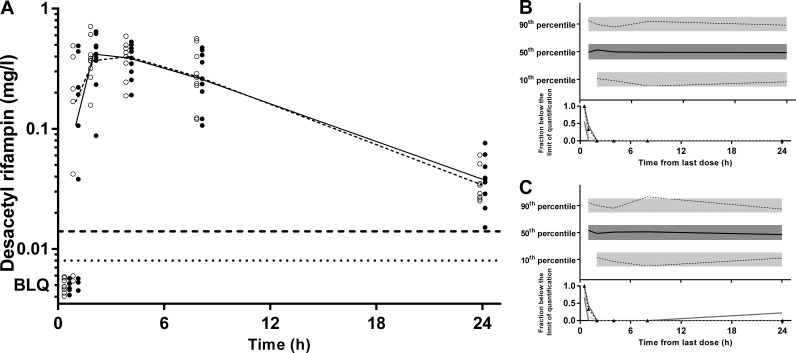
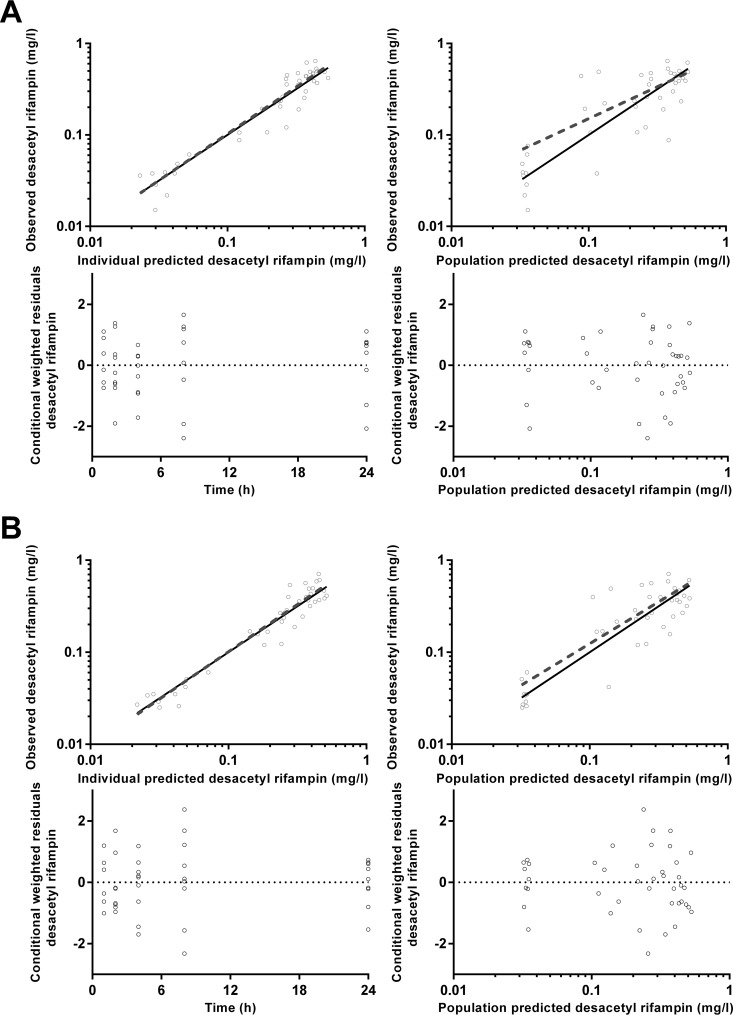
pcVPCs and goodness-of-fit plots, respectively, are shown in Fig. 4 and 5 for CIP, Fig. 6 and 7 for FUS, Fig. 8 and 9 for RIF, and Fig. 10 and 11 for Des-RIF. Given that the observed fraction of BLQ data fell within the simulated 95% CI for FUS and Des-RIF, a more complex method to deal with these data was not utilized.
FIG 4.
(A) Time-concentration profile of ciprofloxacin (milligrams per liter) for dried blood spot-derived (open circles and dashed line) and measured (closed circles and solid line) plasma concentrations (data points were artificially separated to aid comparison). (B and C) Normalized VPC for dried blood spot (B) and plasma (C) concentrations demonstrating the 10th, 50th, and 90th percentiles with the actual data (solid and dashed lines) within their respective 95% prediction intervals (gray-shaded areas).
FIG 5.
Goodness-of-fit plots for ciprofloxacin plasma (A) and dried blood spot (B) concentrations.
FIG 6.
(A) Time-concentration profile of fusidic acid (milligrams per milliliter) for dried blood spot-derived (open circles and dashed line) and measured (closed circles and solid line) plasma concentrations (data points are artificially separated to aid comparison). (B and C) Normalized VPC for dried blood spot (B) and plasma (C) concentrations demonstrating the 10th, 50th, and 90th percentiles with the actual data (solid and dashed lines) within their respective 95% prediction intervals (gray-shaded areas).
FIG 7.
Goodness-of-fit plots for fusidic acid plasma (A) and dried blood spot (B) concentrations.
FIG 8.
(A) Time-concentration profile of rifampin (milligrams per liter) for dried blood spot-derived (open circles and dashed line) and measured (closed circles and solid line) plasma concentrations (data points are artificially separated to aid comparison). (B and C) Normalized VPC for dried blood spot (B) and plasma (C) concentrations demonstrating the 10th, 50th, and 90th percentiles with the actual data (solid and dashed lines) within their respective 95% prediction intervals (gray-shaded areas).
FIG 9.
Goodness-of-fit plots for rifampin plasma (A) and dried blood spot (B) concentrations.
FIG 10.
(A) Time-concentration profile of desacetyl rifampin (milligrams per liter) for dried blood spot-derived (open circles and dashed line) and measured (closed circles and solid line) plasma concentrations (data points are artificially separated to aid comparison). (B and C) Normalized VPC for dried blood spot (B) and plasma (C) concentrations demonstrating the 10th, 50th, and 90th percentiles with the actual data (solid and dashed lines) within their respective 95% prediction intervals (gray-shaded areas).
FIG 11.
Goodness-of-fit plots for desacetyl rifampin plasma (A) and dried blood spot (B) concentrations.
Most of the resultant pharmacokinetic parameters were not significantly different between plasma and DBS samples. However, the central volume of distribution of CIP was 21% lower for DBS samples, with 53% higher residual variability (P = 0.032 and 0.024, respectively). Statistical differences in clearance and the central volume of distribution for RIF were also identified, which were 18% and 15% higher than the plasma values (P < 0.01), respectively. There was a small difference in the mean transit time for FUS (9%; P = 0.03). The addition of a relative bioavailability term did not improve any of the three models.
DISCUSSION
The present data show that CIP, FUS, RIF, and Des-RIF can be accurately quantified in DBSs, and this approach can therefore be used as surrogate for measuring plasma concentrations in PK and PK/PD studies. The potential effects of sample hematocrit, red cell partitioning, assay sensitivity, and temperature stability were assessed and either were noninfluential or could be incorporated as variables in the calculation of DBS-predicted plasma concentrations and PK parameters.
The majority of the population PK parameters for CIP, FUS, RIF, and Des-RIF were not significantly different in comparisons of plasma and DBS-predicted plasma concentrations. There were few differences in estimates of structural model parameters (CL/F, VC/F, Q/F, and VP/F) and in estimates of population variability (IIV for CL/F and VC/F). The only exceptions to this were the VC/F values of CIP and RIF, which were 21% lower and 19% higher, respectively, for DBS samples. The CL/F of RIF was 17% higher, and the mean transit time of FUS was 9% higher. It is unlikely that these relatively minor differences would contribute to clinically meaningful differences in the PK/PD parameters of interest.
When measures of overall antibiotic exposure such as the AUC/MIC ratio or time above the MIC are used to predict clinical outcome, assay sensitivity is less of a concern than in formal PK and toxicology studies. In this case, the LOQ and LOD for all drugs measured in DBSs were close to, or below, 0.1 mg/liter. This represents a value that is an order of magnitude lower than previously reported susceptibility breakpoints of rifampin for staphylococci and Mycobacterium tuberculosis and of ciprofloxacin for staphylococci (all 1 mg/liter) (28). These considerations suggest that the LOQ and LOD for our DBS assay are acceptable for PK and clinical PK/PD studies.
DBS-predicted plasma concentration-time profiles and PK parameters derived from population PK analyses in our healthy volunteers were also consistent with previously reported data from population PK models for CL/F and VC/F, with comparable IIV and RV. As an example, the CL/F value for RIF in our study (7.6 liters/h) accords well with other PK models with reported CL/F values of 8.1 to 19.2 liters/h (13, 29–31). Similarly, the VC/F value of 40.6 liters is consistent with estimates reported in other studies (16 to 53 liters) (13, 29–31). Taken together, these data provide reassurance that by using validated adjustments between plasma and DBSs, the results accord with those of other population PK models and will not impact future studies of optimal dosing strategies.
Studies incorporating DBS sampling have many advantages over conventional PK protocols. Repeated low-volume samples can be collected with minimal processing, thus overcoming ethical concerns associated with the volume of blood taken from young children and allowing recruitment of subjects in resource-limited or ambulatory settings where laboratory equipment such as a centrifuge and deep-freezer storage are not available. Furthermore, our thermal stability data indicate that DBSs with this set of antibiotic samples do not have to be transported or assayed promptly. For the purposes of this study, we considered t95 a stability threshold. In the present study, all three drugs were stable at ambient room temperature for at least 10 days and were stable under refrigeration conditions for at least 1 month. This provides reassurance that the DBSs can be air dried at room temperature for 1 to 2 h and stored in desiccant-containing sealed plastic bags before being transported to a central laboratory for cold storage at −80°C for much longer periods prior to assays.
The present study had limitations. First, one participant's data were excluded, as her drug concentration profile differed markedly from those of the other participants, probably because of the fact that she had been recruited during a night shift and consequently had her drugs and sampling schedule late in the evening and in the early hours of the next morning. This was a timely reminder that delayed gastric emptying in the evening can cause circadian time-dependent PK (27) and that similar studies should generally be performed at the same time of the day where possible.
Our detailed approach to laboratory-based and clinical validation of DBSs for PK studies in this and a recent study (32) supports the use of this method for research and therapeutic drug monitoring in a variety of health care settings. Staff training is straightforward, disposables are relatively inexpensive, and the essential equipment required at a field site is modest.
Supplementary Material
ACKNOWLEDGMENT
We thank the Fremantle Hospital employees who participated in this study.
Funding Statement
Timothy M. E. Davis is supported by an NHMRC practitioner fellowship.
Footnotes
Supplemental material for this article may be found at http://dx.doi.org/10.1128/AAC.00756-16.
REFERENCES
- 1.Ambrose PG, Bhavnani SM, Rubino CM, Louie A, Gumbo T, Forrest A, Drusano GL. 2007. Pharmacokinetics-pharmacodynamics of antimicrobial therapy: it's not just for mice anymore. Clin Infect Dis 44:79–86. doi: 10.1086/510079. [DOI] [PubMed] [Google Scholar]
- 2.Drusano GL, Ambrose PG, Bhavnani SM, Bertino JS, Nafziger AN, Louie A. 2007. Back to the future: using aminoglycosides again and how to dose them optimally. Clin Infect Dis 45:753–760. doi: 10.1086/520991. [DOI] [PubMed] [Google Scholar]
- 3.Andes D. 2001. Pharmacokinetic and pharmacodynamic properties of antimicrobials in the therapy of respiratory tract infections. Curr Opin Infect Dis 14:165–172. doi: 10.1097/00001432-200104000-00010. [DOI] [PubMed] [Google Scholar]
- 4.Mouton JW, Ambrose PG, Canton R, Drusano GL, Harbarth S, MacGowan A, Theuretzbacher U, Turnidge J. 2011. Conserving antibiotics for the future: new ways to use old and new drugs from a pharmacokinetic and pharmacodynamic perspective. Drug Resist Updat 14:107–117. doi: 10.1016/j.drup.2011.02.005. [DOI] [PubMed] [Google Scholar]
- 5.Suyagh M, Collier PS, Millership JS, Iheagwaram G, Millar M, Halliday HL, McElnay JC. 2011. Metronidazole population pharmacokinetics in preterm neonates using dried blood-spot sampling. Pediatrics 127:e367–e374. doi: 10.1542/peds.2010-0807. [DOI] [PubMed] [Google Scholar]
- 6.la Marca G, Malvagia S, Filippi L, Innocenti M, Rosati A, Falchi M, Pellacani S, Moneti G, Guerrini R. 2011. Rapid assay of rufinamide in dried blood spots by a new liquid chromatography-tandem mass spectrometric method. J Pharm Biomed Anal 54:192–197. doi: 10.1016/j.jpba.2010.07.015. [DOI] [PubMed] [Google Scholar]
- 7.Vu DH, Koster RA, Alffenaar JW, Brouwers JR, Uges DR. 2011. Determination of moxifloxacin in dried blood spots using LC-MS/MS and the impact of the hematocrit and blood volume. J Chromatogr B Analyt Technol Biomed Life Sci 879:1063–1070. doi: 10.1016/j.jchromb.2011.03.017. [DOI] [PubMed] [Google Scholar]
- 8.la Marca G, Giocaliere E, Villanelli F, Malvagia S, Funghini S, Ombrone D, Filippi L, De Gaudio M, De Martino M, Galli L. 23 December 2011. Development of an UPLC-MS/MS method for determination of antibiotic ertapenem on dried blood spots. J Pharm Biomed Anal doi: 10.1016/j.jpba.2011.12.018. [DOI] [PubMed] [Google Scholar]
- 9.la Marca G, Malvagia S, Filippi L, Fiorini P, Innocenti M, Luceri F, Pieraccini G, Moneti G, Francese S, Dani FR, Guerrini R. 2008. Rapid assay of topiramate in dried blood spots by a new liquid chromatography-tandem mass spectrometric method. J Pharm Biomed Anal 48:1392–1396. doi: 10.1016/j.jpba.2008.09.025. [DOI] [PubMed] [Google Scholar]
- 10.ter Heine R, Rosing H, van Gorp EC, Mulder JW, van der Steeg WA, Beijnen JH, Huitema AD. 2008. Quantification of protease inhibitors and non-nucleoside reverse transcriptase inhibitors in dried blood spots by liquid chromatography-triple quadrupole mass spectrometry. J Chromatogr B Analyt Technol Biomed Life Sci 867:205–212. doi: 10.1016/j.jchromb.2008.04.003. [DOI] [PubMed] [Google Scholar]
- 11.Dunne WM Jr, Mason EO Jr, Kaplan SL. 1993. Diffusion of rifampin and vancomycin through a Staphylococcus epidermidis biofilm. Antimicrob Agents Chemother 37:2522–2526. doi: 10.1128/AAC.37.12.2522. [DOI] [PMC free article] [PubMed] [Google Scholar]
- 12.Aboltins CA, Page MA, Buising KL, Jenney AW, Daffy JR, Choong PF, Stanley PA. 2007. Treatment of staphylococcal prosthetic joint infections with debridement, prosthesis retention and oral rifampicin and fusidic acid. Clin Microbiol Infect 13:586–591. doi: 10.1111/j.1469-0691.2007.01691.x. [DOI] [PubMed] [Google Scholar]
- 13.Wilkins JJ, Savic RM, Karlsson MO, Langdon G, McIlleron H, Pillai G, Smith PJ, Simonsson US. 2008. Population pharmacokinetics of rifampin in pulmonary tuberculosis patients, including a semimechanistic model to describe variable absorption. Antimicrob Agents Chemother 52:2138–2148. doi: 10.1128/AAC.00461-07. [DOI] [PMC free article] [PubMed] [Google Scholar]
- 14.Peloquin CA, Jaresko GS, Yong CL, Keung AC, Bulpitt AE, Jelliffe RW. 1997. Population pharmacokinetic modeling of isoniazid, rifampin, and pyrazinamide. Antimicrob Agents Chemother 41:2670–2679. [DOI] [PMC free article] [PubMed] [Google Scholar]
- 15.Acocella G. 1983. Pharmacokinetics and metabolism of rifampin in humans. Rev Infect Dis 5(Suppl 3):S428–S432. [DOI] [PubMed] [Google Scholar]
- 16.Pasipanodya JG, McIlleron H, Burger A, Wash PA, Smith P, Gumbo T. 2013. Serum drug concentrations predictive of pulmonary tuberculosis outcomes. J Infect Dis 208:1464–1473. doi: 10.1093/infdis/jit352. [DOI] [PMC free article] [PubMed] [Google Scholar]
- 17.Srivastava S, Pasipanodya JG, Meek C, Leff R, Gumbo T. 2011. Multidrug-resistant tuberculosis not due to noncompliance but to between-patient pharmacokinetic variability. J Infect Dis 204:1951–1959. doi: 10.1093/infdis/jir658. [DOI] [PMC free article] [PubMed] [Google Scholar]
- 18.Nijland HM, Ruslami R, Stalenhoef JE, Nelwan EJ, Alisjahbana B, Nelwan RH, van der Ven AJ, Danusantoso H, Aarnoutse RE, van Crevel R. 2006. Exposure to rifampicin is strongly reduced in patients with tuberculosis and type 2 diabetes. Clin Infect Dis 43:848–854. doi: 10.1086/507543. [DOI] [PubMed] [Google Scholar]
- 19.Vu DH, Koster RA, Bolhuis MS, Greijdanus B, Altena RV, Nguyen DH, Brouwers JR, Uges DR, Alffenaar JW. 2014. Simultaneous determination of rifampicin, clarithromycin and their metabolites in dried blood spots using LC-MS/MS. Talanta 121:9–17. doi: 10.1016/j.talanta.2013.12.043. [DOI] [PubMed] [Google Scholar]
- 20.Matuszewski BK, Constanzer ML, Chavez-Eng CM. 2003. Strategies for the assessment of matrix effect in quantitative bioanalytical methods based on HPLC-MS/MS. Anal Chem 75:3019–3030. doi: 10.1021/ac020361s. [DOI] [PubMed] [Google Scholar]
- 21.Hung TY, Davis TM, Ilett KF. 2003. Measurement of piperaquine in plasma by liquid chromatography with ultraviolet absorbance detection. J Chromatogr B Analyt Technol Biomed Life Sci 791:93–101. doi: 10.1016/S1570-0232(03)00209-5. [DOI] [PubMed] [Google Scholar]
- 22.Anderson BJ, Holford NH. 2009. Mechanistic basis of using body size and maturation to predict clearance in humans. Drug Metab Pharmacokinet 24:25–36. doi: 10.2133/dmpk.24.25. [DOI] [PubMed] [Google Scholar]
- 23.Moore BR, Benjamin JM, Salman S, Griffin S, Ginny E, Page-Sharp M, Robinson LJ, Siba P, Batty KT, Mueller I, Davis TM. 2014. Effect of coadministered fat on the tolerability, safety, and pharmacokinetic properties of dihydroartemisinin-piperaquine in Papua New Guinean children with uncomplicated malaria. Antimicrob Agents Chemother 58:5784–5794. doi: 10.1128/AAC.03314-14. [DOI] [PMC free article] [PubMed] [Google Scholar]
- 24.Salman S, Page-Sharp M, Batty KT, Kose K, Griffin S, Siba PM, Ilett KF, Mueller I, Davis TM. 2012. Pharmacokinetic comparison of two piperaquine-containing artemisinin combination therapies in Papua New Guinean children with uncomplicated malaria. Antimicrob Agents Chemother 56:3288–3297. doi: 10.1128/AAC.06232-11. [DOI] [PMC free article] [PubMed] [Google Scholar]
- 25.Savic RM, Jonker DM, Kerbusch T, Karlsson MO. 2007. Implementation of a transit compartment model for describing drug absorption in pharmacokinetic studies. J Pharmacokinet Pharmacodyn 34:711–726. doi: 10.1007/s10928-007-9066-0. [DOI] [PubMed] [Google Scholar]
- 26.Bergstrand M, Karlsson MO. 2009. Handling data below the limit of quantification in mixed effect models. AAPS J 11:371–380. doi: 10.1208/s12248-009-9112-5. [DOI] [PMC free article] [PubMed] [Google Scholar]
- 27.Lemmer B. 1999. Chronopharmacokinetics: implications for drug treatment. J Pharm Pharmacol 51:887–890. doi: 10.1211/0022357991773294. [DOI] [PubMed] [Google Scholar]
- 28.CLSI. 2014. Performance standards for antimicrobial susceptibility testing; twenty-fourth informational supplement. Clinical and Laboratory Standards Institute, Wayne, PA. [Google Scholar]
- 29.Zvada SP, Denti P, Donald PR, Schaaf HS, Thee S, Seddon JA, Seifart HI, Smith PJ, McIlleron HM, Simonsson US. 2014. Population pharmacokinetics of rifampicin, pyrazinamide and isoniazid in children with tuberculosis: in silico evaluation of currently recommended doses. J Antimicrob Chemother 69:1339–1349. doi: 10.1093/jac/dkt524. [DOI] [PMC free article] [PubMed] [Google Scholar]
- 30.Seng KY, Hee KH, Soon GH, Chew N, Khoo SH, Lee LS. 2015. Population pharmacokinetics of rifampicin and 25-deacetyl-rifampicin in healthy Asian adults. J Antimicrob Chemother 70:3298–3306. doi: 10.1093/jac/dkv268. [DOI] [PubMed] [Google Scholar]
- 31.Milan Segovia RC, Dominguez Ramirez AM, Jung Cook H, Magana Aquino M, Vigna Perez M, Brundage RC, Romano Moreno S. 2013. Population pharmacokinetics of rifampicin in Mexican patients with tuberculosis. J Clin Pharm Ther 38:56–61. doi: 10.1111/jcpt.12016. [DOI] [PubMed] [Google Scholar]
- 32.Page-Sharp M, Nunn T, Salman S, Moore BR, Batty KT, Davis TM, Manning L. 2016. Validation and application of a dried blood spot ceftriaxone assay. Antimicrob Agents Chemother 60:14–23. doi: 10.1128/AAC.01740-15. [DOI] [PMC free article] [PubMed] [Google Scholar]
Associated Data
This section collects any data citations, data availability statements, or supplementary materials included in this article.


