

Abstract
Metabolic rate in animals and power consumption in computers are analogous quantities that scale similarly with size. We analyse vascular systems of mammals and on-chip networks of microprocessors, where natural selection and human engineering, respectively, have produced systems that minimize both energy dissipation and delivery times. Using a simple network model that simultaneously minimizes energy and time, our analysis explains empirically observed trends in the scaling of metabolic rate in mammals and power consumption and performance in microprocessors across several orders of magnitude in size. Just as the evolutionary transitions from unicellular to multicellular animals in biology are associated with shifts in metabolic scaling, our model suggests that the scaling of power and performance will change as computer designs transition to decentralized multi-core and distributed cyber-physical systems. More generally, a single energy–time minimization principle may govern the design of many complex systems that process energy, materials and information.
This article is part of the themed issue ‘The major synthetic evolutionary transitions’.
Keywords: scaling, networks, metabolism, computer architecture, evolutionary transitions
1. Introduction
Both organisms and computers have evolved from relatively simple beginnings into complex systems that vary by orders of magnitude in size and number of components. Evolution, by natural selection in organisms and by human engineering in computers, required critical features of architecture and function to be scaled up as size and complexity increased. In biology, Kleiber's Law describes empirically how metabolic rate and many other traits, such as lifespan, heart rate and number of offspring, scale with body size [1]. Similarly, computer architecture has Moore's Law to describe scaling of transistor density and performance [2], Koomey's Law for the energy cost per computation [3], and Rent's rule for the external communication per logic block [4].
We posit that these empirical patterns originate from a common principle: networks that deliver resources are optimized to reduce energy dissipation and increase flow rates, expressed here as minimizing the energy–time product. That is, both living systems and computer chips are designed to maximize the rate at which resources are delivered to terminal nodes of a network and to minimize the energy dissipated as it is delivered and processed. For example, in biology the vascular network of mammals supplies oxygen and nutrients to every cell, fuelling metabolism for maintenance, growth and reproduction. Since energy is a limited resource, we assume that mammals are selected to minimize the time spent and energy dissipated as oxygen is delivered through the network [5] and processed to produce ATP in the mitochondria. Similarly, computation in microprocessors relies on a network of microscopic wires that transmits bits of information between transistors on a chip. This network is designed to deliver the maximum information flow at the lowest possible energy cost.
Here, we model mammals as composed of nodes (regions of tissue) that process oxygen delivered via a hierarchical vascular network, and we model microprocessors as composed of nodes (transistors that perform computation) that communicate bits over a network of wires. As each system scales up in size, our model identifies network designs that minimize (i) the time for resources to be delivered by the network and processed in the nodes, and (ii) the energy dissipated during these processes. Despite the obvious differences between animals and chips, we present a general model and derive energy and time-scaling relations from physical principles applicable to each system. Using these relations, we express the optimal network design as a trade-off between energy cost and processing speed. This energy–time minimization model is consistent with shifts across the major evolutionary transitions, such as the transition from protists to multicellular animals and the transition from single- to multi-core computer chips. It also points to likely future trajectories of the evolution of computer architecture and to possible extensions of metabolic scaling theory to account for sociality.
Previous biological scaling models have sought either to minimize energy dissipation, e.g. [5], or to maximize resource delivery rate [6], but they have not formalized the trade-offs between these goals. By simultaneously considering energy and time minimization, our analysis helps to explain how nature and engineering are able to produce designs that approach pareto-optimality along the energy–time trade-off, a question investigated extensively in computer architecture (e.g. [7,8]). Thus, biological evolution has produced mammals ranging in size from mice to elephants, rather than converging on a single optimal size, and computer engineers have designed processors with thousands to billions of transistors, each of which fills a specific computational niche.
In the rest of the paper, we present the unified energy–time minimization model (§2) and its assumptions (§2a). We then use the model to derive a series of predictions about how time and energy scale with system size, first for mammals (§3a,b) and then for microprocessors (§3c). We discuss new insights into previously analysed scaling relationships in biology that we gain from the time–energy minimization framework, and we test our scaling predictions with empirical power and performance data on computer chips. Finally, in §4, we discuss the implications of these results for evolutionary transitions in nature and engineering.
2. Unified model of network scaling
Vascular systems are hierarchical branching networks where blood vessels (pipes) become thicker and longer through the hierarchy from the capillaries to the aorta. Similarly, microprocessor chips are organized hierarchically into a nested structure of modules and submodules, where wires become longer and thicker as the hierarchical level of a module increases (figure 1). These wires are organized into metal layers, where short, thin wires are routed on the lowest layers, and long, thick wires are placed on the top layers. We model the scaling of length (l) and thickness (r) of both pipes and wires as
| 2.1 |
and
| 2.2 |
where i is the hierarchical level of a branch or module, λ is the branching factor and Dl and Dr are the length and thickness dimensions, respectively. This model resembles the hierarchical pipe model of vascular systems proposed in [5], where  and
and  correspond to β and γ, respectively, in [5] (note that in [5], the aorta or top of the network is labelled as level 0, while here the smallest branches, the capillaries, are labelled as level 0).
Figure 1.

Idealized branching models in biology (a) and computers (c). (a) A cardiovascular tree with branching factor λ = 2, H = 5 hierarchical branchings and N = 32 terminal branches at level 0 that represent capillaries. (b) The radius and length of successive branches: Dr defines the relative radius and Dl defines the relative length of pipe or wire between successive hierarchical levels (i and i + 1) in both biology (a) and computers (c). (c) The semi-hierarchical branching of logic wires on a computer chip. Each module within a hierarchical level is shaded the same colour. The purple, red, green and blue (thinnest to thickest) wires cross 0, 1, 2 and 3 modules, respectively. The wire lengths and widths increase as they cross more levels according to Dl and Dr. Dw defines the number of wires, determined by the ratio of internal (intra-module) communication per node to external (inter-module) communication per node. Here Dw = 2 so that a node is connected to all nodes within a module (in this case only 1) by a purple wire, 1/2 of the nodes in the next hierarchical level by red wires, 1/4 of the nodes in the next level by green wires, and 1/8 of the nodes in the next level by blue wires.
In vascular networks, r represents the radius of cylindrical pipes, and in computer interconnect, r represents the width of wires with aspect ratio 1. Dr describes the relative radius of pipes between successive hierarchical levels. The smallest edges occur at i = 0, and have constant radius, r0, but length, l0, that scales with system size [6].
The length parameter Dl is determined by the spatial dimension occupied by the nodes of the network [9]. For chips, Dl = 2, since transistors are placed on a single two-dimensional layer [10]; for three-dimensional organisms, Dl = 3. Because the length of a vessel defines the radius of a three-dimensional volume of tissue supplied by that vessel, each successive vessel in the hierarchy also scales according to equation (2.1) with Dl = 3 [5,6]. Similarly, the length of each successive wire on a two-dimensional chip defines the area to which that wire delivers signals [11]. Thus, in the simplest networks that efficiently deliver resources homogeneously throughout a volume or area, Dl describes both the relative length of pipe between successive hierarchical levels and the physical dimension of the system. For example in figure 1c, where λ = 2 and Dl = 2, wires are 21/2 = 1.41 times longer when they connect to successively higher modules in the hierarchy.
Digital circuits scale in a third way beyond length and radius, which has no direct analogue in mammalian cardiovascular networks. Digital circuits are partially decentralized, with networks that connect multiple sources and destinations, while vascular networks are centralized, with blood flowing from a single heart. In vascular networks, each pipe branches at each hierarchical level forming a tree structure (in the simplest case with λ = 2 forming a binary tree). Chips, however, have many connections within each level of the network, and the number of these connections varies systematically with the hierarchical level. To account for this difference, we introduce a new equation, in which the communication (or number of wires) per module increases with the hierarchical level as
| 2.3 |
where Dw is the communication dimension and w0 is the average number of wires per node. This hierarchical scaling of communication is a well-known pattern in circuit design called Rent's rule [4], where p = 1/Dw is Rent's exponent.1 This pattern is not unique to circuits and has been shown to occur in many biological networks [12–15]. Vascular systems correspond to a special case, where wi = 1 for all i.
(a). Assumptions of the unified model
Before presenting the model and deriving scaling predictions, we state the model's assumptions and how they relate to earlier models, both in computation and biology:
(1) Time and energy are equally important constraints. System designs seek to deliver the maximum quantity of resource per unit time for the minimum quantity of energy expended. In computer architecture, this relationship is expressed as the ‘energy-delay product’, which formalizes the insight that a chip that is 10 times faster or 10 times more energy efficient is 10 times better [16]. In synchronous systems, clock speed (delay between clock ticks) determines the maximum rate at which the system can compute.
- (2) Steady state. Resource supply matches processing demand [6,17]. That is, the network supplies resources continually to the nodes and is always filled to capacity. This avoids network delays and the need to store resources in the system. Specifically,
- (a) System designs balance network delivery rates with node-processing speeds, so that resources are delivered at exactly the same rate that they are processed.
- (b) Pipelining: a concept from computer architecture in which resources, e.g. computer instructions, leave the source at the same rate that they are delivered to the terminal nodes and the network is always full. Consequently, resources (oxygen molecules or bits) flow through the network continually without bottlenecks, and they do not accumulate at the source, sink or intermediate locations.
(3) Terminal units and service volumes. We follow previous scaling models of biology, which posit that the service volume (the volume of tissue that is supplied by a single terminal unit of the network) increases with system size and has a fixed metabolic rate [5,6]. In contrast to [5], we do not assume that terminal branches of the vascular network have fixed size. Following [6], we assume that the length (l0) of the terminal branches of the network (e.g. capillaries) is proportional to the radius of the service volume. We also follow the assumptions in [6] that the capillaries have fixed radius, and that the speed of flow (u0) through the service volume is proportional to its length, so that the rate of arrival of oxygen molecules to mitochondria in the service volume is constant across mammals. In chips, transistor size has shrunk over many orders of magnitude over the past 50 years. Similar to the length scaling of the service volume in mammals, the radius of the isochronic region (the service area) for chips scales proportionally with decreasing transistor size [11]. Thus, service regions are smaller in more powerful chips (which have more transistors), but they are larger in larger animals. We refer to the service volumes in mammals and the service regions on chips as nodes.
In addition to these general assumptions, we make the following refinements to accommodate salient differences between biology and computer architecture.
(a) In biology, the energy processed by a node (Enode) is invariant with system size. That is, as the size of a service volume increases with body size, the total amount of energy it processes remains constant. We do not make this assumption for chips.
(b) Component packing: in chips, we assume that total chip area is constant, and the number of transistors (N) is the square of the process size, i.e. the length of one side of a transistor.
In biology, it is known that blood flow slows by several orders of magnitude as it travels from the aorta to the capillaries [5]. Earlier scaling models have generally not characterized this slowing [5,6], but our equations include velocity as an explicit term to highlight where it affects time and energy scaling. Here, we model Dr as constant within an organism so that blood slows continuously from the heart to the capillaries. We also model Dw and Dl as constant. Because rates of blood flow, oxygen delivery and ATP synthesis can be converted one to another by a simple conversion constant, we treat them interchangeably in our scaling model.
3. Model predictions for mammals and microprocessors
We define Enet and Tnet, respectively, to be the energy dissipated and the time taken by the network to deliver a fundamental unit of resource to each node. For mammals, the resource is oxygen (in mammals, carried by a unit volume of blood), and for computers, the resource is a bit of information. Similarly, we define Enode and Tnode as the energy dissipated and the time taken by the nodes to process that resource. For mammals, the node is the service volume corresponding to a region of tissue supplied by a single capillary [6], which corresponds to a volume of tissue containing a constant number of mitochondria [18], the organelles that process oxygen molecules to generate biologically useful energy in the form of ATP. A node is defined as having a constant rate of delivery of oxygen and processing of oxygen, but the volume of a node varies with organism size.
Enet is the energy required to deliver oxygen to the cells (as analysed in [5]), and Enode is the energy dissipated by cells processing incoming oxygen. Tnet is the time delay between delivering each oxygen molecule to the cell, and Tnode is the time taken for the cell to process each oxygen molecule. From the steady-state assumption, Tnet = Tnode, i.e. supply matches demand as in [6].
In microprocessors, the nodes are transistors, and Enet and Enode represent the energy dissipated as bits are delivered to transistors and the energy required to process the bits at the node. Tnet and Tnode are the times required to deliver and process a bit at the node (i.e. network and transistor switching delay). In computers, the time taken to deliver and process bits is bounded by max(Tnet, Tnode), i.e. a node cannot process another bit until the bit is delivered, and a node cannot process a new bit until the node has finished processing the previous bit. For both mammals and microprocessors, we define the total energy as the sum of energy dissipated in the network plus the energy dissipated in the nodes: Esys = Enet + Enode.2
In the following, we derive general scaling relationships between Enet, Tnet, Enode and Tnode, and the number of nodes N, under the assumption that the energy–time product is minimized. N is our measure of system size (number of capillaries or number of transistors). In mammals, larger N implies larger organism volume and mass. For computer chips, N increases by shrinking components, and so increasing N does not imply increasing chip area, which we assume to be constant.
The hypothesis that mammals and computers minimize the energy–time product predicts that optimized system designs will achieve the highest performance per cost, where performance is given by flow and cost by energy expended. To show this mathematically, we express the optimal network design as a constraint optimization problem in which the whole system's energy–time product is minimized as
| 3.1 |
We derive expressions for Esys and Tsys for mammals (§3a) and microprocessors (§3c) in terms of the dimensions Dr, Dw and Dl, where Dl is fixed by the external dimensions of the system.
(a). Mammallian cardiovascular network
In this section, we derive general-energy and time-scaling relations for the cardiovascular network and nodes, and then use them to minimize equation (3.1). We first define scaling relationships for the four key quantities: (i) Enet, (ii) Enode, (iii) Tnet, and (iv) Tnode, and then show how they scale with N when equation (3.1) is minimized. In contrast to computer scaling, several theoretical scaling models have been proposed for animals over the last century (e.g. [5,6,19–21]). The influential West et al. [5] model predicted scaling relationships by minimizing energy dissipation, whereas an alternative model [6] maximized metabolic rate by minimizing the time to deliver oxygen. Not surprisingly, scaling models that assume different optimization principles make different predictions [22]. Our model combines both energy and time constraints into a single framework.
(i) Enet. From basic principles of hydraulics, the energy dissipated to transport a constant volume of blood through the network is given by the loss in pressure from the aorta to the capillaries multiplied by the volume being transported. The loss in pressure is the product between hydraulic resistance (R) and flow (Q), so ΔP = RQ. Thus, 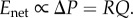
(ii) Enode. Following [5,11], we assume that the quantity of energy dissipated to metabolize a fixed quantity of oxygen in each node is constant. Therefore, the energy summed over all nodes is 
(iii) Tnet. The time to deliver a fixed number of oxygen molecules to the nodes is given by the volume of blood being transported divided by the flow (Q). Since a constant volume is delivered to each node in parallel, we consider the volume being distributed per unit time to all nodes, giving 
There is no distance term in the Tnet equation. This is because Tnet is defined as the time to deliver the ‘next’ oxygen molecule from a capillary, consistent with the steady-state assumption. It is not the time it takes a single molecule to traverse the network (i.e. it is not τ in [6]), but rather the inverse of the rate at which oxygen molecules are delivered to the nodes, analogous to the inverse of clock speed in computer chips.
(iv) Tnode. From the steady-state assumption, 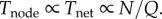
Substituting these relationships into equation (3.1) (where Esys = RQ + N, and  ) gives
| 3.2 |
We now show how R and Q scale with N. The resistance of a pipe is given by the well-known Hagen–Poiseuille's equation, where R at hierarchical level i is 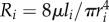 and μ is the viscosity constant. The total network resistance R is given by [5]
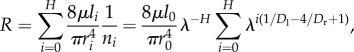 |
3.3 |
where there are H + 1 hierarchical levels, and ni = λH− i is the total number of pipes at hierarchical level i.
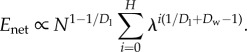
Next, we consider upper and lower bounds for Dr given the objective of minimizing the energy–time product (equation (3.2)). Recalling that λ−H = N−1, in the case where Dr ≤ 4Dl/(1 + Dl), the summation in equation (3.3) converges to a constant (log(N) in the case of equality), and
| 3.4 |
As Dr increases above 4Dl/(1 + Dl), R increases from  to
to  (see Appendix A in the electronic supplementary material for details of the calculation).
Flow through a pipe is defined as Q = uπr2, where u is the fluid velocity. Therefore, flow through the aorta equals  and substituting from equation (2.2),
  Since we do not assume that uH is independent of N, u0 appears in the equations. If Q is equal at all levels of the network (steady-state assumption) then:
| 3.5 |
With R and Q in hand, we now substitute these relationships into the equations for Enet, Enode, Tnet and Tnode, obtaining the scaling predictions shown in the first column of table 1. It is evident that the scaling behaviour of Enet depends on the value of Dr:
Table 1.
Predicted scaling relationships for mammals and computer chips. The first column shows the general scaling equation for dimensional parameters in plausible ranges, Dr ≤ 4Dl/(1 + Dl) for mammals and Dw ≥ Dl/(Dl − 1) for chips. The second column shows how each quantity scales with N given the values of the dimensional parameters that minimize the energy–time product, Dr = 24/11 and Dl = 3 for mammals and Dr = Dl = Dw = 2 for chips.
| general | energy–time minimization | |
|---|---|---|
| mammals | ||
| Enet |  |
N1/12 |
| Enode | N | N |
| Tnet |  |
N0 |
| Tnode |  |
N0 |
| Esys × Tsys |  |
N1/12 + N |
| computers | ||
| Enet |  |
N1/2 |
| Enode |  |
N1/2 |
| Tnet | N0 | N0 |
| Tnode |  |
N−1/2 |
| Esys × Tsys |  |
N1/2 + N1/2 |
Case 1:

Case 2:

Given that Dl = 3 for three-dimensional animals, and that Dr must be greater than 2 to accommodate the necessary slowing of blood as it flows towards the capillaries (5), then Case 1 applies for 2 ≤ Dr ≤ 3, and Case 2 applies for Dr > 3.
Appendix A (in the electronic supplementary material) gives the derivations for Enet for all values of Dr. Here we show the case (Dr ≤ 3) that minimizes the scaling of the energy–time product (equation (3.2)):
| 3.6 |
The energy–time product is dominated by the second term in equation (3.6), which is minimized by setting Dr to its minimum possible value. Thus, minimizing the energy–time product requires Dr = 2 (Case 1), and
| 3.7 |
(b). Biological scaling predictions from the energy–time minimization model
Earlier scaling models showed that area-preserving branching (Dr = 2) leads to the 3/4 power scaling of metabolic rate with body size known as Kleiber's Law (e.g. [5,6]). However, in animal circulatory networks blood must slow before reaching capillaries in order to reduce pressure on the walls of small vessels and to allow oxygen to be dissociated from haemoglobin in the capillaries. Under this circumstance, perfect area-preserving branching is not feasible, and Dr must be greater than 2.
We make a specific prediction for the value of Dr that minimizes the energy–time product while both slowing the flow of blood to the capillaries and matching the supply and demand for oxygen in the nodes. By our definition of a node as the volume of tissue that processes oxygen at a fixed rate, Tnode must be invariant. Table 1 shows the model prediction 
Following [6], in the optimal case u0 increases with organism mass, and therefore with N. See electronic supplementary
material, §6.1 for the derivation that  Substituting this equation for u0 into the equation for Tnode in table 1, we find that Tnode is invariant with respect to N when Dr = 24/11 = 2.18. The last column of table 1 lists the scaling predictions given this value of Dr.
We test the prediction that Dr = 24/11 using data from [23]. This influential Kolokotrones et al. paper showed that metabolic rate is elevated in both small and very large mammals, indicating systematic deviations from a simple power-law relationship between metabolism and mass. Although the deviation appears only as a slight curvature in the canonical log–log plots, as shown in figure 2, it is important because it calls into question prior scaling models that purport to explain a universal scaling exponent.
Figure 2.
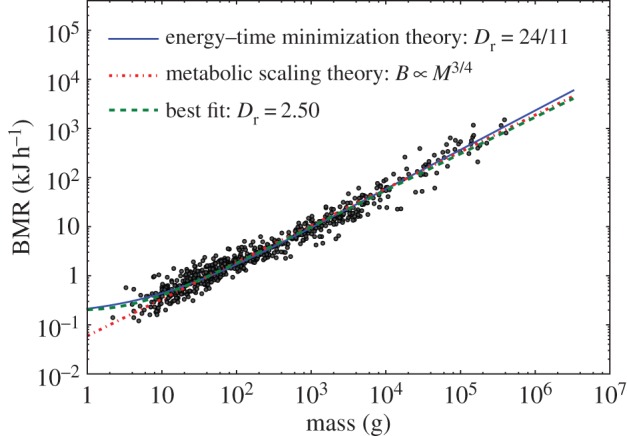
The energy–time minimization model predicts metabolic scaling in mammals. Data from [23] show slight, but theoretically important, curvature in the scaling of metabolic rate versus mass of mammals. The theoretical optimum predicted by equation (3.8) with Dr = 24/11 is shown as a solid line. The West et al. 3/4 scaling prediction [5] is shown as a dotted line, and the best empirical fit of equation (3.8) to the data is shown as a dashed line (Dr = 2.50).
We derive the equation relating metabolism (B) to mass (M), following the approach used in [6], but we relax the assumption that Dr = 2 giving3
 and
and
| 3.8 |
See electronic supplementary material, §6.1 for details of the calculations.
Although this prediction for B is not as simple as the 3/4 scaling predicted by West et al. [5] or the alternative models proposed by Kolokotrones et al. [23], the exponents in equation (3.8) arise naturally by combining two scaling relationships: that of the metabolic rate of the nodes and the metabolic power required to drive the network.
By considering blood slowing through the network due to Dr > 2 and by including energy dissipated in both the network and the nodes, each with different scaling exponents, the model naturally generates the curvature observed in the data. Intuitively, in smaller animals a greater fraction of energy is consumed by Enode, a term that is linear in the number of nodes.
We tested the predicted value of Dr = 24/11, which minimizes the energy–time product, and find a marginally better fit (solid line in figure 2), than alternative models in [23]. The m.s.e. for our model is 0.0271 versus 0.0287 for the extended West et al. model (red dotted line in figure 2). The alternative models in [23] that were specifically designed to account for curvature have m.s.e. 0.274 and 0.0277. We also calculated a value of Dr that is the best statistical fit to the data. Following [23], we use least-squares regression, eliminate the orca that is an outlier, and choose scaling constants to best fit the data. We find that Dr = 2.50 gives the best statistical fit (dashed line in figure 2). Alternative fitting methods and inclusion of the outlier have negligible effect on the best-fit value of Dr.
The energy–time minimization model is the only model proposed thus far that naturally generates curvature accounting for the elevated metabolic rate of the largest mammals as well as the smallest. The predicted value of Dr between 2 and 3 is also consistent with the idea that the upper region of the network is area preserving with Dr = 2, while Dr = 3 in the lower region as proposed by West et al. [5], and it is consistent with the empirical radius scaling reported in [22].
(c). Microprocessor model
We now apply the same reasoning to computer chips. In computers, unlike biology, nodes (transistors) are not constant size but have shrunk by many orders of magnitude over 40 years of microarchitecture evolution. During this time, total chip area has grown much more slowly, and we assume it to be constant for our calculations. In addition, the total area of all transistors on the chip is a fixed fraction of the area of the chip [11]. Putting these two constraints together, the linear dimensions of transistors decrease with transistor count as N−1/2 (more generally,  ). The width of the smallest wires is
  because minimum transistor size and wire width are both determined by the process size. Similarly,
  because transistor linear density increases as N1/2. Intuitively, this means that the number of nodes increases as smaller transistors are placed closer together and connected with smaller and shorter wires. In the following, we assume that all wires carry the same flow and that information is transferred synchronously. We now calculate how Enet, Tnet, Tnode and Tnode scale with the number of transistors, N, and the three scaling dimensions, Dl, Dr and Dw.
Enet can be calculated from basic principles of electronics as the energy dissipated to transmit a bit over a wire: CV2/2, where C is capacitance and V is voltage. Because V has remained approximately constant over the last four decades (decreasing only by a factor of five while transistor count increased by six orders of magnitude [24]), we estimate that the total energy to transmit all bits over the network scales as C [25]. Ignoring fringe effects and for an aspect ratio of 1, wire capacitance is proportional to wire length,  [26], where
  is the dielectric constant. Thus, the network capacitance is the sum of the capacitances of all wires, which is proportional to the total wire length of the network [27]:
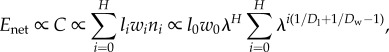 |
3.9 |
where at all levels i, li is the length of wire, wi is the number of wires per module, and ni is the number of modules. Recalling that  and
and  gives
gives
 |
3.10 |
Note that the scaling of Enet with N depends on Dl and Dw, but not on Dr. Similar to energy scaling in mammals, how Enet scales depends on whether the exponent 1/Dl + 1/Dw−1 in equation (3.10) is positive or negative. If Dw ≥ Dl/(Dl − 1) the exponent is negative and the summand converges to a constant (log(N) in the case of exact equality), leaving  When Dw < Dl/(Dl − 1),
  Given Dl = 2 for two-dimensional chips, Enet is minimized when Dw ≥ 2. See Appendix B (in the electronic supplementary material) for details.
We now calculate the scaling of Enode ignoring leakage power.4 For a single node, computation energy is given by the transistor's (dynamic) energy dissipation as CV2/2. Again assuming constant V and the capacitance of a transistor proportional to its length (l0), Enode is obtained by summing the capacitance across all N nodes giving 
We calculate Tnet as the time to transmit a bit over the last wire in the network that connects to each transistor. This assumes perfect pipelining so there is no delay in signal arriving at the last wire (electronic supplementary material, Appendix B shows that perfect pipelining requires Dr = 2). Thus, Tnet is equivalent to the wire latency that equals resistance multiplied by the capacitance of the wire (RC). For wires with aspect ratio 1,  where ρ is the resistivity of the material, and
  as above. Thus,
| 3.11 |
where  is constant, because in chips
  and both are determined by process size.
Computation time for each node, Tnode, is calculated as the transistor delay, CV/I [28], where again V is constant and C is proportional to transistor length: 
Before calculating the energy–time product, we observe that Tnet is the only term that depends on Dr, so we set Dr = 2 to minimize Tnet. Similarly, Enet is the only term that depends on Dw, and we set Dw to minimize Enet. In summary, given Dl = 2, the terms of the energy–time product are minimized when Dr = 2 and Dw ≥ 2. Although the energy–time product is minimized for values of Dw greater than 2, this would entail greater communication locality, which is challenging to engineer and doesn't improve the energy–time product. Thus, the model predicts that Dw = 2, which is consistent with observed Rent's exponents that approach 1/2 [15,29]. The scaling relations for various quantities are summarized in table 1.
(d). Predictions for microprocessors
Summarizing the results from the previous section, the energy–time product for chips is minimized when Dl = Dr = 2 = Dw. This result corresponds to ideal scaling, as suggested by Dennard [30], where the linear dimensions of transistors and wires scale at the same rate, wire delay is constant, and Rent's exponent is 1/2.
The final energy–time product scales as N1/2 (table 1), showing that, unlike mammals, as size increases, the energy-delay product per node decreases systematically. Thus, chips have become faster and they consume less energy per transistor as more transistors are packed onto a chip. Of course, this trend arises from the remarkable miniaturization of transistors and wires described by Moore's Law. It is not surprising that transistors are faster (Tnode) and require less energy (Enode) as they become smaller. It also makes sense that Enet grows sublinearly with the number of transistors, because as N increases the distance between nodes is reduced. Additionally, Dw = 2, means that most bits move locally, so the distance between nearest nodes affects the average distance that bits are transmitted. The only term in the energy–time product that does not decrease with increased N and decreased process size is Tnet, which remains constant under Dennard scaling where wire radius and length scale proportionally to each other.
These scaling models make two testable predictions. First, power consumption (P) in chips (total energy dissipated per unit of time) scales as
| 3.12 |
Second, performance, measured as computations executed per unit of time, or throughput (Tp), is predicted to scale linearly with N, i.e.
| 3.13 |
We compared our theoretical predictions for active power consumption (ignoring leakage power) with data obtained for 523 different microprocessors over a range of approximately 6 orders of magnitude in transistor count (see the electronic supplementary material, §7.3 for details of the data collection). The data are shown in figure 3, where the measured exponent was 0.495 (95% confidence interval = 0.46–0.53), which agrees closely with our prediction of 0.5. Consistent data on performance across many technology generations is difficult to obtain because reporting standards have changed over the years and their adoption by different vendors is not uniform. We obtained normalized performance data for 100 different Intel chips, measured with Dhrystone Millions of Instructions per Second (DMIPS), from a variety of sources (see the electronic supplementary material, §7.3). These sources included a variety of published third-party performance comparisons from different generations over a range of 6 orders of magnitude in transistor count. The best-fit exponent for these data is 1.11 (95% confidence interval = 1.07–1.15), as shown in figure 4. This is close to our predicted exponent of 1, suggesting that engineered designs slightly outperform the theoretical optimum defined by the model. Performance and throughput were fitted using least-squares regression, assuming that there are no significant errors in the reported count of the number of transistors [31].
Figure 3.
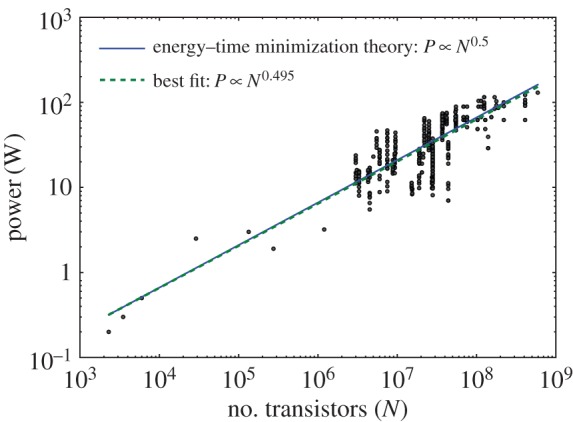
The energy–time minimization model predicts power scaling in chips. Each data point represents a microprocessor chip, with active power and number of transistors per chip from [11]. The energy–time minimization model prediction (equation (3.12)) is shown as solid line, and the best-fit line is shown as dashed line.
Figure 4.
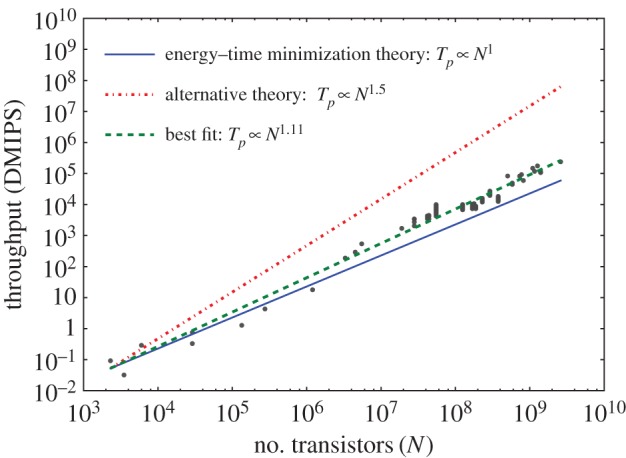
The energy–time minimization model predicts how throughput scales with the number of transistors. The raw data and their sources are included as electronic supplementary material. The model prediction (equation (3.13)) is shown as a solid line. The dotted line shows an alternative prediction if throughput were bound by the nodes (switching speed) rather than the network. The dashed line is the best fit to the data.
It is somewhat counterintuitive that performance increases only linearly with the number of transistors. Given that transistor switching times have decreased dramatically as size has decreased, one might expect performance to increase as the product of clock speed and transistor number (N). However, this is not the case, and we show the expected performance if time were actually the inverse of clock speed in the dotted line in figure 4. Some performance increases are achieved by increasing clock speed for a given manufacturing process, which may account for the higher-than-predicted scaling exponent.5 This analysis confirms that the network is indeed the bottleneck. The network delivers bits to transistors at a constant rate per transistor (equation (3.11)), so performance has increased only linearly with transistor number even though, in principle, smaller transistors could process information more quickly. As in biology, performance cannot be understood without considering the constraints of the network.
Our model provides a simple theoretical explanation for the scaling of power and performance in computers over 40 years of microprocessor technology improvements. The excellent agreement between the theoretical optimum and experimental data suggests that through successive generations of trial and error, innovation and optimization, engineered designs are highly successful, approaching and sometimes exceeding the theoretical optimum predicted by the model.
4. Discussion
(a). Summary of scaling predictions
Scaling analyses provide a framework for understanding critical parameters and constraints on the design of both biological and computational systems spanning an enormous range of sizes. We have presented a unified model which predicts scaling relationships for both mammals and microprocessors by simultaneously minimizing energy dissipation and delivery time. The energy–time minimization model highlights the similarities and differences between biological networks that deliver oxygen and computational networks that deliver information. Earlier scaling models focus either on minimizing energy dissipation or on minimizing delivery time (e.g. [5,6]). Here we extend that work by considering minimization of energy and time simultaneously, and investigating the trade-offs between them.
This theoretical model makes testable scaling predictions for biological metabolism and for the power and performance of computers. In biology, the energy–time model explains the observed curvature in metabolic scaling of mammals (figure 2). Other studies have interpreted the deviation from linear scaling as indicating that there is no single unified metabolic scaling theory, for example, as imperfect matching of supply and demand [17]. The framework presented here accounts for curvature in the optimization model by including time and energy minimization in both the network and the nodes. In computation, the unified model accurately predicts Rent's exponents, active power consumption and chip performance in over 40 years of chip design. Thus, the model provides evidence of strong convergence between natural and engineered designs due to physical constraints despite the obvious differences between them.
The model presented here is, of course, a simplification of the more complex reality. For example, our analysis assumes that Dl, Dr and Dw are fixed constants throughout the network both within and across systems. In reality, each of these may vary. For example, Newberry et al. [22] did not find evidence for a constant Dl = 3 in mouse vasculature, suggesting that the network does not deliver resources uniformly throughout the body volume. This is not surprising given that different tissues and organs have different metabolic requirements. Dr may vary within the vascular network with area-preserving branching closer to the heart and area-increasing branching slowing blood velocity in smaller vessels, but Newberry et al. [22] find values for Dr consistent with our predictions. Similarly, there is evidence that Dw varies across hierarchical levels in computer chips [32]. Including these factors in the model would allow more accurate predictions, but they are unlikely to substantively change the order-of-magnitude predictions of our simple unified model.
Our model makes novel predictions both for mammals and microprocessors. For mammals, we give the first quantitative prediction for Dr that accounts both for blood slowing through the network and for the empirically observed curvature in scaling relations that cause small and very large mammals to deviate from 3/4 scaling predictions. Additionally, this prediction (Dr = 24/11) gives an energy–time product that is approximately linear with N (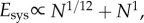 table 1). Highlighting the inherent trade-off between energy dissipation and delivery times has important implications for understanding the energetic basis of fitness. Some have proposed that biological fitness maximizes metabolic power (energy/time) [33,34], whereas others have proposed that it minimizes biological times (e.g. generation times, which is equivalent to maximizing vital rates) [35,36]. The invariance of the energy–time product on a per-node basis is consistent with the idea that organism fitness is largely independent of body mass. Mammals of all sizes, from small, fast mice to large, slow elephants, coexist and, therefore, are probably nearly equally fit. This implies a direct trade-off between maximizing metabolic power and minimizing generation times, which holds over the many orders-of-magnitude variation in body mass. The energy–time product reflects powerful geometric, physical and biological constraints on the evolution of organism designs.
In computation, the model accurately predicts power consumption and performance of computer chips as simple functions of the number of transistors. These order-of-magnitude performance predictions highlight that delivery of bits through the network, rather than processing bits at the transistors, is the rate-limiting step that constrains performance. More precise predictions may be obtained by incorporating additional factors, for example, leakage power, which comprises an increasing fraction of the power budget of computer chips [7].
(b). Implications for evolutionary transitions
The similarities between biological and computational scaling suggest future trajectories in computing based on how the fundamental structural and functional properties of organisms from bacteria to mammals have changed over evolutionary time. Work by Delong et al. [37] demonstrated that the slopes and intercepts of metabolic scaling relations change at the evolutionary transitions: prokaryote (bacteria) metabolic rate varies superlinearly with size, unicellular protist rate varies linearly, and whole-organism metabolic rate of multicellular animals scales sublinearly, converging to the canonical 3/4 exponent that approximates the mammalian scaling described above. The authors hypothesize that these discontinuous scaling shifts arise from body plans overcoming pre-existing constraints, and then accommodating to new constraints, as body size and complexity increase.
Delong et al. hypothesize the following: larger bacteria have higher metabolic rates because their larger genomes allow increased use of metabolic substrates, but eventually cell surface area limits metabolic processing. Unicellular protists overcome this constraint by internalizing the metabolic machinery into respiratory organelles (i.e. mitochondria that convert oxygen into ATP). The number of mitochondria increases linearly with cell size until intracellular transport constraints begin to limit the rate of metabolic processing. Next, multicellular animals have effectively invariant cell size and intracellular transport, but as body size and number of cells increased, vascular networks evolved to rapidly and efficiently deliver metabolites. However, vascular networks introduce the sublinear network scaling constraints characterized above.
Delong et al. highlight the importance of both time and energy constraints, and these change at each evolutionary transition, with the consequence that the absolute time and quantity of energy required to deliver each molecule of oxygen increase across the major evolutionary transitions. This suggests that the energy–time minimization framework that we have used to predict the curvature in metabolic scaling in mammals may apply across the range of living organisms, with different constraints on time and energy emerging at each evolutionary transition. The explanations that the authors hypothesize are also directly relevant to understanding of how energy–time minimization affects the ongoing evolution of computer hardware.
(i). Innovations in chip design mimic innovation in the evolution of bacteria
The chip scaling described above shows how time and energy dissipation have decreased while performance increased as larger numbers of smaller transistors have been packed onto each chip. During this era, technological innovations in chips have emerged that optimize against physical constraints. Just as bacteria have evolved larger genomes and used the new genes to exploit new metabolic niches, new materials, switching methods, etching processes and cooling technologies have pushed physical boundaries, allowing transistors to shrink and more of them to be packed onto each chip. Like bacteria, however, there are limits to this process. There are no elephant-sized bacteria, and there will be no silicon-based single-core chips with quadrillions of transistors.
(ii). Single-core chip scaling mimics unicellular protists
Historical chip scaling mimics the linear relationship between performance and size (figure 4) seen in protists. Unicellular protists show linear increases in metabolic rate with size (fig. 1 of [37]) as more energy-processing nodes (mitochondria) are packed into larger cells. As size continues to increase, however, this design strategy also reaches physical limits. Our analysis suggests that the internal transport network already constrains processing speeds (Tnet constrains Tsys). Further, the requirement to dissipate heat over a fixed surface area constrains both cells and chips.
(iii). Multi-core chips echo the transition to multicellularity
Computer chips are currently undergoing the evolutionary transition to multi-core, resembling the biological transition to multicellularity. Our unified scaling framework suggests some future scenarios. As the era of transistor minimization wanes, additional transistors will require increased physical area and, therefore, networks that span greater distances. Similar to multicellular organisms, we expect that as the number of cores grows, an increasing fraction of chip power will be devoted to these ever-larger ‘networks on chip’ (NoC) connecting more cores. Larger networks will consume more power and take more time to traverse, and ultimately the energy–time minimization will be increasingly difficult to sustain as chips increase in size. Clock speeds have already levelled off as power, footprint and cooling requirements dominate chip-design considerations [38]. If chips follow biology, we can expect that the most important future advances in chip design will increase network efficiency, for example, by using optical networks.
(iv). Computer scaling deviates from biological scaling in important ways
There are also important differences between scaling of oxygen delivery in biology and information delivery in computation, which play an important role in evolutionary transitions. In particular, on-chip computer networks have two advantages not available to cardiovascular networks. First, the shrinking of ‘process’ size (smaller transistors and wires) reduces both energy and delay in the nodes as the number of nodes increases. This reduction in process size will ultimately end as physical limits are reached [38]. Second, the locality of network traffic, characterized by Rent's exponent and Dw, reduces long-distance communication over computer networks. As shown above, this effect reduces Enet and leads to a smaller wire footprint as N increases on single-core chips. This advantage will probably continue for multi-core chips, where communication and, therefore, network bandwidth, footprint and energy consumption of NOCs can be reduced by keeping communication primarily local [39,40]. Communication locality has the potential to produce more favourable scaling in multi-core computation than is achievable in multicellular biology.
(v). Decentralized designs in the transition to sociality
We now consider how the lessons learned from computer architecture may lend insights into an important biological evolutionary transition, the transition to social-animal societies. Understanding and improving the flow of energy, materials and information through human societies is one of the greatest challenges facing science and engineering, and scaling analyses lend an important perspective on this problem [41]. Sociality is an important evolutionary transition, reflected in the ecological dominance of humans and ants, whose networked systems transport both energy and information. These social species have experienced great success, dispersing over vast territories across the globe and capturing a large fraction of available energy [42,43]. Recent evidence suggests that ant colonies and human societies follow similar scaling relationships as individual organisms [44–48].
In social-animal systems and networked computer systems, networks are at least partially decentralized, e.g. traffic flow within cities [49] and among ant nests [50]. Tainter et al. [51] argue that complex human and ant societies are able to exploit ‘low-gain’ energy systems—those that provide low concentrations of dispersed energy, but that are ubiquitous and therefore can be exploited by complex systems capable of processing and storing vast quantities of energy. Understanding the forces that have driven the tremendous power and performance scaling in computing may lend insights into how other technologies exploit similar scaling relationships [52]. In particular, communication locality in computation suggests an important strategy in the transition to sociality: animal societies can escape the constraints of the centralized distribution network by evolving systems for decentralized transportation and modular communication. Indeed, the transition to solar energy is capitalizing on the same kind of dramatic technological performance improvements that computer technology experienced as Moore's Law [53]. The history of computing suggests large gains in the efficiency of energy delivery if increasingly powerful solar cells use dispersed solar energy locally to escape the centralized distribution overhead of the fossil fuel-based economy.
Moreover, power laws as a function of size are not unique to organisms and computers but are observed across a wide variety of complex systems in nature, society and technology. The scaling of white and grey matter [54] and communication modularity [14] in the brain, of flow through river networks that minimize transportation costs [55], of energy use and GDP in countries [56], and the pace of life and population in cities [45] are all additional examples that a unifying scaling theory might explain. Because cost and performance, i.e. energy and time, impose universal constraints, we suggest that a common design principle may govern the scaling of many evolved and engineered complex systems that process energy, materials and information.
5. Conclusion
Our analysis provides a unifying explanation for the origin of scaling laws in biology and computing. Despite obvious differences in form and function, the scaling of organisms and computers is governed by the same simple principle: minimizing the energy and time to deliver and process resources. Both natural selection and human engineering have evolved designs that manage the trade-off between cost and performance to minimize energy dissipation and time to deliver resources, resulting in general scaling laws that predict metabolic rate, and microprocessor power and performance over several orders-of-magnitude variation in system size.
Engineering ingenuity and economic pressures have created increasingly fast and powerful computers through a series of innovations, including integrated circuits, innovations in materials and other technological tricks, synchronizing clock trees, multi-core chips and networked and distributed computation. Today, technology is undergoing another major evolutionary transition as distributed computing changes the metabolic landscape of technology that is becoming more tightly coupled with the environment. As computers are embedded in more physical devices, physical proximity and energy concerns for low-power devices may drive computational scaling to more closely resemble biological scaling. In computation, dramatic changes have emerged over the last 35 years, but to a surprising extent, their trajectories mimic the biological transitions that took billions of years to evolve simple unicellular bacteria into the largest and most powerful animals and societies on the Earth.
Supplementary Material
Supplementary Material
Acknowledgements
The authors would like to thank Ricard Solé, Van Savage and Doyne Farmer for insightful discussions that improved this paper, as well as the very helpful comments of anonymous reviewers.
Endnotes
Rent's rule is typically expressed as C(n) = knp, where Cn is the external communication of a module, n is the size of the module (number of nodes), k is the average external communication of a module with size 1, and p is Rent's exponent. For a hierarchy with branching factor of λ, the size of a module is given as n = λi, where i is the hierarchical level. Therefore, we can rewrite Rent's rule as ci = c0 × λip, where c0 = w0 and p = 1/Dw.
For computers, it is intuitive that these quantities can be treated independently. In biology, this is less obvious because the heart that powers the vascular network is itself composed of cells (nodes) that require oxygen delivery, an apparent circularity. However, the metabolic power of the heart (Enet) is supplied by oxygen delivered directly to the heart by the coronary artery, bypassing the rest of the vascular network. Thus, we treat Enet independently from Enode.
These expressions are consistent with those in [6], specifically when Dr = 2,  and
and 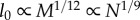 and when Dr = 3,
  and
and 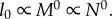
Transistors and other devices conduct a small amount of current even when they are not being used. This energy loss is referred to as ‘leakage power’ and is a significant issue in modern microprocessor design not explicitly addressed by our model.
Additionally, higher-end chips are more likely to be benchmarked, potentially leading to a bias in the data towards higher-performing chips.
Data accessibility
The datasets supporting this article have been uploaded as part of the electronic supplementary material.
Authors' contributions
All authors made substantial contributions to this paper's conception and design, acquisition and analysis of data, and drafting and revisions.
Competing interests
We have no competing interests.
Funding
We gratefully acknowledge funding from NSF 0621900 and 1413947, DARPA FA8750-15-C-0118, AFOSR FA8750-15-2-0075, the UNM PIBBs programme through NIH T32EB009414, and a James S. McDonnell Foundation Complex Systems Scholar Award.
References
- 1.Kleiber M. 1947. Body size and metabolic rate. Physiol. Rev. 27, 511. [DOI] [PubMed] [Google Scholar]
- 2.Moore G, et al. 1998. Cramming more components onto integrated circuits. Proc. IEEE 86, 82–85. ( 10.1109/JPROC.1998.658762) [DOI] [Google Scholar]
- 3.Koomey J, Berard S, Sanchez M, Wong H. 2011. Implications of historical trends in the electrical efficiency of computing. Ann. Hist. Comput. IEEE 33, 46–54. ( 10.1109/MAHC.2010.28) [DOI] [Google Scholar]
- 4.Christie P, Stroobandt D. 2000. The interpretation and application of Rent's rule. IEEE Trans. Very Large Scale Integr. (VLSI) Syst. 8, 639–648. ( 10.1109/92.902258) [DOI] [Google Scholar]
- 5.West GB, Brown JH, Enquist BJ. 1997. A general model for the origin of allometric scaling laws in biology. Science 276, 122 ( 10.1126/science.276.5309.122) [DOI] [PubMed] [Google Scholar]
- 6.Banavar JR, Moses ME, Brown JH, Damuth J, Rinaldo A, Sibly RM, Maritan A. 2010. A general basis for quarter-power scaling in animals. Proc. Natl Acad. Sci. USA 107, 15 816–15 820. ( 10.1073/pnas.1009974107) [DOI] [PMC free article] [PubMed] [Google Scholar]
- 7.Horowitz M, Alon E, Patil D, Naffziger S, Kumar R, Bernstein K. 2005. Scaling, power, and the future of CMOS. In Electron Devices Meeting, 2005. IEDM Technical Digest. Dec. 2005, pp. 7–15. Washington, DC: IEEE.
- 8.Azizi O, Mahesri A, Lee BC, Patel SJ, Horowitz M. 2010. Energy-performance tradeoffs in processor architecture and circuit design: a marginal cost analysis. In ACM SIGARCH Computer Architecture News, vol. 38, pp. 26–36. New York, NY: ACM. [Google Scholar]
- 9.Mandelbrot B. 1983. The fractal geometry of nature. New York, NY: Macmillan. [Google Scholar]
- 10.Donath WE. 1981. Wire length distribution for placements on computer logic. IBM J. Res. Dev. 25, 152–155. ( 10.1147/rd.252.0152) [DOI] [Google Scholar]
- 11.Moses ME, Forrest S, Davis AL, Lodder MA, Brown JH. 2008. Scaling theory for information networks. J. R. Soc. Interface 5, 1469 ( 10.1098/rsif.2008.0091) [DOI] [PMC free article] [PubMed] [Google Scholar]
- 12.Reda S. 2009. Using circuit structural analysis techniques for networks in systems biology. In Proc. of the 11th Int. Workshop on System level Interconnect Prediction, pp. 37–44. ACM.
- 13.Bassett DS, Greenfield DL, Meyer-Lindenberg A, Weinberger DR, Moore SW, Bullmore ET. 2010. Efficient physical embedding of topologically complex information processing networks in brains and computer circuits. PLoS Comput. Biol. 6, e1000748 ( 10.1371/journal.pcbi.1000748) [DOI] [PMC free article] [PubMed] [Google Scholar]
- 14.Meunier D, Lambiotte R, Bullmore ET. 2010. Modular and hierarchically modular organization of brain networks. Front. Neurosci. 4, 1–11. ( 10.3389/fnins.2010.00200) [DOI] [PMC free article] [PubMed] [Google Scholar]
- 15.Solée RV, Valverde S, Casals MR, Kauffman SA, Farmer D, Eldredge N. 2013. The evolutionary ecology of technological innovations. Complexity 18, 15–27. ( 10.1002/cplx.21436) [DOI] [Google Scholar]
- 16.Horowitz M, Indermaur T, Gonzalez R. 1994. Low-power digital design. In Low Power Electronics, 1994. Digest of Technical Papers., IEEE Symp., pp. 8–11. IEEE. [Google Scholar]
- 17.Banavar JR, Damuth J, Maritan A, Rinaldo A. 2002. Supply–demand balance and metabolic scaling. Proc. Natl Acad. Sci. USA 99, 10 506–10 509. ( 10.1073/pnas.162216899) [DOI] [PMC free article] [PubMed] [Google Scholar]
- 18.West GB, Woodruff WH, Brown JH. 2002. Allometric scaling of metabolic rate from molecules and mitochondria to cells and mammals. Proc. Natl Acad. Sci. USA 99(Suppl 1), 2473–2478. ( 10.1073/pnas.012579799) [DOI] [PMC free article] [PubMed] [Google Scholar]
- 19.Thompson DW. 1942. On Growth and Form. Cambridge, UK: Cambridge University Press. [Google Scholar]
- 20.Banavar JR, Maritan A, Rinaldo A. 1999. Size and form in efficient transportation networks. Nature 399, 130–132. ( 10.1038/20144) [DOI] [PubMed] [Google Scholar]
- 21.Dodds PS. 2010. Optimal form of branching supply and collection networks. Phys. Rev. Lett. 104, 048 702 ( 10.1103/PhysRevLett.104.048702) [DOI] [PubMed] [Google Scholar]
- 22.Newberry MG, Ennis DB, Savage VM. 2015. Testing foundations of biological scaling theory using automated measurements of vascular networks. PLoS Comput. Biol. 11, e1004455 ( 10.1371/journal.pcbi.1004455) [DOI] [PMC free article] [PubMed] [Google Scholar]
- 23.Kolokotrones T, Savage V, Deeds EJ, Fontana W. 2010. Curvature in metabolic scaling. Nature 464, 753–756. ( 10.1038/nature08920) [DOI] [PubMed] [Google Scholar]
- 24.Ning TH. 2007. A perspective on the theory of MOSFET scaling and its impact. IEEE Solid State Circuits Newsletter 12, 27–30. ( 10.1109/N-SSC.2007.4785538) [DOI] [Google Scholar]
- 25.Bingham B, Greenstreet M. 2008. Computation with energy-time trade-offs: Models, algorithms and lower-bounds. In Parallel and Distributed Processing with Applications. ISPA'08. Int. Symp. on, pp. 143–152. IEEE.
- 26.Wilhelm N. 1995. Why wire delays will no longer scale for VLSI chips. Mountain View, CA: Sun Microsystems Laboratories. [Google Scholar]
- 27.Donath W. 1979. Placement and average interconnection lengths of computer logic. Circuits Syst. IEEE Trans. 26, 272–277. ( 10.1109/TCS.1979.1084635) [DOI] [Google Scholar]
- 28.Bakoglu H. 1990. Circuits, interconnections, and packaging for VLSI. [Google Scholar]
- 29.Yang X, Bozorgzadeh E, Sarrafzadeh M. 2001. Wirelength estimation based on rent exponents of partitioning and placement. In Proc. of the 2001 Int. Workshop on System-level Interconnect Prediction, pp. 25–31. ACM.
- 30.Dennard RH, Gaensslen FH, Rideout VL, Bassous E, LeBlanc AR. 1974. Design of ion-implanted MOSFETs with very small physical dimensions. Solid-State Circuits IEEE J. 9, 256–268. ( 10.1109/JSSC.1974.1050511) [DOI] [Google Scholar]
- 31.McArdle BH. 1988. The structural relationship: regression in biology. Can. J. Zool. 66, 2329–2339. ( 10.1139/z88-348) [DOI] [Google Scholar]
- 32.Ozaktas HM. 2004. Information flow and interconnections in computing: extensions and applications of Rent's rule. J. Parallel Distrib. Comput. 64, 1360–1370. ( 10.1016/j.jpdc.2004.07.006) [DOI] [Google Scholar]
- 33.Lotka A. 1956. Elements of mathematical biology. New York, NY: Dover Publications. [Google Scholar]
- 34.Odum H, et al. 1971. Environment, power and society. New York, NY: Wiley-Interscience. [Google Scholar]
- 35.Lindstedt SL, Calder WA III. 1981. Body size, physiological time, and longevity of homeothermic animals. Q. Rev. Biol. 56, 1–16. ( 10.1086/412080) [DOI] [Google Scholar]
- 36.Sibly RM. 1991. The life-history approach to physiological ecology. Funct. Ecol. 5, 184–191. ( 10.2307/2389256) [DOI] [Google Scholar]
- 37.DeLong JP, Okie JG, Moses ME, Sibly RM, Brown JH. 2010. Shifts in metabolic scaling, production, and efficiency across major evolutionary transitions of life. Proc. Natl Acad. Sci. USA 107, 12 941–12 945. ( 10.1073/pnas.1007783107) [DOI] [PMC free article] [PubMed] [Google Scholar]
- 38.Waldrop MM. 2016. The chips are down for Moore's law. Nat. News 530, 144 ( 10.1038/530144a) [DOI] [PubMed] [Google Scholar]
- 39.Bezerra GB, Forrest S, Forrest M, Davis A, Zarkesh-Ha P. 2010. Modeling NOC traffic locality and energy consumption with rent's communication probability distribution. In Proc. of the 12th ACM/IEEE Int. Workshop on System level Interconnect Prediction, pp. 3–8. ACM.
- 40.Zarkesh-Ha P, Bezerra GB, Forrest S, Moses M. 2010. Hybrid network on chip (HNOC): local buses with a global mesh architecture. In Proc. of the 12th ACM/IEEE Int. Workshop on System level Interconnect Prediction, pp. 9–14. ACM.
- 41.Moses ME, Forrest S, Kodric-Brown A.. 2012. Beyond biology. Metab. Ecol. A Scaling Approach 0, 293 ( 10.1002/9781119968535.ch24) [DOI] [Google Scholar]
- 42.Haberl H, Erb KH, Krausmann F, Gaube V, Bondeau A, Plutzar C, Gingrich S, Lucht W, Fischer-Kowalski M. 2007. Quantifying and mapping the human appropriation of net primary production in earth's terrestrial ecosystems. Proc. Natl Acad. Sci. USA 104, 12 942–12 947. ( 10.1073/pnas.0704243104) [DOI] [PMC free article] [PubMed] [Google Scholar]
- 43.Hölldobler B, Wilson EO. 1990. The ants. Cambridge, MA: Harvard University Press. [Google Scholar]
- 44.Moses ME, Brown JH. 2003. Allometry of human fertility and energy use. Ecol. Lett. 6, 295–300. ( 10.1046/j.1461-0248.2003.00446.x) [DOI] [Google Scholar]
- 45.Bettencourt LMA, Lobo J, Helbing D, Kuhnert C, West GB. 2007. Growth, innovation, scaling, and the pace of life in cities. Proc. Natl Acad. Sci. USA 104, 7301–7306. ( 10.1073/pnas.0610172104) [DOI] [PMC free article] [PubMed] [Google Scholar]
- 46.Burnside WR, Brown JH, Burger O, Hamilton MJ, Moses ME, Bettencourt LMA. 2012. Human macroecology: linking pattern and process in big-picture human ecology. Biol. Rev. 87, 194–208. ( 10.1111/j.1469-185X.2011.00192.x) [DOI] [PubMed] [Google Scholar]
- 47.Hou C, Kaspari M, Vander Zanden HB, Gillooly JF. 2010. Energetic basis of colonial living in social insects. Proc. Natl Acad. Sci. USA 107, 3634–3638. ( 10.1073/pnas.0908071107) [DOI] [PMC free article] [PubMed] [Google Scholar]
- 48.Waters JS, Holbrook CT, Fewell JH, Harrison JF. 2010. Allometric scaling of metabolism, growth, and activity in whole colonies of the seed-harvester ant Pogonomyrmex californicus. Am. Nat. 176, 501–510. ( 10.1086/656266) [DOI] [PubMed] [Google Scholar]
- 49.Samaniego H, Moses ME. 2008. Cities as organisms: allometric scaling of urban road networks. J. Transp. Land use 1, 21–39. ( 10.5198/jtlu.v1i1.29) [DOI] [Google Scholar]
- 50.Flanagan TP, Pinter-Wollman NM, Moses ME, Gordon DM. 2013. Fast and flexible: Argentine ants recruit from nearby trails. PLoS ONE 8, e70888 ( 10.1371/journal.pone.0070888) [DOI] [PMC free article] [PubMed] [Google Scholar]
- 51.Tainter JA, Allen T, Little A, Hoekstra TW. 2003. Resource transitions and energy gain: contexts of organization. Conserv. Ecol. 7, 4. [Google Scholar]
- 52.Buchanan M. 2016. Generalizing Moore. Nat. Phys. 12, 200 ( 10.1038/nphys3685) [DOI] [Google Scholar]
- 53.Farmer JD, Lafond F. 2016. How predictable is technological progress? Res. Policy 45, 647–665. ( 10.1016/j.respol.2015.11.001) [DOI] [Google Scholar]
- 54.Zhang K, Sejnowski TJ. 2000. A universal scaling law between gray matter and white matter of cerebral cortex. Proc. Natl Acad. Sci. USA 97, 5621 ( 10.1073/pnas.090504197) [DOI] [PMC free article] [PubMed] [Google Scholar]
- 55.Banavar JR, Colaiori F, Flammini A, Maritan A, Rinaldo A. 2000. Topology of the fittest transportation network. Phys. Rev. Lett. 84, 4745–5626. ( 10.1103/PhysRevLett.84.4745) [DOI] [PubMed] [Google Scholar]
- 56.Brown J, et al. 2011. Energetic limits to economic growth. BioScience 61, 19–26. ( 10.1525/bio.2011.61.1.7) [DOI] [Google Scholar]
Associated Data
This section collects any data citations, data availability statements, or supplementary materials included in this article.
Supplementary Materials
Data Availability Statement
The datasets supporting this article have been uploaded as part of the electronic supplementary material.