Abstract
l-Glutamine (l-Gln) instability in liquid media is a well-known fact. Also, negative effect of ammonia, one of the l-Gln degradation products, on viability of many cell cultures and on replication of different viruses has been described. However, negative effects of ammonia have been reported in doses excessively exceeding those that could be generated in regularly used liquid culture media due to spontaneous l-Gln breakdown (below 2 mM). Traditional virus vaccine production processes have been established and registered involving l-Gln containing media use. Eventual culture media replacement in the regular production process belongs to the major regulative changes that require substantial financial expenses. The aim of this study was to evaluate the effect of storage of Minimum Essential Media with Hanks salts on their relevant biological functions during virus vaccine production process in relation to l-Gln decrease. Our results show a cell type dependent effect of spontaneous l-Gln degradation during medium storage. They also suggest that for cell cultures used in measles, mumps, and rubella virus production the media retain their functionality in respect to cell viability or virus growth over a certain time window despite l-Gln degradation.
Keywords: Minimum Essential Medium (MEM), l-Glutamine, Cell viability, Apoptosis, Necrosis, Measles, Mumps, Rubella
Introduction
The ability of cell culture systems to produce large quantities of viral particles has served as the basis for the production of both human and veterinary live or inactivated vaccines. Regardless of the cell cultivation method, the cell line must be grown in a nutrient medium that is usually a solution of either synthetic (serum-free) nutrient components or a complex mixture of animal-derived proteins or serum. In the final part of the human viral vaccine production process final virus bulks are prepared using clarified virus pools with addition of diluent, if needed for the adjustment of virus concentration. Beside other components, diluent contains chemically defined synthetic medium that must not contain animal-derived components and antibiotics. This medium is primary used for cell culture layer maintenance, for removal of serum and antibiotics from cultures and for harvest of virus during the replication in infected cell culture. The type of product needed will determine the medium optimization strategy.
Media formulations currently used for cell culture development, growth and maintenance generally comprise amino acids, salts, vitamins, other substances, and inorganic buffer substances. Amino acid l-glutamine (l-Gln) is an essential constituent of nutrient media (although not an essential amino acid), being a particularly important energy source and a precursor in nucleic acid metabolism (Pasieka and Morgan 1959). l-Gln is the source of nascent ammonia, either through its spontaneous degradation or l-Gln metabolism. The ammonia toxicity is well known and was systematically reviewed by Schneider et al. (1996). The negative effect of ammonia on cell viability (dependent on the cell line), on the virus growth (depending on the type of both cells and virus) and protein glycosylation has been demonstrated and reviewed (Schneider et al. 1996). However, observed negative effects of ammonia were noted in doses higher than could be generated in most culture media (above 2 mM) and in experiments where ammonia was added externally to the media. It is very important to have in mind that the physiological consequences of adding ammonia extracellularly to the medium are very different to those resulting from ammonia produced intracellularly [discussed by Schneider et al. (1996)].
The producers of liquid culture media are aware of the instability of l-Gln, and have studied and provided data on l-Gln decomposition over time, depending on the storage temperature, which is the principal determinator of the l-Gln decomposition rate (as noted by established medium manufacturers like Sigma and Lonza). Because l-Gln is so labile, it is often omitted from commercial liquid medium preparations to lengthen the product shelf life. In these cases, it must be aseptically added prior to the use. l-Gln is not so labile in dry form and most powdered medium formulations do include it (https://www.atcc.org/~/media/PDFs/Culture%20Guides/AnimCellCulture_Guide.pdf). However, sole knowledge on l-Gln concentration drop during the storage period has not been sufficient to determine how long such media can be stored and used without affecting respective part of the production process.
The aim of this investigation was to examine the biological influence of storage period under controlled conditions for two culture media, Minimum Essential Medium with Hank’s salts (MEM-H(0)) and MEM-H supplemented with neomycin (N) and 10 % foetal bovine serum (FBS) (MEM-H(N)-FBS), on their respective dedicated applications, in relationship to the l-Gln concentration. In the case of MEM-H(0), its ability to support cell layer maintenance and sustained virus production was monitored. In the case of MEM-H(N)-FBS, its influence on the viability and growth of several cell lines used in the production and/or quality control of human viral vaccines was monitored. l-Gln changes were measured over time by in-house developed and for this purpose validated chromatographic methods involving amino acid derivatization and l-Gln quantification using internal standard method.
Materials and methods
Chemicals
d-Glutamic acid was from Fluka (Buchs, Switzerland). l-glutamine, 2-mercaptoethanol, 3-(4,5-dimethylthiazolyl-2)-2,5-diphenyltetrazolium bromide (MTT) and o-phthaldialdehyde were from Sigma (St. Louis, MO, USA). Methanol was from Merck (Darmstadt, Germany). All other chemicals were from Kemika (Zagreb, Croatia). Ultrapure water was obtained daily by Simplicity purification system Millipore (Billerica, MA, USA).
Culture media
Minimum Essential Medium with Hank’s salts (MEM-H(0)), from Applichem (Darmstadt, Germany), was prepared according to the manufacturer’s instructions, filter sterilized, filled into polypropylene containers till the top, and stored in the dark at 2–8 °C. MEM-H(N) was prepared in the same way, only MEM-H(0) was supplemented with 50 μg mL−1 neomycin sulphate with specific activity of 1000 μg mg−1 (N) (Gibco, Grand Island, NY, USA), before filter sterilization.
MEM-H(N) with 10 % foetal bovine serum (MEM-H(N)-FBS) or 5 % FBS (MEM-H(N) + 5 % FBS) was prepared in the same way as MEM-H(N), only 10 or 5 % FBS (Gibco, Mulgrave, VIC, Australia), respectively, was added (v/v), before the filter sterilization step.
Cells
The chicken embryo fibroblasts (CEF) were prepared using 11-day old chick embryos derived from SPF eggs (Charles River, Hungary). The embryo’s head, viscera and limbs were first removed. The remaining tissue was homogenized, washed with MEM-H(N), trypsinized and the trypsin neutralized with MEM-H(N)-FBS. The cells were then centrifuged, resuspended in fresh MEM-H(N)-FBS, filtered and counted.
MRC-5 cells (human lung fibroblasts), Vero cells (African green monkey kidney cells) and Wi-38 cells (human lung cells), obtained from the European Collection of Animal Cell Culture (ECACC, Salisbury, UK) were grown in MEM-H(N)-FBS. RK13 cells (rabbit kidney cells) were also obtained from ECACC and maintained in RPMI 1640 (Gibco) supplemented with 10 % FBS and 50 μg mL−1 neomycin sulphate with specific activity 1000 μg mg−1.
Cell growth promotion assay
The stability of MEM-H(N)-FBS was evaluated through its ability to promote the growth of the MRC-5, Vero and WI-38 cells. Medium was tested during a 12-month period at test points 3, 6, 9 and 12 months. At each test point cells, stored in liquid nitrogen, were thawed, one portion of each cell type was cultured in stored MEM-H(N)-FBS (stored) and the other portion was cultured in freshly prepared MEM-H(N)-FBS (fresh). After a few subcultivations, cells were seeded in 25 cm2 T-flasks, overlaid with respective medium and incubated for 10 days at 37 °C. During this 10-day period, cells from three flasks containing each medium (stored or fresh) were trypsinized and counted each day, and the average cell count from three flasks was reported as a result.
Assessment of the influence of culture medium age on virus growth
Experimental design
For the assessment of virus growth we used experimental seeds of mumps virus (MuV) L-Zagreb strain, measles virus (MV) Edmonston-Zagreb strain and rubella virus (RV) RA 27/3 vaccine strain all derived from respective working seed lots (Institute of Immunology Inc, Zagreb, Croatia). Schematic presentation of the protocol for virus production (in 75 cm2 T-flasks) is given in Fig. 1. Infection was performed either by adding cells and virus simultaneously into the flasks (infection in suspension) after which cells adhere during incubation or by infecting a cell monolayer. The harvests were centrifuged at 1361×g, the virus infectivity in the supernatant was stabilized by the addition of a stabilizer and then stored at −60 °C or below until samples were taken for titer determination.
Fig. 1.
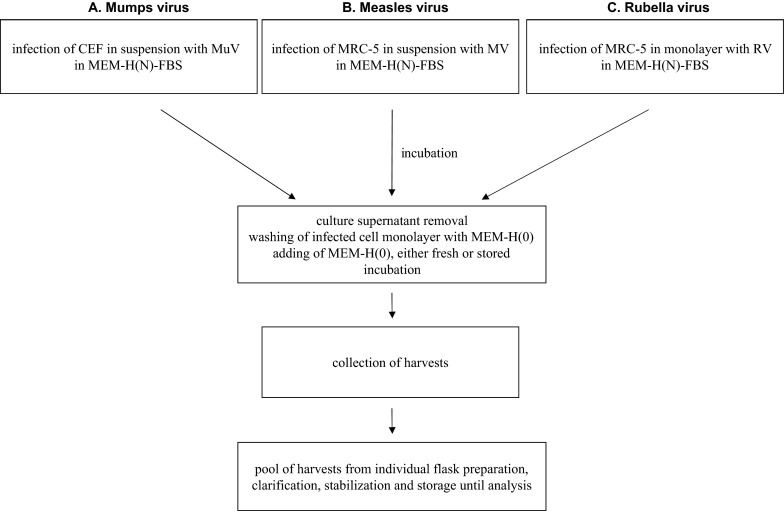
Experimental procedure for investigation of MEM-H(0) stability. Influence of medium age on replication of mumps (A), measles (B) and rubella (C) viruses was investigated in the virus harvests prepared by the described protocol. Influence of medium age on the quality of cell cultures was investigated by the analysis of cells from the cultures that were subjected to the same procedure, only without infection (mock-infected); these were named harvest equivalents
Virus titrations
Measles virus (MV) was titrated in microplates on Vero cells as described (WHO 1997). Briefly, serial dilutions of virus suspension were added to a 96-well plate containing fully confluent Vero cells grown at a cell density of 1 × 10⁵ cells mL−1. After 10 days of incubation at 37 °C and 5 % CO2, the plate was examined under a microscope to enumerate the number of wells exhibiting cytopathic effect (CPE).
Mumps virus (MuV) was titrated in microplates on Vero cells as described by Forcic et al. (2010).
Rubella virus (RV) was titrated in microplates on RK 13 cells as described (Forcic et al. 2011; Kutle et al. 2010).
Assessment of the influence of culture medium age on the cell proliferation and viability
MTT assay
Measurement of the cell viability and proliferation was done using the MTT assay. CEF and MRC-5 cells were cultivated in 96-well plates in MEM-H(N) containing FBS. Incubation duration, serum removal by washing with MEM-H(0) and subsequent MEM-H(0) exchange followed strictly the protocol of the virus production scheme in Fig. 1. At time points corresponding to respective virus harvests, a portion of cells (named harvest equivalent) was analyzed by MTT assay. MTT was added at a concentration of 0.5 mg mL−1 and incubated at 37 °C for 4 h. The medium was removed and replaced with the equal volume of DMSO (Sigma). Absorbance was measured at 540 nm with the reference wavelength 690 nm. All experiments were performed in quadruplicate.
Flow-cytometric determination of apoptotic and necrotic cells in cultures
For the assessment of the culture medium age influence on the portion of apoptotic or necrotic cells in the cell cultures, MRC-5 and CEF were cultivated in 6-well plates in MEM-H(N) containing FBS. Incubation duration, serum removal by washing with MEM-H(0) and subsequent MEM-H(0) exchange followed strictly the protocol of the virus production scheme in Fig. 1. At time points corresponding to respective virus harvests, a portion of cells were harvested by applying 0.5 mL warmed trypsin/EDTA solution (Institute of Immunology, Inc., Croatia) for 5 min. Detached cells were suspended with 6 mL of warm MEM-H(N)-FBS and transferred to 15 mL polypropylene tubes, placed on ice. Cells were centrifuged at 400×g for 5 min, washed two times with 6 mL of PBS without Ca2+ and Mg2+ and suspended in binding buffer (0.1 M HEPES/NaOH, pH 7.4, 1.4 M NaCl, 25 mM CaCl2); the volume was adjusted to obtain 0.5 × 10⁶ cells mL−1. Equal volumes (100 μL) of cell suspension were transferred to polystyrene FACS tubes. Annexin V Alexa Fluor 488 (2.5 μL) and 7-AAD (0.2 μg) solutions (both from Life Technology Corp., Carlsbad, CA, USA) were added to each tube. Upon 15 min of incubation on ice, additional 200 μL of binding buffer was added to each tube and cells were acquired on BD LSR II flow cytometer, collecting 10,000 events in an appropriate FSC/SSC region. Cell doublets were excluded from analysis by applying data onto FSC-A/FSC-H plot. All experiments were performed in triplicate.
l-Gln quantification in culture media
Quantification of l-Gln was performed by pre-column derivatization with fluorescent o-phthaldialdehyde (OPA) using reverse-phase chromatography. Chromatography was performed on a chromatographic system consisting of a Waters 600 System Controller, Waters 600 pump, Waters In-Line Degasser, 717 plus Autosampler, 2475 fluorescent detector and computer equipped with Empower software (Milford, MA, USA). Two variants of l-Gln quantification were used named A and B. Variant A was based on calculating the percentage of l-Gln area in total peak area from all amino acids. Decrease in l-Gln peak percentage was used to calculate l-Gln amount with presumption that the starting amount of l-Gln in the medium was 2 mM and that all other amino acids do not decay (method was validated). Quantification of l-Gln by external standard method was also tested but the method was not valid under the given conditions. On the other hand internal standard method was also used for quantification of l-Gln and the method was validated (variant B). d-Glu was used as an internal standard. Each sample (unknowns and standards) was prepared by mixing 50 µL of sample (l-Gln or unknown) with 50 µL of internal standard (d-Glu) and filled up with water to 2.5 mL. Calibration solution was prepared by adding 50 µL of l-Gln (2 mM) and 50 µL d-Glu (2 mM) and filled up to 2.5 mL with water (two separate solutions from separate weighs were prepared for each analysis). Fluorescent reagent OPA (75.21 mg) was prepared a day before use by dissolving in ethanol (1.393 mL), then 12.541 mL of 0.4 M borate buffer (pH 9.5) was added and after that 2-mercaptoethanol (55.3 µL). Reagent was left overnight at room temperature. Samples were loaded onto a LiChrosorb RP18 column (250 × 4 mm (5 µm), Merck, Darmstadt, Germany) using autosampler. Autosampler was programmed to take 100 µL of the sample, inject into a 500 µL of reagent, mix and inject 20 µL of this solution to the column. Mobile phase consisted of 50 mM phosphate buffer (pH 6.85) and methanol, and gradient was programmed as shown in Fig. 2. Fluorescence was detected using λex = 340 nm, λem = 455 nm. All buffers and samples were filtered through 0.45 µm before analysis.
Fig. 2.
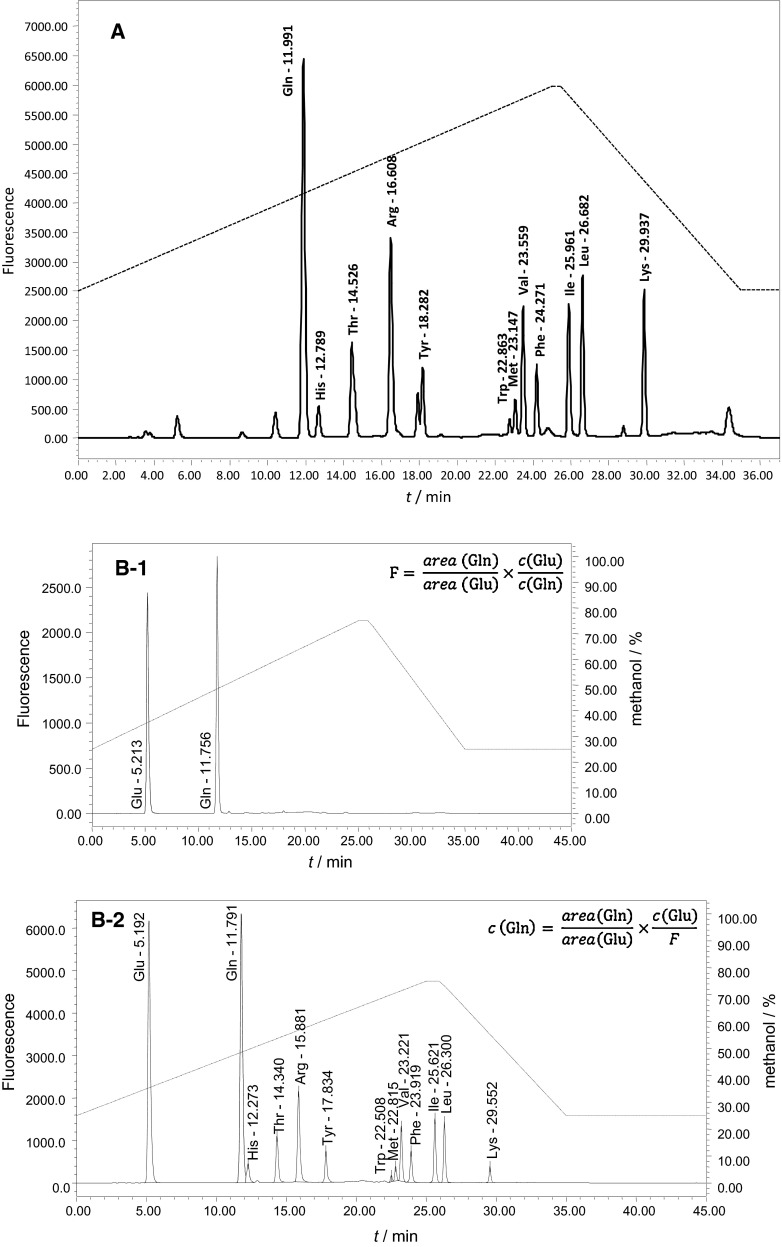
Typical chromatograms of MEM-H(N)-FBS (A), and MEM-H(0) (B-2) that were used for l-Gln quantification. Each amino acid peak was identified by spiking the medium with the pure respective amino acid. B-1 represents chromatogram of calibration solution consisting of l-Gln (Gln in the chromatogram) and internal standard d-Glu (Glu in the chromatogram) necessary for calculation of response factor (F)
Statistical analysis
The statistical significance of biological effects of culture medium age was determined by comparing the respective pair of results, obtained for cells in fresh and stored medium, using Student’s t test. Results are reported using the p value, mean, and standard deviations (SD) of the mean. Differences of p < 0.05 were considered significant.
In the cell growth promotion assay, the log phase of the cell growth curves from stored and fresh medium was determined from the plotted cell count results and these results were compared for statistically significant difference by Mann–Whitney U test (Statistica 6.0). F-statistics was used for estimation of l-Gln quantification method linearity (Araujo 2009).
Results
l-Gln determination
The in-house method for l-Gln quantification in culture media has been established and shown to be suitable for determination of l-Gln concentration changes in MEM-H(0) and MEM-H(N)-FBS. Chromatograms of both media contain 12 well resolved amino acid peaks (Fig. 2), only cystine was not detected due to very low signal for cystine. Two quantification principles were used, named as variant A and variant B of the method. In variant A l-Gln quantification in MEM-H(N)-FBS was based on the calculation of the percentage of l-Gln peak area in the total area of all amino acid peaks. This approach does not measure the absolute quantity of l-Gln in the medium, but measures precisely its drop. The results were converted to concentration units; however, the presumption was that starting concentration was exactly 2 mM. In variant B of the method l-Gln quantification in MEM-H(0) was improved by introduction of internal standard (d-glutamic acid), and resulting method was able to determine the absolute concentration. Both quantification methods were precise, accurate and linear in the required range, and thus suitable for determination of l-Gln concentration changes in the investigated media (Table 1).
Table 1.
Validation properties of chromatographic method for l-Gln determination in culture media MEM-H(0) and MEM-H(N)-FCS
| Validation parameter | Acceptance criterium | Variant A | Variant B |
|---|---|---|---|
| Precision | |||
| Instrument | RSD < 5 % | 0.18–1.70 % | 1.75 % |
| Intra-assay | RSD < 5 % | 0.36–0.66 % | 1.55–2.39 % |
| Inter-assay | RSD < 5 % | 0.39–0.84 % | 0.64 % |
| Accuracy | 100 ± 5 % | 100.0–102.3 % | 97.8–104.5 % |
| Linearity | Fischer ratio < Fcrit | 0.6256 < 2.7587 | 2.0493 < 3.2296 |
| Range | 0.5–2.5 mmol L−1 | 0.5-8.0 mmol L−1 | 0.2–3.2 mmol L−1 |
Variant A involves quantification based on changes in l-Gln peak area portion in the total amino acid peak area. Variant B involves internal standard principle of quantification
RSD relative standard deviation
Changes of l-Gln concentration during the storage of MEM-H(N)-FBS and the influence of the medium age on its biological function
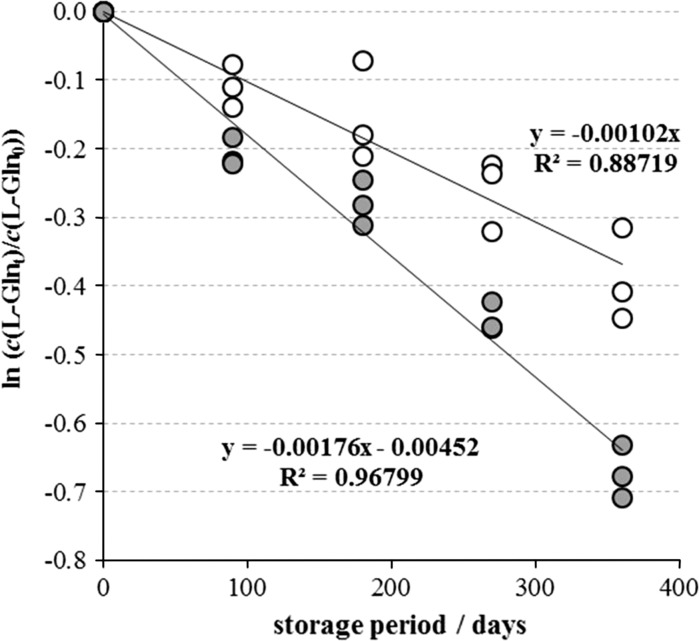
Three batches of MEM-H(N)-FBS were analyzed at the moment of preparation (zero point) and after 3, 6, 9 and 12 months of storage under standard conditions: in polypropylene tanks filled to the top, in the dark, at 2–8 °C. l-Gln decomposition (Fig. 3, open circles) followed the first order kinetics , giving the value of the first order rate constant k = 0.00102 day−1, or 0.10 % l-Gln decomposition per day. In parallel, we quantified l-Gln decomposition in the same medium, only the storage conditions were not strict. Namely, one aliquot of each of the three MEM-H(N)-FBS batches was tested at the point zero, the remaining medium was closed and stored, and then reopened at each of the four testing points. l-Gln decomposition was more rapid, with the first order rate constant k = 0.00176 day−1 or 0.18 % day−1 (Fig. 3, grey circles).
Fig. 3.
l-Gln concentration decrease in three batches of MEM-H(N)-FBS during the storage of 1 year at 2–8 °C. Each point represents individual ln (c(l-Glnt)/c(l-Gln0)) value. The l-Gln decomposition followed first order kinetics, whose rate constant was calculated from the slope of the line describing relationship between ln (c(l-Glnt)/c(l-Gln0)) values and storage period in days. Unopened, originally filled and stored samples are denoted with empty circles, while samples reopened several times before analysis are denoted with grey circles
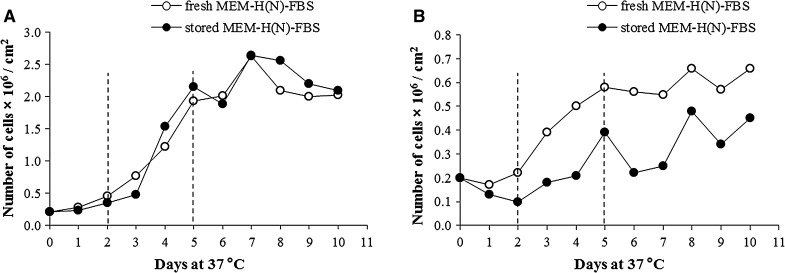
The storage period of MEM-H(N)-FBS and the l-Gln concentration drop had different effects on the cell growth promotion of the tested cell lines (Fig. 4). Vero cells remained unaffected by the changes in the medium composition during the whole tested period of 12 months (Table 2). MRC-5 cells were more sensitive to the change of the medium composition during storage, there was no statistically significant difference between fresh and 6-month old medium (Table 2), but 9 and 12-month old medium negatively affected the cell growth. WI-38 cells were the most sensitive, and their growth was unaffected only by using fresh medium (Table 2).
Fig. 4.
Representative examples of cell growth promotion results. A The growth of Vero cells was unaffected by the 9-month long storage of MEM-H(N)-FBS. B The growth of WI-38 cells was influenced by the 3-month long storage of MEM-H(N)-FBS. Dashed lines denote the log phase of the cell growth curves
Table 2.
The effect of the MEM-H(N)-FBS medium age on the cell growth
| Test points (months) | Batch | Cell culture | ||
|---|---|---|---|---|
| p (significant if <0.05) | ||||
| Vero | MRC-5 | WI-38 | ||
| 3 | 1 | 0.81732 | 0.30963 | 0.00039 |
| 2 | 0.68604 | 0.23323 | 0.75704 | |
| 3 | 0.86237 | 0.01517* | 0.00127 | |
| 6 | 1 | 0.95395 | 0.23299 | n.t. |
| 2 | 0.68611 | 0.19996 | n.t. | |
| 3 | 0.97696 | 0.30988 | n.t. | |
| 9 | 1 | 0.70739 | 0.00708 | n.t. |
| 2 | 0.40230 | 0.45291 | n.t. | |
| 3 | 0.56353 | 0.69110 | n.t. | |
| 12 | 1 | 0.14892 | n.t. | n.t. |
| 2 | 0.81721 | 0.12228 | n.t. | |
| 3 | 0.88521 | n.t. | n.t. | |
Growth curves (log phase) of the cells cultivated in the aged media were compared to the ones cultivated in the fresh batch to assess whether the cell culture capability to grow was affected
Significant values (<0.05) are given in bold
n.t. not tested
* Statistically significant, but in favor of the aged medium
Changes of l-Gln concentration during the storage of MEM-H(0) and the influence of the medium age on its biological function
The l-Gln degradation in MEM-H(0)
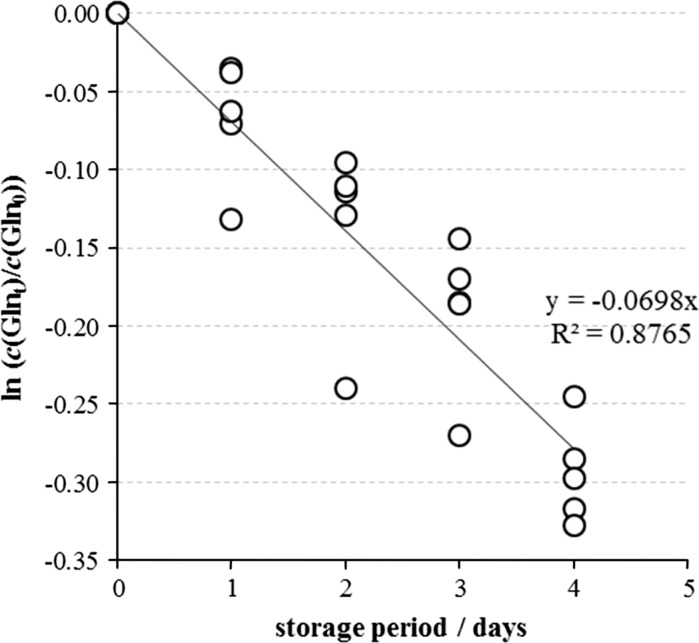
The l-Gln degradation in MEM-H(0) was monitored in the accelerated stability study. Aliquots of five medium batches were kept at 37 °C and l-Gln concentration was determined after 1, 2, 3 and 4 days of incubation. l-Gln concentration drop followed first order kinetics, giving the value of the first order rate constant k = 0.0698 day−1, or 7 % l-Gln decomposition per day (Fig. 5).
Fig. 5.
l-Gln concentration decrease in five individual samples of the MEM-H(0) incubated at 37 °C. Each point represents individual ln (c(l-Glnt)/c(l-Gln0)) value. The l-Gln decomposition followed first order kinetics, whose rate constant was calculated from the slope of the line describing relationship between ln (c(l-Glnt)/c(l-Gln0)) values and incubation period in days
Additionally, the changes of three MEM-H(0) batches were also investigated after 3, 6 and 9-month period of storage under optimal standard conditions: in polypropylene tanks filled to the top, in the dark, at 2–8 °C. Measured l-Gln concentration decrease in MEM-H(0) followed first order kinetics, with k = 0.00102 day−1, or 0.1 % l-Gln decomposition per day (data not shown).
Evaluation of the influence of MEM-H(0) age on biological properties of cells and viruses
To explore the potential effect of observed l-Gln decomposition on biological properties of MEM-H(0), the following aspects of cell culture were estimated: metabolic activity of a cell culture (determined by MTT test), level of cell culture apoptosis (determined by flow cytometry) and the ability of cells to produce virus (determined by measurement of virus titre in the cell culture supernatant). For this purpose MRC-5 cells were chosen for the assessment of MV and RV growth and CEF cells for the measurement of MuV growth. MEM-H(0) was either prepared fresh at each testing point (fresh) or kept for 3, 6 and 9 months under optimal standard conditions until testing as described above (stored). All above-mentioned aspects of cell culture were evaluated for 3 and 9-month old medium, while only protocol for MuV production on CEF was used to test 6-month old medium. Three-and six-month stored medium had no influence on any of the measured parameters: RV, MuV and MV growth as well as viability and well-being of the cultivated MRC-5 and CEF cells were equal irrespective whether fresh or stored media were used (data not shown).
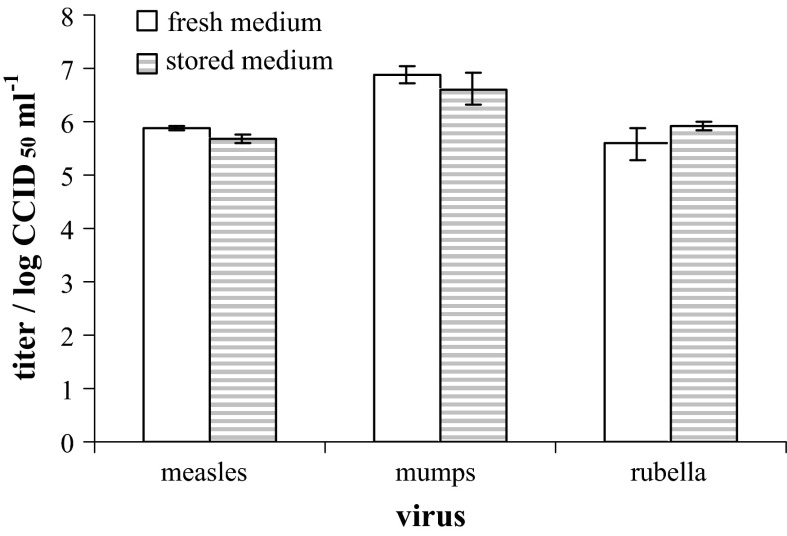
Nine-month storage of MEM-H(0) (Fig. 6) still had no significant impact on the ability of cell cultures to produce and release viruses in culture supernatant. MuV titers in harvests collected from CEF incubated in 9-month old medium were equal to the ones collected from the same culture incubated in fresh medium (Fig. 6). Likewise, no differences in the virus titers were detected in RV and MV harvests from the MRC-5 cell cultures (Fig. 6).
Fig. 6.
The influence of MEM-H(0) age on the ability of cell cultures to produce viruses evaluated by comparison of mumps virus titers (harvested from CEF) as well as measles and rubella virus titers harvested from MRC-5 maintained either in fresh (empty columns) or 9-month old (stored) (dashed columns) medium. Mean ± standard deviation from analyzed duplicates is given
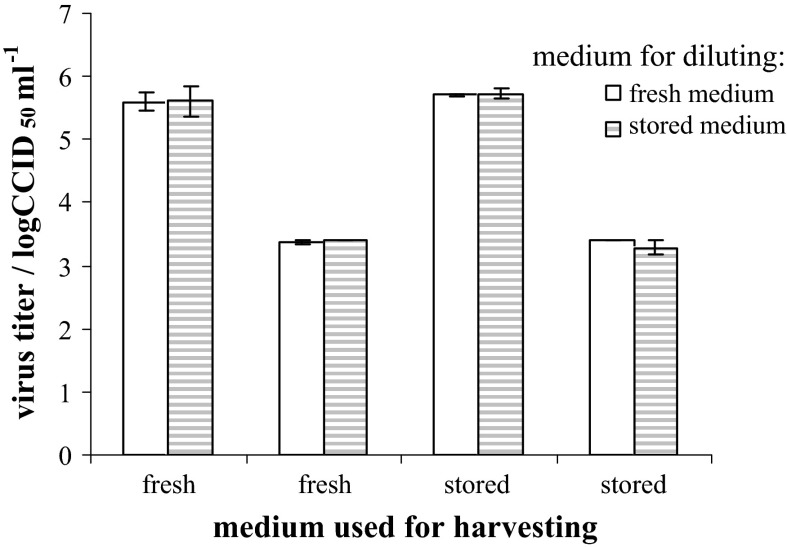
Furthermore, the influence of medium age on the virus infectivity itself was evaluated. Virus harvests (prepared according to the scheme in Fig. 1), were diluted 1:2 or 1:300 with either fresh or 9 months stored medium before the titration. There was no difference between estimated virus titers for all three viruses: measles (Fig. 7), mumps and rubella (data not shown), irrespective of the media used for diluting.
Fig. 7.
The influence of MEM-H(0) age on the measles virus stability. Virus harvests prepared according to the scheme in Fig. 1 either in fresh or in 9-month old (stored) medium, as indicated on x-axis, were diluted prior titration 1:2 (higher pair of columns) or 1:300 (lower pair of columns) either in fresh (empty columns) or in 9-month old medium (dashed columns). Mean ± standard deviation from analyzed duplicates is given
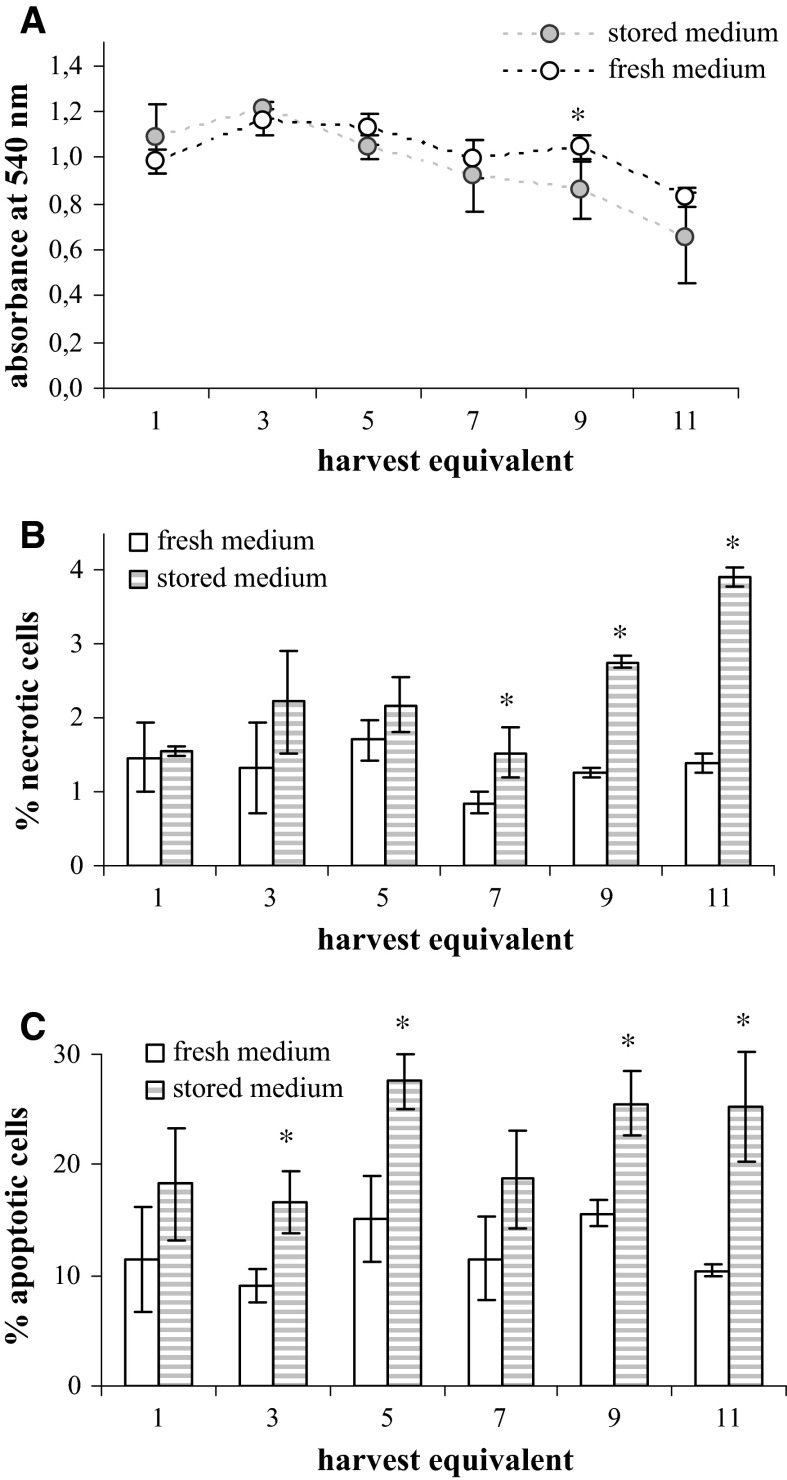
The influence of the medium age on the biology and condition of cell substrate itself was evaluated by measuring the viability (via measuring their metabolic activity in MTT assay) and the percentage of apoptotic and necrotic cells in the cultures of non-infected cells, as described in chapters “Assessment of the influence of culture medium age on the virus growth” and “Assessment of the influence of culture medium age on the cell proliferation and viability”. There was no influence of 3 or 6-month stored media on any of the measured parameters, so only data from experiments with 9-month stored media are given (Figs. 8, 9, 10).
Fig. 8.
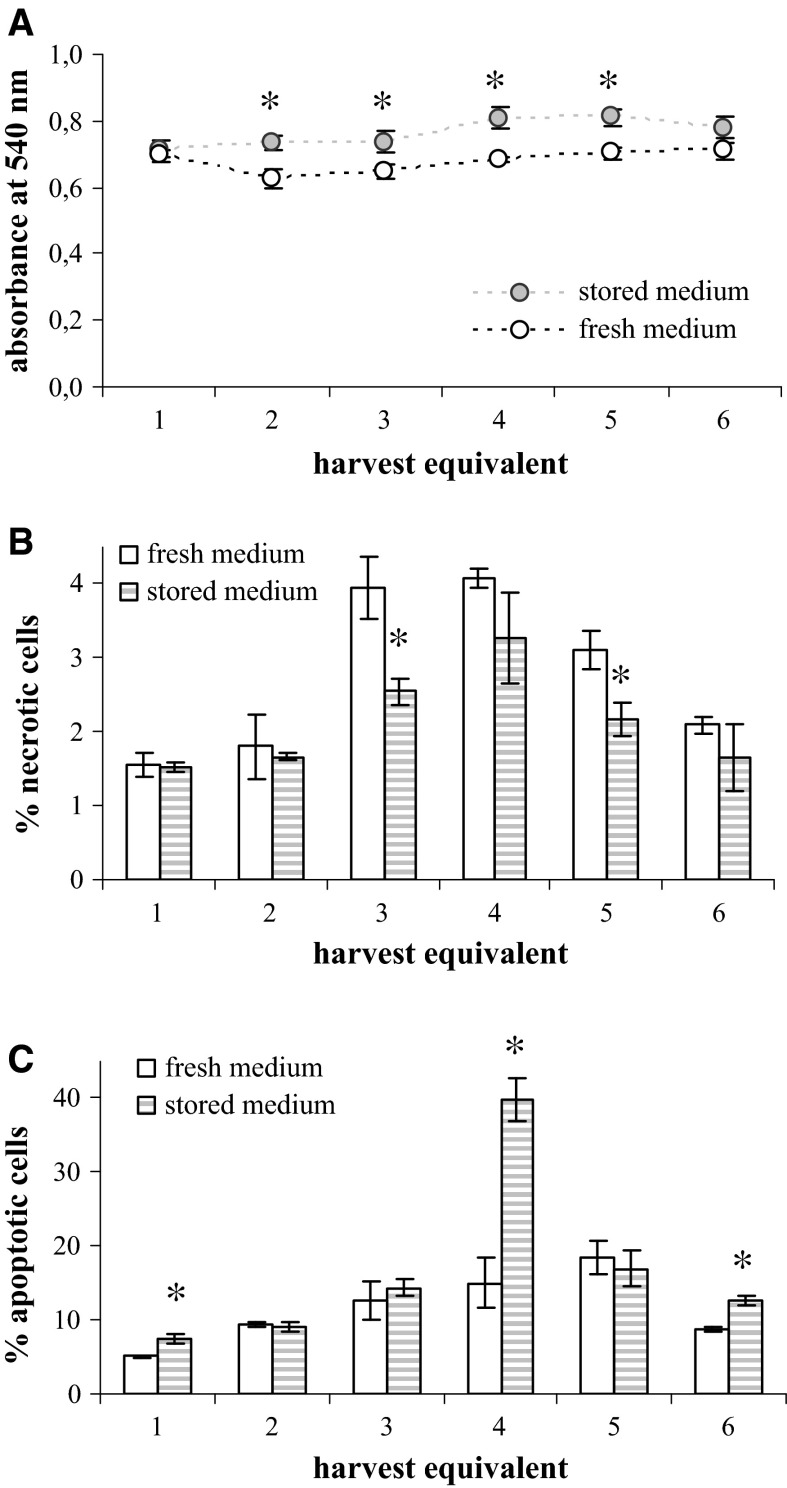
The influence of the MEM-H(0) age on the viability of CEF. Cell cultures were incubated in either fresh (empty columns) or 9-month old (stored) (dashed columns) medium according to the mumps virus harvesting regime and analysed by MTT assay (A), and by flow cytometric determination of necrotic (B) and apoptotic (C) cells percentage. Standard deviations are shown (n = 4 in A; n = 3 in B and C), asterisk indicates the statistically significant differences between the two media (t statistic: p < 0.05)
Fig. 9.
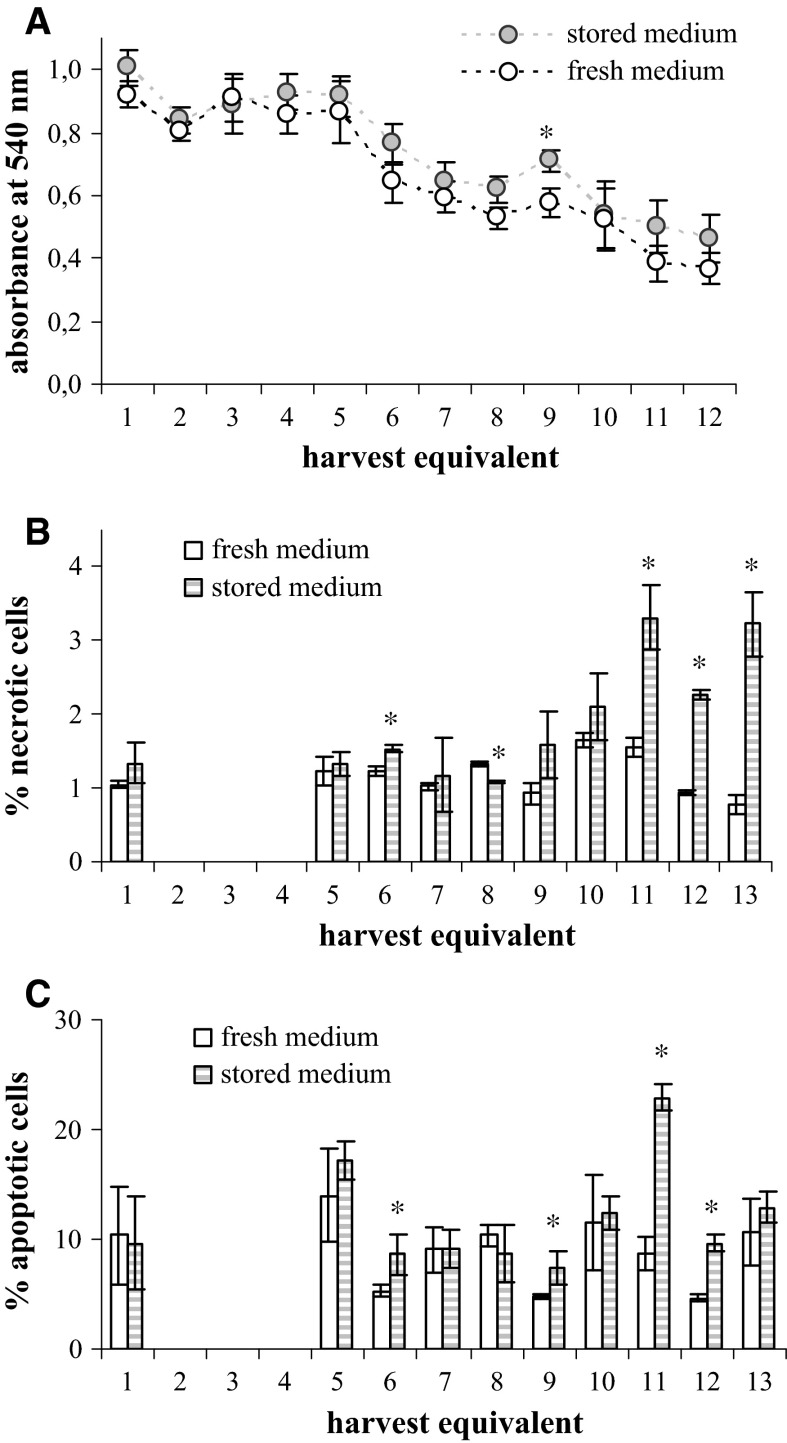
The influence of the MEM-H(0) age on the viability of MRC-5 cells incubated according to the measles virus harvesting regime. Cell cultures were incubated in either fresh (empty columns) or 9-month old (stored) (dashed columns) medium and analysed by MTT assay (A), and by flow cytometric determination of necrotic (B) and apoptotic (C) cells percentage. Standard deviations are shown (n = 4 in A; n = 3 in B and C), asterisk indicates the statistically significant differences between the two media (t statistic: p < 0.05)
Fig. 10.
The influence of the MEM-H(0) age on the viability of MRC-5 cells incubated according to the rubella virus harvesting regime. Cell cultures were incubated in either fresh (empty columns) or 9-month old (stored) (dashed columns) medium and analysed by MTT assay (A), and by flow cytometric determination of necrotic (B) and apoptotic (C) cells percentage. Standard deviations are shown (n = 4 in A; n = 3 in B and C), asterisk indicates the statistically significant differences between the two media (t statistic: p < 0.05)
The viability of CEF was measured in six harvest equivalents and in each, cells incubated in the 9-month old medium had higher viability then cells incubated in freshly prepared medium (Fig. 8A). Interestingly, the viability of CEF was constant in all six harvest equivalents. Similarly, the viability of MRC-5 cells incubated in the regime of MV cultivation which was measured for 12 harvest equivalents was constant in first five harvest equivalents, while from the sixth on it steadily dropped (Fig. 9A). However, there was no difference between harvest equivalents incubated in 9-month old and fresh medium. The viability of MRC-5 cells incubated in regime of RV harvesting was similar irrespective of whether incubation was done in freshly prepared or 9-month old medium (Fig. 10A) and in both the viability significantly dropped down in the final harvest equivalents (Fig. 10A).
There was no clear trend in the portion of necrotic or apoptotic cells in CEF cultures that would be influenced by the use of 9-month old medium in comparison to the fresh one (Fig. 8B, C). Considering MRC-5 cells, significant influence of the medium age was noticed at the end of experimental protocol in the late harvest equivalent (Figs. 9B, C, 10B, C). The usage of 9-month old medium significantly increased the percentage of both apoptotic and necrotic cells in the final harvest equivalents in the case of cultures incubated in the MV and RV regime.
Discussion
The negative influence of ammonia on cell viability and virus growth has been the subject of numerous studies in the 70s and 80s of the twentieth century (nicely reviewed by Schneider et al. 1996). It also affects protein glycosylation and secretion processes (Yang and Butler 2000, 2002). l-Gln has been recognized as the principal source of nascent ammonia. l-Gln is labile in solutions (including culture media) and degrades spontaneously through cyclization generating pyroglutamic acid and ammonia as by-product (Tritsch and Moore 1962; Heeneman et al. 1993; Arii et al. 1999). Additionally, metabolic degradation of l-Gln also generates ammonia, as well as glutamate, alanine and aspartate. Only ammonia among listed degradation products has been shown to be toxic to the cells. Pyrrolidone-carboxylic acid at higher concentration than would be expected to be found in most media as a result of this decomposition was shown not to be toxic to cells in culture (Tritsch and Moore 1962). There are many reports on reduction of cell growth by ammonia in concentrations as low as 2–3 mM (reviewed by Schneider et al. 1996; Hassell et al. 1991). However, the degree of ammonia toxicity depends on the cell line and culture conditions. All data documenting ammonia toxicity stem from studies where different amounts of ammonia were added to the media. However, it has been discussed that the physiological consequences of adding ammonia extracellularly to the medium are very different to those resulting from ammonia produced intracellularly (Martinelle and Haggstrom 1993).
All available publications on toxicity of ammonia report its negative effect in doses above 1–2 mM (cell viability) and above 10 mM (virus growth) with significant differences from study to study regarding the cell type or virus strain (Schneider et al. 1996).
Having in mind that cultivation media used in the process of human MV, RV and MuV vaccine production contain 2 mM l-Gln, we were wondering whether spontaneous degradation of l-Gln during the storage of liquid media, i.e. lack of Gln/generated much lower quantities of ammonia than those shown to be toxic, affects either cell viability and well-being, or virus growth.
In our work we have proven, by usage of validated methods for the measurement of l-Gln concentration changes, that the l-Gln degradation kinetics follow first order rate kinetics. The first order rate constant k was used as a measure of the l-Gln degradation. At 4 °C, we determined that l-Gln spontaneously degraded with the rate of 0.10 % day−1 in both MEM-H(0) and MEM-H(N)-FBS. The obtained results are of similar order of magnitude as the data obtained by others: 0.28 % day−1 (Heeneman et al. 1993), 0.1 % day−1 (producer Lonza Walkersville, Inc. (USA) http://www.bio.lonza.com/uploads/tx_mwaxmarketingmaterial/Lonza_BenchGuides_Lglutamine_200mM.pdf) and 0.15 % day−1l-Gln decomposition in intravenous solutions (Khan and Elia 1991). The presence of FBS had no effect on l-Gln decomposition rate. Here it was clearly demonstrated that improper storage under uncontrolled conditions could significantly increase l-Gln decomposition. At 37 °C l-Gln decomposition was faster, however, not that fast as described in the literature. We measured decomposition rate of 7 % day−1, in comparison to 10 % day−1 determined by Tritsch and Moore (1962) and Heeneman et al. (1993), and by culture media producing company SAFC Bioscience (http://www.sigmaaldrich.com/content/dam/sigma-aldrich/docs/Sigma/Product_Information_Sheet/t074.pdf) or to 15 % day−1 as reported by company Life Technologies (http://www.lifetechnologies.com/content/dam/LifeTech/migration/en/images/ics-organized/applications/cell-culture/pdf.par.28095.file.dat/co16981-glutamax-product-brochure-final-lowres.pdf).
There are three possible explanations for the observed differences. Firstly, all previously published data were from experiments that lasted maximally 1 month, while we performed 1 year studies here. Secondly, we took a great concern on the storage conditions; the containers were filled up to the top, and stored in the dark. The proper storage contributed to l-Gln stability, since storage under less controlled conditions resulted in faster l-Gln decomposition (Fig. 3). Thirdly, the l-Gln concentration was measured here by validated methods. In short, l-Gln spontaneous decomposition was more or less of expected rate.
The effect of MEM-H(N)-FBS age on its functionality was evaluated by monitoring its influence on the viability of cell cultures. Taking into account that the l-Gln degradation is equimolar to ammonia generation (Tritsch and Moore 1962) and that here detected degradation kinetics of l-Gln was 0.10 % day−1 at +4 °C we could calculate that stored media contained 0.18, 0.36, 0.54 or 0.72 mM ammonia, after 3, 6, 9 or 12 months, respectively. Also, stored media contained equimolarly lowered l-Gln concentration. Further on, based on the same evidence and the results on l-Gln degradation rate of 7 % at 37 °C, we could estimate that maximal extracellular ammonia generation during cell cultivation period of 5 days could be additional 0.7 mM (exponential growth of the cells was finished till the day 5). Taking into account the quantity of ammonia spontaneously generated during storage of media, and maximal possible ammonia generation during 5 days cultivation period, we could estimate that Wi-38 cells are sensitive to ammonia concentration below 0.9 mM, MRC-5 cells to concentrations above 1.4 mM, while Vero cells viability was not effected even in 12 months stored medium (ammonia concentrations above 1.4 mM). The results corroborate well known fact that sensitivity to ammonia is dependent on the cell type, and proved high resistivity of Vero cells to ammonia (Hassell et al. 1991). Inhibition of reovirus growth in mouse L-cells (Canning and Fields 1983), pancreatic necrosis virus in CHSE cells (Farias et al. 1988), and Herpes simplex virus in Vero cells (Koyama and Uchida 1989) by ammonia added to culture media has been described. All these effects were observed when ammonia concentrations were above 10 mM, much higher than those routinely found in mammalian cell cultures. Accordingly, in our work investigated culture conditions with nascent ammonia concentration not higher than maximal 2 mM did not inhibit either MV, MuV or RV growth.
The influence of MEM-H(0) age on the quality of cell substrate, used for virus production, was monitored via following parameters: cell viability, and apoptotic or necrotic cell percentage changes. Literature data suggested that the percentage of necrotic cells increases when increased ammonia concentrations are reached, while sole nutrient deprivation leads to increase in apoptotic cells. Again, data stem from experiments performed with ammonia concentration significantly above 2 mM (Mercille and Massie 1994; Singh et al. 1994). In this study, we found a substantial drop in cell viability after longer cultivation (Figs. 9A, 10A) whereas no change in viability has been seen during shorter cultivation (Fig. 8A). Importantly, there was no difference in the viability of MRC-5 cells cultured in fresh or stored medium while CEF cells cultured in stored medium had even higher viability than those cultured in fresh medium.
The sole effect of the 9-month old medium was observed in the increased percentage of both apoptotic and necrotic cells, in the final harvest equivalents of MRC-5 cultures. The mixed phenotype of dying cells could be attributed to the simultaneous nutrient deprivation, and nascent ammonia concentration increase.
In conclusion, l-Gln spontaneous degradation in MEM, appropriately stored under controlled conditions, has the rate of 0.10 % day−1. Such changes in MEM-H(0) during 3 or 6-month storage did not affect physiological properties of CEF and MRC-5 cultures relevant for the MV, MuV and RV production. When using 9-month old medium, effects of spontaneous l-Gln degradation on biological condition of cells become evident although these changes are not reflected on the titre of virus produced from these cultures. Data presented here demonstrate that, although l-Gln decomposition is the process with its known dynamics, MEM media retain their full functionality over a certain window of time which should be determined for a specific cell substrate and cultivation protocol in order to ensure its safe usage.
Acknowledgments
The authors wish to thank Mrs. Tamara Božić, MSc, and the Virus Vaccine Quality Control Unit as well as Mrs. Vesna Feletar, MS, and Mrs. Marija Živković, MS, from the Virus Vaccine Production Preparation Unit of the Institute of Immunology Inc., for their participation and collaboration in certain parts of this study. Also, we are grateful to Mr. Nediljko Pavlović, MSc, for his help in data analysis. The work was financed by the Institute of Immunology, Inc.
References
- Araujo P. Key aspects of analytical method validation and linearity evaluation. J Chromatogr B. 2009;877:2224–2234. doi: 10.1016/j.jchromb.2008.09.030. [DOI] [PubMed] [Google Scholar]
- Arii K, Kobayashi H, Kai T, Kokuba Y. Degradation kinetics of l-glutamine in aqueous solution. Eur J Pharm Sci. 1999;9:75–78. doi: 10.1016/S0928-0987(99)00047-0. [DOI] [PubMed] [Google Scholar]
- Canning WM, Fields BN. Ammonium chloride prevents lytic growth of reovirus and helps to establish persistent infection in mouse L-cells. Science. 1983;219:187–196. doi: 10.1126/science.6297010. [DOI] [PubMed] [Google Scholar]
- Farias G, Navarrete E, Kiss J, Kuznar J. Effect of ammonium chloride on the multiplication of infectious necrosis virus. Arch Virol. 1988;98:155–162. doi: 10.1007/BF01322165. [DOI] [PubMed] [Google Scholar]
- Forcic D, Kosutic-Gulija T, Santak M, Jug R, Ivancic-Jelecki J, Markusic M, Mazuran R. Comparisons of mumps virus potency estimates obtained by 50 % cell culture infective dose assay and plaque assay. Vaccine. 2010;28:1887–1892. doi: 10.1016/j.vaccine.2009.11.049. [DOI] [PubMed] [Google Scholar]
- Forcic D, Brgles M, Ivancic-Jelecki J, Santak M, Halassy B, Barut M, Jug R, Markusic M, Štrancar A. Concentration and purification of rubella virus using monolithic chromatographic support. J Chromatogr B. 2011;879:981–986. doi: 10.1016/j.jchromb.2011.03.012. [DOI] [PubMed] [Google Scholar]
- Hassell T, Gleave S, Butler M. Growth inhibition in cell culture. Appl Biochem Biotechnol. 1991;30:30–41. doi: 10.1007/BF02922022. [DOI] [PubMed] [Google Scholar]
- Heeneman S, Deuts NEP, Buurman WA. The concentrations of glutamine and ammonia in commercially available cell culture media. J Immunol Methods. 1993;166:85–91. doi: 10.1016/0022-1759(93)90331-Z. [DOI] [PubMed] [Google Scholar]
- Khan K, Elia M. Factors affecting the stability of l-glutamine in solution. Clin Nutr. 1991;10:186–192. doi: 10.1016/0261-5614(91)90037-D. [DOI] [PubMed] [Google Scholar]
- Koyama AH, Uchida T. The effect of ammonium chloride on the multiplication on Herpes simplex virus type 1 in Vero cells. Virus Res. 1989;13:271–282. doi: 10.1016/0168-1702(89)90073-7. [DOI] [PubMed] [Google Scholar]
- Kutle L, Pavlović N, Dorotić M, Zadro I, Kapustić M, Halassy B. Robustness testing of live attenuated rubella vaccine potency assay using fractional factorial design of experiments. Vaccine. 2010;28:5497–5502. doi: 10.1016/j.vaccine.2010.04.111. [DOI] [PubMed] [Google Scholar]
- Martinelle K, Haggstrom L. Mechanisms of ammonia and ammonium ion toxicity in animal cells: transport across cell membranes. J Biotechnol. 1993;30:339–350. doi: 10.1016/0168-1656(93)90148-G. [DOI] [PubMed] [Google Scholar]
- Mercille S, Massie B. Induction of apoptosis in nutrient-deprived cultures of hybridoma and myeloma cells. Biotechnol Bioeng. 1994;44:1140–1154. doi: 10.1002/bit.260440916. [DOI] [PubMed] [Google Scholar]
- Pasieka A, Morgan J. Glutamine metabolism of normal and malignant cells cultivated in synthetic media. Nature. 1959;183:1201–1202. doi: 10.1038/1831201a0. [DOI] [PubMed] [Google Scholar]
- Schneider M, Marison IW, von Stockar U. The importance of ammonia in mammalian cell culture. J Biotechnol. 1996;46:161–185. doi: 10.1016/0168-1656(95)00196-4. [DOI] [PubMed] [Google Scholar]
- Singh RP, Al-Rubeai M, Gregory CD, Emery AN. Cell death in bioreactors: a role for apoptosis. Biotechnol Bioeng. 1994;44:720–726. doi: 10.1002/bit.260440608. [DOI] [PubMed] [Google Scholar]
- Tritsch GL, Moore GE. Spontaneous decomposition of glutamine in cell culture media. Exp Cell Res. 1962;28:360–364. doi: 10.1016/0014-4827(62)90290-2. [DOI] [PubMed] [Google Scholar]
- World Health Organization . Manual of laboratory methods. Document WHO/VSQ/97.04. Geneva: World Health Organization; 1997. Live measles virus vaccine; pp. 79–81. [Google Scholar]
- Yang M, Butler M. Effects of ammonia on the glycosylation of human recombinant erythropoietin in culture. Biotechnol Prog. 2000;16:751–759. doi: 10.1021/bp000090b. [DOI] [PubMed] [Google Scholar]
- Yang M, Butler M. Effects of ammonia and glucosamine on the heterogeneity of erythropoietin glycoforms. Biotechnol Prog. 2002;18:129–138. doi: 10.1021/bp0101334. [DOI] [PubMed] [Google Scholar]


