Significance
The search for high-efficiency thermoelectric materials encompasses many classes of semiconductors. Zintl phases are attractive thermoelectric materials for thermoelectric applications. Here, we report the high thermoelectric performance of the rarely studied bismuth (Bi)-based Zintl phases (Eu0.5Yb0.5)1−xCaxMg2Bi2 with the record figure-of-merit ZT as high as 1.3 at 873 K. This ZT value is, to our knowledge, the highest ever reported in CaAl2Si2-based structures, especially compared with the best antimony (Sb)-based YbZn0.4Cd1.6Sb2 compound. Because Sb-based Zintl compounds have been studied for many decades, this Bi-based Zintl phase with high thermoelectric properties could be a good thermoelectric material candidate in the future.
Keywords: thermoelectric properties, Bi-based Zintl phases, band engineering, strain-field fluctuation
Abstract
Complex Zintl phases, especially antimony (Sb)-based YbZn0.4Cd1.6Sb2 with figure-of-merit (ZT) of ∼1.2 at 700 K, are good candidates as thermoelectric materials because of their intrinsic “electron–crystal, phonon–glass” nature. Here, we report the rarely studied p-type bismuth (Bi)-based Zintl phases (Ca,Yb,Eu)Mg2Bi2 with a record thermoelectric performance. Phase-pure EuMg2Bi2 is successfully prepared with suppressed bipolar effect to reach ZT ∼ 1. Further partial substitution of Eu by Ca and Yb enhanced ZT to ∼1.3 for Eu0.2Yb0.2Ca0.6Mg2Bi2 at 873 K. Density-functional theory (DFT) simulation indicates the alloying has no effect on the valence band, but does affect the conduction band. Such band engineering results in good p-type thermoelectric properties with high carrier mobility. Using transmission electron microscopy, various types of strains are observed and are believed to be due to atomic mass and size fluctuations. Point defects, strain, dislocations, and nanostructures jointly contribute to phonon scattering, confirmed by the semiclassical theoretical calculations based on a modified Debye–Callaway model of lattice thermal conductivity. This work indicates Bi-based (Ca,Yb,Eu)Mg2Bi2 is better than the Sb-based Zintl phases.
Thermoelectric (TE) power generation, a type of solid-state technology that converts heat into electricity, is currently used in subsea and spacecraft (1), and is foreseen to play an important role in the power industry and automobiles (2–5). Widespread applications are currently limited as a result of the low efficiency of TE materials (6). TE efficiency depends on the Carnot term as well as the TE figure-of-merit, ZT, defined as ZT = (S2σ/κ)T, where S, σ, κ, and T are the Seebeck coefficient, electrical conductivity, thermal conductivity, and absolute temperature, respectively. S2σ is known as the power factor (PF) (7). Even though PF can be enhanced by electronic structure engineering, and κ can be reduced by an increase in phonon scattering, it is very difficult to independently increase PF and simultaneously decrease κ because they are oppositely related to carrier concentration and effective mass.
As an alternative to evaluating the maximum ZT, a dimensionless material parameter B at particular temperature has proven to be useful (8–10).
| [1] |
where m*, m0, μ, κLat, and T are the carrier effective mass, free electron mass, carrier mobility, lattice thermal conductivity, and absolute temperature, respectively. Therefore, heavy effective mass, high carrier mobility, and low lattice thermal conductivity are highly desirable for good TE performance. Practically, some strategies and concepts have been proposed to achieve this goal, e.g., band convergence and resonant states for heavier effective mass (11–13), band alignment and weak electron–phonon and alloy scattering to achieve high carrier mobility (14–16), and alloying or nanostructuring to enhance phonon scattering (17–19).
The complex Zintl phases, especially Sb-based Zintl compounds, have been demonstrated to be promising TE materials for middle- to high-temperature applications. Remarkable achievements have been reported with maximal ZT around or more than 1, e.g., β-Zn4Sb3 (20, 21), Yb14Mn1−xAlxSb11 (22, 23), and AyMo3Sb7-xTex (24). In particular, Zintl phases AB2Sb2 (A = Ca, Yb, Eu, Sr; B = Zn, Mn, Cd, Mg) (25–29) crystallizing in CaAl2Si2 structure have been extensively studied with the highest ZT for YbZn0.4Cd1.6Sb2 ∼ 1.2 at 700 K. The A sites of these materials have been shown to contain exclusively divalent ions, which are limited to alkaline-earth-based and rare-earth-based elements like Eu and Yb, whereas B is a d0, d5, d10 transition metal or a main-group element like Mg2+ (30, 31). Despite the extensive research on Zintl antimonides, analogous Bi-based Zintl materials have received little attention, even given the competitive TE performance of this system. For the CaAl2Si2-type Zintl phases, the crystal structures of both alkaline-earth-based and rare-earth-based AMg2Bi2 (A = Mg, Ca, Sr, Ba, Yb, Eu, Sm) have been reported (32–34). However, the reported ZT is ∼0.4 in YbMg2Bi2 and ∼0.1 in CaMg2Bi2 and EuMg2Bi2 via melting, grinding, and annealing, not good enough for practical applications. In our previous study, a significantly enhanced ZT value ∼1 was obtained for the optimized samples of Ca1−xYbxMg2Biy by ball milling and hot pressing, 150% higher than the reported samples by melting and solidification method (35). The enhanced ZT is mainly due to the nanostructures achieved by ball milling and hot pressing as well as the alloying mechanism. In Zintl compounds, alloying (substitution or doping) has been frequently used to introduce mass/strain fluctuation to scatter phonons, as in Yb1−xCaxZn2Sb2 (25) and Yb14Al1−xMnxSb11 (23) to achieve higher TE performance.
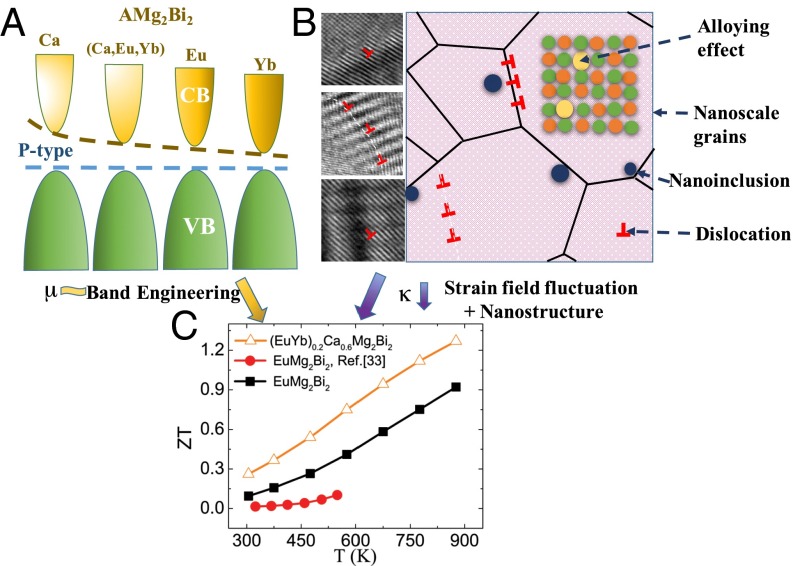
May et al. recently reported on EuMg2Bi2, which exhibits a resistivity similar to that of CaMg2Bi2. Such a high resistivity is not reasonable when considering the appearance of the 4d and 4f electrons in Eu (33). Inspired by our previous investigation on analogous Bi-based Zintl AMg2Bi2 (A = Ca, Yb) phases, disordered (Ca,Yb,Eu)Mg2Bi2 Zintl phases have been studied in this work. It has been demonstrated that the base sample EuMg2Bi2 has the lowest resistivity and achieves much higher ZT value ∼1. Compared with the reported EuMg2Bi2 with ZT < 0.1, this improvement is significant and mainly attributed to the pure phase and nanostructures achieved by the ball-milling and hot-pressing method. Further, due to the weakly affected carrier mobility by band engineering and multi–strain-field fluctuation by alloy effects on A site (Ca, Yb, and Eu), a significantly enhanced TE figure-of-merit, ZT ∼ 1.3 is achieved (Fig. 1). This ZT value is, to our knowledge, the highest ever reported in a CaAl2Si2-based structure, especially compared with the most popular Sb-based Zintl compounds. With simulation for the optimized Eu0.2Yb0.2Ca0.6Mg2Bi2 alloys, we confirm chemical disorder has no effect on valence band, but does affect the conduction band, resulting in good p-type TE properties. The current work illuminates the Bi-based Zintl phases as promising TE materials.
Fig. 1.
Enhanced ZT via optimized electrical and thermal properties. (A) Schematic illustrating the nearly unaffected valence band for different A-site elements, contributing to weakly affected carrier mobility for p-type TE materials. (B) Schematic describing the various scattering effects, especially strain-field fluctuation and nanostructure, leading to decreased thermal conductivity. The microscopy images at left represent different strains in the three types of interactions. (C) ZT values of EuMg2Bi2 and optimized Eu0.2Yb0.2Ca0.6Mg2Bi2 alloys. The reported ZT of EuMg2Bi2 (33) is plotted for comparison.
Materials and Methods
Synthesis.
A series of samples EuMg2Bi2, Eu0.5Yb0.5Mg2Bi2, Eu0.5Ca0.5Mg2Bi2, and (Eu0.5Yb0.5)1−xCaxMg2Bi2 (x = 0.4, 0.5, 0.6, and 0.7) was prepared by ball milling followed by hot pressing. Starting with calcium (Ca, Sigma-Aldrich, 99.9%, pieces), ytterbium (Yb, Sigma-Aldrich, 99.9%, cubes), europium (Eu, Atlantic, 99.9%, cubes), magnesium (Mg, Sigma-Aldrich, 99.9%, pieces), and bismuth (Bi, Sigma-Aldrich, 99.999%, chunks), the elements were weighed and then loaded in a stainless steel jar with stainless steel balls for mechanical alloying by a high-energy ball mill (SPEX 8000D) for 12 h. The final nanopowder was then loaded into a graphite die with an inner diameter of 12.7 mm, and consolidated by ac hot pressing at ∼933 K for 2 min.
Characterization.
A PANalytical multipurpose diffractometer with an X’celerator detector (PANalytical X’Pert Pro) was used to characterize the phases. Morphology and elemental ratios were characterized by scanning electron microscopy (LEO 1525) and electron probe microanalysis (JXA-8600), respectively. Transmission electron microscopy (TEM, JEOL 2100F) was used to analyze the detailed microstructures. A Nicolet iS50 FTIR spectrometer with a Spectra-Tech model 500 series variable-angle specular-reflectance accessory was used to measure the band gap.
Measurements.
The electrical resistivity (ρ) and Seebeck coefficient (S) were simultaneously measured on a commercial system (ZEM-3, ULVAC) using the four-point dc switching method and the static temperature difference method. The thermal conductivity was obtained by measuring the thermal diffusivity (D) on a laser flash apparatus (LFA 457, NETZSCH), specific heat (CP) on a differential scanning calorimeter (404 C, NETZSCH), and volumetric density (ρD) by the Archimedes method. The total thermal conductivity (κ) was calculated by κ = DρDCp. The carrier concentration (n) was obtained by Hall effect measurement (Van der Pauw method) at room temperature using a modified sample puck in a physical properties measurement system (PPMS D060, Quantum Design) under a magnetic field of 3 T. The Hall mobility (μ) was estimated by 1/ρ = neμ with electrical resistivity ρ from a ZEM-3 instrument. It is understood that there is a 3% error in the electrical resistivity, 5% in the Seebeck coefficient, and 5% in the thermal conductivity, resulting in an error of around 14% for ZT. For better readability of the figures, we have deliberately plotted the curves without the error bars.
Electronic Calculation.
The electronic structure was calculated by the density-functional theory (DFT) as implemented in the open-source Quantum ESPRESSO program package (36). The exchange–correlation function was taken within the generalized gradient approximation (GGA) in the parameterization of Perdew–Burke–Ernzerhof (PBE) (36, 37). All 4f states of Eu and Yb were included in the current calculations. Due to the self-interaction errors, the standard DFT methods cannot handle the partially filled and sometimes even closed f electrons. As an alternative we used the DFT+U formalism (38), in which we included a Hubbard U parameter to account for the on-site Coulomb interaction. A U of 6 eV for Eu and 9 eV for Yb were selected to shift the localized f states away from the Fermi level. The value of U is selected so that the f states lie just below the topmost p states of the valance band. We choose it simply because this separates the strongly localized f states from other states needed for the generation of maximally localized Wannier functions. A plane-wave basis was adopted for the expansion of the valence electron wave functions with kinetic-energy cutoffs of 80 Ry. For ground-state calculations we used an 8 × 8 × 8 Monkhorst–Pack k-point mesh. From the ground-state density, the Bloch states have been computed on a 4 × 4 × 4 mesh. To analyze the nature of the chemical bonding in the ordered compounds, selected conduction bands were projected onto maximally localized Wannier functions (MLWFs) using the wannier90 code (39).
Furthermore, the electronic structure calculations of substituted (Ca,Eu,Yb)Mg2Bi2 compounds have been performed by means of the scalar relativistic Korringa–Kohn–Rostoker (KKR) method in combination with the coherent potential approximation (CPA) as implemented in the AkaiKKR (machikaneyama) program package (40, 41). The calculations were performed in the scalar relativistic mode by solving the Dirac equation for core and valence states. The Moruzzi, Janak, and Williams method was used for the parameterization of the exchange energy. The k-integration mesh was set to a size of (7 × 7 × 7) during the self-consistent cycles (213 k points in the irreducible wedge of the Brillouin zone). The Ca, Eu, or Yb atoms are placed on the 1a Wyckoff position, and the Mg and Bi atoms are placed on the 2d positions.
Lattice Dynamics Calculation.
The density-functional perturbation theory (DFPT), implemented in the PHonon code of the Quantum ESPRESSO distribution (34), was used for CaMg2Bi2, EuMg2Bi2, and YbMg2Bi2 lattice dynamics calculations. The self-consistent calculations were done in a scalar relativistic approximation, with the PBE GGA, and an energy cutoff of 80 Ry was used for the plane-wave expansion. An 8 × 8 × 8 k-space grid was used for these self-consistent calculations, resulting in 65 k points in the irreducible Brillouin zone. Once self-consistency was achieved, the PHonon code was used to generate the second-order force constants from the basic unit cell. Based on the obtained force constants, the phonon dispersions and densities of states were calculated. The phonon density of states is shown with a Gaussian broadening of 0.75 cm−1.
Results and Discussion
AMg2Bi2 (A = Ca, Yb, Eu), Eu0.5Yb0.5Mg2Bi2, and Eu0.5Ca0.5Mg2Bi2.
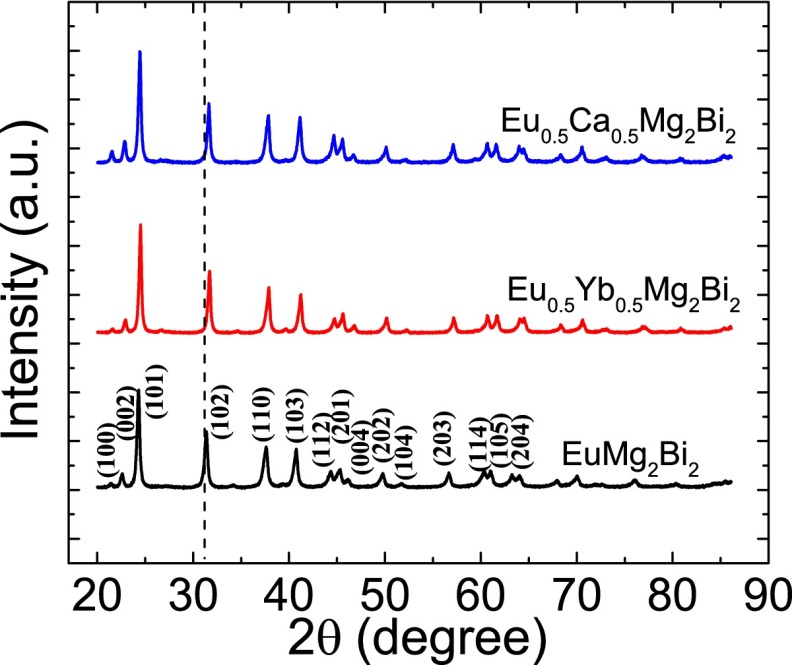
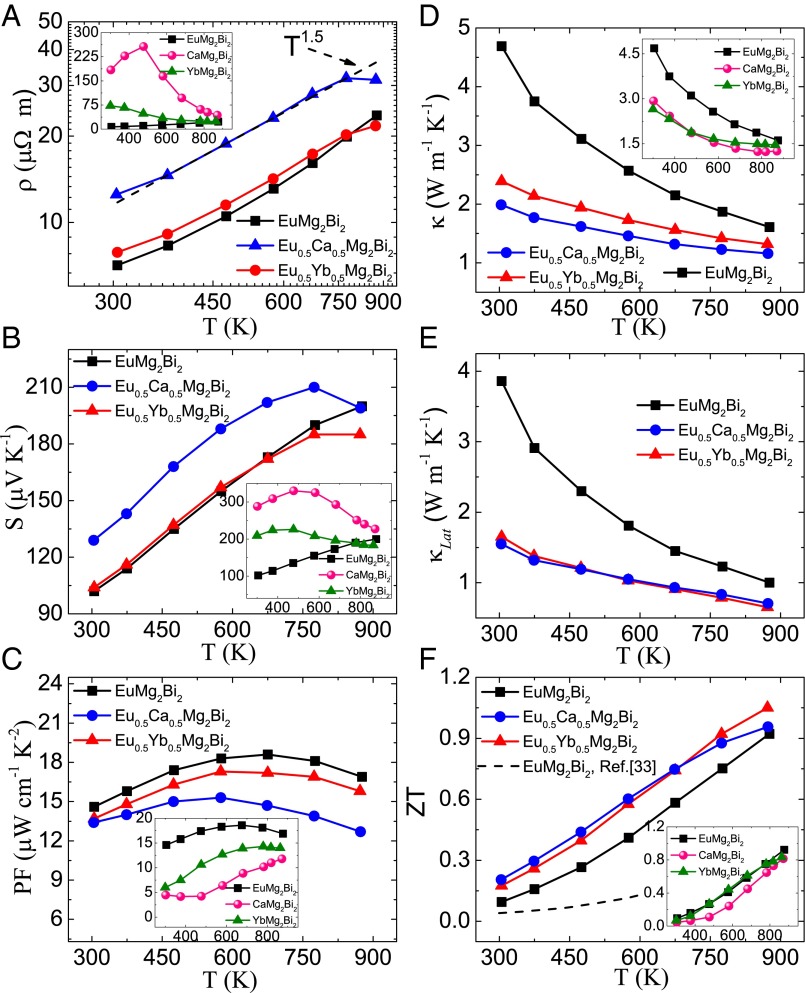
EuMg2Bi2, Eu0.5Yb0.5Mg2Bi2, and Eu0.5Ca0.5Mg2Bi2 were fabricated by mechanical alloying and hot pressing, and confirmed to be phase pure within the X-ray diffraction (XRD) detection limit (Fig. S1). To assess the TE performance of these samples, the electrical resistivity, Seebeck coefficient, and thermal conductivity were measured from 300 to 873 K, as shown in Fig. 2. Hall effect measurements were performed to aid in the analysis of these measurements (Table S1). For comparison, the TE properties of the three base compositions CaMg2Bi2, YbMg2Bi2, and EuMg2Bi2 are shown in Fig. 2 (Insets).
Fig. S1.
XRD patterns of AMg2Bi2 (A = Eu, Eu0.5Ca0.5, Eu0.5Yb0.5).
Fig. 2.
Temperature-dependent TE properties for AMg2Bi2 (A = Eu, Eu0.5Ca0.5, Eu0.5Yb0.5). (A) Electrical resistivity, (B) Seebeck coefficient, (C) power factor, (D) total thermal conductivity, (E) lattice thermal conductivity, and (F) ZT values. (Insets) Respective TE properties for the three base compositions AMg2Bi2 (A = Ca, Yb, Eu), shown separately.
Table S1.
Electric transport properties of AMg2Bi2 (A = Eu, Eu0.5Ca0.5, Eu0.5Yb0.5)
| AMg2Bi2 | Eu | Eu0.5Ca0.5 | Eu0.5Yb0.5 |
| Carrier concentration, 1019 cm−3 | 4.36 | 3.14 | 3.98 |
| Hall mobility, cm2 V−1⋅s−1 | 202 | 159 | 200 |
| Effective mass, me | 0.71 | 0.78 | 0.68 |
Fig. 2A illustrates the electrical resistivity as a function of temperature. All samples seem to follow ρ vs. T1.5, indicating that the carrier transport is dominated by acoustic phonon scattering before the intrinsic excitation. EuMg2Bi2 and Eu0.5Yb0.5Mg2Bi2 exhibit very similar resistivity, whereas Eu0.5Ca0.5Mg2Bi2 shows higher resistivity, largely because of its decreased carrier concentration and mobility. The carrier concentration increases by almost 1 order of magnitude from 2.38 × 1018 cm−3 for CaMg2Bi2 and 7.2 × 1018 cm−3 for YbMg2Bi2 to 4.36 × 1019 cm−3 for EuMg2Bi2. Therefore, at room temperature, EuMg2Bi2 shows a much lower resistivity ∼7 μΩ m than that of CaMg2Bi2 (∼184 μΩ m) and YbMg2Bi2 (∼72.6 μΩ m). As expected, the lower Seebeck coefficient of EuMg2Bi2 is achieved due to the enhanced carrier concentration and mobility. Specifically, at room temperature, S increases from ∼100 μV K−1 for EuMg2Bi2 to ∼209 μV K−1 for YbMg2Bi2 and ∼288 μV K−1 for CaMg2Bi2. As shown in Fig. 2B, it can be observed that the higher carrier concentration in EuMg2Bi2 effectively suppresses the bipolar effect, whereas Fig. 2B (Inset) clearly shows the bipolar effect occurring in CaMg2Bi2 and YbMg2Bi2 at very low temperatures because of the low carrier concentration. Among all of the samples, EuMg2Bi2 exhibits the highest average power factor, nearly 3 times that of CaMg2Bi2 and YbMg2Bi2 at room temperature (Fig. 2C).
The temperature dependence of thermal conductivity and that of lattice thermal conductivity are shown in Fig. 2 D and E, respectively. Eu0.5Ca0.5Mg2Bi2 and Eu0.5Yb0.5Mg2Bi2 show much lower thermal conductivity than that of EuMg2Bi2 due to the alloy effect. The total thermal conductivity of Eu0.5Ca0.5Mg2Bi2 is even lower than that of Eu0.5Yb0.5Mg2Bi2 mainly because of the lower electronic contribution κe, estimated using the Wiedemann−Franz relationship (κe = LT/ρ), where L is the Lorenz number approximated using a single parabolic band model, which leads to similar lattice thermal conductivity (κLat = κ − κe) of Eu0.5Ca0.5Mg2Bi2 with Eu0.5Yb0.5Mg2Bi2. The figure-of-merit is shown in Fig. 2F. Compared with the reported ZT ∼ 0.1 in EuMg2Bi2 by the melting and solidification method, our EuMg2Bi2 sample by the ball-milling and hot-pressing method possesses a much improved ZT ∼1. For both the alloyed Eu0.5Yb0.5Mg2Bi2 and Eu0.5Ca0.5Mg2Bi2, the average ZTs over the whole temperature range are higher than that of EuMg2Bi2 at temperature below 773 K.
Electronic and Lattice Dynamics Calculations for Three Base Compounds.
To better understand the transport behavior of the AMg2Bi2 family, DFT was first used to investigate the crystal and band structures, charge distribution, and chemical bonding for the three base compounds AMg2Bi2 (A = Ca, Yb, Eu).
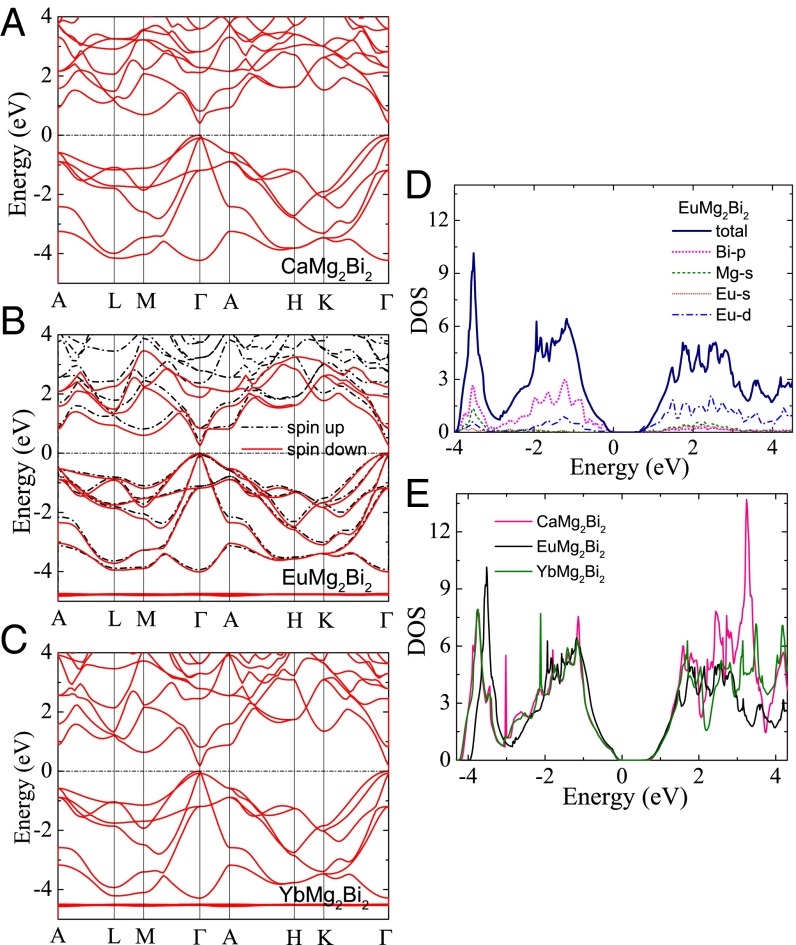
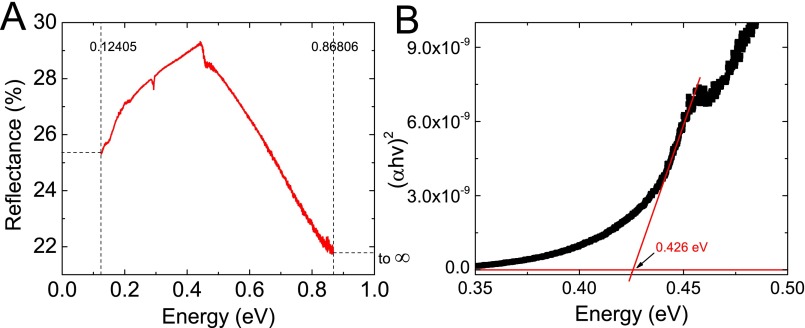
The calculated crystal structures of the three base compounds are listed in Table S2. The larger Eu2+ ion expands the structure and results in a larger geometric anisotropy of the crystal, as observed from XRD patterns with left shifting (Fig. S1). The Zintl compounds crystallizing in the CaAl2Si2 structure have been demonstrated to be p-type by both the first-principle calculation and experiments (29, 42), whereas the n-type compound has barely been found. The DFT calculated band structures of the three base compounds are shown in Fig. 3 A–C, proving that the Bi-based AMg2Bi2 Zintl phases are also intrinsically p-type. Clearly, both light- and heavy-hole bands exist near the top of the zone center. The direct band-gap (Eg) energy for CaMg2Bi2 is estimated to be 0.4 eV, smaller than the previously reported value of 0.7 eV estimated by the modified Becke Johnson functional of Tran and Blaha (32). FTIR specular-reflectance measurement plus Kramers–Kronig analysis shows the band gap for CaMg2Bi2 to be ∼0.42 eV (Fig. S2) and is in agreement with our DFT results. Due to the 4f electrons, Eg is observed to be 0.25 eV for EuMg2Bi2 and 0.18 eV for YbMg2Bi2.
Table S2.
Calculated crystal structure and electronic properties of AMg2Bi2
| Composition | A, Å | c/a | Bi–Mg distance, Å | Eg, eV | Δcr, meV |
| CaMg2Bi2 | 4.792 | 1.611 | 2.9507, 3.0023 | 0.40 | 99 |
| EuMg2Bi2 | 4.853 | 1.648 | 2.9671, 2.9930 | 0.25 | 6 |
| YbMg2Bi2 | 4.805 | 1.623 | 2.9517, 2.9985 | 0.18 | 72 |
Fig. 3.
DFT calculations. Band structures of (A) CaMg2Bi2, (B) EuMg2Bi2, and (C) YbMg2Bi2. (D) Total and projected DOS of EuMg2Bi2 and (E) DOS of three base compounds.
Fig. S2.
Band-gap measurement for base compound CaMg2Bi2. (A) FTIR specular-reflectance result with incident angle of 25°. (B) Band gap ∼0.426 eV by using Kramers–Kronig method.
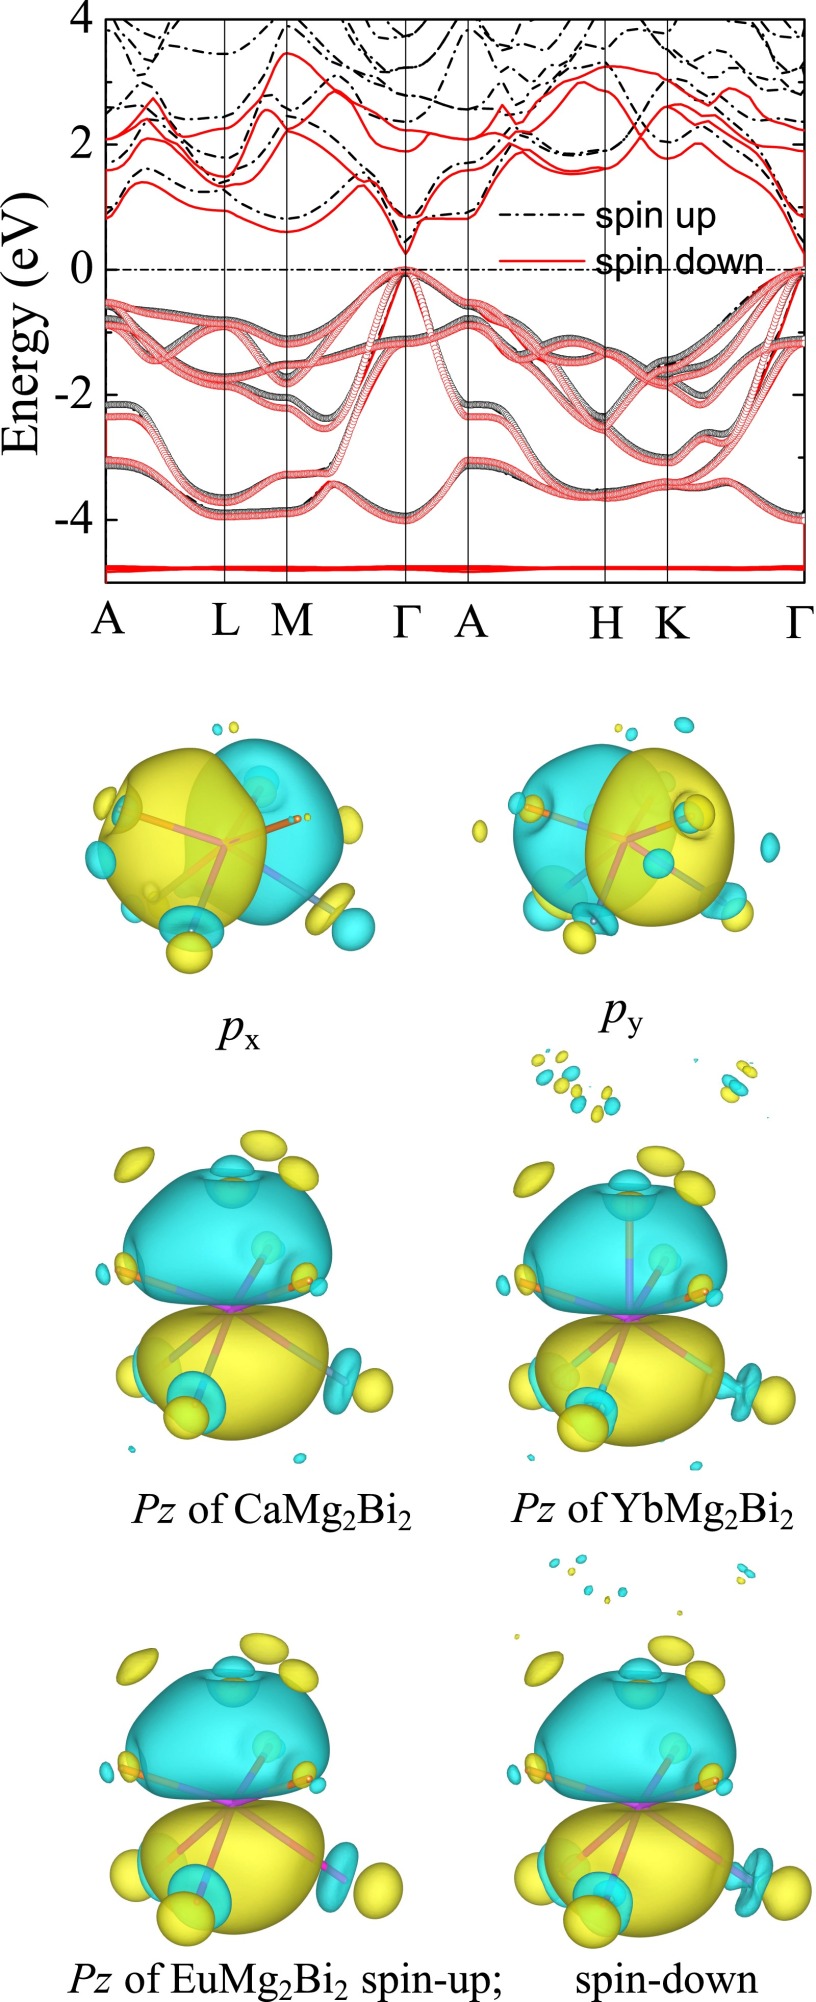
Fig. 3D shows the total and projected density of states (DOS) of EuMg2Bi2. It is clear that the Bi-p states dominate the valence bands. Overlaps of Mg-s and Bi-p states in the valence region (−4 eV) are also observed, indicating the hybridization between these states. This hybridization supports the polyanionic (Mg2Bi2)-2 Zintl nature of these materials. The DOS of all compounds is shown in Fig. 3E. The EuMg2Bi2 crystal possesses the largest geometric anisotropy, but a nearly zero crystal-field splitting energy (Δcr) (Table S2). The small Δcr results in the higher band degeneracy near the Fermi level, which is always favorable for the electrical transport properties of TE materials (43); this is consistent with the recent report on the selection criterion −0.06 < Δcr < 0.06 with band gap Eg < 1.5 eV for promising Zintl TE candidates (44). Moreover, to obtain an insightful picture of the chemical bonding, we generated the MLWFs of all three compounds. It can be observed that the top six valence bands can be well represented by the six p-like MLWFs centered on two Bi atoms (Fig. S3). Additionally, strong hybridizations are found between Bi and Eu/Yb, explaining the small band gap and large hole mobility in EuMg2Bi2 and YbMg2Bi2.
Fig. S3.
Band structure of EuMg2Bi2 and corresponding valence MLWFs. (Top) Circles indicate a six-dimensional manifold that has been disentangled from the full band structure (solid lines). (Bottom) Biatom-centered p-like MLWFs (px, py, pz) obtained from this manifold. Isosurfaces of different color correspond to two opposite values for the amplitudes of the real-valued MLWFs.
In addition to electronic calculations, to further understand the thermal transport, the phonon dispersions and DOS were calculated based on the DFPT.
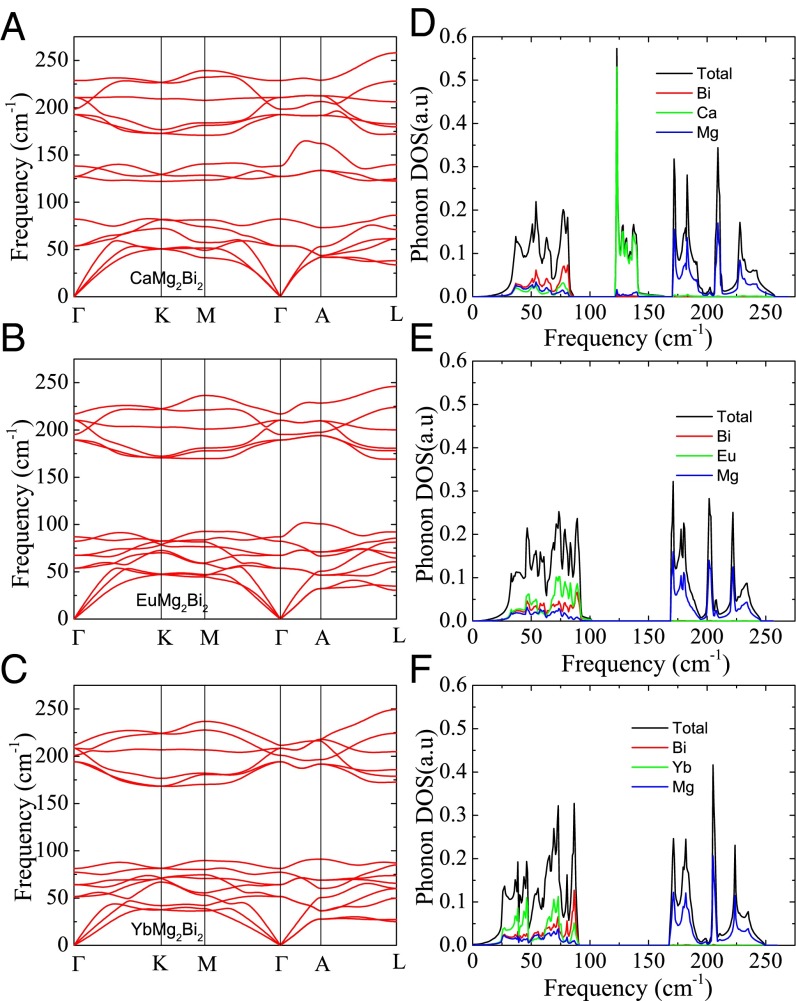
The phonon band structures of CaMg2Bi2, EuMg2Bi2, and YbMg2Bi2 are presented in Fig. 4. We see that: (i) The phonon frequencies of all pure compounds are relatively low. For instance, the three acoustic modes of each pure compound all comprise low frequencies of 50 cm−1 (6 meV) or less, above which they intersect optical branches. Meanwhile, the maximum optical mode frequency is only 250 cm−1 (31 meV). These low phonon frequencies are favorable for the TE transport properties. (ii) Significant dispersion of the optical modes is observed in all of three base compounds. Therefore, unlike other TE materials with complex crystal structures, the optical modes of the current compounds possess nonzero group velocities and contribute significantly to the heat transport. Thus, the usual phonon transport model based on the Debye approximation may require consideration in these compounds. (iii) The low-frequency parts of the phonon spectra become more depressed with increased A-site mass. The CaMg2Bi2 compound possesses three optical modes near 130 cm−1, whereas these optical modes move down and intersect the acoustic models in EuMg2Bi2 and YbMg2Bi2 compounds. Therefore, lower acoustic phonon group velocities and stronger phonon–phonon scattering can be expected in the latter two compounds. Table S3 lists the calculated sound velocity and Debye temperature for three pure compounds. The calculated Debye temperatures for three pure compounds are very close to the experimental values measured by the specific heat method (244 K for CaMg2Bi2, 211 K for EuMg2Bi2, and 207 K for YbMg2Bi2) (32). The A-site mass dependence of the sound velocity is also clearly seen. The sound velocities of AMg2Bi2 compounds are smaller than that of the AMg2Sb2 compound, as reported by Singh and Parker (45). Furthermore, these sound velocities of AMg2Bi2 compounds are comparable to those of the excellent TEs, such as Bi2Te3 and PbTe, for which longitudinal sound speeds are typically ∼3 km/s and transverse sound speeds ∼2 km/s (46, 47), which suggests that AMg2Bi2 compounds would be good TE materials.
Fig. 4.
Calculated phonon dispersions (per centimeter) for (A) CaMg2Bi2, (B) EuMg2Bi2, and (C) YbMg2Bi2 along high-symmetry directions; calculated phonon DOS for (D) CaMg2Bi2, (E) EuMg2Bi2, and (F) YbMg2Bi2.
Table S3.
Sound velocity and Debye temperature of AMg2Bi2
| Composition | c-Axis longitudinal, m/s | c-Axis transverse, m/s | a-Axis longitudinal, m/s | a-Axis transverse, m/s | a-Axis transverse, m/s | Debye temperature, K |
| CaMg2Bi2 | 3,057 | 2,658 | 3,133 | 2,146 | 1,817 | 248 |
| EuMg2Bi2 | 2,870 | 1,646 | 2,796 | 2,186 | 1,640 | 223 |
| YbMg2Bi2 | 2,500 | 1,420 | 2,680 | 1,748 | 1,200 | 222 |
Fig. 4 D–F shows the calculated phonon DOS (PDOS), including partial contributions from the Ca/Eu/Yb, Mg, and Bi sites. For CaMg2Bi2, the total DOS breaks up into three separate regions: Bi-dominated below ∼100 cm−1, primarily Ca between 120 and 150 cm−1, and primarily Mg between ∼170 and 250 cm−1. On the other hand, the total PDOS of EuMg2Bi2/YbMg2Bi2 breaks up into two separate regions: Eu/Yb-dominated below ∼100 cm−1, and primarily Mg between ∼170 and 250 cm−1. The Eu/Yb domination below 100 cm−1 cannot be explained by the increased mass only, but also by the strong f hybridization of the nearest Eu/Yb atoms, as indicated by the MLWFs.
(Eu0.5Yb0.5)1−xCaxMg2Bi2.
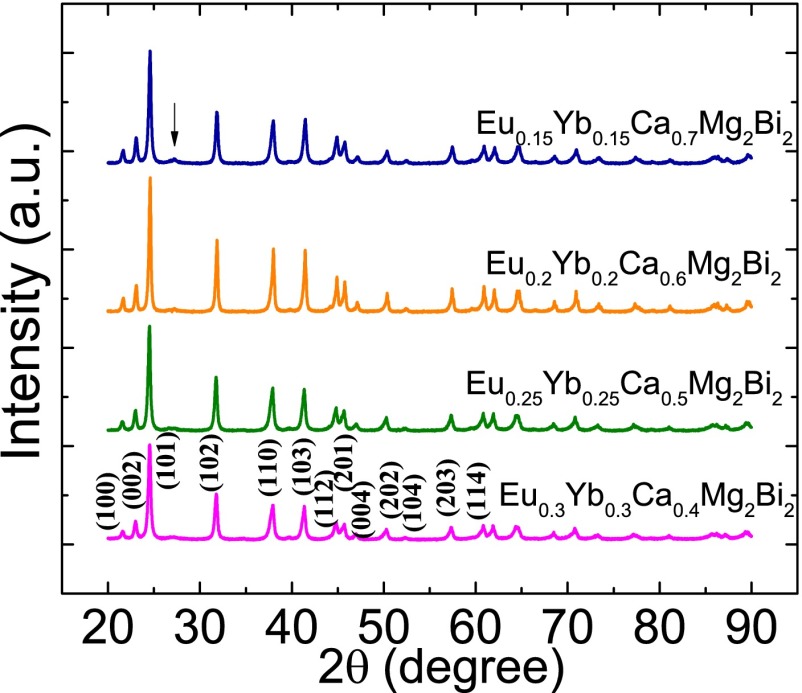
Because of the similar electronic properties between EuMg2Bi2 and Eu0.5Yb0.5Mg2Bi2 and the lower thermal conductivity in Eu0.5Ca0.5Mg2Bi2, Ca is introduced to replace some of the Eu and Yb in Eu0.5Yb0.5Mg2Bi2 while the ratio of Eu and Yb is kept the same. Fig. S4 shows the XRD pattern of (Eu0.5Yb0.5)1−xCaxMg2Bi2 with x = 0.4, 0.5, 0.6, and 0.7. The peaks can be well indexed according to the reported structure of CaAl2Si2. When Ca is introduced, a small impurity phase Bi is observed, the same as in our previous report on YbxCa1−xMg2Bi2 (35).
Fig. S4.
XRD pattern for (Eu0.5Yb0.5)1−xCaxMg2Bi2.
Electrical Transport.
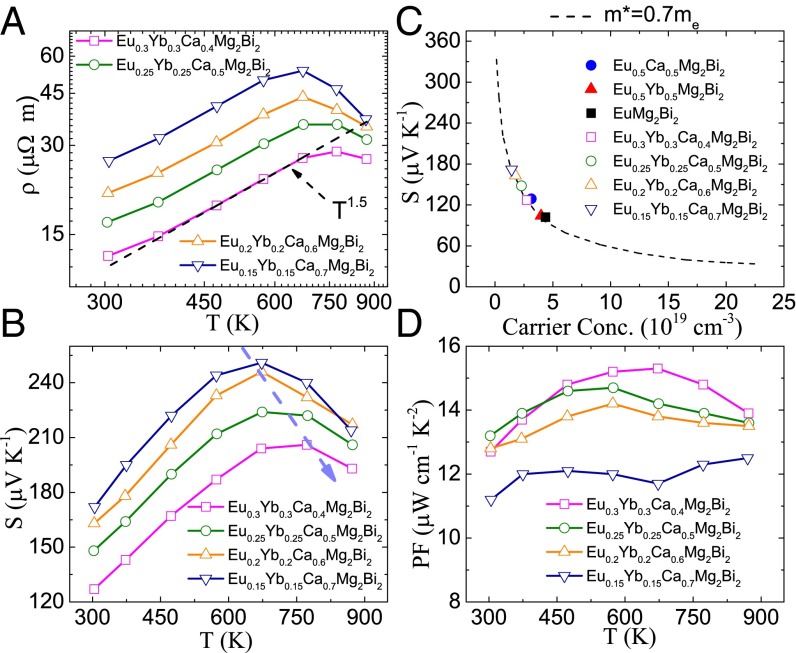
The electrical transport properties as a function of temperature are illustrated in Fig. 5 for (Eu0.5Yb0.5)1−xCaxMg2Bi2 with x = 0.4, 0.5, 0.6, and 0.7. Based on our DFT calculation, the band gaps for ordered CaMg2Bi2, YbMg2Bi2, and EuMg2Bi2 are 0.40, 0.18, and 0.25 eV, respectively. Adjusting the ratios of Ca/Yb/Eu in (Eu0.5Yb0.5)1−xCaxMg2Bi2 actually changes both the band-gap energy and the relative positions of bands, directly affecting their electrical properties. The temperature-dependent electrical resistivity is shown in Fig. 5A. The resistivity for all samples shows a similar trend of increasing with temperature following ρ vs. T1.5 as for AMg2Bi2 (A = Eu, Eu0.5Ca0.5, Eu0.5Yb0.5) (Fig. 2A). With increasing Ca concentration, the electrical resistivity gradually increases, mainly due to the reduction of carrier concentration. Consistent with the tendency of electrical resistivity, the Seebeck coefficients increase with increasing Ca concentration, as shown in Fig. 5B. The Seebeck coefficients of all samples exhibit peak values, the typical characteristic of the bipolar effect. With increasing concentrations of Eu/Yb, the increased carrier concentrations by reduced band gap cause the peaks to shift to higher temperatures. The relationship between Seebeck coefficient and carrier concentration at room temperature is plotted in Fig. 5C. Even though DFT calculation has demonstrated that there are three bands at the valence band edge that are degenerate at the Γ-point, the single parabolic band model with a single combined effective mass has been successfully applied in Zintl AZn2Sb2 (A = Sr, Ca, Yb, Eu) (29). Similarly, here we also applied the single parabolic band model with the assumption of acoustic phonon scattering; the dashed line is the theoretical Pisarenko line with m* = 0.7me. All of the experimental data fall well onto the calculated line. This good agreement between the single band model and the experimental data demonstrates that the different compositions in A site have almost no influence on the valence band structure at 300 K, confirmed by the DOS calculation discussed above. Fig. 5D shows the power factor, which slightly increases with Eu/Yb concentration.
Fig. 5.
Temperature-dependent electrical transport properties for (Eu0.5Yb0.5)1−xCaxMg2Bi2. (A) Electrical resistivity, (B) Seebeck coefficient, and (D) power factor. (C) The Pisarenko plot with m* = 0.7 me at 300 K for all samples.
Band Engineering of (Ca,Eu,Yb)Mg2Bi2: Weakly Affected Valence Band for High Mobility and Adjusted Conduction Band by Alloying.
Generally speaking, substituting atoms disturbs the lattice, making perfectly coherent electron waves impossible. Instead, the electrons are scattered by such atoms, resulting in the reduction of carrier mobility. This phenomenon is therefore called chemical disorder scattering, which is not beneficial for electronic performance. For example, the mobility drops by more than 30% in n-type (PbTe)1–x(PbSe)x solid solutions due to chemical disorder scattering (48). However, as shown in Table S4, the carrier mobility of (Eu0.5Yb0.5)1−xCaxMg2Bi2 is not reduced much due to chemical disorder scattering.
Table S4.
Electric transport properties for (Eu0.5Yb0.5)1−xCaxMg2Bi2 with x = 0.4, 0.5, 0.6, and 0.7
| (Eu0.5Yb0.5)1−xCaxMg2Bi2 | x = 0.4 | x = 0.5 | x = 0.6 | x = 0.7 |
| Carrier concentration, 1019 cm−3 | 2.73 | 2.28 | 1.77 | 1.43 |
| Hall mobility, cm2 V−1⋅s−1) | 180 | 166 | 171 | 164 |
| Effective mass, me | 0.70 | 0.77 | 0.77 | 0.72 |
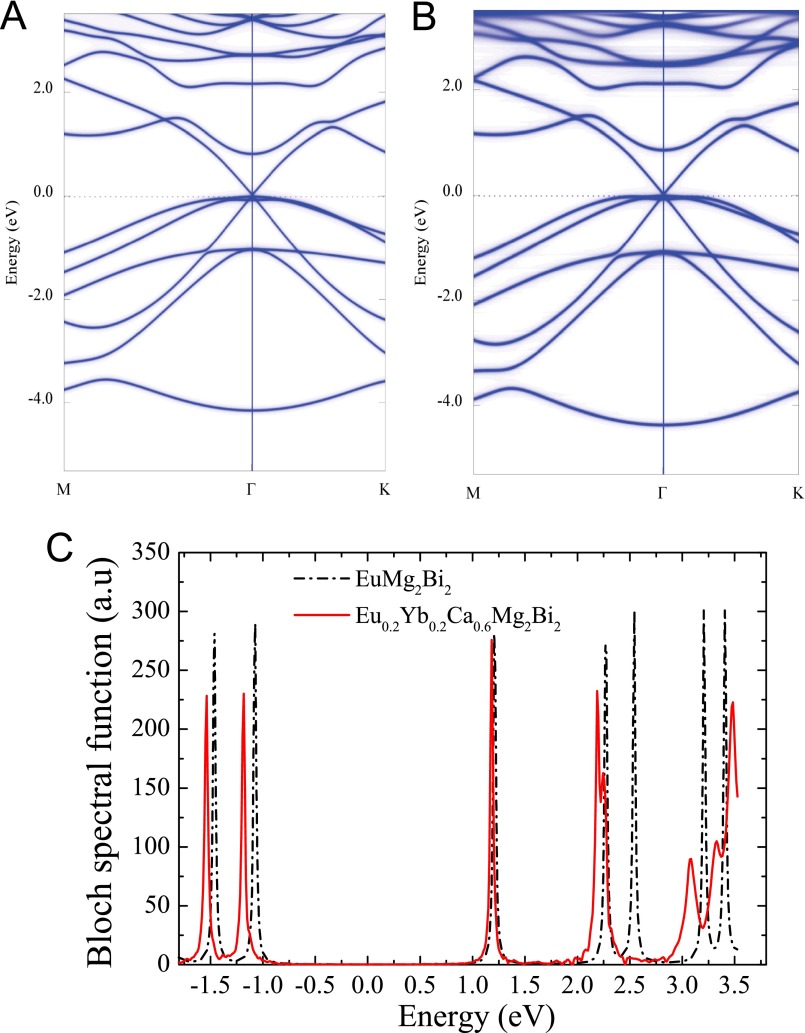
The carrier mobility is inversely proportional to the product of effective mass and scattering rate. Our DFT calculations reveal that both the effective mass and scattering rate are nearly unaffected by the Yb/Ca substitution. The comparison of the electronic structure of the optimized Eu0.2Yb0.2Ca0.6Mg2Bi2 with EuMg2Bi2 is demonstrated in Fig. S5 A and B using the Bloch spectral function calculated by the KKR-CPA method. The lifetime τ ∝ (ΔE)-1 of chemical disorder scattering is introduced here, inversely proportional to the energy width of the states. By comparing the different states of the base and substituted compounds, it is seen that the hole states are much less influenced than the electron states in the whole band structure. This is consistent with the nearly unchanged effective masses (Table S4). On the other hand, the width of the Bloch spectral function projected at M point is compared in Fig. S5C. The inspection of the Bloch spectral function also reveals that the broadening, and thus the relaxation times τ, is only significant in the conducting bands. This is also beneficial in maintaining the high carrier mobility in the disordered structures (48).
Fig. S5.
Bloch spectral functions of substituted Eu0.2Yb0.2Ca0.6Mg2Bi2. Compared are the Bloch spectral functions of pure EuMg2Bi2 (A), substituted Eu0.2Yb0.2Ca0.6Mg2Bi2 (B) for the high-symmetry directions M-Γ-K, and (C) the Bloch spectral functions of two compounds projected on the M point.
Reduced Thermal Conductivity Through Nanostructure, Strain, and Dislocation.
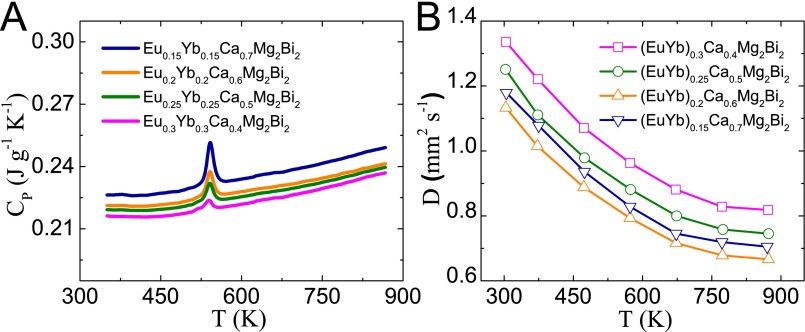
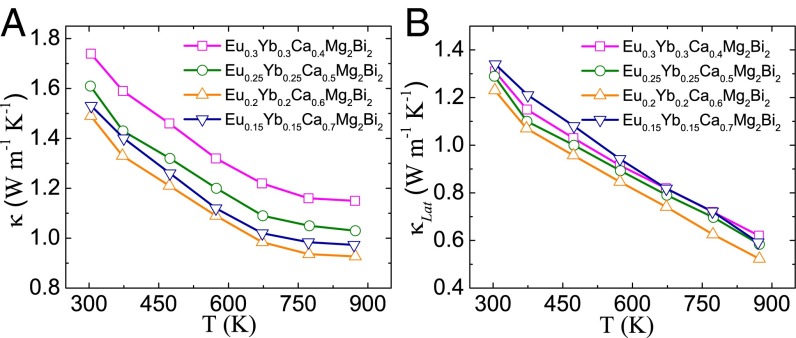
Thermal conductivity is calculated as the product of density, specific heat (Fig. S6A), and thermal diffusivity (Fig. S6B). The peak around 543 K observed (Fig. S6A) indicates there is a phase transition. This is mainly because of the existence of Bi as the impurity phase, as observed in Fig. S4. The melting point of Bi is 544 K, consistent with the peak observed in specific heat measurement. The same phenomenon has been demonstrated in our previous study (35). Fig. 6A shows the temperature dependence of the total thermal conductivity κ for all (Eu0.5Yb0.5)1−xCaxMg2Bi2 samples. At room temperature, the κ of base compounds AMg2Bi2 (A = Eu, Yb, Ca), shown in Fig. 2D, is ∼3 W m−1⋅K−1, and is dramatically reduced to 1.5 W m−1⋅K−1 in the Eu0.2Yb0.2Ca0.6Mg2Bi2 sample. For all alloyed samples in Fig. 6A, with increasing Ca concentration, the thermal conductivity first decreases, reaching the lowest point at x = 0.6, and then increases. By directly subtracting the electronic contribution from the total thermal conductivity, the lattice thermal conductivities (κLat) were obtained and are shown in Fig. 6B. Specifically, the lowest lattice thermal conductivity decreases to 0.5 W m−1⋅K−1 at 873 K in the sample with x = 0.6. Apparently, the alloying effect contributes much to the reduction in lattice thermal conductivity, which would significantly enhance the efficiency based on parameter B (Eq. 1) due to the weakly affected carrier mobility and the similar effective mass.
Fig. S6.
Temperature-dependent specific heat (A) and thermal diffusivity (B) for (Eu0.5Yb0.5)1−xCaxMg2Bi2 samples.
Fig. 6.
Temperature-dependent thermal conductivity for (Eu0.5Yb0.5)1−xCaxMg2Bi2. (A) Total thermal conductivity and (B) lattice thermal conductivity.
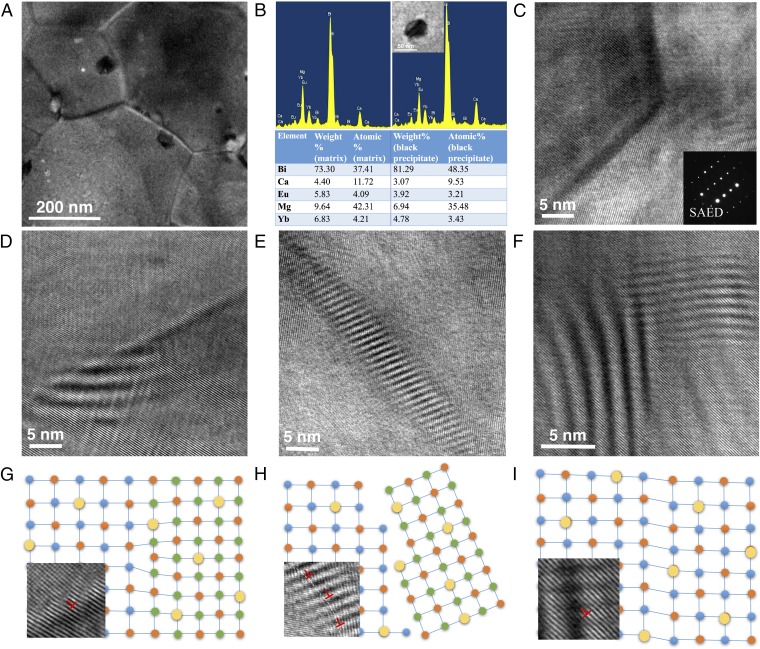
The microstructure of the optimized Eu0.2Yb0.2Ca0.6Mg2Bi2 sample is investigated by TEM. The presence of nanoscale grains around 200–500 nm is evident in Fig. 7A. The black nanoprecipitates around 5–50 nm can also be observed inside grains or near boundaries. Elemental analysis by energy-dispersion X-ray spectroscopy (EDS) indicates Bi concentration is higher in the precipitates (Fig. 7B), consistent with the Bi peaks shown in XRD patterns and specific heat curve (Fig. S4). Fig. 7C shows the clean grain boundaries by high-resolution TEM (HRTEM) and crystalline grains of the sample. Moreover, a number of different defect strains were observed in the samples, as shown in Fig. 7 D–F, which might be evidence of point defects in alloyed structures.
Fig. 7.
Typical microstructures for Eu0.2Yb0.2Ca0.6Mg2Bi2. (A) Medium-magnification TEM image showing mesoscale grains with black precipitates. (B) EDS spectra for matrix (Left) and precipitate (Right) with elemental composition data. (C) HRTEM image of grain boundary showing good crystallization. (Inset) The selected area electron diffraction pattern. (D) Semicoherent strain by misfit dislocation around the grain boundary. (E) Incoherent interaction near the grain boundary. (F) Coherent strain inside the grain. G–I are schematic diagrams illustrating three possible types of semicoherent, incoherent, and coherent interactions, respectively, with inset magnification of one segment corresponding to D–F, respectively (larger yellow circles represent dopants).
The strain is defined as the measurement of the relative displacement of atoms/ions from a reference configuration. Normally, there are three types of precipitate–matrix or matrix–matrix interfaces: coherent (elastic strain), incoherent, and semicoherent (plastic strain) (shown in Fig. 7 G–I) (19). The coherent elastic strain and semicoherent plastic strain are common. In most cases, the incoherent interface would seldom involve strain field due to the minimal interaction between the phases. The three types of interactions can largely affect the phonon scattering, and the detailed analysis is shown in Fig. 7 D–I. In Fig. 7D, the semicoherent strain caused by misfit dislocations is observed near the grain boundary, with the corresponding schematic representation plotted in Fig. 7G. The inset magnification of one segment of Fig. 7D clearly indicates several dislocations. Near the grain boundary shown in Fig. 7E, another type of incoherent interaction is also observed, possibly even with strain fields appearing. The enlarged image is displayed in Fig. 7H with the corresponding schematic representation. The last type of interaction of the elastic strain is observed inside the grains mainly due to the large alloy concentration as shown in Fig. 7F. Most of the strain-field fluctuations observed in Fig. 7 are likely to be caused by the Ca, Yb, and Eu disorder in the lattice because of the mass and size differences, which could significantly reduce the lattice thermal conductivity.
Inspired by the dramatically reduced disorders in the compounds, further insight into the phonon transport properties was considered to compare the ordered and disordered compounds. As discussed in the previous section, the usual phonon transport model based on the Debye approximation may be insufficient to describe the lattice thermal conductivity of AMg2Bi2 compounds. First-principle calculations of the third-order force constants may give an insightful description of the phonon transport properties. But, such calculations require a huge amount of computational resources. The situation is even more problematic for the disordered compounds. Hence, we applied an approximate Boltzmann–Peierls theory, namely a generalized Callaway equation (49), to the ordered and disordered compounds.
We use the following high-temperature expression, which is a generalization of the Callaway treatment to a non-Debye approximation:
| [2] |
where G, V is the unit volume, ω is the phonon angular frequency, kB is the Boltzmann constant, is the frequency-averaged group velocity, G is the density of states, and is a relaxation time, which in the Callaway treatment is independent of normal-mode polarization.
We consider four scattering mechanisms in (Ca,Eu,Yb)Mg2Bi2: the point-defects scattering, phonon–phonon scattering, electron–phonon scattering, and grain boundary scattering. The relaxation times are , , , and , respectively. Therefore, the combined phonon relaxation time can be expressed as
| [3] |
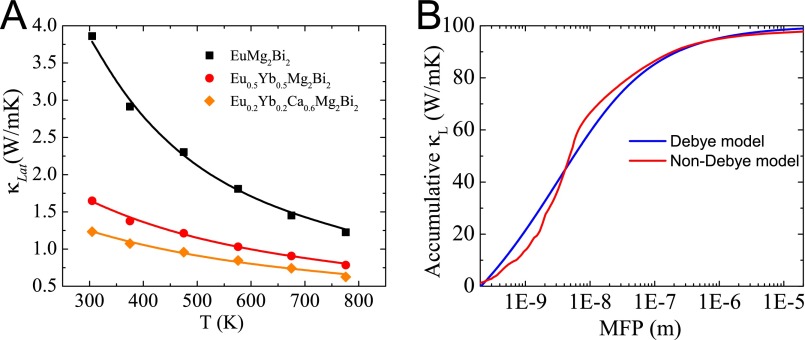
where L is the average grain size (taken from the TEM observation), and the coefficients A, B, and C are fitting parameters. The fitted results are shown as the solid lines in Fig. S7A. The coefficients A, B, and C for all of these samples are summarized in Table 1.
Fig. S7.
(A) Lattice thermal conductibility of (Ca,Eu,Yb)Mg2Bi2. (B) The accumulative lattice thermal conductivity vs. mean-free path in Yb0.2Eu0.2Ca0.6Mg2Bi2.
Table 1.
| Composition | B, 10−17 s⋅K−1 | A, 10−40 s3 | C, 10−34 | L, nm |
| EuMg2Bi2 | 1.7 | 0 | 0.1 | 300 |
| Yb0.5Eu0.5Mg2Bi2 | 1.74 | 0.76 | 0.1 | 300 |
| Yb0.2Eu0.2Ca0.6Mg2Bi2 | 1.78 | 1.25 | 0.1 | 300 |
The electron–phonon scattering is very weak in all three samples, indicating low deformation potential Edef, which is also responsible for the high carrier mobility observed above (48). The strength of the phonon–phonon scatterings is nearly unchanged based on the similar B, whereas the point-defect scattering rate increases with the site substitution. For instance, the point-defect scattering of Yb0.2Eu0.2Ca0.6Mg2Bi2 is twice that of Yb0.5Eu0.5Mg2Bi2, indicating the effect of remarkable mass and strain-field fluctuation. Therefore, the fitted results are consistent with the TEM observation.
To study the effects of nanostructures on the lattice thermal conductivity of (Ca,Eu,Yb)Mg2Bi2 alloys, we calculated the accumulative lattice thermal conductivity of Yb0.2Eu0.2Ca0.6Mg2Bi2, as shown in Fig. S7B. It is clear that a large portion of heat is carried by phonons with mean-free path lengths longer than 300 nm. Therefore, the nanostructures can decrease the lattice thermal conductivity of (Ca,Eu,Yb)Mg2Bi2 alloys.
Enhanced Figure-of-Merit.
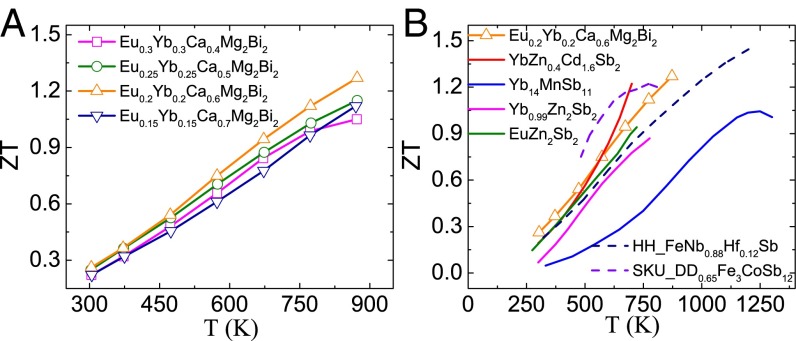
The highest ZT that can be achieved in a given material system is governed by its material parameter (Eq. 1). However, in the simplest solid solutions, the net result of alloying on ZT relies on two effects with opposite influences: mobility reduction and lattice thermal conductivity reduction. Here, because of the band structure engineering with weak chemical disorder scattering, weakly affected mobility is achieved. Further reduction of thermal conductivity by strain fluctuation scattering successfully leads to a record peak ZT of ∼1.3 in Eu0.2Yb0.2Ca0.6Mg2Bi2 (Fig. 8A). Such a ZT value is competitive with the reported Sb-based p-type Zintl phases (22, 26, 27, 50) and even other good p-type skutterudites (51) and half-Heuslers (52) in this temperature range (Fig. 8B). Compared with the best TE performance of YbZn0.4Cd1.6Sb2, our Bi-based Zintl phases are nontoxic in addition to having a higher ZT, which is beneficial in aiming toward practical applications of these compounds.
Fig. 8.
TE performance for p-type Zintl phases. (A) Temperature-dependent ZT values for (Eu0.5Yb0.5)1−xCaxMg2Bi2, and (B) ZT comparison of typical high-temperature p-type Zintl phases materials (22, 26, 27, 50) and other good p-type skutterudites (SKU) (51) and half-Heuslers (HH) (52).
Conclusion
We demonstrated for the first time, to our knowledge, that the base Zintl compound EuMg2Bi2 can achieve peak ZT ∼1. Further partial substitution of Ca and Yb at Eu obtains a ZT as high as ∼1.3 in (EuYb)0.2Ca0.6Mg2Bi2, better than the best-known Sb-based Zintl compound YbZn0.4Cd1.6Sb2. The low lattice thermal conductivity resulted from dislocations and multiple types of strains, as well as nanostructures, and plays a decisive role in the enhanced TE performance. DFT calculations indicate this chemical disorder scattering only influences the conduction band, ensuring the relatively high carrier mobility. This finding of better TE performance of Bi-based Zintl phases could pave the way for practical applications of this compound for middle temperature ranges.
Acknowledgments
The work performed at University of Houston is funded by the US Department of Energy under Contract DE-FG02-13ER46917/DE-SC0010831 and supported in part by US Air Force Office of Scientific Research Grant FA9550-15-1-0236, National Science Foundation (Career Award ECCS-1240510), the Robert A. Welch Foundation (E-1728), the T.L.L. Temple Foundation, the John J. and Rebecca Moores Endowment, and the State of Texas through the Texas Center for Superconductivity at the University of Houston. This work was also supported by the National Natural Science Foundation of China (51471061).
Footnotes
The authors declare no conflict of interest.
This article contains supporting information online at www.pnas.org/lookup/suppl/doi:10.1073/pnas.1608794113/-/DCSupplemental.
References
- 1.Rowe DM. Space Missions and Application. Thermoelectrics Handbook: Macro to Nano. CRC Press; Boca Raton, FL: 2006. [Google Scholar]
- 2.DiSalvo FJ. Thermoelectric cooling and power generation. Science. 1999;285(5428):703–706. doi: 10.1126/science.285.5428.703. [DOI] [PubMed] [Google Scholar]
- 3.Bell LE. Cooling, heating, generating power, and recovering waste heat with thermoelectric systems. Science. 2008;321(5895):1457–1461. doi: 10.1126/science.1158899. [DOI] [PubMed] [Google Scholar]
- 4.Tritt TM, Subramanian MA. Thermoelectric materials, phenomena, and applications: A bird’s eye view. MRS Bull. 2011;31(03):188–198. [Google Scholar]
- 5.Dresselhaus MS, et al. New directions for low-dimensional thermoelectric materials. Adv Mater. 2007;19(8):1043–1053. [Google Scholar]
- 6.Liu W, Jie Q, Kim HS, Ren Z. Current progress and future challenges in thermoelectric power generation: From materials to devices. Acta Mater. 2015;87(C):357–376. [Google Scholar]
- 7.Snyder GJ, Toberer ES. Complex thermoelectric materials. Nat Mater. 2008;7(2):105–114. doi: 10.1038/nmat2090. [DOI] [PubMed] [Google Scholar]
- 8.Chasmar RP, Stratton R. The thermoelectric figure of merit and its relation to thermoelectric generators. J Electron Control. 1959;7(1):52–72. [Google Scholar]
- 9.Tuomi D. Thermoelectricity: VII. The Seebeck quality factor, a semiconductor characterization tool. J Electrochem Soc. 1984;131(9):2101–2105. [Google Scholar]
- 10.Wood C. Materials for thermoelectric energy conversion. Rep Prog Phys. 1988;51(4):459. [Google Scholar]
- 11.Pei Y, et al. Convergence of electronic bands for high performance bulk thermoelectrics. Nature. 2011;473(7345):66–69. doi: 10.1038/nature09996. [DOI] [PubMed] [Google Scholar]
- 12.Pei Y, Wang H, Snyder GJ. Band engineering of thermoelectric materials. Adv Mater. 2012;24(46):6125–6135. doi: 10.1002/adma.201202919. [DOI] [PubMed] [Google Scholar]
- 13.Liu W, et al. Convergence of conduction bands as a means of enhancing thermoelectric performance of n-type Mg2Si(1-x)Sn(x) solid solutions. Phys Rev Lett. 2012;108(16):166601. doi: 10.1103/PhysRevLett.108.166601. [DOI] [PubMed] [Google Scholar]
- 14.Zhao LD, et al. Thermoelectrics with earth abundant elements: High performance p-type PbS nanostructured with SrS and CaS. J Am Chem Soc. 2012;134(18):7902–7912. doi: 10.1021/ja301772w. [DOI] [PubMed] [Google Scholar]
- 15.Fu C, et al. High band degeneracy contributes to high thermoelectric performance in p-type half-Heusler compounds. Adv Energy Mater. 2014;4(18):1400600. [Google Scholar]
- 16.Liu Z, et al. Lithium doping to enhance thermoelectric performance of MgAgSb with weak electron-phonon coupling. Adv Energy Mater. 2016;6(7):1502269. [Google Scholar]
- 17.Yang J, Meisner GP, Chen L. Strain field fluctuation effects on lattice thermal conductivity of ZrNiSn-based thermoelectric compounds. Appl Phys Lett. 2004;85(7):1140–1144. [Google Scholar]
- 18.Xie H, et al. Beneficial contribution of alloy disorder to electron and phonon transport in half-Heusler thermoelectric materials. Adv Funct Mater. 2013;23(41):5123–5130. [Google Scholar]
- 19.He J, Kanatzidis MG, Dravid VP. High performance bulk thermoelectrics via a panoscopic approach. Mater Today. 2013;16(5):166–176. [Google Scholar]
- 20.Caillat T, Fleurial JP, Borshchevsky A. Preparation and thermoelectric properties of semiconducting Zn4Sb3. J Phys Chem Solids. 1997;58(7):1119–1125. [Google Scholar]
- 21.Chitroub M, Besse F, Scherrer H. Thermoelectric properties of semi-conducting compound Zn4Sb3. J Alloys Compd. 2008;460(1-2):90–93. [Google Scholar]
- 22.Brown SR, Kauzlarich SM, Gascoin F, Snyder GJ. Yb 14MnSb 11: New high efficiency thermoelectric material for power generation. Chem Mater. 2006;18(7):1873–1877. [Google Scholar]
- 23.Toberer ES, et al. Traversing the metal-insulator transition in a Zintl phase: Rational enhancement of thermoelectric efficiency in Yb14Mn1− xAlxSb11. Adv Funct Mater. 2008;18(18):2795–2800. [Google Scholar]
- 24.Xu H, et al. Thermoelectric performance of NiyMo3Sb7−xTex (y≤0.1, 1.5≤x≤1.7) J Appl Phys. 2009;105(5):053703. [Google Scholar]
- 25.Gascoin F, Ottensmann S, Stark D, Haïle SM, Snyder GJ. Zintl phases as thermoelectric materials: Tuned transport properties of the compounds CaxYb1-xZn2Sb2. Adv Funct Mater. 2005;15(11):1860–1864. [Google Scholar]
- 26.Zhang H, et al. A new type of thermoelectric material, EuZn2Sb2. J Chem Phys. 2008;129(16):164713. doi: 10.1063/1.3001608. [DOI] [PubMed] [Google Scholar]
- 27.Wang XJ, et al. Synthesis and high thermoelectric efficiency of Zintl phase YbCd2−xZnxSb2. Appl Phys Lett. 2009;94(9):092106. [Google Scholar]
- 28.Zhang H, et al. Thermoelectric properties of YbxEu1-xCd2Sb2. J Chem Phys. 2010;133(19):194701–194706. doi: 10.1063/1.3501370. [DOI] [PubMed] [Google Scholar]
- 29.Toberer ES, May AF, Melot BC, Flage-Larsen E, Snyder GJ. Electronic structure and transport in thermoelectric compounds AZn2Sb2 (A = Sr, Ca, Yb, Eu) Dalton Trans. 2010;39(4):1046–1054. doi: 10.1039/b914172c. [DOI] [PubMed] [Google Scholar]
- 30.Zheng C, Hoffmann R, Nesper R, Schnering Von HG. Site preferences and bond length differences in CaAl2Si2-type Zintl compounds. J Am Chem Soc. 1986;108(8):1876–1884. [Google Scholar]
- 31.Burdett JK, Miller GJ. Fragment formalism in main-group solids: Applications to AlB2, CaAl2Si2, BaAl4, and related materials. Chem Mater. 1990;2(1):12–26. [Google Scholar]
- 32.May AF, McGuire MA, Singh DJ, Custelcean R, Jellison GE., Jr Structure and properties of single crystalline CaMg2Bi2, EuMg2Bi2, and YbMg2Bi2. Inorg Chem. 2011;50(21):11127–11133. doi: 10.1021/ic2016808. [DOI] [PubMed] [Google Scholar]
- 33.May AF, et al. Thermoelectric transport properties of CaMg2Bi2, EuMg2Bi2, and YbMg2Bi2. Phys Rev B. 2012;85(3):035202. [Google Scholar]
- 34.Ramirez D, Gallagher A, Baumbach R, Siegrist T. Synthesis and characterization of the divalent samarium Zintl-phases SmMg2Bi2 and SmMg2Sb2. J Solid State Chem. 2015;231(C):217–222. [Google Scholar]
- 35.Shuai J, et al. Thermoelectric properties of Bi-based Zintl compounds Ca1-xYbxMg2Bi2. J Mater Chem A Mater Energy Sustain. 2016;4(11):4312–4320. [Google Scholar]
- 36.Perdew JP, Burke K, Ernzerhof M. Generalized gradient approximation made simple. Phys Rev Lett. 1996;77(18):3865–3868. doi: 10.1103/PhysRevLett.77.3865. [DOI] [PubMed] [Google Scholar]
- 37.Giannozzi P, et al. QUANTUM ESPRESSO: A modular and open-source software project for quantum simulations of materials. J Phys Condens Matter. 2009;21(39):395502. doi: 10.1088/0953-8984/21/39/395502. [DOI] [PubMed] [Google Scholar]
- 38.Liechtenstein AI, Anisimov VI, Zaanen J. Density-functional theory and strong interactions: Orbital ordering in Mott-Hubbard insulators. Phys Rev B Condens Matter. 1995;52(8):R5467–R5470. doi: 10.1103/physrevb.52.r5467. [DOI] [PubMed] [Google Scholar]
- 39.Marzari N, Mostofi AA, Yates JR, Souza I, Vanderbilt D. Maximally localized Wannier functions: Theory and applications. Rev Mod Phys. 2012;84(4):1419–1475. [Google Scholar]
- 40.Akai H, Dederichs PH. Local moment disorder in ferromagnetic alloys. Phys Rev B Condens Matter. 1993;47(14):8739–8747. doi: 10.1103/physrevb.47.8739. [DOI] [PubMed] [Google Scholar]
- 41.Akai H. Ferromagnetism and its stability in the diluted magnetic semiconductor (In, Mn)As. Phys Rev Lett. 1998;81(14):3002–3005. [Google Scholar]
- 42.Bjerg L, Madsen GKH, Iversen BB. Ab initio calculations of intrinsic point defects in ZnSb. Chem Mater. 2012;24(11):2111–2116. [Google Scholar]
- 43.Van Vleck JH. Theory of the variations in paramagnetic anisotropy among different salts of the iron group. Phys Rev. 1932;41(2):208–215. [Google Scholar]
- 44.Zhang J, et al. Designing high-performance layered thermoelectric materials through orbital engineering. Nat Commun. 2016;7:10892. doi: 10.1038/ncomms10892. [DOI] [PMC free article] [PubMed] [Google Scholar]
- 45.Singh DJ, Parker D. Electronic and transport properties of Zintl phase AeMg2Pn2, Ae = Ca,Sr,Ba, Pn = As,Sb,Bi in relation to Mg3Sb2. J Appl Phys. 2013;114(14):143703–143708. [Google Scholar]
- 46.Chiritescu C, Mortensen C, Cahill DG, Johnson D, Zschack P. Lower limit to the lattice thermal conductivity of nanostructured Bi2Te3-based materials. J Appl Phys. 2009;106(7):073503–073506. [Google Scholar]
- 47.Pei YL, Liu Y. Electrical and thermal transport properties of Pb-based chalcogenides: PbTe, PbSe, and PbS. J Alloys Compd. 2012;514:40–44. [Google Scholar]
- 48.Wang H, LaLonde AD, Pei Y, Snyder GJ. The criteria for beneficial disorder in thermoelectric solid solutions. Adv Funct Mater. 2012;23(12):1586–1596. [Google Scholar]
- 49.Callaway J. Model for lattice thermal conductivity at low temperatures. Phys Rev. 1959;113(4):1046–1051. [Google Scholar]
- 50.Zevalkink A, et al. Nonstoichiometry in the Zintl phase Yb1−δZn2Sb2 as a route to thermoelectric optimization. Chem Mater. 2014;26(19):5710–5717. [Google Scholar]
- 51.Rogl G, Grytsiv A, Rogl P, Bauer E, Zehetbauer M. A new generation of p-type didymium skutterudites with high ZT. Intermetallics. 2011;19(4):546–555. [Google Scholar]
- 52.Fu C, et al. Realizing high figure of merit in heavy-band p-type half-Heusler thermoelectric materials. Nat Commun. 2016;6:8144. doi: 10.1038/ncomms9144. [DOI] [PMC free article] [PubMed] [Google Scholar]


