Abstract
Sirtuin 1(SIRT1) is a NAD+-dependent deacetylase which has been implicated in age-related diseases such as cancer, Alzheimer’s disease, type 2 diabetes, and vascular diseases. SIRT1 modulators are of interest for their potential therapeutic use and potential as chemical probes to study the role of SIRT1. Fluorescence-based assays used to identify SIRT1 activators have been shown to have artifacts related to the fluorophore substrates used in the assays. Such problems highlight the potential utility of a label-free high throughput screening (HTS) strategy. In this work, we describe a label-free SIRT1 assay suitable for HTS based on segmented flow-electrospray ionization-mass spectrometry (ESI-MS). In the assay, 0.5 μM SIRT1 was incubated with 20 μM acetylated 21-amino acid peptide, which acts as substrate for the protein. A stable-isotope labeled product peptide was added to the assay mixture as an internal standard after reaction quenching. The resulting samples are formatted into 100 nL droplets segmented by perfluorodecalin and then infused at 0.8 samples/s into an ESI-MS. To enable direct ESI-MS analysis, 11 μM SIRT1 was dialyzed into a 200 μM ammonium formate (pH 8.0) buffer prior to use in the assay. This buffer was demonstrated to minimally affect enzyme kinetics and yet be compatible with ESI-MS. The assay conditions were optimized through enzyme kinetic study, and tested by screening an 80-compound library. The assay Z-factor was 0.7. Four inhibitors and no activators were detected from the library.
Keywords: Sirtuin 1, Mass Spectrometry, High Throughput Screening, Label-free
Graphical abstract
1. Introduction
High throughput screening (HTS) is a powerful approach to rapidly identify compounds that modulate a target reaction. Such compounds may serve as leads for drugs or chemical probes. Assays for HTS are mostly based on optical detection methods, especially fluorescence in plate readers; however, label-free analysis has gained increasing attention in recent years.1, 2 Performing assays without incorporating artificial labels is beneficial in several ways: minimal manipulation or modification of the reaction components required, fewer assay artifacts such as auto-fluorescence from test compounds or interference of the bulky fluorophores with the assay, relatively simpler assay development, and less reagent cost for large-scale application.3, 4 A powerful technique for label-free analysis is mass spectrometry (MS). In this work, we describe a novel assay for sirtuin 1 (SIRT1) based on droplet electrospray ionization (ESI)-MS that is suitable for HTS.
MS is attractive as a technique for HTS because it offers high selectivity based on resolving analytes by mass to charge ratio, high sensitivity, rapid scanning, and multi-analyte detection.5–8 The potential high analysis rate of MS is often compromised by slow sample introduction approaches or the requirement of sample preparation. Previous work has shown that samples compartmentalized as droplets within an immiscible carrier fluid can be coupled to an ESI source for analysis of discrete samples with minimal carry-over.9–12 With segmented flow methods, analysis rates as high as 5 samples/s have been demonstrated.13 Another advantage of the droplet platform is that it enables use of nanoliter or smaller volumes, thus reducing reagent costs in a screen. Furthermore, droplet microfluidics has rapidly evolved so that now nanoliter scale samples can be manipulated enabling reactions and other functions to be performed with high speed, precision, and automation.14–16 Previously, screens for modulators of acetylcholinesterase and cathepsin B have been carried out using a droplet-ESI-MS system.17, 18
Successful implementation of ESI-MS for screening requires development of assay conditions that are appropriate. In this work we describe an assay for SIRT1 and demonstrate its use in screening an 80 compound library. Sirtuins are a class of evolutionarily conserved NAD+-dependent deacetylases which control a wide range of core cellular processes including gene expression, metabolism, cell cycle and life span. Sirtuin expression is responsive to diet and environmental stress.19, 20 SIRT1, one of the seven mammalian sirtuins, deacetylates various transcription factors and enzymes to regulate chromatin structure, transcription, apoptosis, tumorigenesis, energy expenditure, and oxidative stress. SIRT1 relieves metabolic dysfunction in numerous tissues, including liver, muscle, heart, and fat tissue.19, 20 In vivo studies have shown that overexpression or increasing the activity of SIRT1 can prolong murine lifespan, suppress certain types of cancer, and ameliorate aging-related diseases including type 2 diabetes and neurodegenerative diseases.19, 21–23
Because of the promising therapeutic value of SIRT1 activation, extensive searches for SIRT1 modulators have been carried out. A series of SIRT1 activating compounds (STACs) have been discovered by using a fluorescent screening. These STACs exert their effects by promoting substrate-protein binding.22 Most of these STACs are plant-based polyphenols, including resveratrol. In the fluorescent assay, the peptide substrate comprises amino acids 379–382 of human p53 (Arg-His-Lys-Lys(Ac)) and was engineered with a fluorogenic tag (aminomethylcoumarin) close to the Lys(Ac). Deacetylation by SIRT1 liberates the side chain amine of lysine, which allows a fluorophore to be produced after reacting with a fluorescent developer in the second step.24 The intensity of the fluorescence is proportional to the level of deacetylation.22 Compounds discovered by such assay have been shown to improve metabolic syndrome.23, 25–30 However, further investigation of the activation mechanism revealed that STACs enhances the binding and deacetylation of the fluorogenic substrate, but has no impact on the unlabeled peptide substrate.19, 31–34 Later studies suggested that the bulky, hydrophobic fluorophore is indispensable in mediating the activation of SIRT1,24, 35 which might mimic hydrophobic moieties of certain natural substrates. The issues surrounding the fluorescent assay suggest that a label-free screen of SIRT1 could be of value in identifying or verifying new STACs.
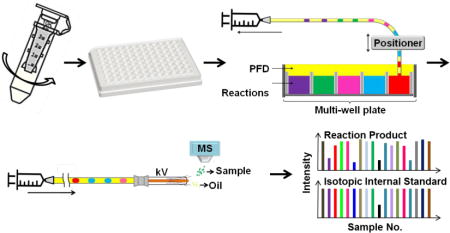
In this work, we sought to develop a label-free SIRT1 assay which can be analyzed by droplet-ESI-MS without sample preparation. SIRT1 was dialyzed into an ESI-compatible formate buffer prior to the screening. Reactions were then carried out in the formate buffer, instead of the commonly used Tris buffer. Afterwards, samples in a multi-well plate were reformatted into oil-segmented nanoliter droplets and finally analyzed by ESI-MS (Fig. 1). The assay was tested by a pilot screen involving 80 test compounds with known properties. Strong inhibitor hits were validated by dose response experiments. The results suggest that this approach is suitable for HTS for SIRT1 modulators and could be generalized to other enzymes.
Fig. 1.
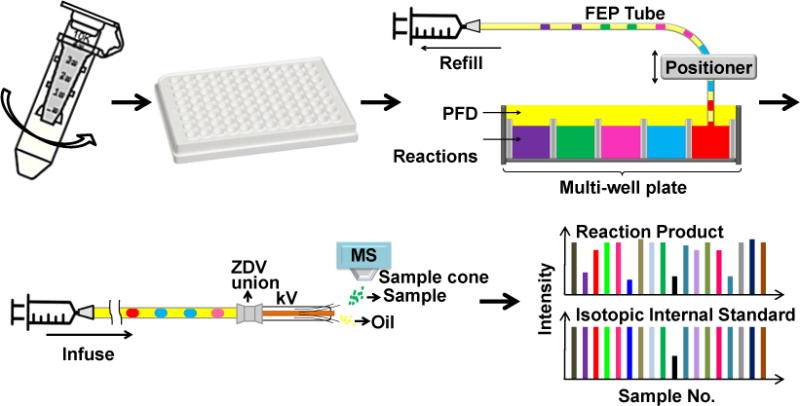
Diagram of SIRT1 assay: SIRT1 was dialyzed from Tris buffer into formate buffer using a centrifugal dialysis unit; the deacetylation reactions were conducted in formate buffer in a multi-well plate; reaction mixtures were reformatted into oil-segmented droplets in a piece of fluorinated ethylene propylene (FEP) tubing; finally, droplets were infused into an orthogonal ESI source through a modified ESI needle. The FEP tube and the needle were connected by a zero dead volume (ZDV) union. The signal intensity of the reaction product and its isotopic internal standard were monitored. Oil segment did not generate ESI signal thus showed as spacing between sample droplets
2. Experimental
Chemicals and materials
Unless otherwise specified, all solvents were purchased from Honeywell, Burdick, & Jackson (Muskegon, MI, USA) and were certified ACS grade or better. Reagents were purchased from Sigma Aldrich (St. Louis, MO, USA). Human recombinant SIRT1 and Epigenetic Screening Library were purchased from Cayman Chemical (Ann Arbor, MI, USA). Histone H3K9(Ac) and H3K9 were purchased from Anaspec (Fremont, CA, USA). Isotope-labeled H3K9 was synthesized using standard Fmoc solid phase peptide synthesis and purified using RP-HPLC by the Neil Marsh lab, University of Michigan.
SIRT1 assay by direct infusion ESI-MS
SIRT1 purchased from the supplier is dissolved in 50 mM Tris-HCl and 140 mM total inorganic salts, pH 8.0. Because such buffer is incompatible with direct ESI-MS analysis, SIRT1 was buffer exchanged into an MS-compatible buffer (200 mM ammonium formate and 200 μM dithiothreitol (DTT), pH adjusted to 8.0 by ammonium hydroxide) using an Amicon Ultra-0.5 mL (EMD Millipore, Billerica, MA, USA) dialysis membrane with 50 kDa molecular weight cut-off. 50 μL SIRT1 (1 mg/mL) was dialyzed against 500 μL formate buffer twice. The collected SIRT1 was then diluted by the new buffer to 0.5 μM. The procedure was conducted at 4 °C.
An unlabeled 21-mer acetylated peptide, H3K9(Ac), (ARTKQTARK(Ac)STGGKAPRKQLA) was selected as the substrate. This peptide was diluted to 200 μM using the same ammonium formate buffer. The reaction was performed by mixing dialyzed SIRT1 with the substrate and then incubating at 37 °C for designated time. The final concentration of SIRT1 was 0.5 μM, H3K9(Ac) 20 μM. The deacetylation product is H3K9 (ARTKQTARKSTGGKAPRKQLA) (Fig. 2). Reactions were terminated by equal volume of quenching reagents consisting of 50% methanol, 50% water, 0.2% formic acid (v/v) and 10 μM isotope-labeled H3K9 (H3K9*, three Ala-D3 and two Gly-D2, +12 Da), which was included as an internal standard.
Fig. 2.
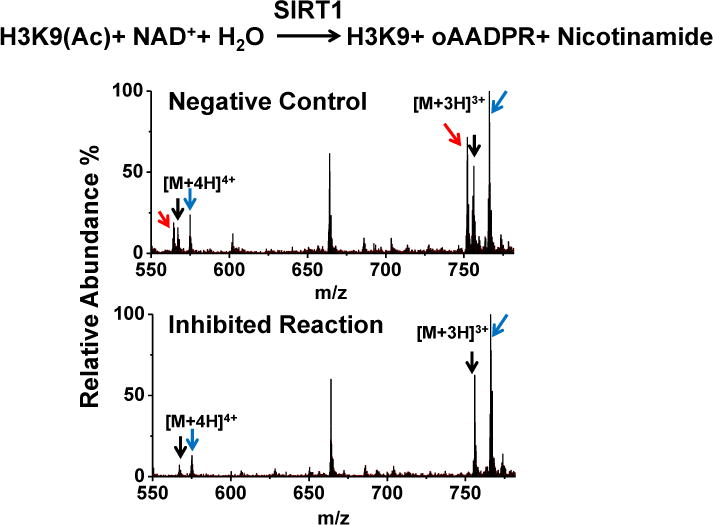
Deacetylation of H3K9(Ac) by SIRT1. The reaction is shown on the top (NAD+ stands for nicotinamide adenine dinucleotide; oAADPR stands for O-acetyl-ADP-ribose). The mass spectra are from a reaction without any modulator (negative control) and a reaction with an inhibitor. Triply charged and quadruply charged H3K9 (red arrow), H3K9* (black arrow) and H3K9(Ac) (blue arrow) are monitored. Intensity ratio of H3K9 (m/z 564.4 + m/z 752.6)/H3K9* (m/z 567.3 + m/z 756.1) is calculated for quantification.
The linearity of the reaction rate was assessed by a series of assays incubated for 0, 15, 30, 60, 90, 120 min. Each assay contained a final concentration of 0.5 μM SIRT1 and 20 μM H3K9(Ac). Michaelis–Menten kinetics were measured by varying H3K9(Ac) concentration from 0 to 160 μM while quenching the reaction at different times from 0 to 120 min. The Km value was determined by fitting the data to a Michaelis-Menten model using GraphPad Prism 6.01. The detection of product H3K9 was calibrated by measuring the intensity ratio of H3K9 over H3K9*.
SIRT1 assay by HPLC-MS
To compare the reaction yield for SIRT1 assay performed in the conventional Tris buffer and the formate buffer, the resulting samples were analyzed by LC-MS. The reaction mixtures were incubated for 4 hours at 37°C. The HPLC column was prepared in house by packing a 8 cm fused-silica capillary (75 μm i.d./360 μm o.d.) with 5 μm C18 particle.36 Mobile phase A was 0.15% formic acid aqueous solution. Mobile phase B was methanol. The linear gradient was programmed as: initial, 0% B; 10 min, 50% B; 15 min, 50% B; 18 min, 95% B; 20 min, 100% B. The MS was operating at full scan mode. The m/z of the substrate H3K9(Ac) (575.4 and 766.5) and the product H3K9 (564.4 and 752.6) was extracted.
Epigenetic Library Screening
The screening was performed in part of a 384-well plate (Greiner Bio-one, Monroe, NC, USA), in 8 × 13 format. Screening conditions were determined based on the assay development. 50 μL SIRT1 at 11 μM was dialyzed against 500 μL formate buffer twice, and then diluted to 650 μL by the formate buffer. Column 1, 6 and 13 had 1 μL 10% DMSO added as a negative control, i.e. no enzyme. Column 2–5 and 7–12 had 1 μL of test compound at 200 μM in 10% DMSO from the Epigenetic Screening Library added. 6 μL of SIRT1 diluted in formate was then added to each well by Matrix Electronic Multichannel Pipette (Thermo Scientific, Waltham, MA, USA). Afterwards, 3 μL of 67 μM H3K9(Ac) was deposited into each well. The final concentrations were 20 μM test compounds, 0.5 μM SIRT1, and 20 μM H3K9(Ac). Each reaction contained 1% DMSO. Reactions were incubated at 37 °C for 1.5 hours and then quenched with 10 μL ice-cold quenching reagent.
Droplet-MS Analysis
Reaction mixtures were first transferred into a modified 384-well plate,13 and then reformatted into oil-segmented droplets which were stored in a piece of fluorinated ethylene propylene (FEP) tubing. The procedure has been previously described.13 Briefly, a syringe pump operating in aspirate mode was used to pull fluid into the FEP tubing. The inlet tip of the FEP was moved from well-to-well to draw up assay samples alternated with an equal volume of an immiscible carrier fluid, perfluorodecalin. Each reaction was collected as 3 droplets of 100 nL each. The size of droplet and perfluorodecalin spacer was controlled by adjusting the pulling rate of the syringe pump, as well as the movement of the FEP tube. In this experiment, the syringe was pulled at 4 μL/min; the tube dwelled in sample for ~1.5 s, and in oil for ~1.25 s.
To analyze the droplet contents, FEP tubing content was pumped into the source through a custom ESI needle at 10 μL/min.37 MS analysis was performed using a Micromass Quattro Ultima triple quadrupole MS (Waters Corporation, Milford, MA) in full scan mode (m/z 550–785). The scan time was set as 0.05 s. The ESI voltage was +3.0 kV. Droplet traces were acquired by MassLynx 4.0. The intensity of [M+3H]3+ (m/z 752.6) and [M+4H]4+ (m/z 564.6) ions of the product H3K9 and isotopic standard H3K9* (m/z 756.3 and 567.4) were measured for quantifying the reaction yield (Fig. 2). Data was analyzed using Origin 8.5.
Dose dependent experiment
Compounds that reduced the reaction yield by more than 50% were selected as strong inhibitor hits. A series of reactions containing a concentration range of the hits were performed (Fig. 6). Each reaction consisted of final concentration of 0.5 μM SIRT1 and 20 μM H3K9(Ac). After incubation at 37 °C for 1 hour, reactions were stopped by ice-cold quenching reagents with 20 μM H3K9*, and then analyzed in droplet format. The dose response curves were fitted using GraphPad Prism 6.01.
Fig. 6.
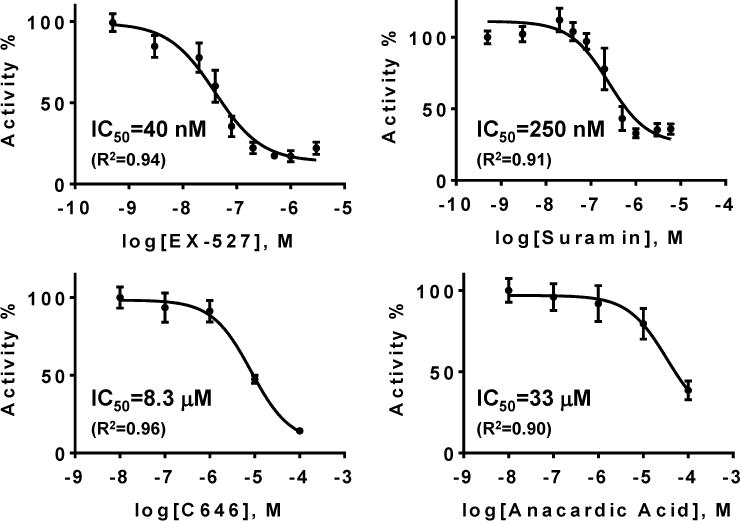
Dose response curves of 4 inhibitor hits. Negative control of each experiments were normalized to 100% activity (n=2).
Activator evaluation
The impact of resveratrol and piceatannol on SIRT1 were studied in the conventional Tris buffer (50 mM Tris-HCl and 140 mM total inorganic salts). 30 μM of test compounds: resveratrol, piceatannol, EX-527, suramin, C646 and nicotinamide were added to 0.5 μM SIRT1 and 20 μM H3K9(Ac). Reactions were quenched at 1 and 1.5 hours. The reaction mixtures were desalted by Pierce™ C18 Spin Columns (Thermo Scientific) and re-consituted into 30% MeOH and 0.1% formic acid aqueous solution. Desalted reaction mixtures were reformatted into droplets and analyzed by direct infusion ESI-MS using the same instrument parameters described above.
3. Results and discussion
MS based H3K9(Ac)-SIRT1 MS assay
Acetylated histone H3-Lys9 is a natural SIRT1 substrate, which comprises of over 200 amino acids. In our study, a 21 amino acid peptide sequence containing the acetylated Lys9 (H3K9) was selected as the substrate for the assay. Smaller peptides might not react similarly as the whole protein with the SIRT1 catalytic site; however larger peptides will challenge the sensitivity and quantification of MS. Because our selected substrate is not labeled, it avoids potential interference from artificially engineered tags. The SIRT1 we used in the assay was the full length protein, which may allow discovery of allosteric modulators as well as compounds that act directly at the active site.
To enable high throughput analysis of individual droplet sample, direct ESI-MS analysis was used. An isotope-labeled H3K9* was added to the final reaction mixture as an internal standard to account for possible effects of test compounds on peptide ionization and signal drift. In the direct infusion ESI-MS mode, all reaction components were detected in a single mass spectrum. Due to the implementation of the ammonium formate buffer, matrix effect was considerably mitigated. H3K9 and H3K9* are multiply charged in the full scan MS (Fig. 2). Charge states from [M+7H]7+ to [M+3H]3+ were observable. In principle, detection of all ions could be used for screening; however, scanning a wide mass range compromises the analysis rate. We found that the [M+4H]4+ and the [M+3H]3+ peaks dominate the mass spectrum and the sum of their intensity can be linearly calibrated with peptide concentration. Therefore we narrowed down the scan range to m/z 550–785 to detect only these charge states during a screen. The scan time was set as 0.05 s to ensure adequate ion abundance.
Buffer exchange for SIRT1
Enzymatic reactions are often conducted in solutions that contain a variety of non-volatile salts, such as NaCl and K2HPO4, at millimolar concentrations. Such components may affect the ESI process and severely suppress the signal of analytes. Some other components, such as Tris or glycerol compete for the charge on the surface of the ESI droplets with target analytes, especially when these components are very concentrated. To make the SIRT1 reaction directly analyzable by ESI-MS, we developed a reaction buffer containing a volatile salt ammonium formate and a small molecule reducing agent DTT which would keep the enzyme in the reduced state and at the same time not interfere with ESI-MS signals.18
A spin dialysis unit was chosen for buffer exchange due to its high speed and efficiency. The dialysis was performed at 4 °C to prevent heating of the protein during centrifugation. We found that one spinning unit can dialyze 50 μL of SIRT1 (~50 μg) with sufficient desalting effect and recovery. For complete removal of salts and other interferences, 50 μL SIRT1 was dialyzed against 500 μL formate buffer for twice. We explored several combinations of centrifugal force and centrifuging time and found that using 8000 g (~11000 rpm for Eppendorf 12-place minispin) and 4 min/spin, SIRT1 could be completely desalted, and its activity was maintained to the largest extent.
Ammonium formate buffer for SIRT1 assay
We compared the deacetylation activity of SIRT1 before and after buffer exchange to determine if the use of a volatile buffer affected the enzyme reaction. The reaction yield was nearly 100% after 4 hour incubation in the original Tris buffer and about 90% in the formate buffer (See the total ion current in Fig. 3). This result suggests that the desalting process does not adversely affect the activity of the enzyme and the reaction runs efficiently in the formate buffer. Previous studies in our group showed that some enzymes can maintain their activities in ESI-compatible buffers.13, 17, 18 Other researchers have also studied native structures of proteins or have conducted enzymatic assays in such buffers.38–40 It is reasonable to conclude that Tris and other components are not essential to this protein for both its structure and catalytic ability. Other enzymes which do not have strict requirements for buffers or salts might also react in such condition, thus allowing direct ESI-MS analysis.
Fig. 3.
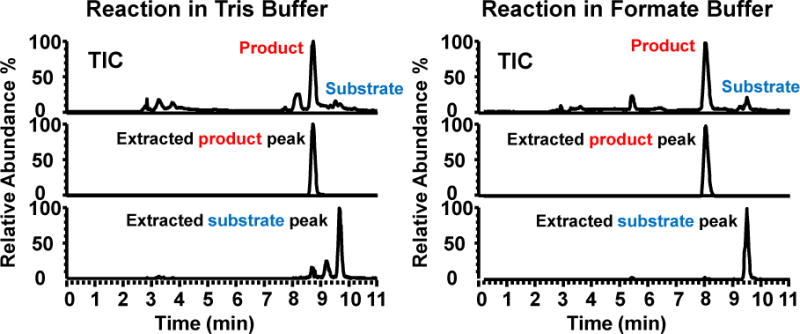
Left: Mass chromatograms of the assay sample in end of reaction in the Tris buffer (4 hours). Observed from total ion current (TIC), nearly 100% yield was achieved. The product peak and substrate peak were extracted to confirm the retention time. Right: Mass chromatograms of the assay sample in end of reaction in the ammonium formate buffer (4 hours).
Assay condition optimization
It is necessary to study the kinetics of an enzyme before screening for modulators. Competitive or reversible activators and inhibitors are of most interest because they are usually less toxic than irreversible ones. Performing the assay under its initial velocity conditions increases the sensitivity to the desired modulators. The concentration of the substrate needs to be under or equal its Km value so that it will not saturate the catalytic site of the protein. The reaction time should be limited to when the product is accumulating linearly, by that time the substrate has not been largely converted into product and the reverse reaction does not significantly affect the turnover rate.2
We studied SIRT1 kinetics by conducting a set of assays starting with different substrate concentrations and being quenched at a range of times. We found that the Km value of H3K9(Ac) is 22 μM (in agreement with previous reports of Km ~ 40 μM24) (Fig. 4a). For 0.5 μM SIRT1, the reaction yield grows linearly for up to 2 hours when H3K9(Ac) is 20 μM (Fig. 4b). Therefore, we decided to use 20 μM H3K9(Ac) and 1.5 h incubation for the screening.
Fig. 4.

a) Michaelis-Menten model of H3K9(Ac) with 0.5 μM SIRT1. The fitted Km value is 22 μM. b) Linear reaction within 2 h. c) Linear calibration curve of 0 to 25 μM H3K9. Intensity ratio of H3K9 to H3K9* was measured (n = 3).
Linear response for the target analyte is crucial. In the SIRT1 assay, we monitored H3K9 and its isotopic internal standard. The intensity ratio of H3K9 over H3K9* increases linearly with up to 25 μM H3K9 (R2> 0.99) (Fig. 4c).
Screening
The assay conditions were tested by a screening against a library consisting of 80 known epigenetic modulators. Another 24 reactions only containing 1% DMSO (i.e., not test compound) were assayed as negative controls. The controls were placed at the beginning, in the middle, and at the end of the screening sequence. For our screening, each test compound was present at 20 μM which is within the typical concentration range of 10–30 μM used for HTS. Use of low concentrations will rule out weak modulators and avoids problems of aggregation and precipitation; however, too low of a concentration may miss moderately active compounds that could be of interest. The concentration of H3K9(Ac) and incubation time were determined based on the enzyme kinetic studies as discussed above. A matrix multichannel pipette was utilized for rapid and reproducible reagents dispensing so that the start time of all reactions could be as close as possible. The similar intensity ratio of H3K9 over H3K9* of all negative controls suggests simultaneous reaction initiation (Fig. 5a), thus the yield in test reactions can be compared with the control.
Fig. 5.
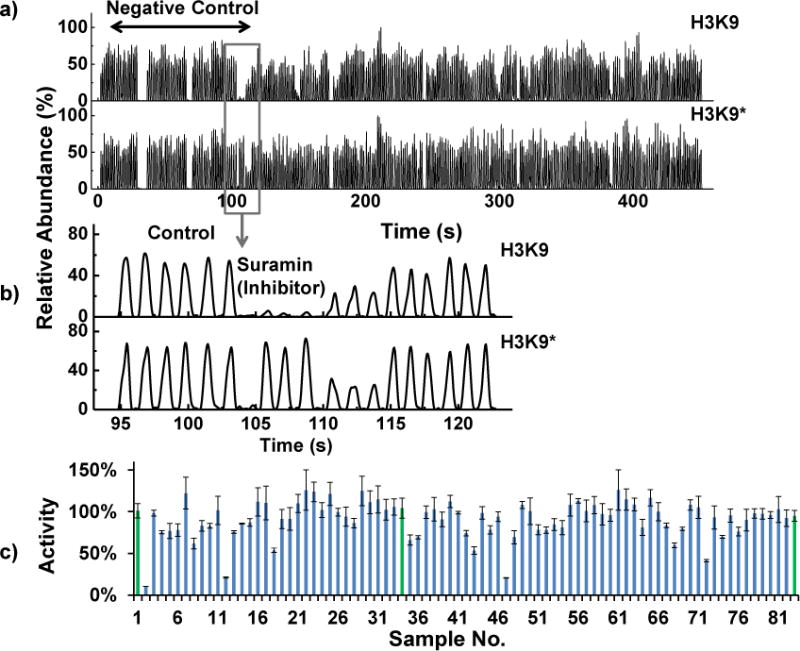
Epigenetic library screening: a) Raw droplet traces of the screening. The upper trace is the reaction product H3K9, and the lower one is the isotope-labeled internal standard H3K9*. The first 3 sets are negative controls at the beginning, in the middle, and at the end of the assay plate, respectively. b) Enlarged view of a control, reaction containing suramin, and some other test reactions droplets. c) The final analysis of the screening. Each bar is the averaged H3K9/H3K9* of an assay. The negative control (green) is normalized to 100% enzyme activity. Four reactions showed that the enzyme activity was lowered by more than 50% (n=3).
After the assay reactions were quenched, the 104 reactions were formatted into droplets (3 droplets per sample resulting in 312 total droplets in total). Replicates are desirable because they provide backup data if signal spikes or occasional fluctuation affect the detection of a single droplet. Droplets were detected by MS in a full scan mode. We found stable signals for these assay mixtures (Fig. 5a). The detection of all 312 droplets took 5 min (0.8 samples/s). As shown in Figure 5, several examples with low H3K9/H3K9* were observed indicating potential inhibitors in the library (Fig. 5b, 5c). The assay was reliable as the Z-factor was 0.7. The isotopic internal standard is valuable for extending the linear range of MS for the target analyte, and correcting any potential impact of test compound on the analyte in the ESI-MS process.
Among the 80 test compounds, 4 inhibitors reduced the yield by more than 50%. They are: suramin, EX-527, C646 and anacardic acid. Suramin and EX-527 are known SIRT1 inhibitors.41–43 Anacardic acid has recently been found to have potential to inhibit sirtuins.44, 45 Inhibition by C646 has not been reported yet. Their inhibitory potency was evaluated by dose response experiments (Fig. 6). The fitted IC50 of EX-527 and suramin agree with the published values (EX-527: 100 nM;43 suramin: 300 nM41). A few known SIRT1 inhibitors in the library, for e.g., nicotinamide and salermide, were not picked as strong hits (> 50% inhibition), which is consistent with their relatively high IC50’s (nicotinamide: 85 μM, salermide: 76 μM)42.
Compounds were considered activators if the elevated the yield by more than 50%, compared with the negative control. In this screening, no compound met this criterion, which means there is no direct or allosteric SIRT1 activator in this library (Fig. 5c). The Epigenetic Library includes resveratrol and piceatannol, both of which were found to be SIRT1 activators by using a fluorescent assay (increasing the turnover rate by at least 3 times22, 24). However, the result of our MS assay agrees with other label-free assays32, 33 which did not find activation using unlabeled substrates.
To confirm that the claimed activators have no effect upon SIRT1, and to avoid the potential influence of formate buffer, activation assays with resveratrol and piceatannol were performed in conventional Tris buffer. The yield of activation reactions (5 is resveratrol and 6 is piceatannol) was compared with those containing inhibitors (1 to 4) and DMSO control (C) at 1 and 1.5 hours (Fig. 7). It is clear that resveratrol and piceatannol did not increase the reaction yield at either time point.
Fig 7.
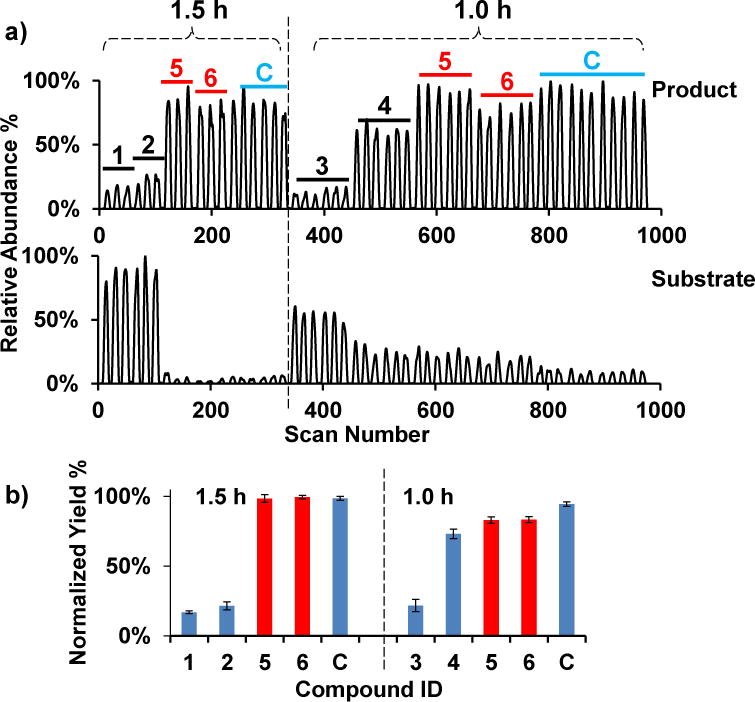
a) Droplet traces the product (top) and the substrate (bottom) of SIRT1 assay in 1.5 h (left, ≥3 droplets each) and 1.0 h (right, ≥6 droplets each) reactions. Droplet signals for 1, 2, 3, 4, 5, and 6 are EX-527, suramin, C646, nicotinamide, resveratrol, and piceatannol respectively. C is the DMSO control. The reaction mixtures were cleaned up by C18 solid phase extraction columns prior to reformatting into droplets. b) Data from a) are reported as the ratio of peak height of the product against the sum of product and substrate, and then normalized to the yield of control reactions at 1.5 h (n ≥ 3). The bars are labeled with the same numbers and letters as a). The red bars are resveratrol and piceatannol reactions.
4. Conclusion
We have developed a label-free SIRT1 assay in which the assay mixtures can be directly analyzed by ESI-MS. A pilot screen against 80 test compounds demonstrated the good throughput (0.8 samples/s) and high reliability (Z-factor = 0.7) of the assay. The approach can be generalized to any enzyme that maintains good activity in the described MS-compatible condition. The wide applicability of ESI-MS makes possible the detection of a variety of reaction products. This method can be complementary to, but faster and more economical than, solid-phase extraction ESI-MS screening platforms46. Future directions include applying the label-free SIRT1 assay to large scale SIRT1 modulator screening in search of molecules that directly interact with SIRT1. Other MS-compatible conditions can be explored to further broaden the universality of this concept.
Highlights.
A reliable, label-free, ion suppression-free Sirtuin 1 assay has been developed. By interfacing multi-well plates to electrospray ionization mass spectrometry by oil-segmented droplets, the assay can be applied for high throughput Sirtuin 1 modulator screening.
Acknowledgments
This work was supported by NIH R01-GM102236.
References
- 1.Gomez-Hens A, Aguilar-Caballos MP. Trac-Trends Anal Chem. 2007;26:171–182. [Google Scholar]
- 2.Inglese J, Johnson RL, Simeonov A, Xia M, Zheng W, Austin CP, Auld DS. Nat Chem Biol. 2007;3:466–479. doi: 10.1038/nchembio.2007.17. [DOI] [PubMed] [Google Scholar]
- 3.Shiau AK, Massari ME, Ozbal CC. Comb Chem High Throughput Screen. 2008;11:231–237. doi: 10.2174/138620708783877807. [DOI] [PubMed] [Google Scholar]
- 4.Cunningham BT, Laing LG. Expert Opin Drug Discov. 2008;3:891–901. doi: 10.1517/17460441.3.8.891. [DOI] [PubMed] [Google Scholar]
- 5.Lunn CA. Future Med Chem. 2010;2:1703–1716. doi: 10.4155/fmc.10.246. [DOI] [PubMed] [Google Scholar]
- 6.Zehender H, Mayr LM. Curr Opin Chem Biol. 2007;11:511–517. doi: 10.1016/j.cbpa.2007.08.031. [DOI] [PubMed] [Google Scholar]
- 7.de Boer AR, Letzel T, van Elswijk DA, Lingeman H, Niessen WMA, Irth H. Anal Chem. 2004;76:3155–3161. doi: 10.1021/ac035380w. [DOI] [PubMed] [Google Scholar]
- 8.de Boer AR, Lingeman H, Niessen WMA, Irth H. Trac-Trends Anal Chem. 2007;26:867–883. [Google Scholar]
- 9.Kelly RT, Page JS, Marginean I, Tang K, Smith RD. Angew Chem Int Ed. 2009;48:6832–6835. doi: 10.1002/anie.200902501. [DOI] [PMC free article] [PubMed] [Google Scholar]
- 10.Fidalgo LM, Whyte G, Ruotolo BT, Benesch JLP, Stengel F, Abell C, Robinson CV, Huck WTS. Angew Chem Int Ed. 2009;48:3665–3668. doi: 10.1002/anie.200806103. [DOI] [PubMed] [Google Scholar]
- 11.Zhu Y, Fang Q. Anal Chem. 2010;82:8361–8366. doi: 10.1021/ac101902c. [DOI] [PubMed] [Google Scholar]
- 12.Pei J, Li Q, Lee MS, Valaskovic GA, Kennedy RT. Anal Chem. 2009;81:6558–6561. doi: 10.1021/ac901172a. [DOI] [PMC free article] [PubMed] [Google Scholar]
- 13.Sun S, Kennedy RT. Anal Chem. 2014;86:9309–9314. doi: 10.1021/ac502542z. [DOI] [PMC free article] [PubMed] [Google Scholar]
- 14.Theberge AB, Courtois F, Schaerli Y, Fischlechner M, Abell C, Hollfelder F, Huck WTS. Angew Chem Int Ed. 2010;49:5846–5868. doi: 10.1002/anie.200906653. [DOI] [PubMed] [Google Scholar]
- 15.Chiu DT, Lorenz RM. Acc Chem Res. 2009;42:649–658. doi: 10.1021/ar8002464. [DOI] [PMC free article] [PubMed] [Google Scholar]
- 16.Price AK, MacConnell AB, Paegel BM. Anal Chem. 2014;86:5039–5044. doi: 10.1021/ac500693r. [DOI] [PMC free article] [PubMed] [Google Scholar]
- 17.Pei J, Li Q, Kennedy RT. J Am Soc Mass Spectrom. 2010;21:1107–1113. doi: 10.1016/j.jasms.2010.02.013. [DOI] [PubMed] [Google Scholar]
- 18.Sun S, Slaney TR, Kennedy RT. Anal Chem. 2012;84:5794–5800. doi: 10.1021/ac3011389. [DOI] [PubMed] [Google Scholar]
- 19.Hall JA, Dominy JE, Lee Y, Puigserver P. J Clin Invest. 2013;123:973–979. doi: 10.1172/JCI64094. [DOI] [PMC free article] [PubMed] [Google Scholar]
- 20.Chang H, Guarente L. Trends Endocrinol Metab. 2014;25:138–145. doi: 10.1016/j.tem.2013.12.001. [DOI] [PMC free article] [PubMed] [Google Scholar]
- 21.Satoh A, Brace Cynthia S, Rensing N, Cliften P, Wozniak David F, Herzog Erik D, Yamada Kelvin A, Imai S-i. Cell Metab. 2013;18:416–430. doi: 10.1016/j.cmet.2013.07.013. [DOI] [PMC free article] [PubMed] [Google Scholar]
- 22.Howitz KT, Bitterman KJ, Cohen HY, Lamming DW, Lavu S, Wood JG, Zipkin RE, Chung P, Kisielewski A, Zhang LL, Scherer B, Sinclair DA. Nature. 2003;425:191–196. doi: 10.1038/nature01960. [DOI] [PubMed] [Google Scholar]
- 23.Hubbard BP, Sinclair DA. Trends Pharmacol Sci. 2014;35:146–154. doi: 10.1016/j.tips.2013.12.004. [DOI] [PMC free article] [PubMed] [Google Scholar]
- 24.Hubbard BP, Gomes AP, Dai H, Li J, Case AW, Considine T, Riera TV, Lee JE, Lamming SYEDW, Pentelute BL, Schuman ER, Stevens LA, Ling AJY, Armour SM, Michan S, Zhao H, Jiang Y, Sweitzer SM, Blum CA, Disch JS, Ng PY, Howitz KT, Rolo AP, Hamuro Y, Moss J, Perni RB, Ellis JL, Vlasuk GP, Sinclair DA. Science. 2013;339:1216–1219. doi: 10.1126/science.1231097. [DOI] [PMC free article] [PubMed] [Google Scholar]
- 25.Milne JC, Lambert PD, Schenk S, Carney DP, Smith JJ, Gagne DJ, Jin L, Boss O, Perni RB, Vu CB, Bemis JE, Xie R, Disch JS, Ng PY, Nunes JJ, Lynch AV, Yang HY, Galonek H, Israelian K, Choy W, Iffland A, Lavu S, Medvedik O, Sinclair DA, Olefsky JM, Jirousek MR, Elliott PJ, Westphal CH. Nature. 2007;450:712–716. doi: 10.1038/nature06261. [DOI] [PMC free article] [PubMed] [Google Scholar]
- 26.Lagouge M, Argmann C, Gerhart-Hines Z, Meziane H, Lerin C, Daussin F, Messadeq N, Milne J, Lambert P, Elliott P, Geny B, Laakso M, Puigserver P, Auwerx J. Cell. 2006;127:1109–1122. doi: 10.1016/j.cell.2006.11.013. [DOI] [PubMed] [Google Scholar]
- 27.Feige JN, Lagouge M, Canto C, Strehle A, Houten SM, Milne JC, Lambert PD, Mataki C, Elliott PJ, Auwerx J. Cell Metab. 2008;8:347–358. doi: 10.1016/j.cmet.2008.08.017. [DOI] [PubMed] [Google Scholar]
- 28.Mitchell SJ, Martin-Montalvo A, Mercken EM, Palacios HH, Ward TM, Abulwerdi G, Minor RK, Vlasuk GP, Ellis JL, Sinclair DA, Dawson J, Allison DB, Zhang YQ, Becker KG, Bernier M, de Cabo R. Cell Reports. 2014;6:836–843. doi: 10.1016/j.celrep.2014.01.031. [DOI] [PMC free article] [PubMed] [Google Scholar]
- 29.Yi YW, Kang HJ, Kim HJ, Kong YL, Brown ML, Bae I. Oncotarget. 2013;4:984–994. doi: 10.18632/oncotarget.1070. [DOI] [PMC free article] [PubMed] [Google Scholar]
- 30.Yamazaki Y, Usui I, Kanatani Y, Matsuya Y, Tsuneyama K, Fujisaka S, Bukhari A, Suzuki H, Senda S, Imanishi S, Hirata K, Ishiki M, Hayashi R, Urakaze M, Nemoto H, Kobayashi M, Tobe K. Am J Physiol-Endocrinol Metab. 2009;297:E1179–E1186. doi: 10.1152/ajpendo.90997.2008. [DOI] [PubMed] [Google Scholar]
- 31.Kaeberlein M, McDonagh T, Heltweg B, Hixon J, Westman EA, Caldwell SD, Napper A, Curtis R, DiStefano PS, Fields S, Bedalov A, Kennedy BK. J Biol Chem. 2005;280:17038–17045. doi: 10.1074/jbc.M500655200. [DOI] [PubMed] [Google Scholar]
- 32.Pacholec M, Chrunyk BA, Cunningham D, Flynn D, Griffith DA, Griffor M, Loulakis P, Pabst B, Qiu X, Stockman B, Thanabal V, Varghese A, Ward J, Withka J, Ahn K. J Biol Chem. 2010 doi: 10.1074/jbc.M109.088682. [DOI] [PMC free article] [PubMed] [Google Scholar]
- 33.Beher D, Wu J, Cumine S, Kim KW, Lu S, Atangan L, Wang M. Chem Biol Drug Des. 2009;74:619–624. doi: 10.1111/j.1747-0285.2009.00901.x. [DOI] [PubMed] [Google Scholar]
- 34.Borra MT, Smith BC, Denu JM. J Biol Chem. 2005;280:17187–17195. doi: 10.1074/jbc.M501250200. [DOI] [PubMed] [Google Scholar]
- 35.Dai H, Kustigian L, Carney D, Case A, Considine T, Hubbard B, Perni R, Riera T, Szczepankiewicz B, Vlasuk G, Stein R. J Biol Chem. 2010;285:32695–32703. doi: 10.1074/jbc.M110.133892. [DOI] [PMC free article] [PubMed] [Google Scholar]
- 36.Zhou Y, Mabrouk O, Kennedy R. J Am Soc Mass Spectrom. 2013;24:1700–1709. doi: 10.1007/s13361-013-0605-1. [DOI] [PMC free article] [PubMed] [Google Scholar]
- 37.Song P, Hershey ND, Mabrouk OS, Slaney TR, Kennedy RT. Anal Chem. 2012;84:4659–4664. doi: 10.1021/ac301203m. [DOI] [PMC free article] [PubMed] [Google Scholar]
- 38.Zhong Y, Han L, Ruotolo BT. Angew Chem Int Ed. 2014;53:9209–9212. doi: 10.1002/anie.201403784. [DOI] [PubMed] [Google Scholar]
- 39.Zhang H, Cui W, Gross ML, Blankenship RE. FEBS Letters. 2013;587:1012–1020. doi: 10.1016/j.febslet.2013.01.005. [DOI] [PMC free article] [PubMed] [Google Scholar]
- 40.Rabuck JN, Hyung SJ, Ko KS, Fox CC, Soellner MB, Ruotolo BT. Anal Chem. 2013;85:6995–7002. doi: 10.1021/ac4012655. [DOI] [PMC free article] [PubMed] [Google Scholar]
- 41.Trapp J, Meier R, Hongwiset D, Kassack MU, Sippl W, Jung M. ChemMedChem. 2007;2:1419–1431. doi: 10.1002/cmdc.200700003. [DOI] [PubMed] [Google Scholar]
- 42.Peck B, Chen CY, Ho KK, Di Fruscia P, Myatt SS, Coombes RC, Fuchter MJ, Hsiao C, Lam EW. Mol Cancer Ther. 2010;9:844–855. doi: 10.1158/1535-7163.MCT-09-0971. [DOI] [PubMed] [Google Scholar]
- 43.Napper AD, Hixon J, McDonagh T, Keavey K, Pons JF, Barker J, Yau WT, Amouzegh P, Flegg A, Hamelin E, Thomas RJ, Kates M, Jones S, Navia MA, Saunders JO, DiStefano PS, Curtis R. J Med Chem. 2005;48:8045–8054. doi: 10.1021/jm050522v. [DOI] [PubMed] [Google Scholar]
- 44.Sacconnay L, Angleviel M, Randazzo GM, Marçal Ferreira Queiroz M, Ferreira Queiroz E, Wolfender JL, Carrupt PA, Nurisso A. PLoS Negl Trop Dis. 2014;8:e2689. doi: 10.1371/journal.pntd.0002689. [DOI] [PMC free article] [PubMed] [Google Scholar]
- 45.Ryckewaert L, Sacconnay L, Carrupt P, Nurisso A, SimõesPires C. Toxicol Lett. 2014;229:374–380. doi: 10.1016/j.toxlet.2014.07.002. [DOI] [PubMed] [Google Scholar]
- 46.Leveridge M, Buxton R, Argyrou A, Francis P, Leavens B, West A, Rees M, Hardwicke P, Bridges A, Ratcliffe S, Chung C. J Biomol Screen. 2014;19:278–286. doi: 10.1177/1087057113496276. [DOI] [PubMed] [Google Scholar]


