Abstract
During cell migration, cells become polarized, change their shape, and move in response to various internal and external cues. Cell polarization is defined through the spatio-temporal organization of molecules such as PI3K or small GTPases, and is determined by intracellular signaling networks. It results in directional forces through actin polymerization and myosin contractions. Many existing mathematical models of cell polarization are formulated in terms of reaction-diffusion systems of interacting molecules, and are often defined in one or two spatial dimensions. In this paper, we introduce a 3D reaction-diffusion model of interacting molecules in a single cell, and find that cell geometry has an important role affecting the capability of a cell to polarize, or change polarization when an external signal changes direction. Our results suggest a geometrical argument why more roundish cells can repolarize more effectively than cells which are elongated along the direction of the original stimulus, and thus enable roundish cells to turn faster, as has been observed in experiments. On the other hand, elongated cells preferentially polarize along their main axis even when a gradient stimulus appears from another direction. Furthermore, our 3D model can accurately capture the effect of binding and unbinding of important regulators of cell polarization to and from the cell membrane. This spatial separation of membrane and cytosol, not possible to capture in 1D or 2D models, leads to marked differences of our model from comparable lower-dimensional models.
1 Introduction
The ability to migrate is one of the fundamental properties of cells and is observed in both single-celled organisms as well as multicellular organisms in development, tissue maintenance, and in disease progression. For effective, directional migration, cells need to have the capability to sense and respond to various migratory signals, such as bacteria reacting to nutrients or other attractants or repellents [1, 2], cells being guided to their correct location during embryonic development [3] or immune cells migrating towards locations of injury or infection [4]. Furthermore, cell migration plays a prominent role in diseases such as cancer, where the majority of deaths are caused by metastases. Hence migration, invasion and metastasis are considered defining properties of cancer [5, 6].
External stimuli affecting cell migration include biochemical signals [7] or mechanical interactions with the environment [8, 9, 10]. One particularly interesting feature is the capability of many cells to detect spatial variations in the concentrations of biochemicals and to migrate towards, or away from the sources of such chemicals. Often, the gradients of those chemoattractants or repellents have a small slope, so cells need a mechanism to detect and magnify external biochemical stimuli [11]. Such gradient detection then enables the cells to develop a polarized state with a well defined front and back. To this purpose, chemical signals need to be translated into the generation of mechanical forces [12], which ultimately enable the cell to migrate in the direction defined by the polarized state.
In the last few decades, researchers have discovered and studied a large number of key molecules understood to play an important role in the sensing of chemical stimuli as well as the subsequent polarization, regulation of the actin cytoskeleton and generation of mechanical forces [13]. Among these molecules are small GTPases [14, 15], PI3K, PTEN, phosphatidylinositols (PIPs), [16, 17, 18], Arp2/3 [19, 20] and Cofilin [21, 22].
To understand the complexity of those pathways of interacting molecules, as well as to understand the mechanisms of sensing external gradients and polarizing a cell, a large number of mathematical models of gradient sensing and cell polarization have been developed (see [23, 24] for reviews). Whereas some of these mathematical models try to explain the general principles of signal detection, amplification and polarization [25, 26, 27], others attempt to explicitly model the dynamics and interactions between some of the most important involved molecules [28, 29, 30, 31, 32, 33, 34, 35]. Many of these models are formulated in terms of reaction-diffusion partial differential equations (PDEs) and make use of ideas such as pattern formation, which have been applied to biology for many years [36, 37, 38, 39]. Alternative modeling approaches to cell polarization include [40], where thermodynamic considerations were used to predict polarization, [41], where the effects of the interplay of biochemistry and mechanics on polarization were investigated, or [42], where stochastic cell polarization was considered. The majority of these mathematical models have been formulated, or at least tested, in one or two spatial dimensions. Simulating a model in those lower dimensions greatly decreases the computational costs, and might seem justified if one is modeling cell migration on 2D substrates or in quasi-one-dimensional scenarios such as the detection of a 1D chemical gradient.
However, when the cell has an irregular shape, it is not a priori clear that a lower dimensional mathematical model can be used. Furthermore, in 3D in vitro experiments or in vivo, stimuli can appear from all directions. An additional complication is the spatial organization of the key molecules behind cell polarization and migration: some of the regulators of the actin cytoskeleton, like the Arp2/3 complex, are soluble in the cytosol, whereas others such as phosphatidylinositols, are bound to the membrane. Moreover, some molecules such as the small GTPases can be both membrane bound and soluble, and this binding is influenced by the presence of other regulators such as guanine dissociation inhibitors (GDIs) [43]. Some mathematical models such as [44] have studied the influence of cell geometries on cell polarization and migration in two dimensions, the role of cell shape on signaling [45], the mechanical effects of shape on cell migration [46], the effect of cell shape on stress fiber polarization [47], or the effect of signaling on cell shape [48, 49], see also the review [50]. A mathematical model focusing specifically on the effect of 3D shape on cell polarization, taking into account a whole polarization pathway, has, to our knowledge, not been investigated.
In this paper, we are studying the effect of the cell shape on gradient sensing and cell polarization in a 3D mathematical reaction-diffusion model of key molecules involved in polarization. In section 2, we introduce a 3D model of GTPase molecules binding and unbinding from the membrane. We then use this framework to generalize an earlier pathway model investigating the dynamics of the small GTPases Rac, Rho and Cdc42, as well as PIP, PIP2 and PIP3, in a 1D context [33], and show how our 3D model can be reduced to such a 1D model. Then, in section 3, we explore how geometry affects the polarization capability and timescales of polarization. We first compare results of the 3D model with simple rectangular geometries to the 1D limit and highlight similarities and key differences. We also find that varying the membrane binding and unbinding rate can change the cell polarization behavior. These rates are altered by the presence of GDI molecules, and while the dynamics of GDI molecules is not included in the present model, our results suggest how GDI molecules will affect cell polarization. We then show how cells with the same volume and length can have vastly different polarization behavior if they have different geometries. Finally, since in vivo migratory stimuli rarely appear constant in time and space, but dynamically change directions and strength, we investigate how cells react to changes in stimulus, and how this reaction is influenced by geometry. We find that if ellipsoidal cells are initially polarized along their main axis, they cannot adapt to a new stimulus perpendicular to their main axis as efficiently as symmetric, roundish cells. This gives a purely geometrical explanation of the fact that roundish, amoeboid cells can quickly turn and adopt to new stimuli. Furthermore, the ellipsoid cells preferentially polarize along their main axis even if the stimulus gradient is not aligned with this axis. The results in this paper thus predict that cell shape is an important factor influencing the ability of a cell to sense external signals, polarize and ultimately migrate.
2 Models
In this section we are introducing a 3D model of cell polarization, and discuss the relation to analogous 1D models. In section 2.1, we define a model which consistently describes the binding and unbinding of a molecule to and from the membrane. Then, section 2.2 uses this membrane-cytosol interaction model for inactive GTPases and includes activation of the membrane-bound GTPases, interactions of the three important small GTPases Rho, Rac and Cdc42 as well as interaction with phosphatidylinositols. Finally, in section 2.3, we discuss how to reduce our 3D model to a 1D model.
2.1 3D Membrane-Cytosol Interaction Model
We denote by Gc the density of molecules which are freely diffusing in the cytosol, measured in moles per volume, and by Gm the density of membrane-bound molecules, measured in moles per area. The unbinding rate from the membrane is denoted by koff, and the effective binding rate is konLI, where kon is a conventional rate with dimensions of inverse time, and LI is the length scale defining the region of the cytosol adjacent to the membrane which is accessible to the membrane-binding reaction. The diffusion coefficients for diffusion in the cytosol or on the membrane, respectively, are denoted DC and DM. Then, Gm and Gc evolve according to the following PDEs:
| (1) |
The boundary condition for Gc ensures conservation of the number of molecules under binding and unbinding, and en is the unit outward normal vector at the membrane, so en∇V is the projection of the gradient on the normal vector. r̄m and r̄c denote points on the membrane or in the cytosol, respectively, and , denote the volume and surface Laplace operators (otherwise known as Laplace-Beltrami operator, or Laplacian), respectively. Similar models as (1) have been used in [51] in the context of diffusion-driven instabilities. The boundary condition is also similar to the boundary conditions chosen to model the flux through a membrane, as done, for instance, in [52]. Such boundary conditions are known as Kedem–Katchalsky boundary conditions. A more detailed discussion and derivation of those equations is provided in the section S1 of the supplementary information. We note that from (1), it follows that when Gm and Gc are in equilibrium, and are homogeneously distributed, then the fraction f of membrane-bound molecules is given by
| (2) |
where V is the volume and S the surface area of the cell.
2.2 Pathway Model
We now focus on a 3D cell polarization model incorporating the three GT-Pases Rac, Rho and Cdc42, as well as the three phosphatidylinositols PIP1, PIP2 and PIP3, as dynamic quantities. We use the molecular interactions as shown in Fig. 1, which were previously considered in a 1D model [33]. PIP, PIP2 and PIP3 are all assumed to be purely membrane bound, whereas the three GTPases Rho, Rac and Cdc42 are assumed to exist in active and inactive membrane-bound forms, indicated by subscripts a and mi, respectively, as well as an inactive soluble form, which can diffuse in the cytosol and which is indicated by a subscript ci. The membrane binding and unbinding of the inactive forms is described as outlined in section 2.1. The full model is thus described by equations (3).
Figure 1.
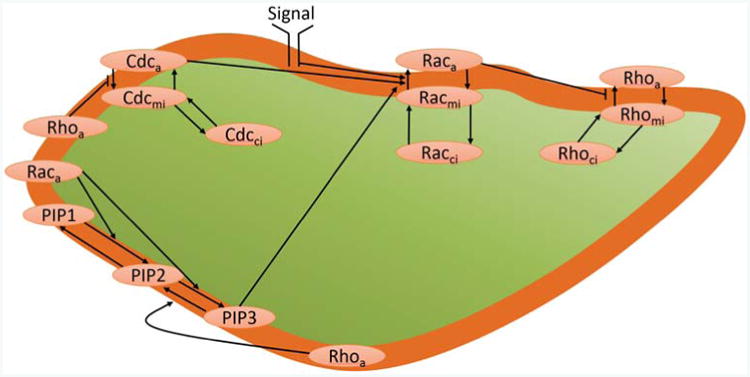
The molecular pathway considered in this paper incorporates the GTPases Rac, Rho and Cdc42, and the phosphatidylinositols PIP, PIP2 and PIP3. The subscripts, a, mi and ci denote active, membrane-bound inactive and cytosolic inactive GTPases, whereas the PIPs are all membrane-bound. We consider the interactions of active GTPases and PIPs, the activation and deactivation of membrane-bound GTPases, and the binding and unbinding from the membrane of the inactive GTPases.
| (3) |
Here, the activation functions IG for the three GTPases are given by
| (4) |
and δG are the deactivation rates. The signal SRac(r̄m, t) is defined to simulate the effect of membrane receptor stimulation of Rac, i.e. it increases the Rac activation rate in a spatial way, and is thus defined on points r̄m on the membrane. Typically, we will choose a function monotonously increasing along the direction of an external growth factor stimulus. More details about the relation of this model to the 1D model of [33] are found in the supplementary information, section S3. In Table S1, we also include a full list of the parameters appearing in our model defined by equations (3) and (4).
2.3 1D Reduction
We now consider the reduction of equation (1) to a cylindrical cell of length L and radius R, where we assume cylindrical symmetry and no strong spatial dependence in the radial direction of the cylinder. Then, equation (1) reduces to
| (5) |
Here, G̃m and G̃c are the densities in one spatial dimension obtained from reducing Gm and Gc by G̃m(z, t) ≈ 2πRGm(ϕ, z, t), G̃c(z, t) ≈ πR2Gc(r, ϕ, z, t), using cylindrical coordinates with radius r, angle ϕ and axis z. In the derivation, we have made use of the assumptions
| (6) |
which indicate that radial diffusion is fast, so concentrations equilibrate fast in the radial direction. Note that while equations (5) are defined on a 1D spatial domain defined by the length of the cylinder, so 0 ≤ z ≤ L, the cylinder radius is implicitly present in the sense that the membrane-binding rate kon is effectively renormalized by the inverse of the cylinder radius R. If we consider a cell with a given volume V = πR2L, then, while maintaining a cylindrical shape, increasing the length L of the cylinder will result in a decrease of the radius R. Hence, the effective membrane binding rate will increase. This makes intuitive sense as for a longer and thinner cylinder, proportionally more molecules in the cytosol are close to the membrane. Indeed, the thin layer of width LI around the membrane, which is the region of the cytosol accessible to membrane-binding of the molecules, becomes larger for smaller R under fixed cylinder volume. The fraction f of membrane-bound molecules obtained for the 1D cell is given by
| (7) |
which differs from the result of [33]. More details of the derivation of the 1D limit are presented in the supplementary information, section S2.1, and section S2.2 gives an analogous derivation for the reduction to two spatial dimensions.
3 Results
In section 3.1, we consider quasi-one-dimensional cells in our 3D framework and compare this with established 1D models. Then, in section 3.2, we will investigate the role of the membrane unbinding rate on cell polarization. Finally, in section 3.3 we will investigate how 3D geometry can influence the capability and timescales of cells to polarize and to repolarize when the external signal is changing directions.
3.1 Polarization of a Quasi-One-Dimensional Cell
To compare to the 1D model [33], we are now investigating a scenario of emerging polarization where we start with initially homogeneous concentrations of all molecules, which are then perturbed by a large spike in active Rac at one end of the long cell in a symmetric way depending only on the direction of the longest extent of the cell. First of all, we checked our code on a cuboid-shaped cell with side lengths L, w, d = 20, 8, 5μm, since a cuboid presents the most straight-forward generalization of a 1D geometry. Fig. 2 shows a typical time evolution of a GTPase concentration, here Cdc42, after the initial Rac stimulus is applied at time t = 0 at the top of the cell, which is then removed. We observe that at time t = 20s it looks as if the cell could polarize, but the strength of polarization fades away and is completely absent at time t = 200s. As we are interested in studying the effect of geometry in this paper, we vary the length of the cell, fixing the cell volume to V = 800μm3.
Figure 2.
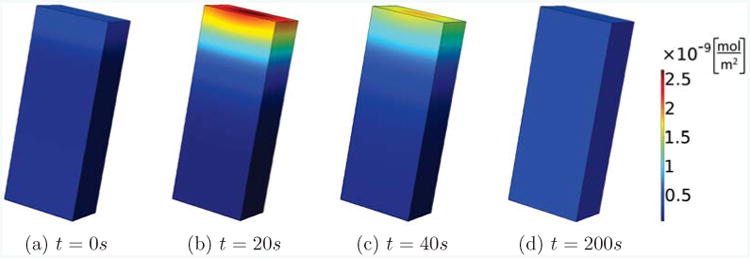
Transient polarization. We show the concentration of active Cdc42 on the membrane for a rectangular cell with side lengths L, w, d = 20, 8, 5μm. Active Rac is perturbed at the top of the cell, leading to a brief polarized state which then fades away with progressing time.
Fig. 3 shows this cell with different lengths, L = 40, 80μm. In each case we perturbed active Rac at the top of the cell and show the active Cdc42 concentrations after t = 200s. We see that in both cases a stable polarization pattern is established. This is in contrast to the case of the shorter cell with L = 20μm, which, as shown in Fig. 2, has no signs of polarization after t = 200s. Fig. S2 in the supplementary information shows results from the same simulations but focuses on the time series of active Cdc42 at the front and back of the cell. These results are compatible with the observation in [33] that length can change the bifurcation behavior and increase the polarization sensitivity. However, our results are different for several reasons: we take the finiteness of the membrane binding and unbinding rates into account; the fraction of membrane-bound GTPases which we derived in the section 2.3 is different from the one used in [33]; [33] combined the inactive membrane-bound and cytosolic forms into one inactive form whereas we do not perform this approximation in the 3D model; [33] measured the membrane-bound particles in moles per volume, whereas we use moles per unit area, which is important as we fix the volume, but by changing the length also change the surface area of the cells.
Figure 3.
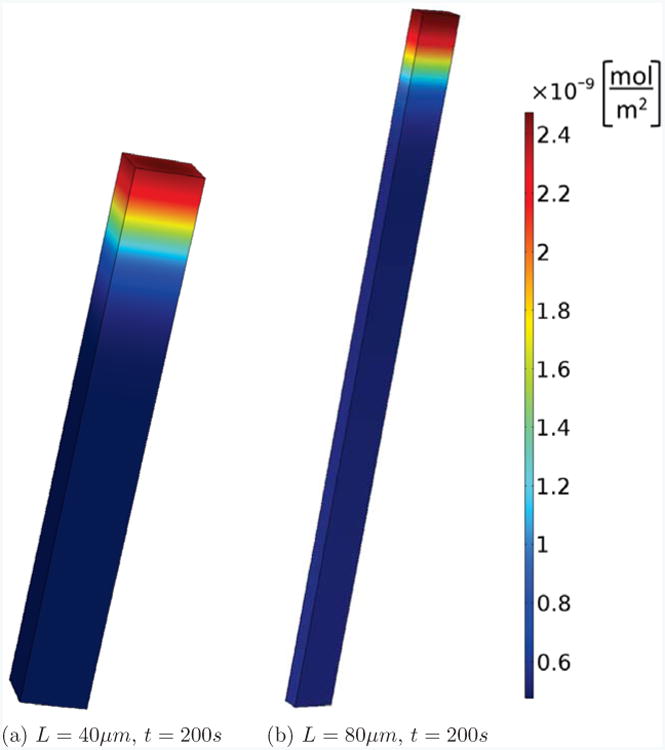
Persistent polarization. The same cell and setup as in Fig. 2, but elongated to L = 40 and 80μm. We see that, contrary to the cell with L = 20μm shown in Fig. 2(d), after 200s a stable polarized state is maintained.
In Fig. 4(a), we show active Rac levels in a homogeneous, steady state setting, and in Fig. 4(b), active Rac is shown in the presence of a constant linear gradient stimulus 200s after this stimulus is initially applied, for different lengths of the cell in the 1D and 3D models. As before, the volume of the cell is fixed at V = 800μm3. We have chosen the parameters of the 3D model such that at the base length of L = 20μm, we get agreement with the 1D model and homogeneous conditions. Fig. 4(a) shows that the steady state values obtained in the homogeneous case differ significantly when the length is changed. Moreover, when the gradient is applied, the results presented in Fig. 4(b) confirm that the differences in Rac active concentrations at the front and back of the cell can differ markedly between the 1D and 3D model. In the scenario shown, in the 3D model, the difference of active Rac at the front and the back decreases with increasing length, whereas in the 1D model it increases with increasing length.
Figure 4.
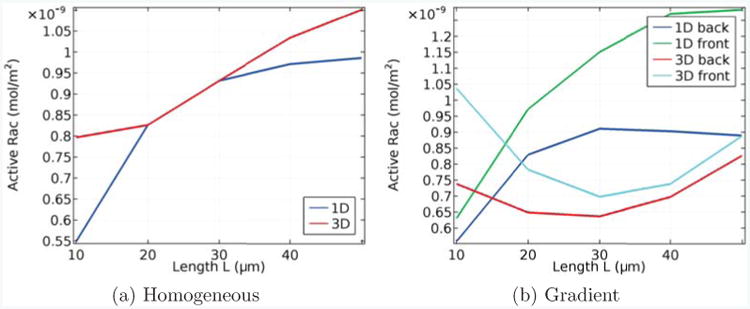
Length dependence of active Rac in homogeneous conditions (a) and in the presence of a gradient (b), in which case the concentrations at both the front and back are shown. In each case we compare the 1D model from [33] with our 3D model, and the parameters are aligned so that, with homogeneous conditions and L = 20μm, both models coincide.
Furthermore, in a 1D model one cannot accurately take into account variations in the directions perpendicular to the main axis. In Fig. 5(a), we investigate the impact of the asymmetry factor , which describes the asymmetry of the directions perpendicular to the length L, on polarization. We find that, for cells of different length, higher asymmetry decreases polarization strength, measured in terms of the difference of active Rac between the front and the back of the cell. Then, in Fig. 5(b), we investigate the volume dependence, and find that generally, increasing the volume V of the cell increases polarization strength for cells of different lengths. A main effect of changing either volume or asymmetry is that this will change the volume to surface ratio, which then affects effective activation and inactivation rates as well as effective membrane binding and unbinding rates. Furthermore, the effective diffusion rates are changed when volume or asymmetry change.
Figure 5.
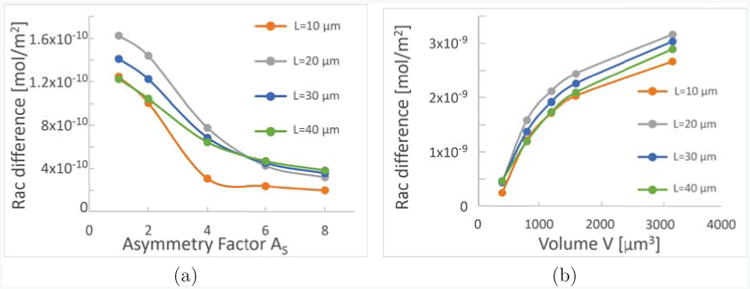
Geometry influences Polarization strength. As a measure of polarization strength, we show the difference of active Rac on the membrane at the front and at the back of the cell, for cells of different rectangular shapes. Each plot shows four graphs for cells of different lengths, L = 10μm (orange), 20μm (gray), 30μm (blue), 40μm (green). In (a) the volume is fixed to be V = 800μm3, and the sides w ≥ d perpendicular to L of the rectangle are fixed in dependence on the asymmetry factor AS as , . In (b), the volume dependence is shown while .
3.2 Role of Membrane Unbinding Rates
We now investigate the dependence of our model on an important new parameter typically not considered in previous models, that is, the membrane unbinding rate koff. Its associated binding rate kon is fixed via relation (2). It is of physiological importance, as GDI molecules mediate the sequestration of GTPases into the cytosol [53], and hence their dysregulation will change binding and unbinding rates. Hence, it is important to know how the model predictions change when these rates are varied. Fig. 6 shows the difference of active Rac between the front and back, which is a measure of the polarization strength, of a rectangular cell as a function of koff 200s after an initial stimulus of Rac at the front. We show this dependence for different cell lengths and values of the Rac activation rate IR1, as these parameters where shown in [33] to be important parameters affecting cell polarization. Fig. 6(a) shows results from a cell of length L = 20μm, whereas Fig. 6(b) shows results from a cell of L = 40μm. In each case, we show plots for four different Rac activation rates IR1. First, we confirm qualitatively the observation of [33] that intermediate ranges of IR1 can lead to a polarized states, or are more strongly polarized. Furthermore, the shorter cell does not polarize as easily as the longer cell, as in Fig. 6(a) only the cell with IR1 = 0.0005 is polarized. We also see that koff is positively associated with polarization strength, and the cells with very small values of koff = 0.1s−1 do not, or only weakly, polarize. Note that the 1D limiting case requires , for L = 20, 40μm, respectively, so in neither case are the approximations applied in [33] necessarily expected to be accurate. This constraint is discussed along equation (25) in the supplementary information. We also note that for most, but not all parameters checked, the polarization strength saturates at koff values of the order of magnitude of 1s−1. The results in Fig. 6 confirm that the membrane unbinding rate is an important parameter which can influence the capability of a cell to polarize.
Figure 6.
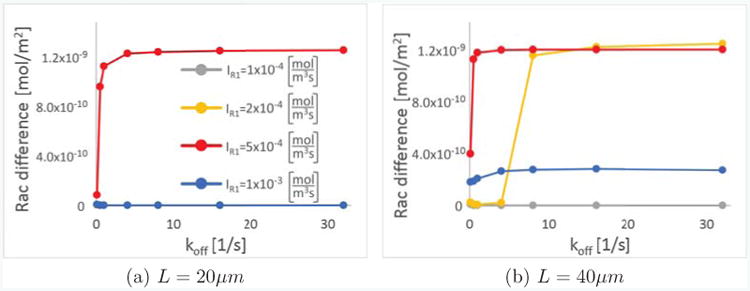
Membrane unbinding influences polarization strength. As a measure of polarization strength, we compare the difference in concentrations of active Rac between the front and the back of the cell as a function of koff for different values of the Rac activation rate IR1 and two lengths, (a) L = 20μm and (b) L = 40μm, in all cases 200 seconds after an initial stimulus of active Rac is applied at the front of the cell. In (a), only the cell with IR1 = 0.0005 shown in red is polarized, and all three other values lead to completely unpolarized states.
3.3 Influence of Geometry on Polarization
We now investigate how cell shape influences the ability of the cell to polarize, lose polarization or repolarize when the direction of a signal changes in time. Here we include some effects which cannot be investigated with a 1D model.
3.3.1 Influence of Geometry on Initial Polarization
In many experiments, cells present in vastly different shapes. For instance, as shown in Fig. 7, a cancer cell is extravasating through a vascular lumen [54]. As it does, it transitions from a nearly spherical shape (Fig. 7(a)), into one consisting of a spherical region inside the lumen, spreading into a broad set of protrusions in the extracellular matrix outside of the lumen (Fig. 7(b)). The two parts of the cell are connected by a thin neck-like region reaching through the endothelium, barely visible in this single confocal slice, but typically being of about 1 or 2μm in diameter. While a full model of the extravsation process would need to take complexities such as the change in environment from the blood-filled inside of the lumen to the extracellular matrix outside of the lumen into account, our current model provides, with limitations, an understanding of what effect complex cell shapes similar to those seen in Figure 7b would have on the polarization behavior of cells.
Figure 7.
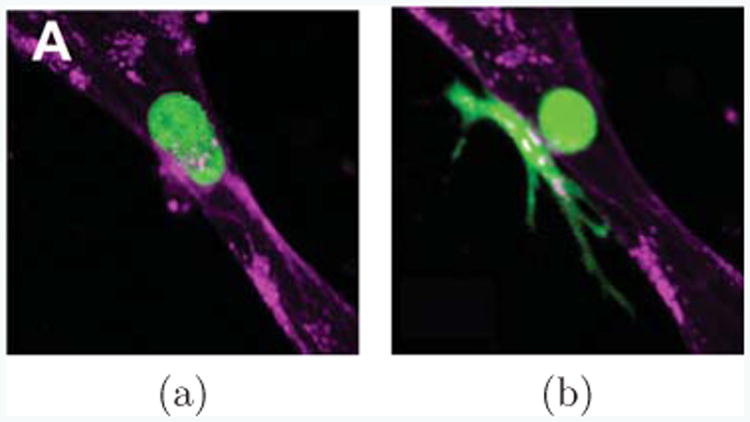
Cells can appear in vastly different shapes. Here, a cancer cell (green) extravastating from inside a vessel of endothelial cells (purple) into surrounding extracelullar matrix (black) is shown, as observed in [54] (Reproduced by permission of The Royal Society of Chemistry). In (a) the cancer cell appears nearly spherical, while it is still fully inside the vessel lumen and has not started to extravasate. When it is in the process of extravasation through the endothelium, it narrows dramatically at the endothelium, connected only through a thin neck region (b). Part of the cell remains in the lumen, but much of it has already spread outside of the lumen into the extracellular matrix.
We compare a cell with two different shapes: First as a single ellipsoid, Figs. 8(a)-(c), then, as two ellipsoids joined by a thin neck 1.3μm in diameter between the ellipsoids, Figs. 8(d)-(f). For a better comparison we keep the length and volume of the two configurations the same, so that the main difference between the two cases is the thinning, and the spreading of one half of the cell, similar as seen in the extravasating cell outside of the lumen in Figure 7. We see that for both shapes, the cell is polarizing at t = 5s in response to the stimulus. However, at t = 100s, the single-ellipsoid cell has lost its polarization, Fig. 8(c), whereas the extravasating cell maintains a strongly polarized state, Fig. 8(f), such that active Cdc42 is mainly concentrated in the part of the cell outside of the lumen. This could explain the formations of filopodia, known to be directed by Cdc42, almost exclusively outside of the lumen. However, as mentioned before, the current model does not take all complexities during the extravasation process into account so further work is required to investigate if shape alone, or a combination with other effects such as the presence of ECM molecules outside of the lumen, are responsible for the observed behavior.
Figure 8.
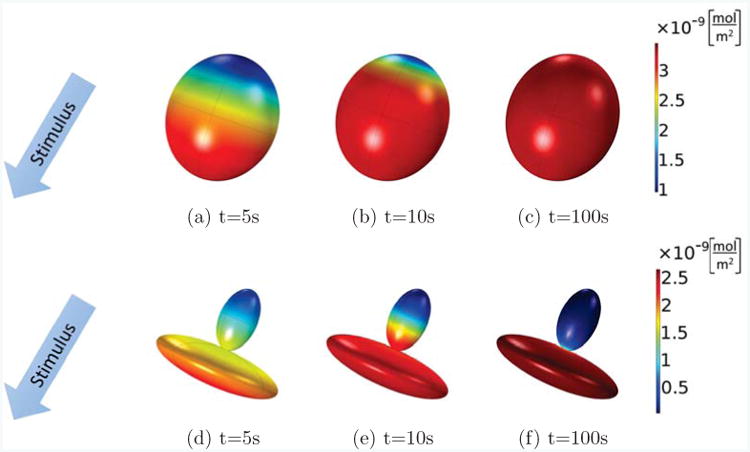
Active Cdc42 for cells of different shapes: an ellipsoid cell (top row, (a)-(c)), and a cell composed of two thinly connected ellipsoids (bottom row, (d)-(f)) at times of 5, 10, and 100s. A stimulus gradient is applied to the initially homogeneous cells. Both cells initially polarize at t = 5s, but the cell with the shape of a single ellipsoid loses its polarization at t = 100s, whereas the cell composed of two ellipsoids is able to maintain its polarization.
3.3.2 Response of Cell to a Change in Stimulus Direction
We now investigate how cell shape can influence the response of a cell to a change in the direction of a stimulus. This will allow us to make predictions with this model beyond the response to unidirectional stimuli, which exist typically in in vitro setups such as classical Boyden chambers [55], or modern microfluidic platforms [56, 57, 58, 59]. However, many cases of cell migration in vivo are more complex due to tissue heterogeneity as well as temporal and spatial changes in stimuli [60]. The scenario presented in Fig. 9 goes towards an understanding of how cells respond to changes in stimuli, and how this response is affected by cell shape. Active Rac is shown for a cell of a volume of V = 800μm3 for three different ellipsoidal configurations: With a main axis of 11.5μm (spherical, (a)-(d)), 15μm ((e)-(h)) and 20μm ((i)-(l)). Initially a stable polarized state is obtained in all three configurations, which is shown at t = 100s just before the activation gradient direction is changed. The spherical cell always maintains a main direction, but the direction of polarization rotates towards the new stimulus direction. At t = 180s the cell is mainly polarized into the new stimulus direction (c), and at t = 300s it is completely repolarized. Interestingly, the ellipsoidal configurations never reach a polarized state aligned with the new stimulus. Instead, the new polarization direction is somewhere in between the original and final stimulus direction, and the larger the ratio of the ellipsoid axes is, the closer the new polarization direction will remain to the original polarization direction. This would suggest that a more symmetric, spherical cell is able to repolarize faster and more efficiently than a long, thin cell, despite their chemical pathways being unaltered. In Fig. 10, we use the same setup as in Fig. 9, but we initially polarize along one of the short ellipsoid axes and then rotate by 45 degrees towards the long axis. The spherical cell can, as before, adapt to the new stimulus direction. Now, the ellipsoidal cells can rotate faster, and, interestingly, they rotate their internal polarization state by more than 45 degrees towards the long axis. Indeed, the longest ellipsoidal cell is, after t = 300s, almost fully polarized along the long axis (Fig. 10(l)). Supplementary Fig. S3 shows the same setup, where, like in Fig. 10 we initially polarize along a short axis, but then fully rotate by 90 degrees towards the long axis. Here, all cells can repolarize towards the new direction, and the ellipsoidal cells repolarize faster than the spheroidal cells. It is well known in the literature that roundish, amoeboid cells can quickly polarize and adapt to new stimuli, in contrast to more elongated cells such as mesenchymal cells [61]. Futhermore, in 3D matrices, elongated mesenchymal cells can migrate persistently along the fibrous structures. Whereas traditionally mesenchymal and amoeboid cells denoted different cell types, such as fibroblasts on the one hand, and dictyostelium or neutrophils on the other hand, recent work has also focused on a switch between those migratory modes for the same cell types. Most of this work has focused on alterations of biochemical pathways to describe the switch between mesenchymal and amoeboid migrations. In [62], the role of MMPs in this switch was investigated, in [63] an important role of Rho and ROCK was discovered, and in [64] LIM kinase was implicated in this switch. In [65], cell aspect ratios were taken as the factor determining whether a cell migrates in a mesenchymal or amoeboid way, with the mesenchymal cell being more persistent, and interstitial flow was shown to affects the switch between these migratory modes. Here, our argument shows that, without any changes in the biochemical pathways, roundish cells are expected to repolarize towards a new stimulus more quickly than elongated cells purely because of their different shape. On the other hand, elongated cells preferentially migrate in the direction of their longest extent, even if the stimulus appears in a slightly different direction, giving them an increased persistence.
Figure 9.
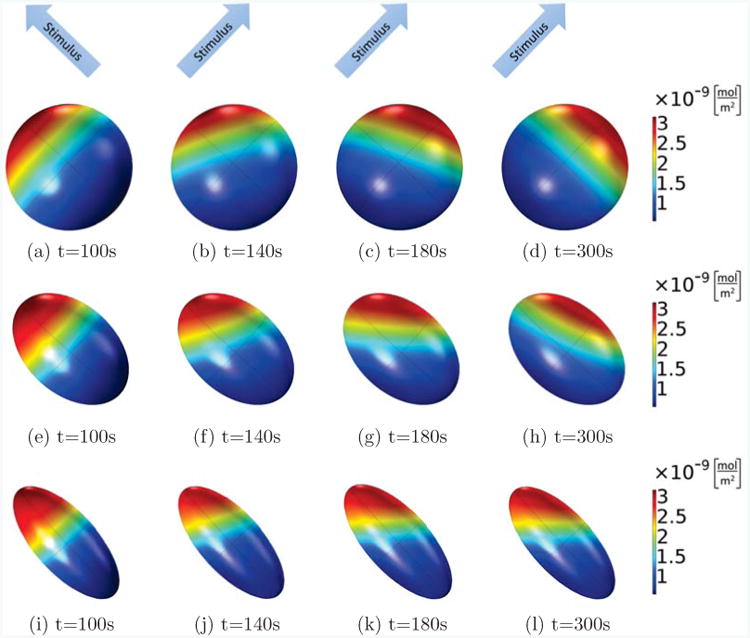
Active Rac on the membrane is shown at different times for the same cell with different shapes, where the Rac activation rate in the first 100s increases linearly along the long axis of the ellipsoid (from lower right corner to upper left corner), and from then on, it is rotated by 90 degrees and now increases linearly along a short axis of the ellipsoids (from the lower left corner to the upper right corner). In all cases, the volume of the ellipsoid cells is fixed as V = 800μm3, the main axis is 11.5μm (spherical, (a)-(d)), 15μm ((e)-(h)) and 20μm ((i)-(l)), and the other two axes are of the same length. Comparing the different shapes, we see that only the spherical cell can completely polarize into the new stimulus direction, whereas the cells with ellipsoidal shapes will form a stable pattern which points into a direction in between the original and final stimulus direction.
Figure 10.
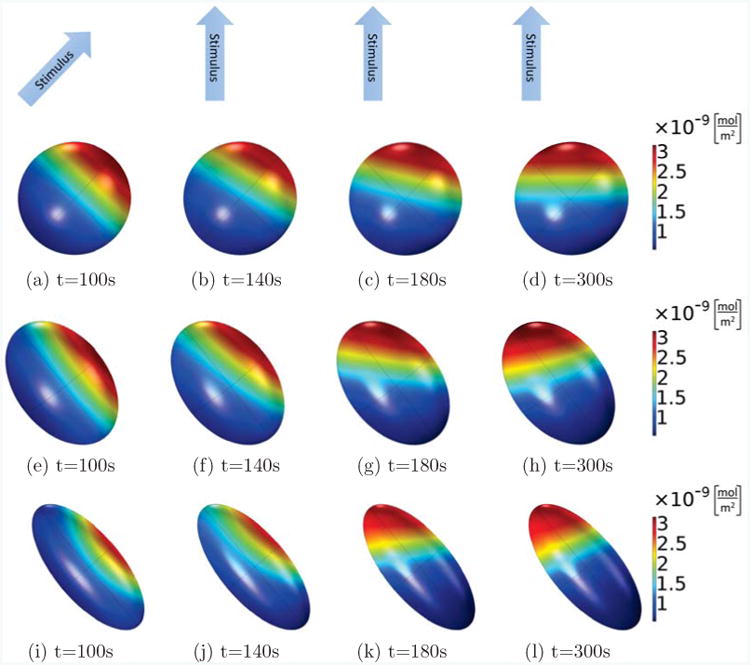
As in Fig. 9, active Rac on the membrane is shown for different times and cells of different shapes, but here, the Rac activation rate in the first 100s increases linearly along a short axis of the ellipsoid (from lower left corner to upper right corner), and from then on, it is rotated by 45 degrees and increases linearly in between the long and a short axis of the ellipsoids (from bottom to top). In all cases, the volume of the ellipsoid cells is fixed as V = 800μm3, the main axis is 11.5μm (spherical, (a)-(d)), 15μm ((e)-(h)) and 20μm ((i)-(l)), and the other two axes are of the same length. Comparing the different shapes, we see that the spherical cell can completely polarize into the new stimulus direction, whereas the cells with the elongated ellipsoidal shapes will rotate their internal polarization direction further than the stimulus direction, so that the polarization is more aligned with their long axis.
4 Conclusion
Motivated by the fact that cells, both in in vitro and in vivo environments, present with greatly varying shapes, in this paper we have investigated how cell shape influences gradient detection and cell polarization. For molecules such as small GTPases, which can exist both in a membrane bound form as well as sequestered in the cytosol, the ratio of cell volume to surface area can influence important properties such as the fraction of membrane-bound molecules, as seen in equation (2). Similar arguments were provided in [45]. However, all GTPases are affected in this way, and they are partially inhibitory to each other, so it is not a priori clear how a full model with interacting molecules would behave under change of cell shape. Furthermore, we found that even in the dimensionally reduced models, the higher dimensions implicitly appeared in the reduced equation by renormalizing the membrane binding rate (equation (5)). We also found conditions on the parameters which, when satisfied, justify the use of the lower dimensional models (equation (6)). These conditions are quite general and should be useful both to check the validity of older models as well as for the development of new models which involve the interactions of molecules between the membrane and the cytosol.
In our model, we have only considered constant binding and unbinding rates of a molecule to and from the membrane, and investigated how these rates affect the polarization behavior of a cell (Fig. 6). In real cells, the binding and unbinding of small GTPases to and from the membrane as well as their activation and deactivation are influenced by the presence of a large number of different molecules such as GDIs, guanine nucleotide exchange factors (GEFs) and GTPase activating proteins (GAPs) [53]. It would be interesting to include the effect of these regulating molecules in our model. However, at present, there is a lack of good quantitative data regarding the spatio-temporal regulation of these molecules, so we postpone such investigations for future research. What Fig. 6 confirmed is that the binding/unbinding rate can influence the ability of a cell to polarize, and as GDI molecules are expected to modify those rates the model predicts that the presence or absence of these molecules will also affect the polarization behavior.
We then extended an established cell polarization pathway [33], which was previously investigated in a 1D model of HeLa cells, to our 3D model. The purpose of choosing [33] for comparison was that in this model, the effect of changing the cell length was implicitly taken into account via a modification of the fraction of membrane-bound GTPases, whereas most other 1D models did not consider any geometric effects at all. Hence, a first test of our model was to reproduce some results of [33] and highlight quantitative and qualitative differences. Furthermore, as mentioned above, we are, to our knowledge, the first to explicitly consider the binding/unbinding dynamics of GTPases to the membrane and show the influence of those parameters on the polarization behavior of the cell in Fig. 6.
We then explored scenarios which the existing lower dimensional models could not capture. First, we compared the polarization behavior of two cells with the same volume and length, one ellipsoid, and one cell composed of two connected ellipsoids, Fig. 8. The second shape was motivated by shapes observed during cancer cell extravasation [54], where the cellular environment can impose different extreme shapes on the cells. This result is important whenever one is trying to compare theoretical results obtained from simplified lower dimensional models to experiments, indicating that one has to take cell shape into account. We expect that the behavior of pathways other than those describing polarization would also be affected by cell shape in a similar manner, if the principle mechanism of polarization is mediated by similar reaction-diffusion models as the ones used here.
As long as the polarization stimulus is coming from only one direction, and provided the parameter constraints (6) are satisfied, 1D models could still be derived which take into account if the cross section of the cell along the stimulus direction is relatively constant. However, purely one-directional stimuli are idealistic and in vivo different stimuli can appear from all directions and change in time. In the study of such effects we have to use 3D models such as ours. In Fig. 9 we simulated a stimulus which was changing directions over time. We found that cell shape is an important factor which predicts how fast and strong a cell can adapt to the new direction of stimulus. Indeed, the spherical cell was able to change the internal polarization direction smoothly towards the new stimulus direction, whereas cells which are elongated along the previous direction of stimulus preferentially stayed polarized in a direction close to the original stimulus. This is compatible with experimental findings that roundish amoeboid cells are typically faster to adapt to new stimuli than mesenchymal cells, which are typically more elongated. An explicit test of the model prediction could be conducted, for instance, using a microfluidics platform where one can change the direction of an external growth factor gradient over time, and measure the response of some tagged internal molecule associated with polarization for varying cell shapes. This would be a step toward an understanding of cell polarization under temporally and spatially varying conditions as typically present in vivo [60]. From a theoretical point of view, it would be interesting to include the effect of dynamical changes of shape through coupling of mechanics with our biochemical pathways, as these dynamical changes have also been shown to affect polarization behavior on longer time-scales in a 2D model [44].
In summary, the results in this paper predict the importance of cell shape on polarization of cells, indicate in which cases the use of lower dimensional models is justified, and demonstrate when a full 3D model such as ours needs to be used to model and predict experimental results.
Supplementary Material
Figure S1: Molecules in the cytosol can move from their current cube to any of the nearest-neighbor cubes (Fig. (a)), or, if they are within a distance of the interaction range LI to the membrane, they can bind to the membrane (Fig. (b)). Membrane-bound molecules can diffuse on the membrane only (Fig.(c)), or unbind from the membrane (Fig. (d)).
Figure S2: The time evolution of concentration of active Cdc42 in time at the front and back of the rectangular cells as shown in Figs. 2 and 3.
Figure S3: As in Figs. 9, 10, active Rac on the membrane is shown for different times and cells of different shapes, but here, the Rac activation rate in the first 100s increases linearly along a short axis of the ellipsoid (from lower left corner to upper right corner), and from then on, it increases linearly along the long axis of the ellipsoids (from the lower right corner to the upper left corner). In all cases, the volume of the ellipsoid cells is fixed as V = 800μm3, the main axis is 11.5μm (spherical, (a)-(d)), 15μm ((e)-(h)) and 20μm ((i)-(l)), and the other two axes are of the same length. Cells of all shapes are able to adapt to their new stimulus direction, with the elongated cells being slightly faster.
Table S1: Parameters of the cell polarization model equation (3), inferred for a cell with dimensions L, w, d = 20, 8, 5μm, so all values which multiply membrane concentrations are rescaled by the factor . This means . Furthermore, α, IR1, IR2 IRho and ICdc are multiplied by the baseline fraction of bound inactive molecules f. We have also rounded the parameters as appropriate.
Acknowledgments
We acknowledge the support of the NCI grant number 5U01CA177799. We are grateful to Leah Edelstein-Keshet, Eamonn Gaffney, Bill Holmes, Philip Maini, Noppadol Mekareeya, Fernando Santos, Robert Seager and Frits Veerman for useful discussions, and the reviewers for helpful suggestions.
References
- 1.Berg Howard C, Purcell Edward M. Physics of chemoreception. Biophysical Journal. 1977;20(2):193. doi: 10.1016/S0006-3495(77)85544-6. [DOI] [PMC free article] [PubMed] [Google Scholar]
- 2.Wadhams George H, Armitage Judith P. Making sense of it all: bacterial chemotaxis. Nature Reviews Molecular Cell Biology. 2004;5(12):1024–1037. doi: 10.1038/nrm1524. [DOI] [PubMed] [Google Scholar]
- 3.Carlson Bruce M. Human Embryology and Developmental Biology. Elsevier Health Sciences; 2013. [Google Scholar]
- 4.Madri Joseph A, Graesser Donnasue. Cell migration in the immune system: the evolving inter-related roles of adhesion molecules and proteinases. Journal of Immunology Research. 2000;7(2-4):103–116. doi: 10.1155/2000/79045. [DOI] [PMC free article] [PubMed] [Google Scholar]
- 5.Hanahan Douglas, Weinberg Robert A. The hallmarks of cancer. Cell. 2000;100(1):57–70. doi: 10.1016/s0092-8674(00)81683-9. [DOI] [PubMed] [Google Scholar]
- 6.Hanahan Douglas, Weinberg Robert A. Hallmarks of cancer: the next generation. Cell. 2011;144(5):646–674. doi: 10.1016/j.cell.2011.02.013. [DOI] [PubMed] [Google Scholar]
- 7.Van Haastert Peter JM, Devreotes Peter N. Chemotaxis: signalling the way forward. Nature Reviews Molecular Cell Biology. 2004;5(8):626–634. doi: 10.1038/nrm1435. [DOI] [PubMed] [Google Scholar]
- 8.Lo Chun-Min, Wang Hong-Bei, Dembo Micah, Wang Yu-li. Cell movement is guided by the rigidity of the substrate. Biophysical Journal. 2000;79(1):144–152. doi: 10.1016/S0006-3495(00)76279-5. [DOI] [PMC free article] [PubMed] [Google Scholar]
- 9.Zaman Muhammad H, Trapani Linda M, Sieminski Alisha L, MacKellar Drew, Gong Haiyan, Kamm Roger D, Wells Alan, Lauffenburger Douglas A, Matsudaira Paul. Migration of tumor cells in 3d matrices is governed by matrix stiffness along with cell-matrix adhesion and proteolysis. Proceedings of the National Academy of Sciences. 2006;103(29):10889–10894. doi: 10.1073/pnas.0604460103. [DOI] [PMC free article] [PubMed] [Google Scholar]
- 10.Borau C, Kamm RD, García-Aznar JM. Mechano-sensing and cell migration: a 3d model approach. Physical Biology. 2011;8(6):066008. doi: 10.1088/1478-3975/8/6/066008. [DOI] [PubMed] [Google Scholar]
- 11.Servant Guy, Weiner Orion D, Herzmark Paul, Balla Tamás, Sedat John W, Bourne Henry R. Polarization of chemoattractant receptor signaling during neutrophil chemotaxis. Science. 2000;287(5455):1037–1040. doi: 10.1126/science.287.5455.1037. [DOI] [PMC free article] [PubMed] [Google Scholar]
- 12.Mogilner Alex, Oster George. Force generation by actin polymerization ii: the elastic ratchet and tethered filaments. Biophysical Journal. 2003;84(3):1591–1605. doi: 10.1016/S0006-3495(03)74969-8. [DOI] [PMC free article] [PubMed] [Google Scholar]
- 13.Ridley Anne J, Schwartz Martin A, Burridge Keith, Firtel Richard A, Ginsberg Mark H, Borisy Gary, Parsons J Thomas, Horwitz Alan Rick. Cell migration: integrating signals from front to back. Science. 2003;302(5651):1704–1709. doi: 10.1126/science.1092053. [DOI] [PubMed] [Google Scholar]
- 14.Raftopoulou Myrto, Hall Alan. Cell migration: Rho gtpases lead the way. Developmental Biology. 2004;265(1):23–32. doi: 10.1016/j.ydbio.2003.06.003. [DOI] [PubMed] [Google Scholar]
- 15.Jaffe Aron B, Hall Alan. Rho gtpases: biochemistry and biology. Annu Rev Cell Dev Biol. 2005;21:247–269. doi: 10.1146/annurev.cellbio.21.020604.150721. [DOI] [PubMed] [Google Scholar]
- 16.Funamoto Satoru, Meili Ruedi, Lee Susan, Parry Lisa, Firtel Richard A. Spatial and temporal regulation of 3-phosphoinositides by pi 3-kinase and pten mediates chemotaxis. Cell. 2002;109(5):611–623. doi: 10.1016/s0092-8674(02)00755-9. [DOI] [PubMed] [Google Scholar]
- 17.Cully Megan, You Han, Levine Arnold J, Mak Tak W. Beyond pten mutations: the pi3k pathway as an integrator of multiple inputs during tumorigenesis. Nature Reviews Cancer. 2006;6(3):184–192. doi: 10.1038/nrc1819. [DOI] [PubMed] [Google Scholar]
- 18.Kay Robert R, Langridge Paul, Traynor David, Hoeller Oliver. Changing directions in the study of chemotaxis. Nature Reviews Molecular Cell Biology. 2008;9(6):455–463. doi: 10.1038/nrm2419. [DOI] [PubMed] [Google Scholar]
- 19.Pollard Thomas D. Regulation of actin filament assembly by arp2/3 complex and formins. Annu Rev Biophys Biomol Struct. 2007;36:451–477. doi: 10.1146/annurev.biophys.35.040405.101936. [DOI] [PubMed] [Google Scholar]
- 20.Ryan Gillian L, Petroccia Heather M, Watanabe Naoki, Vavylonis Dimitrios. Excitable actin dynamics in lamellipodial protrusion and retraction. Biophysical Journal. 2012;102(7):1493–1502. doi: 10.1016/j.bpj.2012.03.005. [DOI] [PMC free article] [PubMed] [Google Scholar]
- 21.Yang Neng, Higuchi Osamu, Ohashi Kazumasa, Nagata Kyoko, Wada Atsushi, Kangawa Kenji, Nishida Eisuke, Mizuno Kensaku. Cofilin phosphorylation by lim-kinase 1 and its role in rac-mediated actin reorganization. Nature. 1998;393(6687):809–812. doi: 10.1038/31735. [DOI] [PubMed] [Google Scholar]
- 22.Arber Silvia, Barbayannis Freda A, Hanser Hartwig, Schneider Corinna, Stanyon Clement A, Bernard Ora, Caroni Pico. Regulation of actin dynamics through phosphorylation of cofilin by lim-kinase. Nature. 1998;393(6687):805–809. doi: 10.1038/31729. [DOI] [PubMed] [Google Scholar]
- 23.Iglesias Pablo A, Devreotes Peter N. Navigating through models of chemotaxis. Current Opinion in Cell Biology. 2008;20(1):35–40. doi: 10.1016/j.ceb.2007.11.011. [DOI] [PubMed] [Google Scholar]
- 24.Jilkine Alexandra, Edelstein-Keshet Leah. A comparison of mathematical models for polarization of single eukaryotic cells in response to guided cues. PLoS Computational Biology. 2011;7(4):e1001121. doi: 10.1371/journal.pcbi.1001121. [DOI] [PMC free article] [PubMed] [Google Scholar]
- 25.Meinhardt Hans. Orientation of chemotactic cells and growth cones: models and mechanisms. Journal of Cell Science. 1999;112(17):2867–2874. doi: 10.1242/jcs.112.17.2867. [DOI] [PubMed] [Google Scholar]
- 26.Levchenko Andre, Iglesias Pablo A. Models of eukaryotic gradient sensing: application to chemotaxis of amoebae and neutrophils. Biophysical Journal. 2002;82(1):50–63. doi: 10.1016/S0006-3495(02)75373-3. [DOI] [PMC free article] [PubMed] [Google Scholar]
- 27.Iglesias Pablo A, Devreotes Peter N. Biased excitable networks: how cells direct motion in response to gradients. Current Opinion in Cell Biology. 2012;24(2):245–253. doi: 10.1016/j.ceb.2011.11.009. [DOI] [PMC free article] [PubMed] [Google Scholar]
- 28.Marée Athanasius FM, Jilkine Alexandra, Dawes Adriana, Grieneisen Verônica A, Edelstein-Keshet Leah. Polarization and movement of keratocytes: a multiscale modelling approach. Bulletin of Mathematical Biology. 2006;68(5):1169–1211. doi: 10.1007/s11538-006-9131-7. [DOI] [PubMed] [Google Scholar]
- 29.Dawes Adriana T, Edelstein-Keshet Leah. Phosphoinositides and rho proteins spatially regulate actin polymerization to initiate and maintain directed movement in a one-dimensional model of a motile cell. Biophysical Journal. 2007;92(3):744–768. doi: 10.1529/biophysj.106.090514. [DOI] [PMC free article] [PubMed] [Google Scholar]
- 30.Jilkine Alexandra, Marée Athanasius FM, Edelstein-Keshet Leah. Mathematical model for spatial segregation of the rho-family gtpases based on inhibitory crosstalk. Bulletin of Mathematical Biology. 2007;69(6):1943–1978. doi: 10.1007/s11538-007-9200-6. [DOI] [PubMed] [Google Scholar]
- 31.Otsuji Mikiya, Ishihara Shuji, Kaibuchi Kozo, Mochizuki Atsushi, Kuroda Shinya, et al. A mass conserved reaction–diffusion system captures properties of cell polarity. PLoS Computational Biology. 2007;3(6):e108. doi: 10.1371/journal.pcbi.0030108. [DOI] [PMC free article] [PubMed] [Google Scholar]
- 32.Goryachev Andrew B, Pokhilko Alexandra V. Dynamics of cdc42 network embodies a turing-type mechanism of yeast cell polarity. FEBS letters. 2008;582(10):1437–1443. doi: 10.1016/j.febslet.2008.03.029. [DOI] [PubMed] [Google Scholar]
- 33.Holmes William R, Lin Benjamin, Levchenko Andre, Edelstein-Keshet Leah. Modelling cell polarization driven by synthetic spatially graded rac activation. PLoS Computational Biology. 2012;8(6):e1002366. doi: 10.1371/journal.pcbi.1002366. [DOI] [PMC free article] [PubMed] [Google Scholar]
- 34.Rubinstein Boris, Slaughter Brian D, Li Rong. Weakly nonlinear analysis of symmetry breaking in cell polarity models. Physical Biology. 2012;9(4):045006. doi: 10.1088/1478-3975/9/4/045006. [DOI] [PMC free article] [PubMed] [Google Scholar]
- 35.Knoch Fabian, Tarantola Marco, Bodenschatz Eberhard, Rappel Wouter-Jan. Modeling self-organized spatio-temporal patterns of pip 3 and pten during spontaneous cell polarization. Physical Biology. 2014;11(4):046002. doi: 10.1088/1478-3975/11/4/046002. [DOI] [PMC free article] [PubMed] [Google Scholar]
- 36.Turing Alan Mathison. The chemical basis of morphogenesis. Philosophical Transactions of the Royal Society of London B: Biological Sciences. 1952;237(641):37–72. [Google Scholar]
- 37.Gierer Alfred, Meinhardt Hans. A theory of biological pattern formation. Kybernetik. 1972;12(1):30–39. doi: 10.1007/BF00289234. [DOI] [PubMed] [Google Scholar]
- 38.Meinhardt Hans, Gierer A. Applications of a theory of biological pattern formation based on lateral inhibition. Journal of Cell Science. 1974;15(2):321–346. doi: 10.1242/jcs.15.2.321. [DOI] [PubMed] [Google Scholar]
- 39.Meinhardt Hans, Gierer Alfred. Pattern formation by local self-activation and lateral inhibition. Bioessays. 2000;22(8):753–760. doi: 10.1002/1521-1878(200008)22:8<753::AID-BIES9>3.0.CO;2-Z. [DOI] [PubMed] [Google Scholar]
- 40.Kozlov Michael M, Mogilner Alex. Model of polarization and bistability of cell fragments. Biophysical Journal. 2007;93(11):3811–3819. doi: 10.1529/biophysj.107.110411. [DOI] [PMC free article] [PubMed] [Google Scholar]
- 41.Vanderlei Ben, Feng James J, Edelstein-Keshet Leah. A computational model of cell polarization and motility coupling mechanics and biochemistry. Multiscale Modeling & Simulation. 2011;9(4):1420–1443. doi: 10.1137/100815335. [DOI] [PMC free article] [PubMed] [Google Scholar]
- 42.Altschuler Steven J, Angenent Sigurd B, Wang Yanqin, Wu Lani F. On the spontaneous emergence of cell polarity. Nature. 2008;454(7206):886–889. doi: 10.1038/nature07119. [DOI] [PMC free article] [PubMed] [Google Scholar]
- 43.Dovas Athanassios, Couchman John. Rhogdi: multiple functions in the regulation of rho family gtpase activities. Biochem J. 2005;390:1–9. doi: 10.1042/BJ20050104. [DOI] [PMC free article] [PubMed] [Google Scholar]
- 44.Marée Athanasius FM, Grieneisen Verônica A, Edelstein-Keshet Leah. How cells integrate complex stimuli: the effect of feedback from phosphoinositides and cell shape on cell polarization and motility. PLoS Comput Biol. 2012;8(3):e1002402–e1002402. doi: 10.1371/journal.pcbi.1002402. [DOI] [PMC free article] [PubMed] [Google Scholar]
- 45.Meyers Jason, Craig Jennifer, Odde David J. Potential for control of signaling pathways via cell size and shape. Current Biology. 2006;16(17):1685–1693. doi: 10.1016/j.cub.2006.07.056. [DOI] [PubMed] [Google Scholar]
- 46.Herant Marc, Dembo Micah. Form and function in cell motility: from fibroblasts to keratocytes. Biophysical Journal. 2010;98(8):1408–1417. doi: 10.1016/j.bpj.2009.12.4303. [DOI] [PMC free article] [PubMed] [Google Scholar]
- 47.Zemel A, Rehfeldt F, Brown AEX, Discher DE, Safran SA. Cell shape, spreading symmetry, and the polarization of stress-fibers in cells. Journal of Physics: Condensed Matter. 2010;22(19):194110. doi: 10.1088/0953-8984/22/19/194110. [DOI] [PMC free article] [PubMed] [Google Scholar]
- 48.Das Maitreyi, Drake Tyler, Wiley David J, Buchwald Peter, Vavylonis Dimitrios, Verde Fulvia. Oscillatory dynamics of cdc42 gtpase in the control of polarized growth. Science. 2012;337(6091):239–243. doi: 10.1126/science.1218377. [DOI] [PMC free article] [PubMed] [Google Scholar]
- 49.Drake Tyler, Vavylonis Dimitrios. Model of fission yeast cell shape driven by membrane-bound growth factors and the cytoskeleton. PLoS Comput Biol. 2013;9(10):e1003. doi: 10.1371/journal.pcbi.1003287. [DOI] [PMC free article] [PubMed] [Google Scholar]
- 50.Mogilner Alex, Keren Kinneret. The shape of motile cells. Current Biology. 2009;19(17):R762–R771. doi: 10.1016/j.cub.2009.06.053. [DOI] [PMC free article] [PubMed] [Google Scholar]
- 51.Madzvamuse Anotida, Chung Andy HW, Venkataraman Chandrasekhar. Proceedings of the Royal Society of London A: Mathematical, Physical and Engineering Sciences. Vol. 471. The Royal Society; 2015. Stability analysis and simulations of coupled bulk-surface reaction–diffusion systems; p. 20140546. [DOI] [PMC free article] [PubMed] [Google Scholar]
- 52.Eliaš Ján, Dimitrio Luna, Clairambault Jean, Natalini Roberto. The dynamics of p53 in single cells: physiologically based ode and reaction–diffusion pde models. Physical Biology. 2014;11(4):045001. doi: 10.1088/1478-3975/11/4/045001. [DOI] [PubMed] [Google Scholar]
- 53.Garcia-Mata Rafael, Boulter Etienne, Burridge Keith. The ‘invisible hand’: regulation of rho gtpases by rhogdis. Nature Reviews Molecular Cell Biology. 2011;12(8):493–504. doi: 10.1038/nrm3153. [DOI] [PMC free article] [PubMed] [Google Scholar]
- 54.Chen Michelle B, Whisler Jordan A, Jeon Jessie S, Kamm Roger D. Mechanisms of tumor cell extravasation in an in vitro microvascular network platform. Integrative Biology. 2013;5(10):1262–1271. doi: 10.1039/c3ib40149a. [DOI] [PMC free article] [PubMed] [Google Scholar]
- 55.Seppä Heikki, Grotendorst Gary, Seppä Silja, Schiffmann Elliott, Martin George R. Platelet-derived growth factor in chemotactic for fibroblasts. The Journal of Cell Biology. 1982;92(2):584–588. doi: 10.1083/jcb.92.2.584. [DOI] [PMC free article] [PubMed] [Google Scholar]
- 56.Shamloo Amir, Ma Ning, Poo Mu-ming, Sohn Lydia L, Heilshorn Sarah C. Endothelial cell polarization and chemotaxis in a microfluidic device. Lab on a Chip. 2008;8(8):1292–1299. doi: 10.1039/b719788h. [DOI] [PubMed] [Google Scholar]
- 57.Zervantonakis Ioannis, Chung Seok, Sudo Ryo, Zhang Mengwen, Charest Joseph, Kamm Roger. Concentration gradients in microfluidic 3d matrix cell culture systems. International Journal of Micro-Nano Scale Transport. 2010;1(1):27–36. [Google Scholar]
- 58.Chung Seok, Sudo Ryo, Vickerman Vernella, Zervantonakis Ioannis K, Kamm Roger D. Microfluidic platforms for studies of angiogenesis, cell migration, and cell–cell interactions. Annals of Biomedical Engineering. 2010;38(3):1164–1177. doi: 10.1007/s10439-010-9899-3. [DOI] [PubMed] [Google Scholar]
- 59.Kim Beum Jun, Hannanta-Anan Pimkhuan, Chau Michelle, Kim Yoon Soo, Swartz Melody A, Wu Mingming. Cooperative roles of sdf-1alpha and egf gradients on tumor cell migration revealed by a robust 3d microfluidic model. PLoS One. 2013;8(7):e68422. doi: 10.1371/journal.pone.0068422. [DOI] [PMC free article] [PubMed] [Google Scholar]
- 60.Cai Danfeng, Montell Denise J. Diverse and dynamic sources and sinks in gradient formation and directed migration. Current Opinion in Cell Biology. 2014;30:91–98. doi: 10.1016/j.ceb.2014.06.009. [DOI] [PMC free article] [PubMed] [Google Scholar]
- 61.Vorotnikov Alexander V, Tyurin-Kuzmin Pyotr A. Chemotactic signaling in mesenchymal cells compared to amoeboid cells. Genes & Diseases. 2014;1(2):162–173. doi: 10.1016/j.gendis.2014.09.006. [DOI] [PMC free article] [PubMed] [Google Scholar]
- 62.Wolf Katarina, Mazo Irina, Leung Harry, Engelke Katharina, Von Andrian Ulrich H, Deryugina Elena I, Strongin Alex Y, Bröcker Eva-B, Friedl Peter. Compensation mechanism in tumor cell migration mesenchymal-amoeboid transition after blocking of pericellular proteolysis. The Journal of Cell Biology. 2003;160(2):267–277. doi: 10.1083/jcb.200209006. [DOI] [PMC free article] [PubMed] [Google Scholar]
- 63.Sahai Erik, Marshall Christopher J. Differing modes of tumour cell invasion have distinct requirements for rho/rock signalling and extracellular proteolysis. Nature Cell Biology. 2003;5(8):711–719. doi: 10.1038/ncb1019. [DOI] [PubMed] [Google Scholar]
- 64.Mishima Toshiaki, Naotsuka Moyu, Horita Yuji, Sato Masaaki, Ohashi Kazumasa, Mizuno Kensaku. Lim-kinase is critical for the mesenchymal-to-amoeboid cell morphological transition in 3d matrices. Biochemical and Biophysical Research Communications. 2010;392(4):577–581. doi: 10.1016/j.bbrc.2010.01.075. [DOI] [PubMed] [Google Scholar]
- 65.Huang Yu Ling, Tung Chih-kuan, Zheng Anqi, Kim Beum Jun, Wu Mingming. Interstitial flows promote amoeboid over mesenchymal motility of breast cancer cells revealed by a three dimensional microfluidic model. Integrative Biology. 2015 doi: 10.1039/c5ib00115c. [DOI] [PMC free article] [PubMed] [Google Scholar]
- 66.Jost Jürgen. Riemannian Geometry and Geometric Analysis. Springer Science & Business Media; 2008. [Google Scholar]
- 67.Lin Benjamin, Holmes William R, Wang C Joanne, Ueno Tasuku, Harwell Andrew, Edelstein-Keshet Leah, Inoue Takanari, Levchenko Andre. Synthetic spatially graded rac activation drives cell polarization and movement. Proceedings of the National Academy of Sciences. 2012;109(52):E3668–E3677. doi: 10.1073/pnas.1210295109. [DOI] [PMC free article] [PubMed] [Google Scholar]
- 68.Erickson Harold P. Size and shape of protein molecules at the nanometer level determined by sedimentation, gel filtration, and electron microscopy. Biol Proced Online. 2009;11(1):32–51. doi: 10.1007/s12575-009-9008-x. [DOI] [PMC free article] [PubMed] [Google Scholar]
- 69.McLaughlin Stuart, Aderem Alan. The myristoyl-electrostatic switch: a modulator of reversible protein-membrane interactions. Trends in Biochemical Sciences. 1995;20(7):272–276. doi: 10.1016/s0968-0004(00)89042-8. [DOI] [PubMed] [Google Scholar]
- 70.Moissoglu Konstadinos, Slepchenko Boris M, Meller Nahum, Horwitz Alan F, Schwartz Martin A. In vivo dynamics of rac-membrane interactions. Molecular Biology of the Cell. 2006;17(6):2770–2779. doi: 10.1091/mbc.E06-01-0005. [DOI] [PMC free article] [PubMed] [Google Scholar]
Associated Data
This section collects any data citations, data availability statements, or supplementary materials included in this article.
Supplementary Materials
Figure S1: Molecules in the cytosol can move from their current cube to any of the nearest-neighbor cubes (Fig. (a)), or, if they are within a distance of the interaction range LI to the membrane, they can bind to the membrane (Fig. (b)). Membrane-bound molecules can diffuse on the membrane only (Fig.(c)), or unbind from the membrane (Fig. (d)).
Figure S2: The time evolution of concentration of active Cdc42 in time at the front and back of the rectangular cells as shown in Figs. 2 and 3.
Figure S3: As in Figs. 9, 10, active Rac on the membrane is shown for different times and cells of different shapes, but here, the Rac activation rate in the first 100s increases linearly along a short axis of the ellipsoid (from lower left corner to upper right corner), and from then on, it increases linearly along the long axis of the ellipsoids (from the lower right corner to the upper left corner). In all cases, the volume of the ellipsoid cells is fixed as V = 800μm3, the main axis is 11.5μm (spherical, (a)-(d)), 15μm ((e)-(h)) and 20μm ((i)-(l)), and the other two axes are of the same length. Cells of all shapes are able to adapt to their new stimulus direction, with the elongated cells being slightly faster.
Table S1: Parameters of the cell polarization model equation (3), inferred for a cell with dimensions L, w, d = 20, 8, 5μm, so all values which multiply membrane concentrations are rescaled by the factor . This means . Furthermore, α, IR1, IR2 IRho and ICdc are multiplied by the baseline fraction of bound inactive molecules f. We have also rounded the parameters as appropriate.


