

Summary
Aneuploidy and structural variations (SVs) generate cancer genomes containing a mixture of rearranged genomic segments with extensive somatic copy number alterations. However, existing methods can identify either SVs or allele-specific copy number alterations, but not both simultaneously, which provides a limited view of cancer genome structure. Here we introduce Weaver, an algorithm for the quantification and analysis of allele-specific copy numbers of SVs. Weaver uses a Markov Random Field to estimate joint probabilities of allele-specific copy number of SVs and their inter-connectivity based on paired-end whole-genome sequencing data. Weaver also predicts the timing of SVs relative to chromosome amplifications. We demonstrate the accuracy of Weaver using simulations and findings from whole-genome Optical Mapping. We apply Weaver to generate allele-specific copy numbers of SVs for MCF-7 and HeLa cell lines, and identify recurrent SV patterns in 44 TCGA ovarian cancer whole-genome sequencing datasets. Our approach provides a more complete assessment of the complex genomic architectures inherent to many cancer genomes.
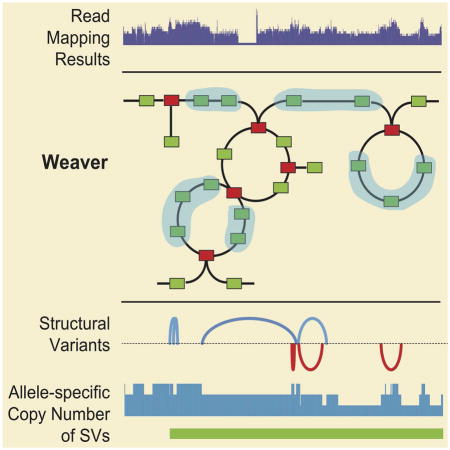
Graphical abstract
eTOC Blurb
A new algorithm that quantifies allele-specific structural variations can greatly improve the analysis of complex genomic alterations in cancer.
Introduction
Genome aneuploidy, which presents abnormal copy numbers of alleles are present, is one hallmark of cancer (Gordon et al., 2012; Newburger et al., 2013). A large proportion of tumors are aneuploid and have undergone somatic copy number alterations (CNAs) involving chromosome arms, or even whole-genome duplications (WGD) (Beroukhim et al., 2010; Gordon et al., 2012; Zack et al., 2013). In some types of cancers involving the bladder, ovarian, and lung, more than 50% of these tumors have undergone WGD (Zack et al., 2013). Structural variations (SVs), including deletions, insertions, duplications, and complex rearrangements, can further modify the aneuploid cancer genome into a mixture of rearranged genomic segments presenting an extensive range of CNAs. Indeed, aneuploid cancer genomes have significantly higher rate of CNAs as well as SVs (Zack et al., 2013). A comprehensive and precise characterization of these changes is key to understanding the somatic evolution of cancer genomes (Greenman et al., 2012) and interpreting cancer-specific gene expression and epigenetic alterations using high-throughput next-generation sequencing (NGS) data (Adey et al., 2013).
Allele-specific copy number of genome (ASCN-G) analysis has been performed for SNP array data (Carter et al., 2012; Van Loo et al., 2010) and recently for NGS data as well (Chen et al., 2015a; Holt et al., 2014; Mayrhofer et al., 2013; Wang et al., 2015). Separately, SV identification methods have also been developed for NGS data, such as (Chen et al., 2009; Rausch et al., 2012; Wang et al., 2011; Yang et al., 2013). It is essential to ask how SVs interact with ASCN-G and how different SVs interact with each other. The answers to such questions may foster a greater understanding of how to interpret the complex genomic structures that often characterize cancer cells, in addition to providing a more nuanced understanding of tumor evolution. However, to our knowledge, integrative methods created specifically for simultaneously analyzing SVs and ASCN-G using whole-genome sequencing data have not been developed. Indeed, except arm-level gain and loss, the majority of somatic CNAs are associated with SVs (Li et al., 2014). It has been shown that analyzing CNAs and SVs together can improve breakpoint identification and reveal the mutational forces that may give rise to a specific cancer subtype (Chen et al., 2015b; Li et al., 2014; Waddell et al., 2015). Moreover, the integrated approach may further assist variants phasing in different scales (both SNPs and SVs) in the context of complex cancer genome architecture. Numerous functional genomic datasets have been generated for cancer cell lines such as MCF-7 and HeLa, that prominently include findings from the ENCODE project (Consortium, 2012). However, most of such studies do not explicitly consider SVs and most of allelic functional genomic analyses only consider diploid genomes (Rozowsky et al., 2011). To fully characterize gene regulatory networks and epigenetic alterations in cancer genomes, it is critical to identify SVs and CNAs in allele-specific manner and in haplotype resolution to integrate with functional genomic studies (Adey et al., 2013).
Here, we introduce Weaver, a computational method to identify allele-specific copy number of SVs (ASCN-S) as well as the inter-connectivity of them in aneuploid cancer genomes. To our knowledge, no existing method can simultaneously analyze SVs and ASCN-G directly from whole-genome sequencing data. The methodological contributions of Weaver are trifold: (i) The method provides a quantitative copy number measurement of SVs in an allele-specific manner; (ii) It estimates the phasing of SVs using NGS data; (iii) The method generates highly accurate base-pair resolution ASCN-G profiling in aneuploid cancer genomes by simultaneously achieving (i) and (ii).
We assessed the accuracy of Weaver using simulated data, benchmarking against whole-genome Optical Mapping findings (Gupta et al., 2015; Ray et al., 2013), and comparison against previous analyses of cancer genome datasets. We applied Weaver to two widely used cancer cell lines, MCF-7 and HeLa. For both cell lines, we generated base-pair resolution ASCN-S and ASCN-G, which provide resources for future studies based on these two cell lines. As a proof of principle that Weaver can be used to study patient samples, we also applied it to TCGA ovarian cancer whole-genome sequencing data and identified recurrent patterns of structural variation.
Results
Overview of the Weaver algorithm
An overview of the Weaver algorithm is shown in Figure 1. The input of Weaver is the BAM file of aligned and unaligned reads from a particular cancer sample. If there is matched normal sample available, it can also be used (see Supplemental Experimental Procedures). The first step is to call variants (including both SNPs and SVs) based on the BAM file. Our framework is flexible and allows users to choose their own variant calling tools. The detailed description for preparing Weaver input is in the Supplemental Experimental Procedures. Using the intermediate results (yellow boxes in Figure 1A) including the cancer genome graph construction, Weaver builds the Markov Random Field (MRF) model. By solving the MRF maximum a posteriori (MAP) function (Equation 1), Weaver generates output as shown in the green boxes in Figure 1A. Figure 1B shows an example that illustrates ASCN-S and timing of SV from Weaver’s output. In contrast to existing methods, Weaver quantifies the copy number of SVs in an allele-specific manner (i.e., ASCN-S), thus providing useful information to help infer when the SV happened relative to the chromosome duplication (i.e., timing of SV). See Experimental Procedures and Supplemental Experimental Procedures for the details of the algorithm. Weaver’s source code is freely available at: https://github.com/ma-compbio/Weaver.
Figure 1.

Overview of the Weaver method. (A) Schema diagram for Weaver. Dark green boxes show the different types of analyses, unique to Weaver that are not dealt with by other methods. Light green boxes are ‘by-products’ of Weaver shown to have an improvement over existing methods. (B) An example demonstrating a Weaver output focused on ASCN-S and Timing of SV. Dark blue segments (two copies) and light blue segment (one copy) represent a portion of the MCF-7 genome that originated from the same allele on chr9. The other allele was lost during tumorigenesis, resulting in loss of heterozygosity. The predicted evolution of this region based on Weaver’s output is shown at the bottom: the ASCN-S of Del1 is 2 and the ASCN-S of Del2 is 1; both deletions occurred after the first amplification of the allele and before the second amplification.
Weaver uses the variant calling results to build a cancer genome graph (Figure 2B), which represents the connections among genomic regions in both normal genome and cancer genome. Next, the cancer genome graph is converted into a pair-wise MRF (Figure 2C). MRF is a type of probabilistic graphical model that captures the joint probability distributions, where nodes in the graph represent random variables and undirected edges represent dependencies among variables. In the MRF, ASCN-S and SV phasing configuration, together with genomic ASCN-G, are hidden states in the nodes and the observations contain sequencing information, including coverage and read linkage between variants (Figure 2D). Our goal of finding ASCN-S and SV phasing together with ASCN-G is formulated as searching for the MAP solution for the MRF. We utilize the loopy belief propagation framework to solve the problem.
Figure 2.

Illustration of the MRF model used in Weaver. (A) Hypothetical cancer chromosomes with the information of SVs and CNAs hidden. Boxes represent paternal (orange) and maternal (blue) alleles. Red dashed line represents linkages by SVs. dup, duplication; del, deletion; intrachr, intra-chromosomal rearrangement; interchr, inter-chromosomal rearrangement. (B) The cancer genome graph, constructed from (A), with nodes (boxes) representing genomic regions and edges representing reference adjacencies (solid lines) or cancer adjacencies (dashed lines). (C) MRF representation. Red boxes represent cancer nodes ℛc that have included SVs information; green boxes are the same as in (B) and represent genome nodes; ℛ the lines between genome nodes are genome edges ℰr; the lines between cancer nodes and genome nodes are cancer edges (ℰc). (D) Primary inputs and outputs are illustrated for each genome node and cancer node. Inputs are presented in the form of numbers ([coverage, allele frequency]) above each green box, and outputs are represented by colored circles below each box, with color showing the allele and occurrence reflecting the ASCN-G. For example, the observed coverage and allele frequency are 30 and 0.33 for genome node R1 and its output shows that there are two copies of the orange alleles and one copy of the blue allele. For the cancer node Rm, the output (one blue circle) indicates that the duplication is on the blue allele with one copy. (E) Blue boxes represent supernodes formed by merging blue shaded chains of genome nodes n as shown in (C). (F) Input and output of MRF are separated into genomic regions and SVs. For region R1, the input is observed with coverage 30 and allele frequency 0.33; the output has two copies on allele 1 and one copy on allele 2. n is a post-aneuploid deletion with one copy and both breakpoints are on allele 1 of chrA. t is a pre-aneuploid deletion with two copies and both breakpoints are on allele 1 of chrB. SV m, p, q and s are from the allele that has not been duplicated. μ0and μ1 suggest purity and b indicates haplotype level coverage. See also Figure S7.
Evaluation using simulations
We evaluated the performance of Weaver on simulated datasets. The simulated dataset contains different allele copy numbers with different ranges of SVs. The detailed steps on how the simulated data were generated are described in Supplemental Experimental Procedures.
Overall, Weaver identified 97.1% SVs with correct copy number and 95.7% of SVs were phased to correct allele (with dispersion parameter 1.26). The timing of SV can be inferred with pre- and post-aneuploid SVs. We correctly detected 97.3% pre- and 98.7% post-aneuploid SVs. Sensitivity (SN) is defined as [(correctly identified ASCN-S)/(all ASCN-S in the simulation benchmark)] and Specificity (SP) is defined as [(correctly identified ASCN-S)/(all reported ASCN-S from Weaver)] with specific copy numbers (Figure 3A–B). The dispersion parameter ϕ is approximated by adding various degrees of random noise to the original coverage of the simulated data. With increasing noise levels (larger dispersion ϕ), both SN and SP drop. However, based on our observation from TCGA samples, the dispersion is typically less than 1.5 (mean=1.2), suggesting that Weaver should perform well on actual cancer genome data. Overall, Weaver identified ASCN-G with both SN and SP >95% for simulated ASCN-G ranging from 0 to 4 copies (Figure 3C).
Figure 3.

Performance evaluation by comparing Weaver to other methods. In (A) and (B), SN and SP based on the results from Weaver are calculated for each ASCN-S under different coverage dispersions (ϕ) in simulation. Random fluctuations were imposed onto initial simulation dataset to create testing dataset with specific dispersion. Both SN and SP decrease with increasing SV copy number and dispersion. From the observation on whole-genome sequencing data, the real dispersion has mean value 1.2, suggesting that Weaver’s results on cancer whole-genome sequencing data will be highly accurate. (C) SN and SP are summarized for each ASCN-G from Weaver. (D) Switch error rate of Weaver and BEAGLE on simulated datasets with different allele ratios. With imbalanced dataset, the error rate of Weaver decreases to less than 0.5%. See also Figure S1, Table S1.
Next, we compared the output of Weaver to results from BEAGLE (Browning and Browning, 2009), a statistical SNP phasing method based on a population reference-panel of phased chromosomes. We evaluated Weaver using switching error rate, which is the standard metric for assessing phasing accuracy (Browning and Browning, 2011). The switching error is the proportion of switches in the inferred haplotypes to recover the correct phase in an individual. In our evaluation, we omitted the phasing information of the testing individual, and used the rest of the 1000 Genomes Project (1KGP) individuals as reference-panel. Overall, Weaver reported an average switching error rate 0.2%, while BEAGLE had an error rate of 3% on regions with imbalanced allele ratio. We have also observed a clear decrease of switching rate for Weaver on datasets with increasing allele imbalance (Figure 3D).
Application to the MCF-7 genome
We applied Weaver to whole-genome sequencing data of the MCF-7 breast cancer cell line, with approximately 78X overall coverage and 20X haplotype level coverage.
Overview of the results
Genome-wide ASCN-S and ASCN-G are shown in Figure 4A. 68.3% of MCF-7 genome have imbalanced ASCN-G, enabling accurate phasing of SNPs and distal SVs. Weaver identified 546 SVs with 83.3% having copy number greater than one. Among them, Weaver found 276 post-aneuploid SVs. Details of the Weaver ASCN-S results are in Data S1.
Figure 4.

Overview of the genomic landscape from the Weaver analysis of the MCF-7 cell line. (A) Overall results in circos plot. Inter-chromosomal and intra-chromosomal SVs larger than 10 Mbp are illustrated as red (1 copy) and purple (>1 copy) lines. Short range deletions, duplications and inversions (imbalanced) are presented as blue, red, and green vertical bars, respectively. Chr1, chr3, chr17 and chr20 have inter-connected focal amplifications. ASCN-Gs are plotted as blue and green segments with copy numbers indicated. (B) Distribution of allelic expression ratio measured by RNA-seq for different allele copy number categories. Red stars indicate allele copy ratio. See also Figure S2, Table S2.
We found two deletions that represent the unique capability of Weaver: Del1 (chr9:21,837,011-22,081,282) and Del2 (chr9:21,819,514-21,989,631), within the MTAP-CDKN2A/B region (Figure 1B), where deletions have been frequently observed in various cancers (Brennan et al., 2013; Zack et al., 2013). Weaver found that the short arm of chr9 was triplicated with loss of heterozygosity, having two different deletions Del1 and Del2, with copy number two and one, respectively. The copy number of deletions implies that the region has been amplified twice. Before the first amplification, which changed copy number from one to two, no deletion occurred. After the first amplification and before the second amplification, Del1 occurred on one haplotype, which was then duplicated in the second amplification, leading to two copies of Del1. Independent from Del1, Del2 was formed in approximately the same region on the other haplotype after the first amplification. Such evolutionary information cannot be revealed without SV copy number quantification.
Comparison with Optical Mapping analysis
We used Optical Mapping analysis of MCF-7 to compare with the results from Weaver. Optical Mapping (Dimalanta et al., 2004; Gupta et al., 2015; Schwartz et al., 1993; Teague et al., 2010; Valouev et al., 2006a; Valouev et al., 2006b) is a single-molecule system that constructs genome-wide physical maps from large datasets comprising ordered restriction maps (Rmaps; 1 Rmap is 1 restriction mapped DNA molecule) from individual genomic DNA molecules (300 kb – 2,000 kb). After assembly of Rmap datasets into optical maps (Rmap contigs), automated detection of structural variants (2 kb to multiple Mb) are discovered across the entire genome (Antonacci et al., 2010; Gupta et al., 2015; Ray et al., 2013; Teague et al., 2010), which provides long range linkage information that current NGS approaches are not able to achieve.
We selected 268 long range MCF-7 SVs detected by Weaver (inter-chromosomal or intra-chromosomal SVs with breakpoints distance >500 kb) and built an in silico ‘cancer reference map’ from these SVs by piecing together 300 kb flanking regions of two breakpoints for each SV. Of the 268 Weaver detected SVs, 235 are consistent with Optical Mapping analysis, suggesting that Weaver can accurately identify SVs. Note that the 33 missed by Optical Mapping may not be false positives from Weaver, as it is also possible that no Rmaps happened to capture that SV. The Optical Mapping data also corroborated the length and location of 26 (of 29) tandem duplications detected by Weaver (see an example in Figure S2A).
Integrated analysis with functional genomic data
Recent work in HeLa cells has suggested the need for haplotype-resolved cancer genomes for allelic analysis of transcriptome and epigenome data (Adey et al., 2013). Using data from the ENCODE project on MCF-7, here we show that the results generated by Weaver could help better interpret cancer functional genomic sequencing data.
ASCN-G predicted by Weaver correlates well with the allelic expression data (RNA-seq) in MCF-7 (Figure 4B). We further assessed the capability of Weaver in understanding the impact of cancer genome structure on gene regulation. We utilized the chromatin interaction data from ChIA-PET, which is a technology that combines 3C-based methods with ChIP to probe chromosomal contacts that involve certain proteins (Fullwood et al., 2009). The expected range of chromatin interactions probed by ChIA-PET is ≤ 400 kb, however, unexpected interactions with ultra-long range were also observed in previous analysis (Li et al., 2012). We wanted to assess whether these seemingly ultra-long range interactions were actually established by long range SVs in cancer genome. We selected ultra-long range ChIA-PET clusters using the following criteria: (i) paired-end tag (PET) count >4 for each PET cluster; (ii) intra-chromosomal clusters with genomic span >400 kb. We searched SVs identified by Weaver against each ultra-long range ChIA-PET cluster and then called a ChIA-PET cluster being correlated with SV, if: (i) the orientation of SV is consistent with the relative position of SV and ChIA-PET cluster; and (ii) the new genomic span of ChIA-PET in cancer genome remodeled by SVs is ≤ 400 kb, but still >8 kb to exclude ChIA-PET cluster from self-ligation on the same DNA fragment (Li et al., 2012).
Indeed, we found many potentially artificial ‘MCF-7 specific chromatin interactions’ because, when considering SVs, they reside right on two SV breakpoints and likely were originated from single binding site on either side of SV, rather than two distinct ones (details in Table S2). For SV-related intra-chromosomal ChIA-PET clusters, the median genomic span on the human reference genome and the MCF-7 genome is 3,353,180 bp and 212,803 bp, respectively. SV-related inter-chromosomal ChIA-PET clusters are on the same chromosome in MCF-7 genome and the median genomic span is 151,872 bp. To test the significance of the correlation between MCF-7 SV and MCF-7 long-range ChIA-PET clusters, we also searched the correlation between MCF-7 SV and ChIA-PET clusters from other cell lines (Table S2), which is much less significant.
We have identified a potential chromothripsis event (Korbel and Campbell, 2013; Stephens et al., 2011) with eight fragments from chr17 and nine fragments from chr20 in MCF-7, supported by long-range ChIA-PET cluster. In Figure S2B, a ChIA-PET cluster has linked two flanking promoters (BMP7 and INTS2) together, supporting the existence of the entire complex cancer contig. Note that this region has been amplified many times and the chr20 amplified region also links to another amplified region on chr20. Additionally, we have discovered that the phasing of different SVs and allele-specific information produced by Weaver can enable the analysis of interaction between genomic rearrangements and long-range gene regulation at much broader scale. We use Figure 5A as an example. Combining the SV results from Weaver and the ChIA-PET data, the allele-specific expression of SLC35C1 was likely caused by the chromatin interaction formed by the allele-specific SVs (see details in Figure 5). The phasing of the SVs in Figure 5A is also consistent with the Optical Mapping analysis (Figure 5B).
Figure 5.

An example showing that allelic gene expression is likely driven by allele-specific SVs. (A) The blue/green segments represent genomic regions originated from two different alleles. Two intra-chromosomal SVs (rearrangements) on chr11, both amplified to three copies and on the same allele, are indicated by blue lines, while the intact chr11 allele (green) has been amplified to two copies. The derived region from two allele-specific intra-chromosomal SVs brought gene SLC35C1 and gene PRSS23, which are normally ~40 Mb apart and on different chromosome arms, to only ~50 kb on three copies of the rearranged chromosomes (blue segments). ChIA-PET data reveals that the physical proximity of SLC35C1 and PRSS23 in cancer potentially leads to the MCF-7 specific promoter-promoter interaction (highlighted in green) of these two genes. RNA-seq reads aligned to two SNV sites within SCL35C1 exons (thin red lines) show greater (binomial test P-value < 1e–5) blue/green ratio as compared to DNA copy ratio (3/2), indicating that blue allele-specific expression of SLC35C1 has been elevated. Together with the SV data and the ChIA-PET data, the allele-specific expression of SLC35C1 was likely caused by the chromatin interaction formed by the allele-specific SVs. (B) Optical Mapping analysis serves as an independent comparison of SV phasing in (A). Four Optical Mapping Rmaps were found consistent with the phasing in chr11 predicted by Weaver. Purple dots show the BamH1 cutting sites missed in the Rmaps. Black and blue numbers represent the size of BamH1 cutting fragments on the reference genome and cancer SV. Red and purple numbers represent the size of Optical Mapping fragments from normal cutting and missed cutting, respectively.
These analyses indicate that the SV information provided by Weaver will be useful for analyzing epigenome data from cancer genomes with large-scale somatic alterations.
Application to the HeLa CCL-2 genome
We applied Weaver to the whole-genome sequencing data of the HeLa cells CCL-2 generated by (Adey et al., 2013). Haplotype level coverage is approximately 28X.
Overview of the results and comparison with Adey et al. (2013)
The original study by (Adey et al., 2013) reported 12 inter-chromosomal SVs, and no large scale intra-chromosomal SV was reported (only deletions and inversions with size <10 kb are reported). However, from our analysis on the same data, we identified 8 inter-chromosomal and 86 intra-chromosomal SVs (if intra-chromosomal SVs are deletion or tandem duplication type, only those with size >20 kb are reported) (Data S1).
Overall, there are 62 genes harboring SV breakpoints. Genome-wide representation of the Weaver results on HeLa is in Figure 6A. ASCN-G predicted by Weaver correlates well with the allele-specific expression in HeLa (Figure S3A). The large-scale aneuploidy and loss of heterozygosity regions have high agreement with (Adey et al., 2013). Comparing with the results from (Adey et al., 2013), for all genomic regions with copy number profiled, 96.1% have consistent overall copy number estimation between the two studies. For ASCN-G, the consistency is 97.3% by comparing Weaver output with Table S13 in (Adey et al., 2013) (see also Figure 1a in (Adey et al., 2013)). Note that Weaver only used Illumina sequencing reads from (Adey et al., 2013) (where different types of long-reads data were also utilized).
Figure 6.

Overview of the genomic landscape from the Weaver result on the HeLa cell line. (A) Overall results in circos plot (same legend as in Figure 3A). (B) Complex SVs on the FHIT gene region. Blue/green segments represent chromosomes originated from the same parental allele in the normal genome. Allele frequency is plotted by minor allele frequency of germline SNPs. Five SVs were detected in this small region and all have copy number 1. Adey et al. (2013) did not report these SVs or CNAs in the FHIT gene. (C) Complex SVs and CNAs on chr11 in HeLa. HH: head-to-head inverted; TT: tail-to-tail inverted. Both copy number 1 and 2 are found for the SVs on Allele 1 here. SVs with ASCN-S 2 emerged before allele 1 amplification, while the SVs with ASCN-S 1 happened after the amplification of allele 1. See also Figure S3.
Weaver found an allele-specific SV (deletion) of the FHIT gene which was missed in the result from (Adey et al., 2013) (Figure 6B). FHIT is a tumor suppressor gene that is frequently down-regulated in various human cancer samples, including the HeLa cell line (Druck et al., 1998; Otterson et al., 1998; Wistuba et al., 1997). In this region, there are five deletions, all of which have copy number one. Weaver identified these deletions as well as their allele-specific history (Figure 6B).
ASCN-S on chr11 and chr19 in HeLa
Chr11 and chr19 have undergone extensive amount of SVs (Figure 6C and Figure S3B), which have also been reported in HeLa Kyoto cell line (Landry et al., 2013). Weaver was able to assign different timing for the two possible chromothripsis events on chr11 and chr19.
The chromothripsis on chr11 happened before whole chromosome duplication (since most of the breakpoints have copy number > 1) (Figure 6C), while chromothripsis on chr19 happened after duplication (since most of the breakpoints have copy number 1). For chr11, we found that all SVs are on allele 1 (blue), while allele 2 (green) is intact and does not have SVs. The SVs were likely to be formed by chromothripsis (Korbel and Campbell, 2013; Stephens et al., 2011).
For chr19, all SVs have copy number one and are on one copy of allele 1 (blue), except the inter-chromosomal SV (chr13:55,878,043-chr19:12,898,480) which is on allele 2 (green). Since no fold-back inversions have been observed on chr19, the elevated rate of rearrangements on chr19 is not from breakage-fusion-bridge cycles (Bignell et al., 2007; Campbell et al., 2010; Li et al., 2014; Zakov et al., 2013). Moreover, the high allele specificity of SVs on allele 1 implies that allele 1 of chr19 was rearranged from one chromothripsis event. Weaver has labeled all intra-chromosomal SVs on chr19 as post-aneuploidy, such that one copy of allele 1 does not have SVs after the initial amplification of allele 1, which is consistent with previous observation that there are two normal copies of chr19 in HeLa (Macville et al., 1999).
Application to 44 TCGA ovarian cancer whole-genome sequencing samples
Previous studies have shown that ovarian cancers exhibit genomic instability, including recurrent non-random chromosomal abnormalities, multiple chromosomal losses and gains, and the presence of marker chromosomes (Diebold et al., 2000; Micci et al., 2009; Pejovic et al., 2006; Wang et al., 2014). The TCGA project has created a detailed catalogue of genomic aberrations in ovarian cancer and suggested that the degree of somatic CNAs in ovarian cancer is strikingly high as compared to other types of cancer (Cancer Genome Atlas Research, 2011). To demonstrate that Weaver can be applied to patient samples to refine the analysis of complex SVs, we applied Weaver on 44 high-coverage (>15X on haplotype level) TCGA ovarian cancer samples.
As previously mentioned, the current state of Weaver does not work with tumor samples harboring complex subclones. To quantify this limitation, we did a simulation study and found that if the subclone fraction is 10%, the ASCN-G result from Weaver can still achieve over 95% accuracy (Supplemental Experimental Procedures and Figure S4). Of the 44 ovarian cancer samples we selected, 40 have subclone fraction less than 10% (based on Supplementary Table 1 from (Carter et al., 2012)), suggesting that the vast majority of these samples do not have an abundance of subclones and Weaver results are reliable. The results from Weaver for all the samples are presented in Figure S5. Details of the Weaver ASCN-S results of these TCGA samples are in Data S1. Genome-wide representation of Weaver results from one sample, TCGA-36-1571, is in Figure S6A. Using this sample as an example (Figure 7A), we demonstrate that Weaver can refine the ASCN-G analysis (as compared to ASCAT (Van Loo et al., 2010) and ABSOLUTE (Carter et al., 2012)) with additional ASCN-S information.
Figure 7.

Weaver results from TCGA ovarian cancer samples. (A) Weaver results from an ovarian cancer sample (TCGA-36-1571), as compared to ASCAT and ABSOLUTE. ASCN-G from Weaver, ASCAT and ABSOLUTE are plotted as blue and green segments, indicating the copy number of two different alleles as well as SVs involved. For region chr2:66–73 Mb, ABSOLUTE assigned ASCN-G 3:2, while Weaver and ASCAT reported 2:2, which is more consistent with the allele frequency 0.5. Similarly, ASCAT assigned the region chr2:75–83 Mb with ASCN-G 3:2, while Weaver and ABSOLUTE reported it as 2:2, which is more consistent with the allele frequency 0.5. Weaver reported that region chr2:73.2–73.5 Mb is a duplication that has two copies and is linked (with base-pair resolution SV breakpoints) to chr12. ABSOLUTE, however, has given the incorrect boundaries (chr2:73.0–73.3 Mb) of the small duplication, while ASCAT has assigned less accurate boundaries and wrong copy numbers (5:2 is not consistent with the observed allele frequency). Both ASCAT and ABSOLUTE cannot recognize how the duplicated copies are connected in the cancer genome. (B) The overall copy number profile on chr19 across 44 ovarian cancer samples. The chromosome bands are highlighted with red and blue, representing the frequently amplified and deleted regions from the TCGA array data (Cancer Genome Atlas Research, 2011). The CCNE1 gene is within the most significantly amplified region. Four pink vertical bars represent the regions where the copy number profile has changed and all four regions have recurrent fold-back inversions (FBIs). (C) Four ovarian cancer samples with recurrent FBI at KDM4B are illustrated. Red fold-back arrows represent FBIs while blue lines represent other intra-chromosomal SVs. See also Figure S4, Figure S5, Figure S6.
Compared to other chromosomes, chr19 is significantly enriched with fold-back inversions (Figure S6D). Fold-back inversions, together with copy number profiles, are reliable indicators of break-fusion-bridge cycles (Zakov et al., 2013). Figure 7B shows the overall copy number profile of chr19 across 44 ovarian cancer samples. Gene CCNE1 is within the most significantly amplified region. Amplification of CCNE1, which encodes cyclin E1, is associated with primary treatment failure in ovarian cancer patients and has been validated as a dominant marker of patient outcome (Etemadmoghadam et al., 2009). Previous studies have reported that CCNE1 amplification is one of the most common focal CNA events in ovarian cancer (Cancer Genome Atlas Research, 2011; Patch et al., 2015).
One small region on 19p13.3 (4.6M-6.7M) is enriched with fold-back inversions that lead to the amplification of 19p13.2. Especially TCGA-04-1514, TCGA-24-1552, TCGA-13-1491 and TCGA-13-0727 (4 out of 44 deep sequencing samples analyzed) have fold-back inversions with breakpoints within a <60 kb region (Figure 7C). Notably, the breakpoints are right around KDM4B from KDM4 protein family. Studies have shown that KDM proteins, including KDM4B, are perturbed in various types of cancers (Berry and Janknecht, 2013).
Discussion
Genomes of somatic cells undergo dramatic and complex alterations during cancer progression that include point mutations, SVs, large-scale gains or losses, and even aneuploidy. Aneuploidy is a common attribute of cancer as reconfirmed by sequencing in a recent pan-cancer study that estimated that over one third of the analyzed tumors have WGD, and the proportion can reach over 50% in some types of cancer (Zack et al., 2013). In addition, genome aberrations caused by SVs and CNAs are a common feature of a wide variety of neoplastic lesions. Recent advances in NGS and single molecule technologies have provided us with an unprecedented opportunity to better characterize these different genomic changes in cancer. However, even though methods have been separately developed to identify SVs and CNAs using NGS reads (Chen et al., 2009; Hormozdiari et al., 2009; Medvedev et al., 2010; Rausch et al., 2012; Sindi et al., 2012; Wang et al., 2011; Yang et al., 2013), no algorithm is currently available to simultaneously identify SVs and CNAs in aneuploid cancer genomes, which would be critical to reveal detailed tumor evolution (Greenman et al., 2012). Our algorithm is generic for the consideration of both WGD and local CNAs, such as focal amplification (note that WGD can be treated as a global CNA). This gives us the capability to handle complex genomes with SVs and CNAs in the same regions. By connecting different SVs in the context of WGD and local CNAs, Weaver allows determination of whether a copy number change of an SV is caused by local amplification/deletion or whole chromosome duplication/deletion. Therefore, Weaver quantifies allele-specific copy number of SVs in cancer genomes and provides a more integrative solution to study complex cancer genomic alterations.
We expect that Weaver will prove to be a useful route for the refinement of the extant analyses of datasets created by large-scale projects such as TCGA and ICGC, which were mostly sequenced using short read NGS technologies. In particular, as we have demonstrated in this work, it is important to consider ASCN-G and ASCN-S when we perform functional genomic analysis from the same genome (e.g., using RNA-seq, ChIP-seq, and other epigenomic datasets) in order to identify tumor-specific gene regulations. The algorithm in Weaver is not restricted to short reads and can in principle adapt to data from longer read sequencing technology (Chaisson et al., 2015; Pendleton et al., 2015; Zheng et al., 2016) and even newer mapping approaches (Jo et al., 2007; Kounovsky-Shafer et al., 2013), because the cancer genome graph can incorporate SVs identified by longer reads. However, it will remain difficult to completely elucidate those very large complex SVs in cancer genomes, using contemporary sequencing data, especially when the breakpoint regions caused by SVs contain highly repetitive sequences.
There are a number of areas that the Weaver algorithm can be further improved. Copy number neutral events where breakpoints do not have significant copy number changes are currently not handled well in Weaver. Although Weaver sets no limit on maximum copy number, its accuracy in quantifying SVs is hampered for those residing in highly repetitive regions found in either the reference, or cancer genome. In regards to the MCF-7 genome, chromosomes 3, 17 and 20 have regions with higher than 100 copies. Consequently, estimations of copy number and phasing of SVs within those regions may be less reliable. In addition, even though the probabilistic graphical model employed in Weaver is generically designed to consider complex tumor subclones caused by intra-tumor heterogeneity, the current version of Weaver only works for samples with a dominating tumor cell clone (which can be estimated by tools such as ABSOLUTE) with some possible contamination by normal cells. However, recently a number of new algorithms have been developed to specifically identify subclonal structure of tumor cell populations (Fischer et al., 2014; McPherson et al., 2015; Miller et al., 2014; Oesper et al., 2013; Oesper et al., 2014; Popic et al., 2015; Prandi et al., 2014). Method like TITAN (Ha et al., 2014) was also developed to estimate allele-specific copy number alterations in a mixture of tumor cell population, although TITAN does not handle complex SVs. Nevertheless, the results from these algorithms that identify tumor subclone architecture are complementary to what Weaver can achieve. However, new methods are needed to quantify ASCN-S and understand how complex SVs interact in the context of a mixture of aneuploid tumor cell population to reconstruct the evolutionary history of tumor genomes.
Experimental Procedures
Genome partitioning and cancer genome graph construction
In the Weaver algorithm, we first partition the genome into non-overlapping regions (with default size W =5 kb) as follows: (i) Breakpoints in the input SV set 𝒞 must be on region boundaries; (ii) Each region may contain no more than one SNP; (iii) The size of each region must be ≤ W. Based on various datasets in this work, we found that the number of regions from the initial segmentation ranges from 1.7 million to 2 million, depending on the size of the loss of heterozygosity regions and the number of SVs. This is a combined strategy that utilizes both fixed window size and SV boundaries for segmentation. Since SV breakpoints and CNA boundaries do not always match, our proposed MRF models this probabilistically. This approach has the advantage of providing base-level ASCN-G boundaries as compared to existing genome segmentation methods in copy number analysis, which typically use fixed segmentation size.
Given the initial segmentation of the genome and the SV set 𝓒, we then build cancer genome graph 𝓖:={𝓡, ℰ}, with nodes representing the genomic region set (ℛ) and edges representing reference adjacencies (ℰr) (solid lines in Figure 2B) if two nodes are adjacent in the normal genome and cancer adjacencies (ℰc) (dashed lines in Figure 2B) if two nodes are adjacent in the cancer genome by SV c linkage. Similar types of graphs have been used previously to study cancer SVs with different purpose (McPherson et al., 2015; Oesper et al., 2012). Edge configurations ℰ between nodes Ri and Rj can be represented as: (δiRi~δjRj), δ ∈ {+,−}, with + and − representing the tail (right) and head (left) of a given genomic region R, e.g., (+Ri~ − Ri+1) ∈ ℰr, if Ri and Ri+1 are adjacent regions from the same chromosome in the normal genome.
We then convert the original cancer genome graph 𝓖:= {ℛ,ℰ} to Markov Random Field (MRF, ℳ:= (ℛ,ℛc, ℰr, ℰc), which is a widely used probabilistic graphical model to estimate joint probabilities. The detailed steps of this conversion are described in Supplemental Experimental Procedures with example in Figure 2. The MRF can be viewed as an undirected graph and the aggregated inference problem in Weaver given sequencing data can be viewed as a maximum a posteriori (MAP) problem with hidden states and observations explained in the following section. Unlike conventional methods for estimating copy number changes based on hidden Markov models (HMMs), which are designed for sequential data and only consider the dependencies between ‘local’ variables, MAP solution of MRF model provides the most probable configuration of aneuploid cancer genomes with complex SVs, involving ‘global’ variable dependencies defined by long-range SVs (i.e., distal connections of variants). This is the main rationale of using MRF for our problem. In the following section, we describe the formulation of the MRF MAP problem. Detailed definitions of hidden states, observations, and potential functions of nodes and edges are provided in Supplemental Experimental Procedures. In Figure 2D, we use an example to illustrate the input/output as well as genome node, cancer node, genome edge, and cancer edge.
Solving the MRF model ℳ
The overall goal of our MRF model is to predict hidden states ℋ based on the observations 𝓞 (see Supplemental Experimental Procedures for the definitions of ℋ and 𝓞). After we convert the cancer genome graph 𝓖 to the MRF ℳ framework using the steps detailed in Supplemental Experimental Procedures, the problem is formulated as searching for the MAP solution, which is given by:
| (1) |
where ΘR(𝒪|Hi) is the genome node (green box in Figure 2C) potential function (e.g., we use negative binomial model to consider the over-dispersion of read coverage); Θ𝒞(𝒪|Hc) denotes constraint function in cancer nodes (red box in Figure 2C); ΨR(𝒪|Hi, Hi+1) is the genome edge (link between green boxes in Figure 2C) function, providing pairwise constraints of hidden states of neighboring nodes Ri and Ri+1; Ψ𝒞(Hi, Hc) is the cancer edge (link between green and red box in Figure 2C) potential function; and 𝓝(c) stands for the index of genome nodes linked to SV c. Figure 2D provides a zoom-in view of the MRF to highlight these notations. The definition of these functions are given in Supplemental Experimental Procedures.
Intuitively, ℋ̂ represents the hidden states H (which represent the solutions to allele-specific copy number estimation for all the nodes in ℳ) that maximize the given function. Specifically, ℋ̂ includes the best global estimation for base-pair resolution ASCN-G as well as ASCN-S. The general MRF MAP problem is computationally intractable (Shimony, 1994). Several approximation approaches have been proposed to solve this problem. Here we utilize Belief Propagation to solve the MRF MAP problem. Belief Propagation was originally proposed for graphs without cycle (Pearl, 1988), in which case the fixed point of max-product belief propagation algorithm is also the assignment of MAP (Weiss and Freeman, 2001). When applying on graph with arbitrary topology, the loopy belief propagation can still approximate well to the MAP configuration (Frey and MacKay, 1998). See Figure 2E and Supplemental Experimental Procedures for details.
As illustrated in Figure 2F, the final output of Weaver has three major parts: (i) the purity (μ0 and μ1) and haplotype level coverage b; (ii) ASCN-G; (iii) ASCN-S, as well as the timing of SVs with respect to chromosome amplification or deletion (see an example in Figure 1B).
Supplementary Material
Highlights.
Weaver is an algorithm for analyzing cancer whole-genome sequencing data
It quantifies allele-specific structural variants (SVs) in aneuploid genomes
Weaver provides an integrative way to study complex SVs and copy number alterations
We compare with Optical Mapping analysis and apply to HeLa, MCF-7, and TCGA samples
Acknowledgments
The HeLa genome sequence used in this work was derived from a HeLa cell line. Henrietta Lacks, and the HeLa cell line that was established from her tumor cells without her knowledge or consent in 1951, have made significant contributions to scientific progress and advances in human health. We are grateful to Henrietta Lacks, now deceased, and to her surviving family members for their contributions to biomedical research. This study was reviewed by the NIH HeLa Genome Data Access Working Group. The genomic datasets used for analysis described in this manuscript were obtained from the database of Genotypes and Phenotypes (dbGaP) through dbGaP accession number phs000640.v1.p1. The authors would also like to thank the TCGA Research Network for making the data publicly available. The study is supported in part by National Cancer Institute grant CA182360 (D.C.S. and J.M.). J.M. is additionally supported by National Institutes of Health grants HG007352 and DK107965, and National Science Foundation grants 1054309 and 1262575. D.C.S. is also supported by National Human Genome Research Institute grant HG00225.
Footnotes
The authors declare no conflict of interests.
Accession Numbers
The MCF-7 whole-genome sequencing data is available under BioProject PRJNA317928 with accession SRX1705314.
Author Contributions
Conceptualization, Y.L., D.C.S., and J.M.; Methodology, Y.L. and J.M.; Software, Y.L.; Investigation, Y.L., S.Z., D.C.S., and J.M.; Writing – Original Draft, Y.L. and J.M.; Writing – Review & Editing, Y.L., D.C.S., and J.M.; Funding Acquisition, D.C.S. and J.M.
Publisher's Disclaimer: This is a PDF file of an unedited manuscript that has been accepted for publication. As a service to our customers we are providing this early version of the manuscript. The manuscript will undergo copyediting, typesetting, and review of the resulting proof before it is published in its final citable form. Please note that during the production process errors may be discovered which could affect the content, and all legal disclaimers that apply to the journal pertain.
References
- Adey A, Burton JN, Kitzman JO, Hiatt JB, Lewis AP, Martin BK, Qiu R, Lee C, Shendure J. The haplotype-resolved genome and epigenome of the aneuploid HeLa cancer cell line. Nature. 2013;500:207–211. doi: 10.1038/nature12064. [DOI] [PMC free article] [PubMed] [Google Scholar]
- Antonacci F, Kidd JM, Marques-Bonet T, Teague B, Ventura M, Girirajan S, Alkan C, Campbell CD, Vives L, Malig M, et al. A large and complex structural polymorphism at 16p12.1 underlies microdeletion disease risk. Nature genetics. 2010;42:745–750. doi: 10.1038/ng.643. [DOI] [PMC free article] [PubMed] [Google Scholar]
- Beroukhim R, Mermel CH, Porter D, Wei G, Raychaudhuri S, Donovan J, Barretina J, Boehm JS, Dobson J, Urashima M, et al. The landscape of somatic copy-number alteration across human cancers. Nature. 2010;463:899–905. doi: 10.1038/nature08822. [DOI] [PMC free article] [PubMed] [Google Scholar]
- Berry WL, Janknecht R. KDM4/JMJD2 histone demethylases: epigenetic regulators in cancer cells. Cancer research. 2013;73:2936–2942. doi: 10.1158/0008-5472.CAN-12-4300. [DOI] [PMC free article] [PubMed] [Google Scholar]
- Bignell GR, Santarius T, Pole JC, Butler AP, Perry J, Pleasance E, Greenman C, Menzies A, Taylor S, Edkins S, et al. Architectures of somatic genomic rearrangement in human cancer amplicons at sequence-level resolution. Genome Res. 2007;17:1296–1303. doi: 10.1101/gr.6522707. [DOI] [PMC free article] [PubMed] [Google Scholar]
- Brennan CW, Verhaak RG, McKenna A, Campos B, Noushmehr H, Salama SR, Zheng S, Chakravarty D, Sanborn JZ, Berman SH, et al. The somatic genomic landscape of glioblastoma. Cell. 2013;155:462–477. doi: 10.1016/j.cell.2013.09.034. [DOI] [PMC free article] [PubMed] [Google Scholar]
- Browning BL, Browning SR. A unified approach to genotype imputation and haplotype-phase inference for large data sets of trios and unrelated individuals. Am J Hum Genet. 2009;84:210–223. doi: 10.1016/j.ajhg.2009.01.005. [DOI] [PMC free article] [PubMed] [Google Scholar]
- Browning SR, Browning BL. Haplotype phasing: existing methods and new developments. Nature reviews Genetics. 2011;12:703–714. doi: 10.1038/nrg3054. [DOI] [PMC free article] [PubMed] [Google Scholar]
- Campbell PJ, Yachida S, Mudie LJ, Stephens PJ, Pleasance ED, Stebbings LA, Morsberger LA, Latimer C, McLaren S, Lin ML, et al. The patterns and dynamics of genomic instability in metastatic pancreatic cancer. Nature. 2010;467:1109–1113. doi: 10.1038/nature09460. [DOI] [PMC free article] [PubMed] [Google Scholar]
- Cancer Genome Atlas Research N. Integrated genomic analyses of ovarian carcinoma. Nature. 2011;474:609–615. doi: 10.1038/nature10166. [DOI] [PMC free article] [PubMed] [Google Scholar]
- Carter SL, Cibulskis K, Helman E, McKenna A, Shen H, Zack T, Laird PW, Onofrio RC, Winckler W, Weir BA, et al. Absolute quantification of somatic DNA alterations in human cancer. Nature biotechnology. 2012;30:413–421. doi: 10.1038/nbt.2203. [DOI] [PMC free article] [PubMed] [Google Scholar]
- Chaisson MJ, Huddleston J, Dennis MY, Sudmant PH, Malig M, Hormozdiari F, Antonacci F, Surti U, Sandstrom R, Boitano M, et al. Resolving the complexity of the human genome using single-molecule sequencing. Nature. 2015;517:608–611. doi: 10.1038/nature13907. [DOI] [PMC free article] [PubMed] [Google Scholar]
- Chen H, Bell JM, Zavala NA, Ji HP, Zhang NR. Allele-specific copy number profiling by next-generation DNA sequencing. Nucleic acids research. 2015a;43:e23. doi: 10.1093/nar/gku1252. [DOI] [PMC free article] [PubMed] [Google Scholar]
- Chen K, Wallis JW, McLellan MD, Larson DE, Kalicki JM, Pohl CS, McGrath SD, Wendl MC, Zhang Q, Locke DP, et al. BreakDancer: an algorithm for high-resolution mapping of genomic structural variation. Nat Methods. 2009;6:677–681. doi: 10.1038/nmeth.1363. [DOI] [PMC free article] [PubMed] [Google Scholar]
- Chen X, Gupta P, Wang J, Nakitandwe J, Roberts K, Dalton JD, Parker M, Patel S, Holmfeldt L, Payne D, et al. CONSERTING: integrating copy-number analysis with structural-variation detection. Nat Methods. 2015b;12:527–530. doi: 10.1038/nmeth.3394. [DOI] [PMC free article] [PubMed] [Google Scholar]
- Consortium EP. An integrated encyclopedia of DNA elements in the human genome. Nature. 2012;489:57–74. doi: 10.1038/nature11247. [DOI] [PMC free article] [PubMed] [Google Scholar]
- Diebold J, Mosinger K, Peiro G, Pannekamp U, Kaltz C, Baretton GB, Meier W, Lohrs U. 20q13 and cyclin D1 in ovarian carcinomas. Analysis by fluorescence in situ hybridization. J Pathol. 2000;190:564–571. doi: 10.1002/(SICI)1096-9896(200004)190:5<564::AID-PATH569>3.0.CO;2-L. [DOI] [PubMed] [Google Scholar]
- Dimalanta ET, Lim A, Runnheim R, Lamers C, Churas C, Forrest DK, de Pablo JJ, Graham MD, Coppersmith SN, Goldstein S, et al. A microfluidic system for large DNA molecule arrays. Anal Chem. 2004;76:5293–5301. doi: 10.1021/ac0496401. [DOI] [PubMed] [Google Scholar]
- Druck T, Berk L, Huebner K. FHITness and cancer. Oncol Res. 1998;10:341–345. [PubMed] [Google Scholar]
- Etemadmoghadam D, deFazio A, Beroukhim R, Mermel C, George J, Getz G, Tothill R, Okamoto A, Raeder MB, Harnett P, et al. Integrated genome-wide DNA copy number and expression analysis identifies distinct mechanisms of primary chemoresistance in ovarian carcinomas. Clin Cancer Res. 2009;15:1417–1427. doi: 10.1158/1078-0432.CCR-08-1564. [DOI] [PMC free article] [PubMed] [Google Scholar]
- Fischer A, Vazquez-Garcia I, Illingworth CJ, Mustonen V. High-definition reconstruction of clonal composition in cancer. Cell reports. 2014;7:1740–1752. doi: 10.1016/j.celrep.2014.04.055. [DOI] [PMC free article] [PubMed] [Google Scholar]
- Frey BJ, MacKay DJ. A revolution: Belief propagation in graphs with cycles. Advances in neural information processing systems. 1998:479–485. [Google Scholar]
- Fullwood MJ, Liu MH, Pan YF, Liu J, Xu H, Mohamed YB, Orlov YL, Velkov S, Ho A, Mei PH, et al. An oestrogen-receptor-alpha-bound human chromatin interactome. Nature. 2009;462:58–64. doi: 10.1038/nature08497. [DOI] [PMC free article] [PubMed] [Google Scholar]
- Gordon DJ, Resio B, Pellman D. Causes and consequences of aneuploidy in cancer. Nature reviews Genetics. 2012;13:189–203. doi: 10.1038/nrg3123. [DOI] [PubMed] [Google Scholar]
- Greenman CD, Pleasance ED, Newman S, Yang F, Fu B, Nik-Zainal S, Jones D, Lau KW, Carter N, Edwards PA, et al. Estimation of rearrangement phylogeny for cancer genomes. Genome Res. 2012;22:346–361. doi: 10.1101/gr.118414.110. [DOI] [PMC free article] [PubMed] [Google Scholar]
- Gupta A, Place M, Goldstein S, Sarkar D, Zhou S, Potamousis K, Kim J, Flanagan C, Li Y, Newton MA, et al. Single-molecule analysis reveals widespread structural variation in multiple myeloma. Proc Natl Acad Sci U S A. 2015;112:7689–7694. doi: 10.1073/pnas.1418577112. [DOI] [PMC free article] [PubMed] [Google Scholar]
- Ha G, Roth A, Khattra J, Ho J, Yap D, Prentice LM, Melnyk N, McPherson A, Bashashati A, Laks E, et al. TITAN: inference of copy number architectures in clonal cell populations from tumor whole-genome sequence data. Genome Res. 2014;24:1881–1893. doi: 10.1101/gr.180281.114. [DOI] [PMC free article] [PubMed] [Google Scholar]
- Holt C, Losic B, Pai D, Zhao Z, Trinh Q, Syam S, Arshadi N, Jang GH, Ali J, Beck T, et al. WaveCNV: allele-specific copy number alterations in primary tumors and xenograft models from next-generation sequencing. Bioinformatics. 2014;30:768–774. doi: 10.1093/bioinformatics/btt611. [DOI] [PMC free article] [PubMed] [Google Scholar]
- Hormozdiari F, Alkan C, Eichler EE, Sahinalp SC. Combinatorial algorithms for structural variation detection in high-throughput sequenced genomes. Genome Res. 2009;19:1270–1278. doi: 10.1101/gr.088633.108. [DOI] [PMC free article] [PubMed] [Google Scholar]
- Jo K, Dhingra DM, Odijk T, de Pablo JJ, Graham MD, Runnheim R, Forrest D, Schwartz DC. A single-molecule barcoding system using nanoslits for DNA analysis. Proc Natl Acad Sci U S A. 2007;104:2673–2678. doi: 10.1073/pnas.0611151104. [DOI] [PMC free article] [PubMed] [Google Scholar]
- Korbel JO, Campbell PJ. Criteria for inference of chromothripsis in cancer genomes. Cell. 2013;152:1226–1236. doi: 10.1016/j.cell.2013.02.023. [DOI] [PubMed] [Google Scholar]
- Kounovsky-Shafer KL, Hernandez-Ortiz JP, Jo K, Odijk T, de Pablo JJ, Schwartz DC. Presentation of large DNA molecules for analysis as nanoconfined dumbbells. Macromolecules. 2013;46:8356–8368. doi: 10.1021/ma400926h. [DOI] [PMC free article] [PubMed] [Google Scholar]
- Landry JJ, Pyl PT, Rausch T, Zichner T, Tekkedil MM, Stutz AM, Jauch A, Aiyar RS, Pau G, Delhomme N, et al. The genomic and transcriptomic landscape of a HeLa cell line. G3 (Bethesda) 2013;3:1213–1224. doi: 10.1534/g3.113.005777. [DOI] [PMC free article] [PubMed] [Google Scholar]
- Li G, Ruan X, Auerbach RK, Sandhu KS, Zheng M, Wang P, Poh HM, Goh Y, Lim J, Zhang J, et al. Extensive promoter-centered chromatin interactions provide a topological basis for transcription regulation. Cell. 2012;148:84–98. doi: 10.1016/j.cell.2011.12.014. [DOI] [PMC free article] [PubMed] [Google Scholar]
- Li Y, Schwab C, Ryan SL, Papaemmanuil E, Robinson HM, Jacobs P, Moorman AV, Dyer S, Borrow J, Griffiths M, et al. Constitutional and somatic rearrangement of chromosome 21 in acute lymphoblastic leukaemia. Nature. 2014;508:98–102. doi: 10.1038/nature13115. [DOI] [PMC free article] [PubMed] [Google Scholar]
- Macville M, Schrock E, Padilla-Nash H, Keck C, Ghadimi BM, Zimonjic D, Popescu N, Ried T. Comprehensive and definitive molecular cytogenetic characterization of HeLa cells by spectral karyotyping. Cancer research. 1999;59:141–150. [PubMed] [Google Scholar]
- Mayrhofer M, DiLorenzo S, Isaksson A. Patchwork: allele-specific copy number analysis of whole-genome sequenced tumor tissue. Genome Biol. 2013;14:R24. doi: 10.1186/gb-2013-14-3-r24. [DOI] [PMC free article] [PubMed] [Google Scholar]
- McPherson A, Roth A, Chauve C, Sahinalp SC. Joint inference of genome structure and content in heterogeneous tumor samples. Paper presented at: Research in Computational Molecular Biology; Springer; 2015. [Google Scholar]
- Medvedev P, Fiume M, Dzamba M, Smith T, Brudno M. Detecting copy number variation with mated short reads. Genome Res. 2010;20:1613–1622. doi: 10.1101/gr.106344.110. [DOI] [PMC free article] [PubMed] [Google Scholar]
- Micci F, Weimer J, Haugom L, Skotheim RI, Grunewald R, Abeler VM, Silins I, Lothe RA, Trope CG, Arnold N, et al. Reverse painting of microdissected chromosome 19 markers in ovarian carcinoma identifies a complex rearrangement map. Genes Chromosomes Cancer. 2009;48:184–193. doi: 10.1002/gcc.20628. [DOI] [PubMed] [Google Scholar]
- Miller CA, White BS, Dees ND, Griffith M, Welch JS, Griffith OL, Vij R, Tomasson MH, Graubert TA, Walter MJ, et al. SciClone: inferring clonal architecture and tracking the spatial and temporal patterns of tumor evolution. PLoS computational biology. 2014;10:e1003665. doi: 10.1371/journal.pcbi.1003665. [DOI] [PMC free article] [PubMed] [Google Scholar]
- Newburger DE, Kashef-Haghighi D, Weng Z, Salari R, Sweeney RT, Brunner AL, Zhu SX, Guo X, Varma S, Troxell ML, et al. Genome evolution during progression to breast cancer. Genome Res. 2013;23:1097–1108. doi: 10.1101/gr.151670.112. [DOI] [PMC free article] [PubMed] [Google Scholar]
- Oesper L, Mahmoody A, Raphael BJ. THetA: inferring intra-tumor heterogeneity from high-throughput DNA sequencing data. Genome Biol. 2013;14:R80. doi: 10.1186/gb-2013-14-7-r80. [DOI] [PMC free article] [PubMed] [Google Scholar]
- Oesper L, Ritz A, Aerni SJ, Drebin R, Raphael BJ. Reconstructing cancer genomes from paired-end sequencing data. BMC Bioinformatics. 2012;13(Suppl 6):S10. doi: 10.1186/1471-2105-13-S6-S10. [DOI] [PMC free article] [PubMed] [Google Scholar]
- Oesper L, Satas G, Raphael BJ. Quantifying tumor heterogeneity in whole-genome and whole-exome sequencing data. Bioinformatics. 2014;30:3532–3540. doi: 10.1093/bioinformatics/btu651. [DOI] [PMC free article] [PubMed] [Google Scholar]
- Otterson GA, Xiao GH, Geradts J, Jin F, Chen WD, Niklinska W, Kaye FJ, Yeung RS. Protein expression and functional analysis of the FHIT gene in human tumor cells. J Natl Cancer Inst. 1998;90:426–432. doi: 10.1093/jnci/90.6.426. [DOI] [PubMed] [Google Scholar]
- Patch AM, Christie EL, Etemadmoghadam D, Garsed DW, George J, Fereday S, Nones K, Cowin P, Alsop K, Bailey PJ, et al. Whole-genome characterization of chemoresistant ovarian cancer. Nature. 2015;521:489–494. doi: 10.1038/nature14410. [DOI] [PubMed] [Google Scholar]
- Pearl J. Probabilistic reasoning in intelligent systems: networks of plausible inference. Morgan Kaufmann; 1988. [Google Scholar]
- Pejovic T, Yates JE, Liu HY, Hays LE, Akkari Y, Torimaru Y, Keeble W, Rathbun RK, Rodgers WH, Bale AE, et al. Cytogenetic instability in ovarian epithelial cells from women at risk of ovarian cancer. Cancer research. 2006;66:9017–9025. doi: 10.1158/0008-5472.CAN-06-0222. [DOI] [PubMed] [Google Scholar]
- Pendleton M, Sebra R, Pang AW, Ummat A, Franzen O, Rausch T, Stutz AM, Stedman W, Anantharaman T, Hastie A, et al. Assembly and diploid architecture of an individual human genome via single-molecule technologies. Nat Methods. 2015;12:780–786. doi: 10.1038/nmeth.3454. [DOI] [PMC free article] [PubMed] [Google Scholar]
- Popic V, Salari R, Hajirasouliha I, Kashef-Haghighi D, West RB, Batzoglou S. Fast and scalable inference of multi-sample cancer lineages. Genome Biol. 2015;16:91. doi: 10.1186/s13059-015-0647-8. [DOI] [PMC free article] [PubMed] [Google Scholar]
- Prandi D, Baca SC, Romanel A, Barbieri CE, Mosquera JM, Fontugne J, Beltran H, Sboner A, Garraway LA, Rubin MA, et al. Unraveling the clonal hierarchy of somatic genomic aberrations. Genome Biol. 2014;15:439. doi: 10.1186/s13059-014-0439-6. [DOI] [PMC free article] [PubMed] [Google Scholar]
- Rausch T, Zichner T, Schlattl A, Stutz AM, Benes V, Korbel JO. DELLY: structural variant discovery by integrated paired-end and split-read analysis. Bioinformatics. 2012;28:i333–i339. doi: 10.1093/bioinformatics/bts378. [DOI] [PMC free article] [PubMed] [Google Scholar]
- Ray M, Goldstein S, Zhou S, Potamousis K, Sarkar D, Newton MA, Esterberg E, Kendziorski C, Bogler O, Schwartz DC. Discovery of structural alterations in solid tumor oligodendroglioma by single molecule analysis. BMC Genomics. 2013;14:505. doi: 10.1186/1471-2164-14-505. [DOI] [PMC free article] [PubMed] [Google Scholar]
- Rozowsky J, Abyzov A, Wang J, Alves P, Raha D, Harmanci A, Leng J, Bjornson R, Kong Y, Kitabayashi N, et al. AlleleSeq: analysis of allele-specific expression and binding in a network framework. Mol Syst Biol. 2011;7:522. doi: 10.1038/msb.2011.54. [DOI] [PMC free article] [PubMed] [Google Scholar]
- Schwartz DC, Li X, Hernandez LI, Ramnarain SP, Huff EJ, Wang YK. Ordered restriction maps of Saccharomyces cerevisiae chromosomes constructed by optical mapping. Science. 1993;262:110–114. doi: 10.1126/science.8211116. [DOI] [PubMed] [Google Scholar]
- Shimony SE. Finding MAPs for belief networks is NP-hard. Artificial Intelligence. 1994;68:399–410. [Google Scholar]
- Sindi SS, Onal S, Peng LC, Wu HT, Raphael BJ. An integrative probabilistic model for identification of structural variation in sequencing data. Genome Biol. 2012;13:R22. doi: 10.1186/gb-2012-13-3-r22. [DOI] [PMC free article] [PubMed] [Google Scholar]
- Stephens PJ, Greenman CD, Fu B, Yang F, Bignell GR, Mudie LJ, Pleasance ED, Lau KW, Beare D, Stebbings LA, et al. Massive genomic rearrangement acquired in a single catastrophic event during cancer development. Cell. 2011;144:27–40. doi: 10.1016/j.cell.2010.11.055. [DOI] [PMC free article] [PubMed] [Google Scholar]
- Teague B, Waterman MS, Goldstein S, Potamousis K, Zhou S, Reslewic S, Sarkar D, Valouev A, Churas C, Kidd JM, et al. High-resolution human genome structure by single-molecule analysis. Proc Natl Acad Sci U S A. 2010;107:10848–10853. doi: 10.1073/pnas.0914638107. [DOI] [PMC free article] [PubMed] [Google Scholar]
- Valouev A, Schwartz DC, Zhou S, Waterman MS. An algorithm for assembly of ordered restriction maps from single DNA molecules. Proc Natl Acad Sci U S A. 2006a;103:15770–15775. doi: 10.1073/pnas.0604040103. [DOI] [PMC free article] [PubMed] [Google Scholar]
- Valouev A, Zhang Y, Schwartz DC, Waterman MS. Refinement of optical map assemblies. Bioinformatics. 2006b;22:1217–1224. doi: 10.1093/bioinformatics/btl063. [DOI] [PubMed] [Google Scholar]
- Van Loo P, Nordgard SH, Lingjaerde OC, Russnes HG, Rye IH, Sun W, Weigman VJ, Marynen P, Zetterberg A, Naume B, et al. Allele-specific copy number analysis of tumors. Proc Natl Acad Sci U S A. 2010;107:16910–16915. doi: 10.1073/pnas.1009843107. [DOI] [PMC free article] [PubMed] [Google Scholar]
- Waddell N, Pajic M, Patch AM, Chang DK, Kassahn KS, Bailey P, Johns AL, Miller D, Nones K, Quek K, et al. Whole genomes redefine the mutational landscape of pancreatic cancer. Nature. 2015;518:495–501. doi: 10.1038/nature14169. [DOI] [PMC free article] [PubMed] [Google Scholar]
- Wang J, Mullighan CG, Easton J, Roberts S, Heatley SL, Ma J, Rusch MC, Chen K, Harris CC, Ding L, et al. CREST maps somatic structural variation in cancer genomes with base-pair resolution. Nat Methods. 2011;8:652–654. doi: 10.1038/nmeth.1628. [DOI] [PMC free article] [PubMed] [Google Scholar]
- Wang L, Wenners A, Hilpert F, Fredrik R, Micci F, Onkes W, Caliebe A, Maass N, Weimer J, Arnold N. Frequent translocations of 11q13.2 and 19p13.2 in ovarian cancer. Genes Chromosomes Cancer. 2014;53:447–453. doi: 10.1002/gcc.22152. [DOI] [PubMed] [Google Scholar]
- Wang W, Wang W, Sun W, Crowley JJ, Szatkiewicz JP. Allele-specific copy-number discovery from whole-genome and whole-exome sequencing. Nucleic acids research. 2015;43:e90. doi: 10.1093/nar/gkv319. [DOI] [PMC free article] [PubMed] [Google Scholar]
- Weiss Y, Freeman WT. On the optimality of solutions of the max-product belief-propagation algorithm in arbitrary graphs. Information Theory, IEEE Transactions on. 2001;47:736–744. [Google Scholar]
- Wistuba II, Montellano FD, Milchgrub S, Virmani AK, Behrens C, Chen H, Ahmadian M, Nowak JA, Muller C, Minna JD, et al. Deletions of chromosome 3p are frequent and early events in the pathogenesis of uterine cervical carcinoma. Cancer research. 1997;57:3154–3158. [PubMed] [Google Scholar]
- Yang L, Luquette LJ, Gehlenborg N, Xi R, Haseley PS, Hsieh CH, Zhang C, Ren X, Protopopov A, Chin L, et al. Diverse mechanisms of somatic structural variations in human cancer genomes. Cell. 2013;153:919–929. doi: 10.1016/j.cell.2013.04.010. [DOI] [PMC free article] [PubMed] [Google Scholar]
- Zack TI, Schumacher SE, Carter SL, Cherniack AD, Saksena G, Tabak B, Lawrence MS, Zhsng CZ, Wala J, Mermel CH, et al. Pan-cancer patterns of somatic copy number alteration. Nature genetics. 2013;45:1134–1140. doi: 10.1038/ng.2760. [DOI] [PMC free article] [PubMed] [Google Scholar]
- Zakov S, Kinsella M, Bafna V. An algorithmic approach for breakage-fusion-bridge detection in tumor genomes. Proc Natl Acad Sci U S A. 2013;110:5546–5551. doi: 10.1073/pnas.1220977110. [DOI] [PMC free article] [PubMed] [Google Scholar]
- Zheng GX, Lau BT, Schnall-Levin M, Jarosz M, Bell JM, Hindson CM, Kyriazopoulou-Panagiotopoulou S, Masquelier DA, Merrill L, Terry JM, et al. Haplotyping germline and cancer genomes with high-throughput linked-read sequencing. Nature biotechnology. 2016;34:303–311. doi: 10.1038/nbt.3432. [DOI] [PMC free article] [PubMed] [Google Scholar]
Associated Data
This section collects any data citations, data availability statements, or supplementary materials included in this article.