

Abstract
Tissue and organ development is a time of exquisite sensitivity to environmental exposures, which can reprogram developing tissues to increase susceptibility to adult diseases, including cancer. In the developing prostate, even brief exposure to endocrine-disrupting chemicals (EDCs) can increase risk for developing cancer in adulthood, with disruption of the epigenome thought to play a key role in this developmental reprogramming. We find that EDC-induced nongenomic phosphoinositide 3-kinase; (PI3K) signaling engages the histone methyltransferase mixed-lineage leukemia 1 (MLL1), responsible for the histone H3 lysine 4 trimethylation (H3K4me3) active epigenetic mark, to increase cleavage and formation of active MLL1 dimers. In the developing prostate, EDC-induced MLL1 activation increased H3K4me3 at genes associated with prostate cancer, with increased H3K4me3 and elevated basal and hormone-induced expression of reprogrammed genes persisting into adulthood. These data identify a mechanism for MLL1 activation that is vulnerable to disruption by environmental exposures, and link MLL1 activation by EDCs to developmental reprogramming of genes involved in prostate cancer.
Accumulating evidence demonstrates that early-life environmental exposures can have adverse effects on human health. Numerous studies of exposure to environmental endocrine-disrupting chemicals (EDCs) indicate that exposure to EDCs during critical windows of development can reprogram the epigenome, and increase susceptibility to chronic diseases in adulthood including endocrine disorders, diabetes, and cancer, a process known as developmental reprogramming (1–4). A well-known example of EDC-induced developmental reprogramming in humans is in utero exposure to the xenoestrogen diethylstilbestrol (DES); use of DES by pregnant women results in uterine malformation, infertility, and vaginal cancers in female offspring (5, 6). Correspondingly, a prime example of EDC-induced developmental reprogramming in the male reproductive system is early-life exposure to bisphenol A (BPA), which results in male genital abnormalities, abnormal prostate size, and elevated susceptibility to prostate cancer (7–9).
It is becoming clear that the underlying mechanism linking early-life EDC exposure to increased disease risk in adulthood is the alteration of the epigenome during development. The epigenome of a developing organ is quite plastic, and can respond to many external and internal stimuli. In the case of environmental chemicals such as EDCs, these responses may disrupt the epigenetic machinery responsible for “programming” the epigenome, resulting in changes in the epigenome that can persist across the life course (10, 11). Such epigenomic alterations include DNA methylation, histone methylation, and incorporation of the histone H2 variant H2AZ (12). For instance, in utero exposure to BPA causes yellow coat color, and hypo-methylation at the agouti locus, which can be abolished by maternal folate supplementation (13). In contrast, genistein (the major phytoestrogen in soy) causes persistent global hypermethylation of DNA and prevents the occurrence of obesity of the offspring in adulthood (14); similarly, postnatal exposure to DES can reduce the levels of histone H3 lysine 27 trimethylation (H3K27me3) in the developing uterus, which correlates with increased expression of estrogen-responsive genes in the adult uterus (15).
Importantly, the molecular mechanisms by which early-life exposure to EDCs induce alterations in DNA or histone methylation to reprogram the epigenome are only beginning to be understood. Studies in our laboratory provided the first evidence that neonatal exposure to EDCs, including DES and genistein, could regulate the methyltransferase activity of enhancer of Zeste homolog 2 downstream of nongenomic estrogen receptor (ER) signaling to phosphoinositide 3-kinase (PI3K)/protein kinase B (PKB/AKT) (15, 16). Specifically, EDCs such as DES and genistein that bind the ER rapidly activate PI3K/AKT signaling in a tissue-specific manner, resulting in phosphorylation of Enhancer of zeste homolog 2 at serine 21, down-regulation of its enzymatic activity, and reduced H3K27me3 of chromatin in the developing reproductive tract. Another EDC, BPA, also activates nongenomic (PI3K) ER signaling in the developing rodent prostate (15, 16) and human prostaspheres (17). Neonatal BPA exposure could cause life-long changes in gene expression through altered DNA methylation (18), and a recent publication reported that BPA treatment could alter H3K27me3, histone H3 lysine 9 trimethylation, and histone H3 lysine 4 trimethylation (H3K4me3) epigenetic histone marks in prostaspheres (19).
The ability of EDCs to activate nongenomic signaling, and the potential for kinases in these pathways to modulate the activity of epigenetic programmers (15, 20, 21), led us to ask whether the risk for development of prostate lesions modulated by early-life EDC exposure, could be due to disruption of methyltransferase activity and reprogramming of the epigenome in the developing prostate. In a well-characterized rat model of hormone-induced prostate cancer, neonatal BPA exposure increases susceptibility to prostate carcinogenesis (9, 22, 23), and causes developmental reprogramming as evidenced by decreased DNA methylation of the gene encoding secretoglobin family 2A member 1 (23), supporting the use of this model to test this hypothesis. We report here that, in the developing prostate, neonatal BPA exposure activates the histone methyltransferase encoded by the mixed-lineage leukemia 1 (MLL1) gene and that MLL is a target for PI3K/AKT signaling. Activation of MLL1 increases H3K4me3 at genes associated with prostate cancer, including the prostastatins, kallikreins and several genes in the prostate cancer Kyoto Encylopedia of Genes and Genomes (KEGG) pathway. These genes exhibit persistent, elevated H3K4me3, which in the case of prostastatins and kallikreins, is associated with increased basal expression. In reprogrammed KEGG pathway genes, however, elevated H3K4me3 did not change basal gene expression but rather primed these genes for an exaggerated response to hormone-induced gene expression in prostates of rats at increased risk for prostate carcinogenesis.
Materials and Methods
Experimental design
The objective of this study was to determine whether the risk for development of prostate lesions could be modulated by early-life EDC exposure, disruption of methyltransferase activity, and reprogramming of the epigenome. The experiments were conducted in a well-characterized rat model of hormone-induced prostate cancer (9, 22, 23). We, and others (9, 22), have previously reported that neonatal BPA exposure causes epigenomic reprogramming in this model (23).
Reagents and antibodies
17β-estradiol (E2), 17β-estradiol 6-(O-carboxymethyl) oxime: BSA, also called BSA-conjugated estradiol (E2-BSA), insulin, and the PI3K inhibitor LY294002 were purchased from Sigma-Aldrich. Antibodies recognizing phosphorylated AKT (S473), AKT, phosphorylated S6 (S235/236), S6, or histone H3 were purchased from Cell Signaling Technology. Antibody recognizing GRB2 was purchased from Santa Cruz Biotechnology, Inc. Antibodies recognizing C and N terminus of MLL1 were purchased from Millipore. Antibodies recognizing H3K4Me3 and histone H3 lysine 9 acetylation (H3K9ac) were purchased from Active Motif. Antibody recognizing MLL2 was a generous gift from Dr Ali Shilatifard.
Animals and BPA treatments
Sprague Dawley rats aged 6–8 weeks were purchased from Harlan and maintained in accordance with guidelines of the MD Anderson Cancer Center Animal Care and Use Committee and used as breeders to produce rats for this study. In order to ensure that rats were not exposed to exogenous xenoestrogens, they were housed in polycarbonate-free caging and were fed phytoestrogen-reduced diet (Zeigler Bros, Inc) ad libitum. Rats were maintained on a 14-hour light, 10-hour dark cycle. To increase the incidence of prostatic intraepithelial neoplasia (PIN) in 12-month-old rats, animals were exposed to BPA postnatally (d 1–5) and challenged with testosterone (T) plus estradiol (T+E) on postnatal day (d)70 as previously described (23). Briefly, BPA (provided by NIEHS) was dissolved in sesame oil and administered on d1, d3, and d5 to neonates via either a reference sc dose of 10-μg/kg body weight (BPA10) each or an oral dose of 50-μg/kg body weight (BPA50) each. Sesame oil was administered orally for the vehicle treatment group. As described (23), to promote carcinogenesis, the rats were implanted with 1 estradiol (E)-containing capsule (1-cm tube; internal diameter 1.5 mm and external diameter 2 mm) and 2 T-containing capsules (2-cm tubes) (Dow Corning) starting on d70; the capsules were replaced every 2 months. At 12 months of age, each animal was killed, and prostate glands were quickly removed, fixed with 10% neutral buffered formalin, and stored in 70% ethanol for histopathologic diagnosis and immunohistochemical staining. A vehicle treatment group was also implanted with hormone capsules and served as the same-aged control for the BPA-treated animals.
Additionally, we collected prostate samples from d6 and d70 animals; d6 prostates were used to determine the acute response to BPA exposure; whole prostates from d6 vehicle, BPA10 and BPA50 animals were removed for RNA isolation, chromatin preparation, and Western blot analyses. Animals treated with vehicle (sesame oil) serve as the same-aged control for the BPA-treated animals. In order to profile the long-term effect of neonatal BPA exposure on gene expression and the epigenome, whole prostates from vehicle- and BPA-exposed animals were removed at d70 (before the hormone implantation) for RNA-sequencing (RNA-seq) and chromatin immunoprecipitation (ChIP)-sequencing (ChIP-seq). Vehicle-treated animals without hormone implantation serve as the same-aged controls for the BPA-treated animals without hormone implantation. To determine whether gene expression in response to hormone was altered in reprogrammed animals, postnatal vehicle (V)- and BPA-exposed animals were challenged with oil (O) (V-O, BPA-O; im injection of sesame oil) or hormone (H) (V+H, BPA+H; im injection of 5-mg/kg T and 0.25-mg/kg estradiol). Prostate tissue was collected 6 hours after administration of T+E, and the prostate lobes were separated for RNA isolation and chromatin preparation. For d6 animals, 6 neonatal prostates were pooled for each sample, and for d70 animals, the lateral prostate was divided in half for subsequent real-time quantitative PCR (qPCR) analysis. Supplemental Tables 1 and 2 summarize the details of our experimental design including, which prostate lobes and how many animals were used for the studies outlined.
RNA-seq and quantitative real-time RT-PCR (RT-qPCR)
To identify developmentally reprogrammed genes targeted by BPA, whole-genome transcriptome sequencing and data analysis was performed with d70 whole prostates as previously described (23). Briefly, total RNA was isolated and cDNA libraries were constructed using SPRI-works Fragment Library System I (Beckman Coulter). After PCR enrichment and purification, 10pM DNA was loaded into the paired end flow cell on cBOT for cluster generation, followed by loading on the HiSeq 2000 sequencer (Illumina, Inc) to generate single 36-bp sequence reads. Sequences reads were aligned to the rat reference genome (rn4; version 3.4 by BCM HGSC) using TopHat aligner. Aligned read counts were summarized using ShortRead and associated Bioconductor packages. Statistical analysis to identify differentially expressed genes between BPA-treated animals and age-matched (d70) rats that were neonatally exposed to vehicle was performed using the negative-binomial model. False discovery rate-adjusted P values were used to control for multiple testing. Genes with false discovery rate less than 0.1 and P < .01 were considered significantly differentially expressed. For qPCR, total RNA was isolated with the RiboPure RNA Purification kit (Life Technologies) and cDNA synthesis was performed with the SuperScript III First Strand Synthesis System (Life Technologies) according to the manufacturers' protocols. Fast SYBR Green Master Mix (Applied Biosystems) and a Viia7 RT-PCR System (Life Technologies) were used for real-time PCR measurement of mRNA levels. RT-qPCR primers were designed to span an exon-exon boundary, and all primer sequences are listed in Supplemental Table 3. Fold change in gene expression was calculated based on threshold cycle differences via the delta delta cycle threshold method.
ChIP, ChIP-seq, and qPCR
A ChIP kit (EZ-Magna ChIP; Millipore) was used according to the manufacturer's protocol to prepare chromatin from prostate tissue. Briefly, prostate tissue was minced in ice-cold PBS supplemented with protease inhibitors, and the tissue was then cross-linked with 1.5% formaldehyde, incubated with 125mM glycine, and washed with chilled PBS. After washing, the prostate tissue was homogenized, centrifuged, resuspended in cell lysis buffer (5mM piperazine-N,N′bis [pH 8], 85mM KCl, and 0.5% Nonidet P-40), and dounced. The samples were spun and the tissue pellet was resuspended in nuclear lysis buffer (50mM Tris-HCl [pH 8.1], 10mM EDTA, and 1% sodium dodecyl sulfate (SDS)). To prepare chromatin from HEK293 cells or MCF-7 cells, cells were treated with 1% formaldehyde to cross-link proteins to DNA; cells were then incubated with 125mM glycine and washed with chilled PBS. After centrifugation, cells were resuspended in cell lysis buffer (PBS with 0.5mM EDTA and 0.05% Triton X-100) and collected via centrifugation. Each cell pellet was resuspended in nuclear lysis buffer (50mM Tris-HCl [pH 8.1], 10mM EDTA, and 1% SDS). Chromatin preparations from the prostate tissue, and the cell lines were sonicated with a Bioruptor (Diagenode) to obtain fragments comprising 100–500 bp. ChIP was performed according to the instructions for the Magna ChIP kit. DNA isolated via ChIP was then analyzed by qPCR using Fast SYBR Green Master Mix and the primers listed in Supplemental Table 4. Results are shown as the percentage of input DNA (% input) that coprecipitated with anti-H3K9ac, anti-H3K4me3, anti-MLL1 C-terminal or control antibodies.
For ChIP-seq data analysis, sequence reads from the ChIP experiment were demultiplexed and converted to fastq files using Illumina CASAWA software. The resulting FASTQ files were first aligned to the same reference rat genome as used in the RNA-seq data analysis using bwa (24), to create BAM files with alignment information. Model-based analysis of ChIP-seq (25) was then applied to identify the peaks in different histone mark IP samples relative to the corresponding input. Aligned BAM files from the previous step were used in the model-based analysis of ChIP-seq peak calling process with the lower and upper limits for fold enrichment parameters set to 4 and 30, respectively.
Cell culture and treatment
The estrogen-responsive MCF-7 cell line and the insulin-responsive HEK293 cell line exhibit robust activation of nongenomic (PI3K) signaling in response to estrogens or insulin, respectively, and therefore were used as models to examine PI3K/AKT-mediated activation of MLL. MCF-7 cells were maintained with improved MEM (Invitrogen) supplemented with 10% fetal bovine serum (HyClone Laboratories). MCF-7 cells were starved in serum-free, phenol red-free medium for 48 hours before E2 treatment. To ensure that stock solutions of E2-BSA did not contain free estrogen, crystalline E2-BSA was dissolved in PBS and purified as previously described (26). HEK293 cells were maintained with DMEM supplemented with 10% fetal bovine serum. HEK293 cells were starved in serum-free medium for 24 hours before insulin treatment. To inhibit the PI3K pathway, MCF-7 or HEK293 cells were pretreated with LY294002 (20μM) for 1 hour before E2 administration.
Western blot analysis
For protein collection, cells were washed twice with PBS and then lysed with lysis buffer (20mM Tris-HCl [pH 7.5], 1mM EGTA, 1mM Na2EDTA, 150mM NaCl, 1mM β-glycerophosphate, 2.5mM sodium pyrophosphate, 1% Triton, 1mM Na3VO4, 1mM phenylmethylsulfonylfluoride, 1mM NaF, and Complete Protease Inhibitor Cocktail [Roche Applied Science]). Lysates were then centrifuged at 13 000g for 15 minutes at 4°C, and each supernatant was collected. Protein concentration was determined using the Pierce BCA Protein Assay kit (Pierce Biotechnology). Proteins within each lysate were separated by SDS-PAGE (Bio-Rad Laboratories, Inc) and transferred to polyvinylidene difluoride membranes. After incubation with primary antibody, membranes were washed with Tris-buffered saline with Tween 20 and exposed to an appropriate horseradish peroxidase-conjugated secondary antibody (Santa Cruz Biotechnology, Inc); immunoblot signals were detected with Pierce ECL Western blotting substrate (Pierce Biotechnology) or ECL plus (GE Healthcare Bio-Sciences Corp).
Prostate tissues from d6 neonates were washed twice with PBS and lysed in tissue lysis buffer (10mM Tris-HCl [pH 7–7.4], 10mM NaCl, 3mM MgCl2, 1mM phenylmethylsulfonylfluoride, 1mM Na3VO4, 1mM NaF, and Complete Protease Inhibitor Cocktail) with 0.5% Nonidet P-40; each lysate was then incubated for 30 minutes on ice and centrifuged for 15 minutes at 13 000g at 4°C. The supernatant was collected and used for Western blot analysis of cytosolic nongenomic signaling as described above. To obtain lysates enriched for histone protein for Western blot analysis, each centrifugation pellet was resuspended in 0.1N HCl, and was incubated at 4°C.
Short hairpin RNA (shRNA) sequences, lentiviral preparation, and infection of cells
To determine methyltransferase specificity for changes in H3K4me3 in response to BPA, stable knockdown of methyltransferases MLL1, MLL2 and lysine specific methyltransferase 2F (KMT2F/SET1A), and protease Taspase TASP1 expression was performed using shRNA lentiviral (pLKO.1-puro) plasmids (Thermo Scientific). The shRNA target sequences are listed in Supplemental Table 5. 293T cells plated in a 10-cm dish were cotransfected with the pLKO.1-puro plasmids (6 μg) plus lentivirus packaging vector constructs Vsvg (4.5 μg) and PAX2 (3 μg) using Lipofectamine 2000. The medium was changed approximately 6 hours after transfection, and the cells were cultured an additional 48 hours, after which the medium was collected and filtered through a 0.45-μm filter. MCF-7 cells were incubated with the virus-containing medium overnight in 6-well plates, the medium was changed, and cells were incubated for 24 hours. Cells were transferred to 10-cm dishes and transduced cells were selected by incubation in puromycin (4 μg/mL) for 10 days.
Immunohistochemical quantitative analysis
Images of immunohistochemical specimens were acquired with a Vectra system (PerkinElmer, Inc). Each image was classified and scored using the inForm software supplied with the Vectra instrument. The inForm algorithm was trained to distinguish among different cell types and to provide a quantifiable readout of target protein expression.
Statistical analysis
Student's t test or one-way ANOVA (GraphPad Prism; GraphPad Software, Inc) was used to determine whether differences among groups were statistically significant. One-sided t test was used to assess significant increases in gene expression after hormone treatment. P ≤ .05 was considered significant.
Results
Increased H3K4me3 marks developmentally reprogrammed genes in the prostate
To identify gene expression changes caused by epigenetic reprogramming, and avoid pathophysiological changes associated with prostate lesions, or changes caused by BPA-induced ER transactivation, we used 70-day-old (d70) adult rats rather than 12-month (where expression data could be confounded by the presence of PIN lesions (23) or d6 animals (where expression would be confounded by BPA-induced ER transactivation of gene expression) to identify genes sensitive to developmental reprogramming in the prostate. RNA-seq was performed as previously described (23) to profile the prostate transcriptome in d70 adult rats exposed neonatally to BPA or vehicle, before the cancer-promoting hormone treatment (T+E implantation) used to induce prostate lesions in this rat model. Three neonatal dosing regimens were used: vehicle, sc (BPA10, 10 μg/kg per body weight reference dose previously described to increase prostate lesions in this model) (9), and oral (BPA50, 50 μg/kg per body weight dose that mimics the human route of exposure) (22) BPA exposure. Adult prostates of the oral BPA- and vehicle-exposed rats exhibited the most distinct transcriptional profiles (shown in the hierarchical clustering in Figure 1A), consistent with the expected reprogramming of prostate gene expression by this EDC. To identify genes that exhibited the most robust reprogramming for further study, we focused on genes whose expression was changed in adult prostates from both BPA exposure groups, and which differed significantly from the vehicle controls. As shown in Table 1, 27 up-regulated and 5 down-regulated genes were differentially expressed (reprogrammed) relative to controls in both oral and sc BPA-exposed rats.
Figure 1.

Reprogramming of rat chromosome 1 genes by BPA. A, Heat map of RNA-seq data from d70 vehicle- and BPA50-treated prostates (n = 3 for each group). B, top, Graphical representation of genes on rat chromosome 1 located between 212 014 991 and 212 303 081. Bottom, Graphical representation of genes on rat chromosome 1 located between 94 378 646 and 94 585 357 (image from rat reference genome rn4). C, The expression of 7 chromosome 1 genes was validated via RT-qPCR with BPA50- and vehicle-treated prostates; Rpl19 was used as an internal control to determine relative gene expression. Mean values ± SEM are shown; *, P < .05; **, P < .01; ***, P < .001 relative to vehicle, n = 4 separate prostates from different animals. We previously reported that Psbpc3(1) (secretoglobin family 2A member 1) was reprogrammed by BPA (23). D, ChIP-qPCR was performed with anti-H3K9ac antibody using d70 prostates from vehicle- and BPA50-treated rats. Mean values ± SEM are shown; *, P < .05; **, P < .01 relative to vehicle, n = 3 separate prostates from different animals. E, Representative ChIP-seq genome-browser views of H3K4me3 occupancy at the Klk1c8 (top) and Psbpc1 (bottom) genes. For each gene, the lower browser image displays an expanded view of a selected region with examples of localized distributions; each box indicates the region around the TSS. F, ChIP-qPCR was performed with anti-H3K4me3 antibody using d70 prostates from vehicle- and BPA50-treated rats. Mean values ± SEM are shown; *, P < .05 relative to vehicle, n = 5 separate prostates from different animals. Student's t test was used to determine statistical significance for data in panel C, D, and F.
Table 1.
Identification of BPA Reprogrammed Genes Determined by RNA-seq
| Gene Symbol | Gene Name | BPA50 vs Veh |
BPA10 vs Veh |
||
|---|---|---|---|---|---|
| Fold Change | P Value | Fold Change | P Value | ||
| Anpep | Alanyl (membrane) aminopeptidase | 1.91 | .0008338 | 1.34 | .0002100 |
| Cd55 | Cd55 molecule | 9.32 | <.0000001 | 3.66 | .0029961 |
| Fam117a | Family with sequence similarity 117, member A | 1.42 | .0066932 | 1.40 | .0082672 |
| Ifih1 | Interferon induced with helicase C domain 1 | 2.33 | <.0000001 | 1.56 | .0016015 |
| Klk1c2 | Kallikrein 1-related peptidase C2 | 164.17 | <.0000001 | 68.92 | .0016571 |
| Klk1c8 | Kallikrein 1-related peptidase C8 | 504.89 | .0000132 | 325.36 | .0062957 |
| Klk1c9 | Kallikrein 1-related peptidase C9 | 1137.66 | <.0000001 | 443.00 | .0000139 |
| LOC296235 | Similar to cystatin S precursor (LM protein) | 383.35 | <.0000001 | 127.24 | .0000934 |
| Lrrc36 | Leucine-rich repeat containing 36 | 4.02 | <.0000001 | 1.98 | .0007962 |
| Nqo2 | NAD(P)H dehydrogenase, quinone 2 | 1.76 | .0000011 | 1.82 | .0000001 |
| P22k15 | Cystatin related protein 2 | 959.35 | <.0000001 | 262.08 | .0000230 |
| Psbpc1 | Prostatic steroid binding protein C1 | 2169.52 | <.0000001 | 823.36 | .0000237 |
| Psbpc2 | Prostatic steroid-binding protein C2 | 1436.84 | <.0000001 | 479.07 | .0000161 |
| RGD1562234 | Similar to S100 calcium-binding protein, ventral prostate | 503.34 | <.0000001 | 155.10 | .0000285 |
| RGD1562673 | Similar to Prostatic spermine-binding protein precursor (SBP) | 67.67 | <.0000001 | 26.70 | .0024725 |
| Rprml | Reprimo like | 1.81 | <.0000001 | 1.37 | .0021162 |
| RT1-Db1 | RT1 class II, locus Db1 | 1.59 | .0004410 | 1.43 | .0088172 |
| S100vp | S100 calcium-binding protein, ventral prostate | 286.17 | <.0000001 | 94.59 | .0003229 |
| Sbp | Spermine binding protein | 355.12 | <.0000001 | 131.07 | .0001653 |
| Psbpc3 (1) | Secretoglobin, family 2A, member 1 | 107.34 | <.0000001 | 36.42 | .0005025 |
| Psbpc3 (2) | Secretoglobin, family 2A, member 2 | 106.36 | <.0000001 | 36.64 | .0005139 |
| Spats2l | Spermatogenesis associated, serine-rich 2-like | 2.04 | .0000025 | 1.58 | .0041455 |
| Sytl5 | Synaptotagmin-like 5 | 5.27 | <.0000001 | 2.68 | .0078648 |
| Tmem45b | Transmembrane protein 45b | 2.32 | .0000116 | 1.87 | .0074243 |
| Ugt8 | UDP glycosyltransferase 8 | 2.20 | .0000001 | 1.49 | .0011707 |
| Wfdc3 | WAP 4-disulfide core domain 3 | 2.32 | .0015540 | 1.82 | .0048929 |
| Andpro | Androgen regulated protein | 1266.64 | <.0000001 | 420.60 | .0000105 |
| Ggct | γ-glutamyl cyclotransferase | 0.70 | .0000438 | 0.80 | .0022502 |
| Hspa5 | Heat shock protein 5 | 0.62 | .0004014 | 0.72 | .0023578 |
| Manf | Mesencephalic astrocyte-derived neurotrophic factor | 0.75 | .0022683 | 0.78 | .0063717 |
| Rock2 | ρ-associated coiled-coil containing protein kinase 2 | 0.82 | .0055097 | 0.82 | .0051952 |
| Serpinb1a | Serine (or cysteine) proteinase inhibitor, clade B, member 1a | 0.34 | .0055403 | 0.32 | .0022360 |
n = 4 animals/treatment group.
Prominent among these 32 genes were androgen-regulated genes, including kallikrein-related serine proteases (Klk1c2, Klk1c8, Klk1c9), prostastatin proteins involved in binding steroid hormones (Psbpc1, Psbpc2, Psbpc3(1), Psbpc3(2)), peptidase inhibitors (Andpro, P22k15, LOC296235), binding proteins for calcium (S100vp, RGD1562234), and spermine (Sbp, RGD1562673) (27–33). These genes exhibited statistically significant fold changes in expression that ranged from 67.7- to 2169.5-fold (relative to vehicle) in the orally exposed BPA50 animals, with similar increases in expression evident in rats exposed to BPA10 sc (Table 1).
Interestingly, 7 of the up-regulated genes resided in 2 gene clusters on rat chromosome 1 (Figure 1B, with coordinates based on rat reference genome rn4). The first cluster (1:212 014 991 to 212 303 081) spanned approximately 288 kb and contained Psbpc1, Psbpc2, Psbpc3(1), and Psbpc3(2) (Figure 1B); these genes encode secretoglobin polypeptide family members, which bind steroid hormones (34). The second cluster was approximately 206 kb in length (1:94 378 646 through 94 585 357) and contained 3 genes encoding kallikrein family members. Both the secretoglobin proteins and kallikrein family proteases have been previously implicated in prostate cancer (35, 36).
Elevated expression of the genes in both clusters was examined via RT-qPCR, which confirmed BPA-induced reprogramming had significantly increased the expression of these genes by 100- to 10 000-fold in the adult prostates of rats neonatally exposed to this EDC (Figure 1C). Additional collaborating evidence that these genes were overexpressed was obtained by ChIP analyses for H3K9ac enrichment, a mark of transcriptionally active genes (37, 38). Consistent with elevated gene expression, H3K9ac enrichment at these genes was significantly higher in BPA-exposed compared with control prostates (10%–30% vs 5%, respectively) (Figure 1D). Taken together, the RNA-seq, RT-qPCR, and ChIP-qPCR data confirmed these 2 gene clusters on chromosome 1 as newly identified targets of BPA-induced developmental reprogramming, reinforcing the ability of BPA to induce developmental reprogramming in the developing prostate and altered gene expression that persists until adulthood.
To begin to explore the underlying mechanism for induction of developmental reprogramming by BPA, ChIP-seq of H3K4me3 (an activating histone mark) was performed on d70 prostates. This analysis revealed that increased H3K4me3 was associated with BPA-induced reprogramming of differentially expressed genes identified by RNA-seq above, as illustrated for klk1c8 and Psbpc1 (Figure 1E). BPA-induced H3K4me3 enrichment in d70 prostates was validated via ChIP-qPCR analysis using an H3K4me3-specific antibody; H3K4me3 enrichment was significantly increased in 6 of the 7 reprogrammed secretoglobin and kallikrein genes on chromosome 1 in adult prostates of neonatally BPA-exposed rats (Figure 1F). These results indicated that increased H3K4me3 was associated with BPA-induced developmental reprogramming and increased gene expression in adulthood. H3K4me3 enrichment demarks transcriptionally active genes, and genes that may become active (39, 40). However, the association we observed between H3K4me3 and increased gene expression could not distinguish whether increased H3K4me3 was a cause, or consequence, of the increased expression of reprogrammed genes. Therefore, we designed a series of experiments to test the hypothesis that increased H3K4me3 induced by BPA was a potential mechanism underlying altered expression of cancer-related genes involved in prostate carcinogenesis.
Increased H3K4me3 enhances hormone-responsiveness of developmentally reprogrammed genes
Focusing on genes involved in the KEGG prostate cancer pathway (http://www.kegg.jp), ChIP-seq data from vehicle vs BPA-exposed rats revealed significant and dramatic H3K4me3 enrichment in BPA-exposed prostates at the transcription start site (TSS) for several genes in this pathway (Figure 2A). H3K4me3 levels were increased at genes involved in signal transduction (Grb2, Igr1r, Nfkbia, Map2k2, Mapk3, Pdpk1, and Ikbkb), oncogenesis (Erbb2, Pdgfb, and Hras), cell cycle (Ccne1), and protein folding (Hsp90ab1). To validate these ChIP-seq data, ChIP-qPCR was performed with an anti-H3K4me3 antibody, which confirmed the anticipated increase in H3K4me3 at the TSS of 11/12 of these genes, 9 of which reached statistical significance (Table 2); no differences were observed between BPA vs vehicle-exposed prostates in H3K4me3 localized at regions upstream of the TSS of these genes, which served as controls to demonstrate the specificity of H3K4me3 enrichment (Table 2).
Figure 2.
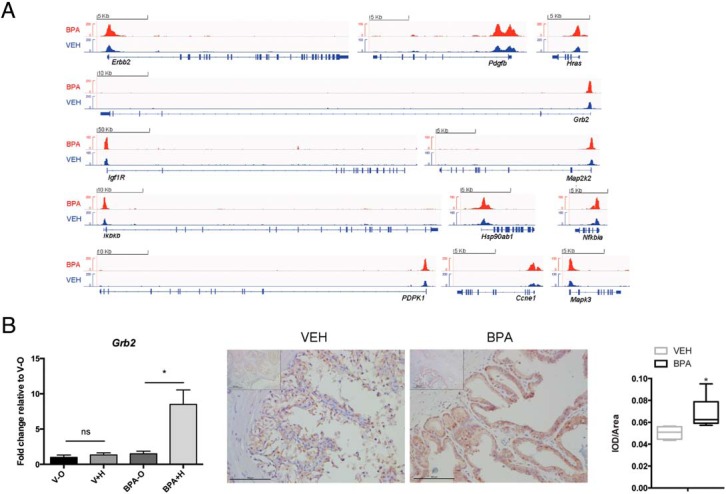
Reprogramming of KEGG prostate cancer pathway genes by BPA. A, Representative ChIP-seq genome-browser views of H3K4me3 occupancy at 12 KEGG pathway genes. Results were obtained from 2 biological replicates. B, left, Gene expression of the KEGG pathway gene Grb2 in d70 lateral prostates was examined by RT-qPCR; Rpl19 was used as an internal control to determine relative gene expression. Treatment groups were as follows: postnatal V-O, postnatal V+H, postnatal BPA-O, and postnatal BPA+H. Dot plots indicate fold changes for each sample. Horizontal lines indicate median values, n = 3. Significance was determined using one-way ANOVA; *, P < .05. Right, Representative image of GRB2 expression (brown color) in sections from the lateral lobe of prostates from vehicle- and BPA10-treated 12-month-old animals (all the rats are implanted with T and E-containing capsules from d70). Main images: magnification, ×400; insets, magnification, ×100. Far right, Quantification result of anti-GRB2 signal. *, P < .05, n = 5, Student's t test was used to determine statistical significance.
Table 2.
Validation of BPA Reprogrammed Genes Determined by ChIP-qPCR
| Gene Symbol | Gene Name | Upstream |
TSS |
||||
|---|---|---|---|---|---|---|---|
| Veh (Mean ± SEM) | BPA10 (Mean ± SEM) | P Value | Veh (Mean ± SEM) | BPA10 (Mean ± SEM) | P Value | ||
| Ccne1 | Cyclin E1 | 0.40 ± 0.36 | 0.53 ± 0.54 | .725 | 0.93 ± 0.53 | 3.01 ± 1.35 | <.05 |
| Erbb2 | v-erb-b2 erythroblastic leukemia viral oncogene homolog 2, neuro/glioblastoma derived oncogene homolog (avian) | 0.55 ± 0.31 | 0.88 ± 0.39 | .155 | 2.63 ± 1.01 | 5.26 ± 0.37 | <.001 |
| Grb2 | Growth factor receptor bound protein 2 | 0.30 ± 0.18 | 0.49 ± 0.12 | .201 | 0.17 ± 0.11 | 0.60 ± 0.37 | <.05 |
| Hras | Harvey rat sarcoma virus oncogene | 0.78 ± 0.61 | 0.91 ± 0.50 | .705 | 1.89 ± 0.73 | 4.29 ± 1.38 | <.01 |
| Hsp90ab1 | Heat shock protein 90-α (cytosolic), class B member 1 | 0.97 ± 0.36 | 0.97 ± 0.24 | .995 | 0.91 ± 0.21 | 1.92 ± 2.43 | .377 |
| Igf1r | IGF-1 receptor | 0.60 ± 0.40 | 0.74 ± 0.42 | .591 | 2.30 ± 0.79 | 4.31 ± 2.78 | .155 |
| Ikbkb | Inhibitor of κ-light polypeptide gene enhancer in B-cells, kinase-β | 0.62 ± 0.28 | 0.70 ± 0.50 | .808 | 1.63 ± 0.85 | 2.99 ± 0.22 | <.05 |
| Map2k2 | MAPK kinase 2 | 0.86 ± 0.11 | 0.92 ± 0.07 | .360 | 1.10 ± 0.54 | 2.18 ± 0.65 | <.05 |
| Mapk3 | MAPK 3 | 0.33 ± 0.43 | 0.44 ± 0.28 | .642 | 1.30 ± 0.97 | 1.05 ± 1.51 | .769 |
| Nfkbia | Nuclear factor of κ-light polypeptide gene enhancer in B-cells inhibitor-α | 0.51 ± 0.25 | 0.82 ± 0.40 | .213 | 1.43 ± 0.86 | 2.75 ± 0.43 | <.05 |
| Pdgfb | Platelet-derived growth factor-β polypeptide | 0.53 ± 0.11 | 0.97 ± 0.86 | .433 | 1.01 ± 0.28 | 1.84 ± 0.33 | <.05 |
| Pdpk1 | 3-Phosphoinositide dependent protein kinase-1 | 0.73 ± 0.34 | 0.73 ± 0.56 | .997 | 0.21 ± 0.18 | 1.27 ± 0.69 | <.05 |
H3K4me3 ChIP for selected genes shown as % input; n = 3 animals/treatment group.
The dorsal-lateral lobe of the rat prostate is known to be the primary site for increased susceptibility to prostate carcinogenesis in the Sprague Dawley model (9, 41). In humans, prostate cancer is largely an age- and hormone-dependent disease. Similar to humans, the development of prostate lesions in this model is hormone-dependent (9, 22, 23), because Sprague Dawley rats without hormone stimulation will not develop prostate cancer, possibly because of their short life span (2.5 y). In the animals used for this molecular analysis, BPA-exposed rats promoted with T+E exhibited a significant increase in PIN lesions relative to T+E-treated vehicle controls (23). Interestingly, when these 9 genes were examined by RT-qPCR in the lateral prostate, no differences in basal expression (ie, before promotional hormone treatment [T+E implantation] used to induce prostate carcinogenesis) (9) were observed; BPA-reprogrammed genes with increased H3K4me3 were expressed at the same level as vehicle controls. As shown in Table 3, in d70 animals, basal expression of these 9 genes in the adult prostates of rats exposed neonatally to BPA (BPA-O) vs vehicle (V-O) were not significantly different. However, 6 hours after hormone (T+E) treatment, the expression of only 1/9 of the genes (Erbb2) with elevated H3K4me3 became significantly elevated in d70 rats that had been exposed neonatally to vehicle (V+H) compared with vehicle-treated rats that did not receive hormone (V-O). In contrast, 7/9 of the genes (Ccne1, Erbb2, Grb2, Ikbkb, Map2k2, Nfkbia, and Pdgfb) with elevated H3K4me3 exhibited significantly increased expression in response to hormone in d70 rats that had been exposed neonatally to BPA (BPA+H) relative to BPA-treated rats that did not receive hormone treatment (B-O). Supplemental Table 6 provides the raw qPCR data for individual animals. These data demonstrated that increased H3K4me3 observed at the TSS of these developmentally reprogrammed genes was not a consequence of increased expression but rather had “primed” these genes to have an exaggerated response to hormone.
Table 3.
Gene Expression of Prostate Cancer KEGG Pathway Genes as a Function of BPA and Hormone Treatments
| Gene Symbol | V-O (Mean ± SEM) | V+H (Mean ± SEM) | P Value | BPA-O (Mean ± SEM) | BPA+H (Mean ± SEM) | P Value |
|---|---|---|---|---|---|---|
| Ccne1 | 1.00 ± 0.40 | 0.94 ± 0.28 | .4541 | 0.50 ± 0.21 | 1.72 ± 0.34 | P < .05 |
| Erbb2 | 1.00 ± 0.14 | 3.79 ± 0.89 | P < .05 | 2.25 ± 0.65 | 5.05 ± 0.46 | P < .05 |
| Grb2 | 1.00 ± 0.32 | 1.33 ± 0.30 | .2463 | 1.49 ± 0.37 | 8.49 ± 2.05 | P < .05 |
| Hras | 1.00 ± 0.63 | 0.39 ± 0.16 | .1999 | 1.07 ± 0.09 | 0.41 ± 0.10 | .99 |
| Ikbkb | 1.00 ± 0.37 | 2.73 ± 1.11 | .1067 | 1.43 ± 0.28 | 3.93 ± 0.34 | P < .01 |
| Map2k2 | 1.00 ± 0.27 | 1.04 ± 0.04 | .4520 | 0.78 ± 0.05 | 2.18 ± 0.34 | P < .01 |
| Nfkbia | 1.00 ± 0.38 | 1.02 ± 0.13 | .4859 | 1.03 ± 0.19 | 1.64 ± 0.21 | P < .05 |
| Pdgfb | 1.00 ± 0.65 | 3.76 ± 1.64 | .0959 | 0.86 ± 0.16 | 4.68 ± 1.46 | P < .05 |
| Pdpk1 | 1.00 ± 0.28 | 1.17 ± 0.22 | .3288 | 1.45 ± 0.21 | 2.16 ± 0.39 | .0936 |
Rpl19 was used as the internal control to determine relative gene expression, because its expression was not affected by BPA or hormone. Results are presented as fold change compared with V-O group. One-sided Student's t test was used to determine significance of V-O compared with V+H and BPA-O compared with BPA+H; n = 3 animals/treatment group.
BPA increases H3K4me3 marking of reprogrammed genes via activation of MLL1 methyltransferase activity
Our findings indicated that BPA-exposure increased H3K4me3 at the TSS of reprogrammed genes and caused an exaggerated response to hormone; therefore, we next sought to identify the mechanism responsible for initiation of this persistent BPA-induced epigenetic alteration. To do so, we focused on Grb2, which exhibited a significant increase in H3K4me3 at its TSS and approximately 6-fold increase in gene expression in response to hormone (T+E) in prostates reprogrammed by BPA (Figure 2, A and B, and Table 3). Immunohistochemical analysis of Grb2 revealed increased expression at the protein level in the lateral lobe of prostates from animals implanted with T+E pellets that had been exposed neonatally to BPA (Figure 2B).
To establish that neonatal BPA exposure increased H3K4me3, we used ChIP-qPCR to examine the TSS of Grb2 in neonatal prostates after BPA exposure. A significant 2-fold increase in H3K4me3 at the TSS of Grb2 at 24 hours. After BPA exposure was observed (Figure 3A), concordant with the elevated H3K4me3 seen in adult prostates of neonatally BPA-exposed rats. Notably, no increase in Grb2 gene expression was observed in neonatal prostates in response to BPA during this period (Figure 3B), indicating that the observed increase in H3K4me3 was not secondary to BPA-induced transactivation of Grb2 transcription. This led us to hypothesize that increased H3K4me3 could be due to altered activity of a histone methyltransferase responsible for “writing” this epigenetic mark.
Figure 3.

Neonatal BPA exposure activated MLL1. A, ChIP-qPCR was performed with anti-H3K4me3 antibody and neonatal prostate samples from rats treated with vehicle or BPA10 to determine H3K4me3 levels at Grb2. Mean values ± SEM are shown; *, P < .05, relative to vehicle, n = 3 (pooled samples each comprising 6 neonatal prostates). B, qPCR analysis of MLL1 expression was performed on neonatal prostates from rats injected with vehicle or BPA10 to measure Grb2 expression. Mean values ± SEM are shown, n = 3. C, Western blot analyses of PI3K/AKT pathway activation were conducted using anti-p-AKT (S473), anti-p-S6 (S235/236), and neonatal prostate samples from rats injected with vehicle or BPA10 (6 h after treatment). Quantification of anti-p-AKT and anti-p-S6 intensity normalized to anti-AKT and anti-S6 intensity, respectively. Mean values ± SEM are shown; *, P < .05, relative to vehicle, n = 3. D, Western blot analysis of MLL1 activation was conducted on neonatal prostates from rats injected with vehicle or BPA10. Mean values ± SEM are shown; *, P < .05, relative to vehicle, n = 3. E, ChIP-qPCR was performed with anti-C-terminal MLL1 antibody using neonatal prostate samples from rats injected with vehicle or BPA10 to examine MLL1 recruitment to Grb2. Mean values ± SEM are shown; *, P < .05, relative to vehicle, n = 3 (pooled samples each comprising 6 neonatal prostates). Student's t test was used to determine statistical significance for data in A–E.
MLL1 is a well-studied mammalian homolog of the yeast protein Set1 that is a part of COMPASS (complex of proteins associated with Set 1). Importantly, its 500-kDa precursor is cleaved by Taspase1 to generate a mature, heterodimerized MLL1N320/C180 (42), which has a conserved SET domain located in the C-terminal fragment, C180, that methylates histone H3 at K4 to generate the H3K4me3 mark (43–45). Having previously shown that BPA (and other EDCs) can activate nongenomic ER signaling to PI3K/AKT (17), we hypothesized that PI3K/AKT signaling might regulate MLL1 activity to reprogram the H3K4me3 epigenetic mark. As expected, Western blot analysis of lysates made from neonatal prostates showed that PI3K/AKT signaling was activated in vivo by BPA in neonatal prostates. As shown in Figure 3C, both AKT and its downstream effector S6 (markers of PI3K activation) were phosphorylated in response to BPA as early as 1 hour after exposure, and were significantly increased after 6 hours of exposure, consistent with the activation of nongenomic ER signaling by BPA previously observed in the neonatal prostate (14) and prostaspheres (17). Concordant with activation of PI3K/AKT signaling, MLL1 cleavage (activation) increased, with both components of the heterodimer MLL1N320/C180 elevated approximately 2-fold in BPA-exposed prostates relative to vehicle controls after 6 hours exposure (Figure 3D). Correlation analysis of 20 neonatal prostate samples (10 vehicle-treated and 10 BPA-treated prostates), confirmed a positive correlation between activation of PI3K/AKT signaling by BPA (S6 phosphorylation) and cleavage of MLL1 N- and C-terminal fragments (r = 0.6569 [P < .01] and r = 0.8320 [P < .0001], respectively). These correlative data were supported by ChIP-qPCR for MLL1C180 occupancy at Grb2 in neonatal prostates 24 hours after BPA exposure. This analysis revealed that consistent with increased cleavage/activation of MLL1, binding of this methyltransferase at the Grb2 TSS was significantly increased by BPA (Figure 3E). This was consistent with the observed increase in H3K4me3 at this locus (Figure 3A), which occurred in the absence of increased Grb2 gene expression (Figure 3B). These data suggest that activation of PI3K/AKT signaling could directly increase MLL1 cleavage, and thus its methyltransferase activity, resulting in reprogramming of the H3K4me3 epigenetic mark at target gene promoters.
Nongenomic (PI3K) signaling increases Taspase1-mediated MLL cleavage and activity to increase H3K4me3 marking of target genes
BPA has been shown to activate PI3K/AKT via nongenomic signaling in prostate cells in vitro (17); therefore, to determine whether nongenomic (PI3K) signaling was responsible for activation of MLL1, we next turned to in vitro studies using cells lines that exhibit robust activation of PI3K/AKT and nongenomic ER signaling to PI3K: the insulin-responsive HEK293 cell line and the estrogen-responsive, ER-positive MCF-7 cell line. As expected, and shown in Figure 4, A and B, insulin (a potent activator of PI3K/AKT signaling) rapidly activates AKT signaling, and this activation is blocked using the pharmacological PI3K inhibitor LY294002. Increased PI3K/AKT signaling correspondingly increased MLL1 cleavage (3-fold relative to vehicle), with cleavage similarly blocked with LY294002 (Figure 4, A and B). MLL1 activity was concordantly increased with PI3K/AKT activation, as shown by increased H3K4me3 at the Hoxa9 and Hoxc8 loci (Figure 4C), known targets for the MLL methyltransferase (46). Similar results were also obtained when MCF-7 cells were treated with the EDC BPA (a weak estrogen in MCF-7 cells) or the more potent EDC DES, both of which bind ER (47, 48), and were able to induce rapid nongenomic (PI3K) signaling and MLL1 cleavage (Supplemental Figure 1) as predicted. Furthermore, this activity was blocked by LY294002 (Supplemental Figure 1).
Figure 4.

Activation of nongenomic (PI3K) signaling results in increased MLL1 activity. A and B, Western blot analysis of AKT activation (a measure of PI3K activation) and MLL1 activation in HEK293 cells. Cells were treated with insulin (100nM) with or without LY294002 (20μM; 2 h) pretreatment to assess the effect of PI3K pathway inhibition. Mean values ± SEM are shown, statistical significance was determined by Student's t test; #, P < .05 compared with vehicle. Statistical significance of LY294002 effect was determined using two-way ANOVA; **, P < .01; ****, P < .0001, n = 3. C, Chromatin was collected from HEK293 cells 24 hours after insulin (100nM) treatment, and ChIP-qPCR was performed with anti-H3K4me3 antibody. Mean values ± SEM are shown; *, P < .05 relative to vehicle, n = 3. D and E, Western blot analysis of AKT activation and MLL1 activation in MCF-7 cells. Cells were treated with E2 (50nM) with or without LY294002 (20μM; 2 h) pretreatment to assess the effect of inhibition of the PI3K pathway. Mean values ± SEM are shown, statistical significance was determined by Student's t test; #, P < .05 compared with vehicle. Statistical significance of the LY294002 effect was determined using two-way ANOVA; ***, P < .001; ****, P < .0001, n = 3. F, Chromatin was collected from MCF-7 cells 24 hours after E2 (50nM) treatment and ChIP-qPCR was performed with anti-H3K4me3 antibody. Mean values ± SEM are shown; *, P < .05 relative to vehicle, n = 3. G and H, Western blot analysis of AKT activation and MLL1 activation in MCF-7 cells. Cells were treated with E2-BSA (100nM) with or without LY294002 (20μM; 2 h) pretreatment to assess the effect of inhibition of the PI3K pathway. Mean values ± SEM are shown, statistical significance was determined by Student's t test; #, P < .05 compared with vehicle. Statistical significance of the LY294002 effect was determined using two-way ANOVA; *, P < .05; **, P < .01; ****, P < .0001, n = 3. I, Chromatin was collected from MCF-7 cells 24 hours after E2-BSA (50nM) treatment, and ChIP-qPCR was performed with anti-H3K4me3 antibody. Mean values ± SEM are shown; *, P < .05 relative to vehicle, n = 3. Student's t test was used to determine statistical significance for data in C, F, and I.
To demonstrate that nongenomic (PI3K) signaling downstream of the ER (the receptor for EDCs such as BPA), was sufficient to induce MLL1 activation, and did not require ER transactivation of gene expression, we turned to MCF-7 cells in which nongenomic (PI3K) ER signaling can be activated. In these cells, genomic ER activity (ligand-activated ER binding to ERE-containing DNA that results in coactivator recruitment) can be separated from nongenomic ER signaling (changes in cell signaling induced by ligand-activated ER outside the nucleus) using E2-BSA, an estrogen BSA conjugate that cannot pass through the plasma membrane or induce genomic responses, but which can activate nongenomic (PI3K) signaling in the absence of ER binding to DNA (49). As a control, ER-regulated gene expression was examined via qPCR to ensure that E2-BSA treatment of these cells did not induce ER binding to DNA and transactivation of estrogen-responsive, canonical ER target gene expression (Supplemental Figure 2). As shown in Figure 4, D and E, and G and H, nongenomic (PI3K) signaling was significantly and reproducibly activated by E2 and E2-BSA, respectively, and preceded increased MLL1 cleavage (Figure 4, D and E, and G and H). Pharmacological inhibition of nongenomic (PI3K) signaling with LY294002 blocked both activation of this signaling pathway and MLL cleavage in response to E2 and E2-BSA, demonstrating the dependence on nongenomic (PI3K) signaling for cleavage/activation of this methyltransferase. Increased MLL activity was commensurate with increased cleavage as confirmed by ChIP-qPCR at the Hoxa9 and Hoxc8 loci (Figure 4, F and I), where significant and reproducible increases in H3K4me3 were observed at both loci in response to E2 and E2-BSA-induced nongenomic (PI3K) signaling. These data are consistent with observed effects of BPA in the neonatal prostate (Figure 3), where BPA activated PI3K/AKT signaling, and increased activation of MLL and enrichment of H3K4me3 at a reprogrammed gene (Grb2).
In contrast to yeast, where there is only 1 H3K4 methylase, Set1, in mammals there are several forms of the COMPASS complex that methylates H3K4, each with a distinct methyltransferase enzyme: MLL1, MLL2, and SET1A are COMPASS complex methyltransferases that establish the H3K4me3 mark at the TSS of expressed genes, whereas MLL3 and MLL4 are enhancer-associated H3K4 monomethylases and dimethylases (50, 51). Therefore, to confirm that MLL1 was the methyltransferase responsible for H3K4me3 reprogramming, we inactivated MLL1, MLL2, or Set1A using shRNA, with knockdown efficiency confirmed by Western blot analysis or qPCR (Figure 5A). These experiments demonstrated that the increase in H3K4me3 at the Hoxc8 gene TSS was attenuated in MLL1 knockdown cells, compared with mock cells that were infected with scrambled shRNA using E2 to activate nongenomic (PI3K) signaling (Figure 5B), consistent with the observed increase in MLL1 at the promoter of Grb2 in the prostate of neonatal animals treated with BPA (Figure 3). In contrast, knock down of MLL2 or Set1A had no detectable effect on the increase in H3K4me3 (Figure 5B). These data were confirmed by knockdown of the Taspase1 protease required to generate the C180 C-terminal and N320 N-terminal fragments that form the active MLL1 heterodimer (42). As seen with knockdown of MLL1, knockdown of TASP1 (Figure 5C) also abrogated the increase in H3K4me3 observed in response to E2 (Figure 5B), demonstrating Taspase1 dependence, and confirming the key role of MLL-1 cleavage/activation for H3K4me3 reprogramming. Collectively, these in vitro and in vivo data support a model where activation of nongenomic (PI3K) signaling in the developing prostate by BPA increases MLL1 cleavage by Taspase1 and its activity, thereby increasing H3K4me3 at developmentally reprogrammed genes (see model in Figure 5D). It is important to note that the reprogrammed genes may be tissue-specific, but the mechanism (ie, activation of PI3K/AKT and MLL) appears to be conserved across cell and tissue types. This epigenetic alteration persists into adulthood in prostates of animals at increased risk for prostate carcinogenesis, where reprogramming results in significantly increased hormone responsiveness and expression of genes associated with development of prostate cancer.
Figure 5.

Increased H3K4me3 marking of an MLL1 target gene is dependent on Taspase1 and MLL1 activity. A, Knockdown efficiency of the shRNA-targeted genes in MCF-7 cells. Left and middle, Knockdown efficacy of MLL1 and MLL2 was determined by Western blot analysis. Right, Knockdown efficacy of Set1A was determined by RT-qPCR, mean values ± SEM are shown. B, Chromatin was collected from MCF-7 cells 24 hours after E2 (50nM) treatment, and ChIP-qPCR was performed with anti-H3K4me3 antibody assaying occupancy at the Hoxc8 gene TSS. Mean values ± SEM are shown; *, P < .05 relative to vehicle, n = 3, Student's t test was used to determine statistical significance. C, Knockdown efficacy of Taspase1 was determined by RT-qPCR, mean values ± SEM are shown. D, Model for reprogramming of the epigenome by MLL1 activation in response to early-life environment exposures.
Discussion
Here, we identify a new pathway for developmental reprogramming that involves modulation of MLL1 activity by nongenomic (PI3K) signaling, which has previously been shown to be vulnerable to disruption by environmental exposures during critical periods of development. These data thus contribute to the increasing body of evidence linking EDC-dependent developmental reprogramming and the dysregulation of histone modifiers (20). Specifically, we have shown that the activity of MLL1 is increased via activation of nongenomic (PI3K) signaling in the neonatal developing prostate, demonstrating that MLL1 activation plays an important role in reprogramming by BPA. As a result of this reprogramming, in the adult prostate, reprogrammed genes exhibited a persistent elevation of H3K4me3 and an exaggerated response to the carcinogenesis-promoting hormone treatment that increases risk for development of prostate lesions. Thus, this work points to a new epigenetic mechanism by which early-life environmental exposures to EDCs can increase tumor susceptibility, not via mutations, but by inducing changes in the epigenome that persist into adulthood and increase risk across the life course.
Of the genes we identified as targets for developmental reprogramming in the prostate, defined as genes exhibiting a persistent change in the H3K4me3 mark after neonatal exposure, several belong to the KEGG prostate cancer pathway. Notably, although elevation in H3K4me3 was observed at the TSS of reprogrammed KEGG pathway genes, there were no differences in basal expression levels of these genes reprogrammed by BPA in the adult prostate compared with vehicle controls. Rather, this reprogramming exhibited its impact on gene expression when challenged with hormone, suggesting hyperresponsive hormone-dependent gene transcription may contribute to the increased susceptibility to develop prostate lesions seen in these animals. This phenotype is reminiscent of the reprogramming observed with other EDCs in the female reproductive tract, where early-life exposure to DES or genistein results in estrogen-responsive genes becoming hypersensitive to hormone in the adult uterus, resulting in increased susceptibility to uterine tumorigenesis (16, 52). However, reprogramming alone was not sufficient to produce an exaggerated response to hormone, because not all of the reprogrammed genes exhibited increased expression upon hormone treatment. This suggests that reprogramming may exhibit gene-specific effects, perhaps altering responsiveness to other transcription factors rather than nuclear hormone receptors.
A role for H3K4me3 in developmental reprogramming is particularly attractive. It is known that this methyl mark is associated with TSS of actively transcribed genes in both yeast and other eukaryotes (53, 54), and there is increasing evidence that H3K4me3 can also be enriched at inactive genes (40, 55), which may create a more accessible structure for other regulatory molecules to bind and initiate transcription. Our finding of increased H3K4me3 at reprogrammed genes that exhibit both an elevated level of basal expression, such as the secretoglobins and the kallikreins, as well as those whose basal expression is unchanged, but which exhibit an exaggerated response to T+E hormones, such as Grb2 and other KEGG pathway genes, would be consistent with this model.
These data are the first to demonstrate the histone methyltransferase MLL is activated in response to PI3K/AKT signaling. Our in vivo data in the developing prostate showed a correlation between activation of PI3K/AKT and increased MLL cleavage/activation, and in vitro studies performed in model cell lines HEK293 and MCF7 (in which PI3K/AKT activity can be induced, and more importantly, inhibited pharmacologically), demonstrated a causal association between this signaling pathway and MLL cleavage/activation. Although in vitro studies to analyze canonical signaling pathways, such as PI3K, can be performed in many different cell lines, additional studies in prostate epithelial cells are now needed to dissect, for example, how MLL is recruited to specific target genes during the process of reprogramming. The choice of cell(s) for these studies will have to be determined empirically, as we found for example that the well-characterized prostate cell line LNCaP was unsuitable for these analyses due to high basal levels of PI3K/AKT signaling, which could not be increased with ER stimulation. However, prostaspheres have been shown to activate PI3K/AKT signaling in response to BPA (17), suggesting they would be a good model system to use in future studies.
To date, the regulation of MLL1 cleavage and activity by posttranslational modifications is not well understood. MLL1 is degraded by SCFSkp2 and APCCdc20 during cell cycle progression (56), and degradation by Skp2 is blocked when MLL1 is phosphorylated at serine 516 by Ataxia telangiectasia and Rad 3 related (ATR) kinase (57). Although beyond the scope of the work presented here, it is possible that activation of nongenomic signaling pathways may modulate the activity of MLL1 by increasing its stability via modulation of Skp2 ubiquitination and/or cleavage by Taspase1 to generate a more active MLL1 dimer. A recent study identified a phosphorylation switch on retinoblastoma binding protein 5 (RbBP5), an allosteric regulatory protein in the COMPASS complex that stimulates complex formation and methylation of H3K4 (58), opening the possibility that in addition to MLL1, other COMPASS complex components may be targeted by nongenomic signaling pathways activated by EDCs to enhance H3K4me3 reprogramming. Alternatively, nongenomic signaling might increase Taspase1 expression in cells or enhance its cleavage activity by direct phosphorylation.
In addition to providing a new mechanism for developmental reprogramming by EDCs, we also identified new gene targets for BPA reprogramming in the developing prostate. Reprogrammed genes identified in the 2 clusters on chromosome 1 exhibited dramatic elevated basal gene expression in the adult prostate, accompanied by an increase in the active H3K9ac histone mark. The 4 secretoglobin polypeptide family genes in the first cluster encoded proteins that can function as prostatein (prostatic steroid binding proteins) to maintain a relatively high level of androgen within the lumen of acinar glands in the normal prostate (32, 59). The 3 genes in the second cluster encoded kallikrein family proteins expressed in the prostate that have trypsin- or chymotrypsin-like serine protease activity (29, 60). Human PSBPC1 has been proposed as a useful cancer biomarker because of differential PSBPC1 expression in multiple tumor types (61, 62). Additionally, another member of the human kallikrein family, kallikrein-related peptidase 3, also known as prostate-specific antigen (PSA), is a widely used biomarker for detection of prostate cancer (63). The identification of other kallikrein family members as targets for reprogramming suggests that epigenetic “marks” on these genes could potentially be developed as biomarkers of exposure for future studies exploring the contribution of early-life EDC exposure to the etiology of prostate cancer.
Acknowledgments
We thank Tia Berry for her excellent technical assistance with this work and Dr Jeff Everitt for pathology analysis.
This work was supported by National Institute of Environmental Health Sciences Grants RC2ES018789, P30ES023512, ES023206 and U01 ES026719; the Cancer Prevention Research Institute of Texas (CPRIT) Grant RP120855; and the Welch Foundation Grant BE-0023 (Houston, TX) (to C.L.W.). This study also made use of the MD Anderson Science Park Next Generation Sequencing Core, supported by the CPRIT Core Facility Support Award RP120348, and the Baylor College of Medicine Advanced Technology Core Bioinformatics Core, supported by the CPRIT Core Facility Support Award RP120092 and a National Cancer Institute Shared Resources Award P30CA125123.
Disclosure Summary: The authors have nothing to disclose.
Footnotes
- BPA
- bisphenol A
- BPA10
- 10-μg/kg body weight
- BPA50
- 50-μg/kg body weight
- ChIP
- chromatin immunoprecipitation
- ChIP-seq
- ChIP-sequencing
- COMPASS
- complex of proteins associated with Set1
- d
- postnatal day
- DES
- diethylstilbestrol
- E or E2
- 17 beta-estradiol
- EDC
- endocrine-disrupting chemical
- ER
- estrogen receptor
- H3K9ac
- H3 lysine 9 acetylation
- H3K4me3
- H3 lysine 4 trimethylation
- H3K27me3
- H3 lysine 27 trimethylation
- KEGG
- Kyoto Encyclopedia of Genes and Genomes
- LY294002
- PI3K inhibitor
- MLL1
- mixed-lineage leukemia 1
- PIN
- prostatic intraepithelial neoplasia
- PI3K/AKT
- phosphoinostide 3-kinase/AKT
- qPCR
- quantitative PCR
- RNA-seq
- RNA-sequencing
- RT-qPCR
- quantitative real-time RT-PCR
- SET1A
- lysine specific methyltransferase 2F (KMT2F)
- shRNA
- short hairpin RNA
- SDS
- sodium dodecyl sulfate
- T
- testosterone
- TSS
- transcription start site.
References
- 1. Li Y, Jaddoe VW, Qi L, et al. Exposure to the chinese famine in early life and the risk of metabolic syndrome in adulthood. Diabetes Care. 2011;34(4):1014–1018. [DOI] [PMC free article] [PubMed] [Google Scholar]
- 2. Mahabir S, Aagaard K, Anderson LM, et al. Challenges and opportunities in research on early-life events/exposures and cancer development later in life. Cancer Causes Control. 2012;23(6):983–990. [DOI] [PubMed] [Google Scholar]
- 3. Lamb JC, 4th, Boffetta P, Foster WG, et al. Critical comments on the WHO-UNEP State of the Science of Endocrine Disrupting Chemicals - 2012. Regul Toxicol Pharmacol. 2014;69(1):22–40. [DOI] [PubMed] [Google Scholar]
- 4. Gore AC, Chappell VA, Fenton SE, et al. EDC-2: The Endocrine Society's Second Scientific Statement on Endocrine-Disrupting Chemicals. Endocrine Rev. 2015;36(6):E1–E150. [DOI] [PMC free article] [PubMed] [Google Scholar]
- 5. D'Aloisio AA, Baird DD, DeRoo LA, Sandler DP. Association of intrauterine and early-life exposures with diagnosis of uterine leiomyomata by 35 years of age in the Sister Study. Environ Health Perspect. 2010;118(3):375–381. [DOI] [PMC free article] [PubMed] [Google Scholar]
- 6. Wise LA, Palmer JR, Rowlings K, et al. Risk of benign gynecologic tumors in relation to prenatal diethylstilbestrol exposure. Obstet Gynecol. 2005;105(1):167–173. [DOI] [PubMed] [Google Scholar]
- 7. Rochester JR. Bisphenol A and human health: a review of the literature. Reprod Toxicol. 2013;42:132–155. [DOI] [PubMed] [Google Scholar]
- 8. vom Saal FS, Timms BG, Montano MM, et al. Prostate enlargement in mice due to fetal exposure to low doses of estradiol or diethylstilbestrol and opposite effects at high doses. Proc Natl Acad Sci USA. 1997;94(5):2056–2061. [DOI] [PMC free article] [PubMed] [Google Scholar]
- 9. Ho SM, Tang WY, Belmonte de Frausto J, Prins GS. Developmental exposure to estradiol and bisphenol A increases susceptibility to prostate carcinogenesis and epigenetically regulates phosphodiesterase type 4 variant 4. Cancer Res. 2006;66(11):5624–5632. [DOI] [PMC free article] [PubMed] [Google Scholar]
- 10. Bateson P, Barker D, Clutton-Brock T, et al. Developmental plasticity and human health. Nature. 2004;430(6998):419–421. [DOI] [PubMed] [Google Scholar]
- 11. Walker CL, Ho SM. Developmental reprogramming of cancer susceptibility. Nat Rev Cancer. 2012;12(7):479–486. [DOI] [PMC free article] [PubMed] [Google Scholar]
- 12. Feil R, Fraga MF. Epigenetics and the environment: emerging patterns and implications. Nat Rev Genet. 2011;13(2):97–109. [DOI] [PubMed] [Google Scholar]
- 13. Dolinoy DC, Huang D, Jirtle RL. Maternal nutrient supplementation counteracts bisphenol A-induced DNA hypomethylation in early development. Proc Natl Acad Sci USA. 2007;104(32):13056–13061. [DOI] [PMC free article] [PubMed] [Google Scholar]
- 14. Dolinoy DC, Weidman JR, Waterland RA, Jirtle RL. Maternal genistein alters coat color and protects Avy mouse offspring from obesity by modifying the fetal epigenome. Environ Health Perspect. 2006;114(4):567–572. [DOI] [PMC free article] [PubMed] [Google Scholar]
- 15. Bredfeldt TG, Greathouse KL, Safe SH, Hung MC, Bedford MT, Walker CL. Xenoestrogen-induced regulation of EZH2 and histone methylation via estrogen receptor signaling to PI3K/AKT. Mol Endocrinol. 2010;24(5):993–1006. [DOI] [PMC free article] [PubMed] [Google Scholar]
- 16. Greathouse KL, Bredfeldt T, Everitt JI, et al. Environmental estrogens differentially engage the histone methyltransferase EZH2 to increase risk of uterine tumorigenesis. Mol Cancer Res. 2012;10(4):546–557. [DOI] [PMC free article] [PubMed] [Google Scholar]
- 17. Prins GS, Hu WY, Shi GB, et al. Bisphenol A promotes human prostate stem-progenitor cell self-renewal and increases in vivo carcinogenesis in human prostate epithelium. Endocrinology. 2014;155(3):805–817. [DOI] [PMC free article] [PubMed] [Google Scholar]
- 18. Tang WY, Morey LM, Cheung YY, Birch L, Prins GS, Ho SM. Neonatal exposure to estradiol/bisphenol A alters promoter methylation and expression of Nsbp1 and Hpcal1 genes and transcriptional programs of Dnmt3a/b and Mbd2/4 in the rat prostate gland throughout life. Endocrinology. 2012;153(1):42–55. [DOI] [PMC free article] [PubMed] [Google Scholar]
- 19. Ho SM, Cheong A, Lam HM, et al. Exposure of human prostaspheres to bisphenol A epigenetically regulates SNORD family noncoding RNAs via histone modification. Endocrinology. 2015;156(11):3984–3995. [DOI] [PMC free article] [PubMed] [Google Scholar]
- 20. Treviño LS, Wang Q, Walker CL. Phosphorylation of epigenetic “readers, writers and erasers”: implications for developmental reprogramming and the epigenetic basis for health and disease. Prog Biophys Mol Biol. 2015;118(1–2):8–13. [DOI] [PMC free article] [PubMed] [Google Scholar]
- 21. Wong RL, Walker CL. Molecular pathways: environmental estrogens activate nongenomic signaling to developmentally reprogram the epigenome. Clin Cancer Res. 2013;19(14):3732–3737. [DOI] [PMC free article] [PubMed] [Google Scholar]
- 22. Prins GS, Ye SH, Birch L, Ho SM, Kannan K. Serum bisphenol A pharmacokinetics and prostate neoplastic responses following oral and subcutaneous exposures in neonatal Sprague-Dawley rats. Reprod Toxicol. 2011;31(1):1–9. [DOI] [PMC free article] [PubMed] [Google Scholar]
- 23. Wong RL, Wang Q, Treviño LS, et al. Identification of secretaglobin Scgb2a1 as a target for developmental reprogramming by BPA in the rat prostate. Epigenetics. 2015;10(2):127–134. [DOI] [PMC free article] [PubMed] [Google Scholar]
- 24. Li H, Durbin R. Fast and accurate short read alignment with Burrows-Wheeler transform. Bioinformatics. 2009;25(14):1754–1760. [DOI] [PMC free article] [PubMed] [Google Scholar]
- 25. Zhang Y, Liu T, Meyer CA, et al. Model-based analysis of ChIP-Seq (MACS). Genome Biol. 2008;9(9):R137. [DOI] [PMC free article] [PubMed] [Google Scholar]
- 26. Stevis PE, Deecher DC, Suhadolnik L, Mallis LM, Frail DE. Differential effects of estradiol and estradiol-BSA conjugates. Endocrinology. 1999;140(11):5455–5458. [DOI] [PubMed] [Google Scholar]
- 27. Devos A, Claessens F, Alen P, et al. Identification of a functional androgen-response element in the exon 1-coding sequence of the cystatin-related protein gene crp2. Mol Endocrinol. 1997;11(8):1033–1043. [DOI] [PubMed] [Google Scholar]
- 28. Ho KC, Snoek R, Quarmby V, et al. Primary structure and androgen regulation of a 20-kilodalton protein specific to rat ventral prostate. Biochemistry. 1989;28(15):6367–6373. [DOI] [PubMed] [Google Scholar]
- 29. Lawrence MG, Lai J, Clements JA. Kallikreins on steroids: structure, function, and hormonal regulation of prostate-specific antigen and the extended kallikrein locus. Endocrine Rev. 2010;31(4):407–446. [DOI] [PubMed] [Google Scholar]
- 30. Mills JS, Needham M, Parker MG. Androgen regulated expression of a spermine binding protein gene in mouse ventral prostate. Nucleic Acids Res. 1987;15(19):7709–7724. [DOI] [PMC free article] [PubMed] [Google Scholar]
- 31. Oram S, Cai X, Haleem R, Cyriac J, Wang Z. Regulation of calcium homeostasis by S100RVP, an androgen-regulated S100 protein in the rat ventral prostate. Prostate. 2006;66(7):768–778. [DOI] [PubMed] [Google Scholar]
- 32. Parker M, Needham M, White R. Prostatic steroid binding protein: gene duplication and steroid binding. Nature. 1982;298(5869):92–94. [DOI] [PubMed] [Google Scholar]
- 33. Vanaken H, Claessens F, Vercaeren I, Heyns W, Peeters B, Rombauts W. Androgenic induction of cystatin-related protein and the C3 component of prostatic binding protein in primary cultures from the rat lacrimal gland. Mol Cell Endocrinol. 1996;121(2):197–205. [DOI] [PubMed] [Google Scholar]
- 34. Jackson BC, Thompson DC, Wright MW, et al. Update of the human secretoglobin (SCGB) gene superfamily and an example of 'evolutionary bloom' of androgen-binding protein genes within the mouse Scgb gene superfamily. Hum Genomics. 2011;5(6):691–702. [DOI] [PMC free article] [PubMed] [Google Scholar]
- 35. Flüchter SH, Nelde HJ, Björk P, Müntzing J, Bichler KH. Effect of treatment on the expression of estramustine-binding protein (EMBP) in prostatic cancer patients: an immunohistochemical study. Prostate. 1989;14(1):27–43. [DOI] [PubMed] [Google Scholar]
- 36. Lilja H, Ulmert D, Björk T, et al. Long-term prediction of prostate cancer up to 25 years before diagnosis of prostate cancer using prostate kallikreins measured at age 44 to 50 years. J Clin Oncol. 2007;25(4):431–436. [DOI] [PubMed] [Google Scholar]
- 37. Kim TH, Barrera LO, Zheng M, et al. A high-resolution map of active promoters in the human genome. Nature. 2005;436(7052):876–880. [DOI] [PMC free article] [PubMed] [Google Scholar]
- 38. Bernstein BE, Kamal M, Lindblad-Toh K, et al. Genomic maps and comparative analysis of histone modifications in human and mouse. Cell. 2005;120(2):169–181. [DOI] [PubMed] [Google Scholar]
- 39. Vermeulen M, Mulder KW, Denissov S, et al. Selective anchoring of TFIID to nucleosomes by trimethylation of histone H3 lysine 4. Cell. 2007;131(1):58–69. [DOI] [PubMed] [Google Scholar]
- 40. Barski A, Cuddapah S, Cui K, Roh TY, et al. High-resolution profiling of histone methylations in the human genome. Cell. 2007;129(4):823–837. [DOI] [PubMed] [Google Scholar]
- 41. Bosland MC, Ford H, Horton L. Induction at high incidence of ductal prostate adenocarcinomas in NBL/Cr and Sprague-Dawley Hsd:SD rats treated with a combination of testosterone and estradiol-17 β or diethylstilbestrol. Carcinogenesis. 1995;16(6):1311–1317. [DOI] [PubMed] [Google Scholar]
- 42. Hsieh JJ, Cheng EH, Korsmeyer SJ. Taspase1: a threonine aspartase required for cleavage of MLL and proper HOX gene expression. Cell. 2003;115(3):293–303. [DOI] [PubMed] [Google Scholar]
- 43. Miller T, Krogan NJ, Dover J, et al. COMPASS: a complex of proteins associated with a trithorax-related SET domain protein. Proc Natl Acad Sci USA. 2001;98(23):12902–12907. [DOI] [PMC free article] [PubMed] [Google Scholar]
- 44. Krogan NJ, Dover J, Khorrami S, et al. COMPASS, a histone H3 (Lysine 4) methyltransferase required for telomeric silencing of gene expression. J Biol Chem. 2002;277(13):10753–10755. [DOI] [PubMed] [Google Scholar]
- 45. Eissenberg JC, Shilatifard A. Histone H3 lysine 4 (H3K4) methylation in development and differentiation. Dev Biol. 2010;339(2):240–249. [DOI] [PMC free article] [PubMed] [Google Scholar]
- 46. Wysocka J, Swigut T, Milne TA, et al. WDR5 associates with histone H3 methylated at K4 and is essential for H3 K4 methylation and vertebrate development. Cell. 2005;121(6):859–872. [DOI] [PubMed] [Google Scholar]
- 47. Matsushima A, Liu X, Okada H, Shimohigashi M, Shimohigashi Y. Bisphenol AF is a full agonist for the estrogen receptor ERα but a highly specific antagonist for ERβ. Environ Health Perspect. 2010;118(9):1267–1272. [DOI] [PMC free article] [PubMed] [Google Scholar]
- 48. Blair RM, Fang H, Branham WS, et al. The estrogen receptor relative binding affinities of 188 natural and xenochemicals: structural diversity of ligands. Toxicol Sci. 2000;54(1):138–153. [DOI] [PubMed] [Google Scholar]
- 49. Taguchi Y, Koslowski M, Bodenner DL. Binding of estrogen receptor with estrogen conjugated to bovine serum albumin (BSA). Nucl Recept. 2004;2(1):5. [DOI] [PMC free article] [PubMed] [Google Scholar]
- 50. Herz HM, Mohan M, Garruss AS, et al. Enhancer-associated H3K4 monomethylation by Trithorax-related, the Drosophila homolog of mammalian Mll3/Mll4. Genes Dev. 2012;26(23):2604–2620. [DOI] [PMC free article] [PubMed] [Google Scholar]
- 51. Lee JE, Wang C, Xu S, et al. H3K4 mono- and di-methyltransferase MLL4 is required for enhancer activation during cell differentiation. eLife. 2013;2:e01503. [DOI] [PMC free article] [PubMed] [Google Scholar]
- 52. Greathouse KL, Cook JD, Lin K, et al. Identification of uterine leiomyoma genes developmentally reprogrammed by neonatal exposure to diethylstilbestrol. Reprod Sci. 2008;15(8):765–778. [DOI] [PubMed] [Google Scholar]
- 53. Santos-Rosa H, Schneider R, Bannister AJ, et al. Active genes are tri-methylated at K4 of histone H3. Nature. 2002;419(6905):407–411. [DOI] [PubMed] [Google Scholar]
- 54. Ng HH, Robert F, Young RA, Struhl K. Targeted recruitment of Set1 histone methylase by elongating Pol II provides a localized mark and memory of recent transcriptional activity. Mol Cell. 2003;11(3):709–719. [DOI] [PubMed] [Google Scholar]
- 55. Guenther MG, Levine SS, Boyer LA, Jaenisch R, Young RA. A chromatin landmark and transcription initiation at most promoters in human cells. Cell. 2007;130(1):77–88. [DOI] [PMC free article] [PubMed] [Google Scholar]
- 56. Liu H, Cheng EH, Hsieh JJ. Bimodal degradation of MLL by SCFSkp2 and APCCdc20 assures cell cycle execution: a critical regulatory circuit lost in leukemogenic MLL fusions. Genes Dev. 2007;21(19):2385–2398. [DOI] [PMC free article] [PubMed] [Google Scholar]
- 57. Liu H, Takeda S, Kumar R, et al. Phosphorylation of MLL by ATR is required for execution of mammalian S-phase checkpoint. Nature. 2010;467(7313):343–346. [DOI] [PMC free article] [PubMed] [Google Scholar]
- 58. Zhang P, Chaturvedi CP, Tremblay V, et al. A phosphorylation switch on RbBP5 regulates histone H3 Lys4 methylation. Genes Dev. 2015;29(2):123–128. [DOI] [PMC free article] [PubMed] [Google Scholar]
- 59. Lea OA, Petrusz P, French FS. Prostatein. A major secretory protein of the rat ventral prostate. J Biol Chem. 1979;254(13):6196–6202. [PubMed] [Google Scholar]
- 60. Pavlopoulou A, Pampalakis G, Michalopoulos I, Sotiropoulou G. Evolutionary history of tissue kallikreins. PLoS One. 2010;5(11):e13781. [DOI] [PMC free article] [PubMed] [Google Scholar]
- 61. Carter D, Dillon DC, Reynolds LD, et al. Serum antibodies to lipophilin B detected in late stage breast cancer patients. Clin Cancer Res. 2003;9(2):749–754. [PubMed] [Google Scholar]
- 62. Culleton J, O'Brien N, Ryan BM, et al. Lipophilin B: a gene preferentially expressed in breast tissue and upregulated in breast cancer. Int J Cancer. 2007;120(5):1087–1092. [DOI] [PubMed] [Google Scholar]
- 63. Tosoian J, Loeb S. PSA and beyond: the past, present, and future of investigative biomarkers for prostate cancer. ScientificWorldJournal. 2010;10:1919–1931. [DOI] [PMC free article] [PubMed] [Google Scholar]