

Abstract
It is known that angiotensin-II acts at its type-1 receptor to stimulate vasopressin (AVP) secretion, which may contribute to angiotensin-II-induced hypertension. Less well known is the impact of angiotensin type-2 receptor (AT2R) activation on these processes. Studies conducted in a transgenic AT2R enhanced green fluorescent protein reporter mouse revealed that although AT2R are not themselves localized to AVP neurons within the paraventricular nucleus of the hypothalamus (PVN), they are localized to neurons that extend processes into the PVN. In the present set of studies, we set out to characterize the origin, phenotype, and function of nerve terminals within the PVN that arise from AT2R-enhanced green fluorescent protein-positive neurons and synapse onto AVP neurons. Initial experiments combined genetic and neuroanatomical techniques to determine that γ-aminobutyric acid (GABA)ergic neurons derived from the peri-PVN area containing AT2R make appositions onto AVP neurons within the PVN, thereby positioning AT2R to negatively regulate neuroendocrine secretion. Subsequent patch-clamp electrophysiological experiments revealed that selective activation of AT2R in the peri-PVN area using compound 21 facilitates inhibitory (ie, GABAergic) neurotransmission and leads to reduced activity of AVP neurons within the PVN. Final experiments determined the functional impact of AT2R activation by testing the effects of compound 21 on plasma AVP levels. Collectively, these experiments revealed that AT2R expressing neurons make GABAergic synapses onto AVP neurons that inhibit AVP neuronal activity and suppress baseline systemic AVP levels. These findings have direct implications in the targeting of AT2R for disorders of AVP secretion and also for the alleviation of high blood pressure.
The renin angiotensin system is an endocrine system that plays an integral role in the regulation of hydromineral balance and cardiovascular function by acting in the brain to impact behavior, sympathetic outflow, and neuroendocrine secretion. It is established that angiotensin-II (Ang-II), the primary effector peptide of this system, activates angiotensin type-1 receptors (AT1Rs) within specific brain nuclei to regulate neuroendocrine axes and blood pressure (BP) (1–9). One important action of Ang-II at its AT1R is its ability to stimulate vasopressin (AVP) secretion subsequent to hypotension or decreases in blood volume. Administration of AT1R antagonists systemically or into the brain reduces AVP secretion induced by Ang-II (1, 7, 8, 10, 11). It has been further postulated that the enhancement of AVP secretion by the activation of brain AT1R contributes to the development of hypertension, a widespread health problem and a major risk factor for the development of cardiovascular disease, the leading cause of death in the United States. Less well known is the impact of central angiotensin type-2 receptor (AT2R) activation on AVP secretion.
It has been widely hypothesized that the balance between AT1R and AT2R governs the responses of tissues to Ang-II, and it is possible that selective activation of AT2R may antagonize the neuroendocrine secretion associated with hypothalamic AT1R stimulation. That being said, the therapeutic utility of targeting these receptors within the brain has often been overlooked due to the inability to effectively localize central AT2R, leading to the false assumption that AT2R are not highly expressed in or near central nervous system nuclei that regulate neuroendocrine responses.
Using recent advances in molecular and genetic techniques to localize AT2R within the brain with a high degree of sensitivity and resolution, we have previously determined that AT2R-positive cell bodies and nerve terminals are well positioned to influence brain regions that regulate neuroendocrine axes (12). One critical site of Ang-II actions within the brain is the paraventricular nucleus of the hypothalamus (PVN), which is an integrative region for the control of several homeostatic systems and densely expresses the AT1R (13). The PVN can be divided into a number of functionally distinct subgroups, which collectively transmit and receive signals to and from brain regions regulating body fluid homeostasis. Parvocellular PVN neurons, many of which express AT1R (13), can be neurosecretory (eg, those expressing CRH to influence the hypothalamic pituitary adrenal axis) or preautonomic (eg, those projecting to the hindbrain to influence sympathetic outflow and BP) (14–16). Magnocellular PVN neurons express AVP or oxytocin (OT) (17), and their activation results in the release of AVP and OT from the posterior pituitary into the circulation. Of relevance, although the PVN itself does not contain any AT2R-positive neuronal cell bodies, nerve fibers and/or terminals arising from AT2R-positive cells are densely localized to the parvocellular and magnocellular portions of the PVN. Further, we have previously determined that these AT2R-positive fibers/terminals come into close proximity to AVP neurons within this area and that many of these AT2R-positive neurons originate from brain regions that send inhibitory projections to the PVN, including the preoptic area and γ-aminobutyric acid (GABA)ergic neurons that lie adjacent to the PVN (12).
In the present set of studies, we set out to further characterize the origin, phenotype, and function of nerve terminals within the PVN that arise from AT2R-eGFP-positive neurons. Initial experiments combined genetic and neuroanatomical techniques to test the hypothesis that GABAergic neurons containing AT2R make appositions onto AVP neurons within the PVN, thereby positioning AT2R to negatively regulate neuroendocrine secretion and BP. Subsequent experiments used patch-clamp electrophysiological techniques to test the hypothesis that activation of AT2R on neurons that project to the PVN will facilitate inhibitory (ie, GABAergic) neurotransmission and that this will lead to reduced activity of AVP neurons within the PVN. Final experiments assessed the functional impact of AT2R activation on plasma AVP levels. Collectively, these experiments tested the overall hypothesis that AT2R expressing neurons which make GABAergic synapses onto AVP neurons, inhibit AVP neuronal activity, and suppress baseline systemic AVP levels.
Materials and Methods
Animals
Animal studies were performed at the University of Florida in Gainesville or at Augusta University. In all cases, experimental protocols were approved by the Institutional Animal Care and Use Committees at the University of Florida or Augusta University and were conducted in accordance with the National Institutes of Health Guide for the Care and Use of Laboratory Animals. Male mice (10–12 wk old) or rats (4–6 wk old) were maintained in temperature and humidity-controlled rooms on a 12-hour light, 12-hour dark cycle with food and water available ad libitum.
Some experiments used a mouse line that expresses enhanced green fluorescent protein (eGFP) in all cells that express the AT2R (ie, eGFP expression is driven by all of the regulatory sequences of the AT2R bacterial artificial chromosome [BAC] gene) to determine the precise localization of neurons that produce the AT2R (AT2R-eGFP; Mutant Mouse Regional Resource Centers; 030278). Briefly, the eGFP reporter gene and subsequent polyadenylation sequence were inserted into the AT2R BAC clone at the start codon of the first coding exon of the AT2R gene. This construct was then used to produce the transgenic mouse and results in eGFP expression driven by all of the regulatory sequences of the AT2R BAC gene. For additional details, see the vendor's website (www.mmrrc.org). This mouse line was previously characterized (12), and it was determined that the distribution of AT2R-eGFP in the mouse brain is comparable with the AT2R binding observed using autoradiography (18). Mice used for the studies were backcrossed onto a C57BL/6J background for more than 5 generations and were hemizygous for the transgene.
In one study, AT2R-eGFP mice were crossed with mice that express both CRH-Cre (stock 012704; The Jackson Laboratory) and tdTomato-Stop-Flox (stock 007914; The Jackson Laboratory) to generate male double reporter mice in which AT2R-positive cells fluoresce green and CRH-positive cells fluoresce red. Importantly, we have previously determined that there is a high degree of colocalization of red fluorescent protein and CRH mRNA in mice expressing both CRH-Cre and tdTomato-Stop-Flox (19). For anatomical studies, a total of 20 AT2R-eGFP and 4 dual AT2R-eGFP/CRH-tdTomato reporter mice were used. For measurements of plasma AVP levels, 39 C57BL/6J mice were used. For in vitro electrophysiology, 6 AT2R-eGFP mice and 6 heterozygous transgenic eGFP-AVP Wistar rats were used (20).
Retrograde tracer injections
AT2R-eGFP reporter mice were anesthetized using isoflurane, administered analgesic (Buprenorphine) and prepared for stereotaxic surgery. Some mice received unilateral stereotaxic microiontophoretic injections of FluoroGold (FG) (2% wt/vol in 0.9% NaCl; 5 μA; 7-s on/off for 8 min) into the rostral ventrolateral medulla (RVLM), using glass micropipettes (inside diameter of ∼30 μm) and the following coordinates from [Lambda]: anterioposterior −1.57 mm and mediolateral +1.30 mm; and from the surface of the brain: dorsoventral −5.07 mm. Others received such injections into the PVN (coordinates from bregma: anteroposterior 0.00 mm, mediolateral +0.25 mm, and dorsoventral −4.75 mm). Seven to 10 days after surgery, mice were anesthetized with pentobarbital and perfused and brain tissue was processed for immunohistochemistry (IHC) as described below. In all cases, injection sites were analyzed and missed injections served as controls for neuroanatomical specificity. Retrograde tracing studies were performed in a total of 10 mice, 6 of which received injections into the RVLM and 4 of which received injections into the PVN. This yielded 3 “hits” in the PVN and 4 hits in the RVLM, all of which were used for the IHC studies described below.
Tissue collection and sectioning
In order to collect brain tissue for in situ hybridization (ISH) and/or IHC studies, mice were anesthetized with pentobarbital and perfused transcardially with 0.15M NaCl followed by 4% paraformaldehyde. Brains were then postfixed for 3–4 hours, after which they were stored in 30% sucrose until sectioning using a Leica CM3050S cryostat (Leica). For IHC studies that did not also incorporate ISH, perfused mouse brains were sectioned at 30 μm into 4 serial sections and stored in cryoprotectant solution (−20°C) until further processing. For ISH experiments, perfused mouse brains were sectioned at 20 μm into 6 serial sections and immediately mounted onto SuperFrost Plus Gold Microscope Slides. After air-drying at room temperature for 20–30 minutes, slides were stored at −80°C until further processing. All solutions were prepared with diethylpyrocarbonate-treated water and filtered using a 0.22-μm filter and tissue collection and sectioning were performed in ribonuclease-free conditions.
ISH (RNAscope)
Studies using RNAscope ISH (Advanced Cell Diagnostics) were performed on brain tissue collected from AT2R-eGFP mice as per the manufacturer's instructions and as previously described (12). Briefly, after allowing tissue sections to dry at 25°C for 30 minutes, they were incubated with pretreatment 4 (a protease) and then underwent the RNAscope Multiplex Fluorescent ISH protocol. Specific details of the RNAscope ISH technique are outlined on the vendor's website. Target probes are designed using the proprietary ACD RNAscope Probe Design pipeline, and contain 20 short double-Z oligonucleotide probe pairs that are gene specific. For amplification and visualization, both Z-probes must bind to the mRNA of interest. RNAscope detection reagents are then sequentially hybridized to amplify the signal and subsequently color-label the individual mRNA transcripts. For these experiments, the color label was assigned to either FAR RED (excitation, 647 nm; emission, 690 ± 10 nm) or ORANGE (excitation, 550 nm; emission, 580 ± 10 nm). Using this technique, each punctate dot represents a single mRNA target molecule.
Probes for glutamic acid decarboxylase-1 (Gad1) and vesicular glutamate transporter-2 (vGlut2) were used to determine the percentage of AT2R-eGFP neurons in the brain regions of interest (ROIs) that are GABAergic or glutamatergic, respectively. These areas included the following: the median preoptic nucleus (MnPO), the area directly surrounding the PVN (peri-PVN), the lateral ventral septum (LVS), and the bed nucleus of the stria terminalis (BNST). Each slide contained 4 sections. For each ROI the following probe combinations were used: 1) negative control probe, 2) positive control probe, 3) Gad1, and 4) vGlut2. Sections that were hybridized with the negative and positive control probes were used to determine the exposure time and image processing necessary to provide optimal visualization of RNA signal and also to control for possible RNA degradation for each brain.
Immunohistochemistry
All primary antibodies were characterized by the manufacturers and in previously published studies (12, 21, 22) and are listed in Table 1. First, the antibody directed toward GFP, was previously validated in Refs. 12, 22, and its specificity was substantiated for the present study by the lack of staining on sections originating from mice that did not express GFP. Next, both anti-OT-neurophysin (NP) (PS-38) and anti-AVP-NP (PS-41) were validated in Refs. 21, 23, in which it was determined these antibodies appropriately and specifically labeled the posterior pituitary, the paraventricular and supraoptic nuclei. Additionally, liquid-phase RIA was used to determine that anti-OT-NP (PS-38) is highly specific for the OT-NP complex and does not cross-react with AVP-NP, whereas the anti-AVP-NP (PS-41) reacts with AVP-NP exclusively. Furthermore, as in Refs. 21, 24, the specificity of the rabbit polyclonal antibody against FG was corroborated by the lack of staining on sections originating from mice without FG treatment. All secondary antibodies were purchased from Jackson ImmunoResearch, raised in donkey, and used at a 1:500 dilution.
Table 1.
Primary Antibody Table
| Peptide/Protein Target | Antigen Sequence (if Known) | Name of Antibody | Manufacturer, Catalog Number, and/or Name of Individual Providing the Antibody | Species Raised in; Monoclonal or Polyclonal | Dilution Used |
|---|---|---|---|---|---|
| GFP | GFP | GFP | Life Technologies, A10262 | Chicken; IgY | 1:1000 |
| OT-neurophysin | Purified rat OT-neurophysin | OT-NP | Dr H. Gainer, National Institutes of Health, PS-38 | Mouse; monoclonal | 1:1000 |
| AVP-neurophysin | Purified rat AVP-neurophysin | AVP-NP | Dr H. Gainer, National Institutes of Health, PS-41 | Mouse; monoclonal | 1:400 |
| FG | FG | FG | Millipore, AB153 | Rabbit; polyclonal | 1:4000 |
In general, the IHC procedures were as follows: brain sections were removed from cryoprotectant solution and rinsed 5 times for 5 minutes in 50mM potassium phosphate buffered saline (KPBS) and then incubated in blocking solution (2% normal donkey serum and 0.2% Triton X-100 in 50mM KPBS) for 2 hours at 25°C. This was followed by incubation with the primary antibody in blocking solution for 18 hours at 4°C. Sections were again rinsed 5 times for 5 minutes in 50mM KPBS and then incubated in the secondary antibody for 2 hours at 25°C. After a final series of rinses (5 × 5 min), sections were mounted onto slides, allowed to air dry, and then cover slipped using polyvinyl alcohol mounting medium. For double-label IHC, sections were incubated with both primary antibodies simultaneously and, subsequently, both secondary antibodies simultaneously. Importantly, all qualitative IHC studies were performed in 3–4 separate mice (the specific group sizes are included in the figure legends).
Image capture and processing
All images were captured and processed using Axiovision 4.8.2 software and a Zeiss AxioImager fluorescent Apotome microscope. For RNAscope ISH and dual IHC/RNAscope ISH, z-stacks of the proteins and transcripts of interest were captured at ×40 magnification throughout the ROIs using neuroanatomical landmarks found in a mouse brain atlas (25). In all cases, z-steps were set at 0.5 μm, with an average of 20 optical sections per image. For each experiment, sections hybridized with the positive control probes were used to determine the exposure time and image processing required to provide optimal visualization of RNA signal. These same parameters were then used for visualization of mRNAs of interest in experimental sections, to assess background fluorescence in sections hybridized with the negative control probe (dihydrodipicolinate reductase) and to determine the specificity of the probes using tissue obtained from knockout mice. Importantly, using these exposure times and image processing parameters there was minimal or no fluorescence in sections hybridized with the negative control probe and in sections obtained from knockout mice. All final figures were then prepared using Adobe Photoshop 7.0 where the brightness and contrast was adjusted to provide optimal visualization.
Image analysis
Analysis of colocalization of mRNA transcripts with eGFP fluorescence was performed on selected brain regions in 4 separate AT2R-eGFP mouse brains; ×40 magnification z-stacks of ROIs were used to determine the percentage of eGFP neurons that contain Gad1 or vGlut2 mRNA. An average of 2–4 z-stacks were captured for each ROI, depending on the rostrocaudal length of the particular ROI. eGFP neurons were considered to contain the RNA of interest if at least 3 visible transcripts, defined as an individual punctate dot, were observed within the volume of the eGFP fluorescence. Data are reported as the percentage of AT2R-eGFP cells that contain the RNA for each gene within each ROI.
In order to determine appositions between eGFP nerve terminals and AVP neurons within the PVN, ×40 z-stacks (with an average of 20 optical sections; 0.5 μm/section) were assessed. Appositions were verified by a lack of separation between eGFP-positive boutons and the cell type-specific marker (AVP).
Slice preparation for electrophysiology
Hypothalamic brain slices were prepared according to methods previously described (26, 27). Briefly, mice (n = 6)/rats (n = 6) were anesthetized with pentobarbital (50 mg/kg ip); brains dissected out and hypothalamic coronal slices (210 μm) containing the PVN were cut in an oxygenated ice-cold artificial cerebrospinal fluid (aCSF), containing 119mM NaCl, 2.5mM KCl, 1mM MgSO4, 26mM NaHCO3, 1.25mM NaH2PO4, 20mM D-glucose, 0.4mM ascorbic acid, 2mM CaCl2, and 2mM pyruvic acid (pH 7.3; 295 mOsm). Slices were placed in a holding chamber containing aCSF and kept at room temperature until use.
Electrophysiology
Hypothalamic slices were transferred to a recording chamber and superfused with continuously bubbled (95% O2-5% CO2) aCSF (30°C–32°C) at a flow rate of approximately 3.0 mL/min. Thin-walled (1.5-mm outer diameter, 1.17-mm inner diameter) borosilicate glass (G150TF-3; Warner Instruments) was used to pull patch pipettes (3–5 MΩ) on a horizontal micropipette puller (P-97; Sutter Instruments). The internal solution contained the following: 135mM potassium gluconate, 0.2mM EGTA, 10mM HEPES, 10mM KCl, 0.9mM MgCl2, 4mM Mg2+ATP, 0.3mM Na+GTP, and 20mM phosphocreatine (Na+); pH was adjusted to 7.2–7.3 with KOH. For voltage-clamp experiments, patch pipettes were filled with a high Cl−-containing solution: 140mM KCl, 10mM HEPES, 0.2mM EGTA, 4mM Mg2+ATP, 0.3mM Na+GTP, and 20mM phosphocreatine (Na+). When noted, neurons were intracellularly labeled with Alexa Fluor 555 (50μM). Recordings were obtained from fluorescently labeled AT2R-eGFP cells and from eGFP-AVP neurons with an Axopatch 200B amplifier (Axon Instruments), using a combination of fluorescence illumination and infrared differential interference contrast videomicroscopy. The voltage output was digitized at 16-bit resolution, 10 kHz, and was filtered at 2 kHz (Digidata 1440A; Axon Instruments). Data were discarded if the series resistance was not stable throughout the entire recording (>20% change) (26, 27). Drugs were applied via a single bolus injection into the bath (0.5 mL). Mean firing activity and membrane potential values were calculated from a 1-minute period before drug application and a 1-minute period around the peak effect, using Clampfit (Axon Instruments) or MiniAnalysis (Synaptosoft) software. Spontaneous inhibitory postsynaptic currents (IPSCs) (recorded at −70 mV) were detected and analyzed using MiniAnalysis. A detection threshold was set at −75 pA for IPSC peak, to extract IPSCs without contamination with glutamate-mediated excitatory postsynaptic current (28).
Osmotic minipump implantation
ALZET osmotic minipumps and Brain Infusion kits (DURECT Corp) for the chronic delivery of C21 (7.5 ng/kg · h for 1 wk) or aCSF control into the lateral cerebral ventricle intracerebroventricular (icv) were prepared according to the manufacturer's instructions. After allowing the pumps to prime, by incubating them in a 37°C water bath for a minimum of 48 hours, pumps and infusion kits were implanted using a Kopf stereotaxic device as described (29). The coordinates from bregma were as follows: 0.2 mm posterior, 1.0 mm lateral, and 2.5 mm ventral.
Analysis of plasma AVP levels
For the assessment of plasma AVP levels, trunk blood was collected from unanesthetized mice given either C21 or saline vehicle icv for 1 week. Blood samples were collected during the circadian nadir of AVP secretion and kept on ice for a maximum of 45 minutes before centrifugation and plasma collection for AVP analysis using a commercially available RIA kit (Phoenix Pharmaceuticals).
Statistical analysis
All values are expressed as mean ± SE. For electrophysiological studies, Student's paired t tests were used to compare the effects of drug treatment. Differences were considered significant at P < .05, and n refers to the number of cells. Similarly, for the analysis of plasma AVP levels a Student's t test was performed, with the threshold for consideration as statistically significant being set at P < .05. All statistical analyses were conducted using GraphPad Prism (GraphPad Software).
Results
AT2R-eGFP does not colocalize with OT, AVP, or CRH neurons in the PVN or with RVLM-projecting PVN neurons
We have previously determined that AT2R-eGFP neuronal cell bodies are likely not localized to the PVN and observed no overlap between AT2R-eGFP and AVP immunoreactivity within the cell bodies of the PVN (12). Initial studies in the present manuscript confirmed and built upon these findings by evaluating the degree of colocalization between AT2R-eGFP and various neuronal phenotypes within the PVN. Figure 1 depicts the lack of colocalization between AT2R-eGFP and AVP (Figure 1, A–C), OT (Figure 1, D–F), and CRH (Figure 1, G–I) neurons within the PVN. Furthermore, examination of brains from mice that received injections of the retrograde neuronal tract tracer into the RVLM revealed that AT2R-eGFP was similarly not expressed on RVLM-projecting preautonomic neurons within the area (Figure 1, J–L). It is also evident from the images, that rather, AT2R-eGFP-expressing neurons were located in regions surrounding the proper PVN.
Figure 1.

AT2R are not expressed on OT, AVP, CRH, or RVLM-projecting neurons in the PVN. Representative coronal sections through the PVN of the AT2R-eGFP reporter mice depicting eGFP in green and either (A–C) AVP, (D–F) OT, (G–I) CRH-tdTomato cells, or (J–L) FG-labeled RVLM-projecting cells in red. All staining was performed on 4 mouse brains (ie, n = 4). 3v, third ventricle. Scale bars, 100 μm.
AT2R-eGFP is localized to terminals within the PVN that make appositions onto AVP neurons
Despite the lack of localization of AT2R-eGFP to the cell bodies within the PVN, we have previously observed an abundance of AT2R-eGFP neuronal fibers/terminals that come in apparent close contact to AVP neurons within the area (12). As in this previous publication (12), Figure 2 highlights the observation that AT2R-eGFP terminals are near AVP neurons and make apparent appositions onto these neurons. The implication is that AT2R-eGFP cells are positioned to regulate the activity of AVP neurons via impacting neurotransmitter release onto these neurons. This finding led to experiments designed to determine the origin and phenotype of the AT2R-eGFP neurons that project to the PVN, and to test the hypothesis that the activation of AT2R impacts neurotransmitter release onto AVP neurons within the PVN.
Figure 2.
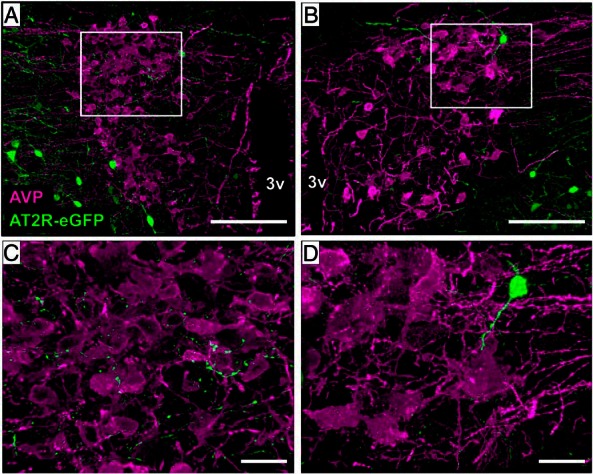
AT2R-eGFP fibers/terminals are near AVP neurons of the PVN. A and B, ×20 images through the PVN of an AT2R-eGFP reporter mouse depicting the lack of costaining between (AVP; magenta) and eGFP (green), while also highlighting the presence of AT2R-eGFP fibers/terminals (green) near AVP neurons. C and D, ×63 magnification projection images highlighting the apparent lack of separation between AT2R/eGFP terminals/fibers and AVP neurons of the PVN. This analysis was performed on 4 separate mouse brains (ie, n = 4). 3v, third ventricle. Scale bars, 100 μm (A and B) and 20 μm (C and D).
The origin of the AT2R-eGFP projections into the PVN
In the next set of studies, we exploited the use of the retrograde neuronal tract tracer, FG, to determine the localization of the AT2R-eGFP neurons that send projections into the PVN (Figure 3). Figure 3A depicts a coronal atlas section through the center of the injection site within the PVN and highlights the localization and spread of the FG administration in the 3 mice used for this study. One representative missed injection is also included in this figure and delineated in red. Figure 3B illustrates a representative injection site from one of these mice (mouse number 2). Areas that were examined for colocalization of FG and AT2R-eGFP included the neurons directly surrounding the PVN (peri-PVN), which have previously been determined to exhibit a high degree of colocalization with the GABAergic marker, Gad1 (12), as well as the following regions: the MnPO, the BNST, the LVS, the zona incerta, and the nucleus of the solitary tract. Of these areas, the highest degree of colocalization was observed within the MnPO (Figure 3, C–E) and within the peri-PVN neurons (Figure 3, F–H), suggesting that the predominant source of AT2R-eGFP inputs to the PVN originate from these brain regions. There were also scatterings of AT2R-eGFP/FG-colabeled cells observed in the BNST, LVS, and the zona incerta (data not shown).
Figure 3.

Retrograde neuronal tract tracing to determine the origin of AT2R-eGFP projections into the PVN. AT2R-eGFP reporter mice received the retrograde neuronal tract tracer (FG) into the PVN (unilaterally). After 7 days, mice were perfused, and brains were processed for eGFP and FG IHC. A, Atlas section through the PVN depicting the localization and spread of the FG injection sites in the 3 mice used for these studies, as well as one miss, in which the injection site was localized too ventral but still exhibited the correct A/P and M/L coordinates. B, Low-magnification image of the injection site for mouse 2. C–E, Projection images of the MnPO depicting FG-positive PVN-projecting neurons (magenta [C]), AT2R-eGFP (green [D]), and the merged image (E). Arrows indicate example double-labeled cells. F–H, Projection images of neurons surrounding the PVN depicting FG-positive PVN-projecting neurons (magenta [F]), AT2R-eGFP (green [G]), and the merged image (H). Scale bars: 200 μm (A), 50 μm (B–D and F–H), and 100 μm (E).
Phenotype of AT2R-eGFP neurons in selected regions that provide inputs into the PVN
The MnPO and peri-PVN AT2R-eGFP neurons were assessed using ISH for the GABAergic marker, Gad1, and the glutamatergic marker, vGlut2, in order to further ascertain whether AT2R are positioned to impact excitatory and/or inhibitory neurotransmission onto PVN neurons. These studies revealed that within the MnPO, AT2R-eGFP neurons are exclusively glutamatergic (Figure 4, A–D), whereas those localized to the peri-PVN express the GABAergic marker, Gad1 (Figure 4, E–H), consistent again with the prediction that AT2R are positioned to impact both inhibitory and excitatory transmitter release onto PVN neurons. Also of relevance, the AT2R-eGFP neurons in the BNST and LVS contained exclusively Gad1 mRNA, indicating that the AT2R-eGFP neurons within these areas are exclusively GABAergic (data not shown).
Figure 4.

Phenotype of AT2R-eGFP neurons in selected regions containing glutamatergic or GABAergic AT2R-eGFP inputs into the PVN. Representative coronal sections through (A–D) the MnPO and (E–H) the peri-PVN of brains collected from an AT2R-eGFP mouse depicting eGFP in green and either vGlut2 mRNA (C and D) or Gad1 mRNA (G and H) in magenta. A, A low-magnification image through the MnPO, highlighting the area with a dashed outline. B–D, Projection images through the MnPO depicting AT2R-eGFP in green (B), vGlut2 mRNA in magenta (C), and the merged image (D) demonstrating extensive overlap between AT2R-eGFP neurons and vGlut2 mRNA in the MnPO. E, A low-magnification image through the PVN and surrounding area, highlighting the PVN with a dashed outline. F–H, Projection images through the peri-PVN depicting AT2R-eGFP in green (F), Gad1 mRNA in magenta (G), and the merged image (H) demonstrating extensive overlap between AT2R-eGFP neurons and Gad1 mRNA. These studies were performed on 4 mouse brains (ie, n = 4). Scale bars: 200 μm (A), 50 μm (B–D and F–H), and 100 μm (E).
General electrophysiological properties of AT2R-eGFP cells
To determine the functional relevance of AT2R expressed in peri-PVN GABAergic neurons, we obtained whole-cell patch clamp recordings from 16 identified AT2R-eGFP neurons located within the peri-PVN area (see Figure 5 for representative samples). Recorded AT2R-eGFP neurons had a mean resting membrane potential of −56.8 ± 2.4 mV, a mean input resistance of 847.8 ± 124.8 MΩ and action potentials larger than 60 mV (range, 60–92 mV). Upon membrane depolarization, AT2R-eGFP neurons displayed an irregular firing pattern, characterized by action potential clustering (see representative example in figure 7 below).
Figure 5.
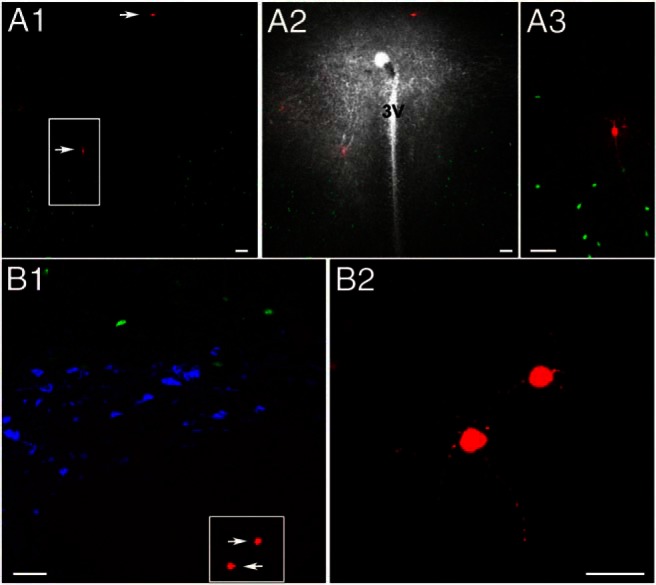
Representative samples of patched AT2R-eGFP neurons surrounding the PVN. A1, Coronal section through the PVN showing AT2R-eGFP neurons (green), 2 of which were patched and intracellularly labeled with Alexa Fluor 555 (arrows). A2, Same as in A1, with a superimposed dark field image to better show the distribution of fluorescent neurons with respect to the PVN. A3, The squared region in A1 is shown at an expanded scale. B1, Another representative example showing AT2R-eGFP neurons (green), OT or AVP-immunoreactive cells (blue), and patched AT2R-eGFP neurons that were intracellularly labeled with Alexa Fluor 555 (arrows). B2, The squared region in B1 is shown at an expanded scale. 3V, third ventricle. Scale bars, 50 μm (A1–A3 and B1) and 20 μm (B2).
AT2R-eGFP patched neurons displayed a mostly linear current/voltage relationship between membrane potentials of −65 to −100 mV (n = 16), whereas in a few cases (31%) a slight time-dependent inward rectification, displayed as a characteristic sag in the voltage trajectory, was observed between −90 and −110 mV. At the end of hyperpolarizing steps (Figure 6A, arrow), or in response to depolarizing steps while holding neurons at hyperpolarized membrane potentials (∼−80 mV) (data not shown), a low-threshold spike with overriding actions potential was observed (n = 16).
Figure 6.

Electrophysiological properties of AT2R-eGFP neurons. A, Representative trace obtained from an AT2R-eGFP neuron showing membrane potential changes in response to hyperpolarizing current steps of increasing magnitude (Δ 0.5 pA). Below is a current-voltage (I/V) plot obtained at the beginning (filled circle) and end (empty square) of the hyperpolarizing step. Note the time-dependent inward rectification observed at hyperpolarized membrane potentials (−90 to −110 mV) and the rebound low-threshold depolarization with overriding action potentials at the end of the hyperpolarizing step (arrow). B, Representative traces showing evoked spikes in response to depolarizing pulses of increased magnitude (Δ 0.5 pA, 800 ms) or increased duration (C, Δ 150 ms, 5 pA, n = 4). D, Plot of mean interevent interval as a function of the action potential number obtained from protocol used in B, in response to maximum current injection used (n = 4). E, Plot of mean number of evoked action potentials as a function of current injection, from protocol used in B (800 ms, n = 5). F, Plot of mean number of evoked action potentials as a function of pulse duration obtained from protocol used in C, in response to maximum current injection used (n = 4). Bars, SEM.
To characterize the input-output properties of AT2R-eGFP neurons, a subset of neurons (n = 5) were subjected to depolarizing current steps of increasing magnitude or duration. As shown in Figure 6, the number of action potentials progressively increased in a relatively linear manner as a function of the current injection magnitude (0.5–5 pA) (Figure 6, B and E) or duration (150–1500 ms) (Figure 6, C and F). Moreover, the interspike intervals remained relatively constant during repetitive stimulation (mean interspike interval at the maximum current injection, 50.9 ± 3.5 ms; n = 4) (Figure 6D), indicative of lack of spike frequency adaptation.
AT2R activation stimulates firing activity in AT2R-eGFP neurons in the peri-PVN area
To evaluate the effect of AT2R activation on the activity of peri-PVN AT2R-eGFP neurons, slices were exposed to a single bolus application of the AT2R selective agonist compound 21 (C21) (100nM, 0.5 mL) (12), and measurements of changes in firing rate and membrane potential were obtained. As shown in Figure 7, C21 increased the firing activity of the majority (81%, n = 13/16) of AT2R-eGFP neurons (firing rate, basal 0.9 ± 0.2 Hz vs C21 4.1 ± 1 Hz; P < .005).
Figure 7.

Activation of AT2R increases the firing activity of AT2R-eGFP cells in the PVN. A, Representative example showing that a transient bolus of C21 (100nM) increased the firing activity of an AT2R-eGFP neuron. Samples of action potential clustering are indicated with horizontal lines on top. Lower traces show representative segments of firing at an expanded time scale. B, Summary data showing mean firing frequency before and after C21 application. Bars, SEM; **, P < .01.
AT2R activation increases GABAergic synaptic activity in eGFP-AVP neurons of the PVN
Given that AT2R-eGFP neurons near the PVN are primarily GABAergic (12), and that AT2R activation increased their firing activity (Figure 7), we assessed whether this effect resulted in an increase in GABAergic synaptic activity in AVP neurons of the PVN. To this end, we monitored spontaneous GABAA-mediated IPSCs in identified eGFP-AVP neurons. As shown in Figure 8, C21 (bolus, 100nM) increased the frequency of GABAA IPSCs (basal 2.4 ± 0.7 Hz vs C21 3.2 ± 0.8 Hz; P < .005) in most of the recorded AVP neurons (79%, n = 11/14), resulting in a leftward shift in the IPSC interevent interval cumulative distribution histogram (see sample in Figure 8D). Mean IPSCs amplitude on the other hand was not significantly affected (P > .9).
Figure 8.

Activation of AT2R increases GABAergic synaptic activity in PVN eGFP-AVP neurons. A, Representative trace of IPSCs in voltage-clamp mode (holding potential, −70mV) of a PVN eGFP-AVP neuron before and after a transient bolus of C21 (arrow). B, Representative recording segments of IPSCs before and after C21 application are shown at an expanded time scale visualization. C, Summary plot of mean IPSC frequency vs time from the example shown in A (time bin, 20). D, Cumulative histograms of interevent interval (left) and amplitude (right) of GABAA IPSCs before and after C21 application. E, Summary data of mean frequency and amplitude of GABAA IPSCs in eGFP-AVP neurons before and after C21 exposure. F, Summary data of mean GABAA IPSCs frequency in eGFP-AVP neurons before and after C21 in the presence of TTX (0.5μM). Bars, SEM; **, P < .01.
To determine whether C21's effect on PVN eGFP-AVP GABAergic synaptic activity was action potential-dependent, experiments were repeated in the presence of 0.5μM tetrodotoxin (TTX). Under these conditions, none of the recorded AVP neurons (n = 5) showed changes in either the frequency (basal, 4.3 ± 1.5 Hz vs C21, 3.5 ± 1.5 Hz; P > .09) (Figure 8F), or the amplitude (P > .5) (data not shown) of the GABAA-mediated IPSCs.
Impact of icv AT2R activation using C21 on AVP secretion in vivo
Based on previously published studies examining the impact of AT2R on AVP secretion (30–32), as well as the above evidence that AT2R are positioned to negatively regulate AVP neurons, we predicted that chronic central AT2R activation in vivo, would attenuate baseline systemic AVP. Consistent with this prediction, chronic icv C21 administration (7.5 ng/kg · h for 1 wk) led to a significant reduction in plasma AVP levels (Figure 9), again, consistent with an inhibitory influence of the AT2R over AVP secretion. Of relevance, this dose of C21 did not impact plasma osmolality (C21, 314.3 ± 1.28 vs CON, 316.6 ± 0.97; n = 7/group), body mass (C21, 26.9 ± 0.55 g vs CON, 27.5 ± 0.64 g; n = 9/group), mean daily food intake (C21, 3.5 ± 0.39 g/d vs CON, 3.7 ± 0.46 g/d standard chow; n = 9/group), or water intake (C21, 3.9 ± 0.56 mL/d vs CON, 4.1 ± 0.65 mL/d; n = 9/group) relative to vehicle-treated control mice.
Figure 9.

Chronic icv C21 reduces baseline plasma AVP levels. Baseline plasma AVP levels in C57BL/6 mice after receiving C21 or vehicle (CON) icv for 7 days using osmotic minipumps. Bars, SEM; *, P < .05; n = 19 per group.
Discussion
Ang-II acts at AT1R to stimulate AVP secretion (1), which influences hydromineral balance and cardiovascular function by promoting the reabsorption of water in the kidneys and eliciting vasoconstriction. Although there are many lines of evidence suggesting that AT2R largely opposes AT1R activation, the mechanisms underlying this apparent opposition within the brain have largely been unexplored, as has AT2R's influence over AVP secretion. There has been speculation that AT1R and AT2R stimulate opposing intracellular signaling cascades within the same neurons; however, evidence that these receptors are localized to the same cells within the brain is lacking. In fact, previous studies in the AT2R-eGFP reporter mouse indicate that AT1R and AT2R are largely localized to separate populations of neurons, and that AT2R-eGFP neurons surrounding the PVN do not contain AT1R (12). In the present study, we took advantage of the recently characterized AT2R-eGFP reporter mouse to determine the localization of the AT2R neurons relative to AVP neurons within the PVN. We then used the selective AT2R agonist, C21, to determine the impact of the activation of this receptor on the activity of both AT2R-eGFP neurons that project to the PVN and on inhibitory neurotransmitter release onto these AVP neurons. The key findings are that AT2R expressed on GABAergic interneurons residing in the peri-PVN region synapse onto AVP neurons within the PVN and activation of these AT2R increases GABAergic synaptic activity, resulting in enhanced inhibitory neurotransmitter release onto AVP neurons and reduced baseline AVP levels.
Elevations in brain Ang-II lead to activation of AVP neurons causing a rise in systemic AVP levels that can be attenuated by administration of AT1R blockers either via the intracerebroventricular route or specifically within magnocellular neuron containing areas of the brain (33–35). Further, several recent studies have indicated that AVP may play an important role in renin angiotensin system-dependent hypertension (36). Based on data from BAC transgenic reporter mice, it is unlikely that magnocellular neurons of the PVN (or supraoptic nucleus) contain AT1R or AT2R (12, 37), and the impact of Ang-II on AVP secretion may therefore be mediated by Ang-II receptor-positive neural connections arising from upstream brain nuclei, such as the organum vasculosum of the lamina terminalis and subfornical organ (38, 39). Although the stimulatory effects of Ang-II on AVP secretion are likely mediated by the AT1R (34, 35, 40), several lines of evidence support the notion that activation of AT2R acts in opposition to this neurosecretory effect. For example, whole-body genetic deletion or pharmacological blockade of AT2R (using PD123219) in mice augment Ang-II induced AVP release, reflected by increased plasma AVP levels (31, 32) and decreased pituitary AVP content (30). That being said, the therapeutic utility of AT2R agonists has only recently started to be evaluated in this regard.
It is well established that GABA is a dominant inhibitory neurotransmitter in the hypothalamus (41), and that GABAergic inputs to the PVN arise from various intrahypothalamic regions, including the MnPO and the peri-PVN area (42–45). However, whether these inhibitory inputs, particularly those impinging on AVP neurons, express AT2R is at present unknown. Moreover, whether activation of AT2R in these terminals would impact GABAergic function, neuronal activity and release onto AVP neurons is also unknown. Thus, one of the critical questions addressed in the neuroanatomical studies presented here was whether AT2R are anatomically positioned to influence GABAergic inhibitory neurotransmitter release within the PVN. Based on our previous data indicating that AT2R are localized to GABAergic neurons and to brain regions that are known to exert inhibitory control over PVN neurons (46), we hypothesized AT2R-positive connections within the PVN would be mostly GABAergic. Consistent with this prediction, Gad1 mRNA and AT2R-eGFP were indeed colocalized in the neurons that directly surround the PVN and project to the PVN. The positioning of AT2R-eGFP to inhibitory neurons that project to the PVN, however, was not exclusive as there was also a prevalence of AT2R-eGFP localization to excitatory glutamatergic inputs to the PVN, including MnPO neurons that were exclusively glutamatergic. Thus, although the AT2R-eGFP neurons surrounding the PVN are indeed positioned to influence inhibitory (GABAergic) neurotransmission onto AVP neurons, the AT2R-positive MnPO to PVN connection may exert an excitatory influence over AVP secretion.
Subsequent studies focused on how AT2R agonism with C21 influenced the activity of AT2R-eGFP neurons residing in the peri-PVN, and how this in turn, affected the activity of AVP neurons within the PVN. Of relevance, several studies have used either the AT2R antagonist, PD123319, or AT2R knockout mice to demonstrate that, at the doses used in the present study, C21 exerts AT2R-specific effects (47–50). Initial patch-clamp electrophysiological studies revealed that AT2R-expressing neurons in the peri-PVN shared similar general electrophysiological properties to previously described hypothalamic interneurons, including GABAergic ones, such as the expression of a rebound low-threshold spike and a mostly linear current/voltage relationship (51, 52). Importantly, we found that activation of AT2R with the selective agonist C21 excites AT2R-eGFP neurons in the peri-PVN area, evoking and/or increasing their firing discharge. These findings are in agreement with previously published studies that have indicated a stimulatory effect of AT2R activation on the firing rates of neurons, but are in contrast to some previous results indicating that AT2R activation can be hyperpolarizing (53–57). It is important to note however, that these previous studies have largely been conducted in cultured neurons, and the impact of AT2R activation in a neural network that involves the PVN had not previously been assessed.
In order to determine whether the AT2R-mediated increased firing activity of GABAergic interneurons residing in the peri-PVN elicited a change in GABAergic neurotransmission released onto AVP neurons, we directly monitored GABAA receptor-mediated IPSCs in identified AVP neurons of the PVN. We found that C21 increased the frequency of GABA IPSCs (without altering IPSC amplitude) in AVP neurons and that this effect was completely eliminated when action potentials were blocked with the Na+ channel blocker TTX. These results are consistent with the notion that AT2R activation increases firing discharge of GABAergic interneurons, resulting in an action potential-dependent increase in GABAergic synaptic activity in targeted AVP neurons within the PVN. These results, in conjunction with our neuroanatomical studies, provide strong evidence for functional connectivity between AT2R-expressing GABAergic interneurons in the peri-PVN region, and AVP neurons within the PVN.
It is worth noting that previous studies have reported an AT1R-mediated inhibition of GABA IPSCs in RVLM-projecting PVN neurons (58, 59). In addition to these global opposing actions between AT2R and AT1R on GABAergic synaptic function within the PVN, there are important mechanistic differences as well. Although the AT2R-mediated enhancement of GABA function was dependent on evoking firing activity in GABAergic interneurons (ie, TTX dependent), the AT1R-mediated inhibition was independent of their firing activity (ie, TTX independent), and involved increases in IPSC miniature frequency but not amplitude (ie, presynaptic effect). Taken together, these results support a differential neuronal compartmentalization of AT2R and AT1R, with the former located in the soma of the GABAergic interneurons (this study), and the latter on their presynaptic axonal terminals within the PVN (59).
Based on the present results, along with previously published studies examining the impact of AT2R on AVP secretion (30–32), we predicted that chronic central AT2R activation in vivo, would negatively regulate AVP secretion. As expected, we found that chronic icv C21 administration reduced baseline plasma AVP levels. An important caveat to take into account when interpreting these in vivo results, however, is that our experimental approach results in the activation of AT2R throughout the brain and not specifically within the PVN. Thus, although our in vitro studies support that AT2R expressed in peri-PVN GABAergic interneurons are positioned to negatively regulate the activity of AVP neurons, the present studies do not entirely support or refute the hypothesis that the in vivo effects were indeed mediated by AT2R inputs to AVP neurons in the PVN. Rather, they indicate that brain AT2R activation reduces plasma AVP levels. Another important point to note is that although the AVP levels values presented here are higher than expected based on previous studies measuring plasma AVP concentration in rats (60), these values are comparable with, or slightly lower than, studies measuring plasma AVP in mice (33, 61).
Collectively, these results are consistent with the overall hypothesis that functional AT2R are positioned to regulate inhibitory neurotransmission onto AVP neurons. That being said, the present studies also revealed that AT2R are additionally localized to glutamatergic inputs. The inference is perhaps that AT2R are positioned to both negatively and positively regulate the activity of AVP neurons and it is possible that the impact that the AT2R makes on AVP secretion is in large part dependent on the physiological condition, and which population of AT2R inputs become activated. As a consequence, the impact of activation of AT2R throughout the entirety of the brain on AVP secretion becomes less predictable. In this regard, it is possible that although AT2R within the peri-PVN likely inhibit AVP neurons, AT2R with glutamatergic inputs into the PVN (ie, MnPO) may excite AVP neurons. Therefore, the balance between these inputs may predict the impact of AT2R activation on AVP secretion.
In order to effectively be able to exploit the inhibitory influence of AT2R over fluid/electrolyte balance and BP regulation in future therapeutics, it is essential to develop a thorough understanding of the neural pathways and systems that AT2R impact. The present studies collectively demonstrate that functional AT2R are situated such that they can exert an inhibitory influence over AVP neurons within the PVN. These findings have direct implications, not only in using AT2R agonist in the alleviation of AVP-dependent hypertension, but also in disorders of AVP secretion. Future studies will determine how best to exploit this pathway.
Acknowledgments
This work was supported by National Institutes of Health Grants F32-HL-116074 (to A.D.d.K.), K99HL125805 (to A.D.d.K.), HL-076803 (to C.S.), HL-093186 (to C.S.), HL-112225 (to J.E.S.), HL-090948 (to J.E.S.), HL-096830 (to E.G.K.), and HL-122494 (to E.G.K.).
Disclosure Summary: The authors have nothing to disclose.
Footnotes
- Ang-II
- angiotensin-II
- AT1R
- angiotensin type-1 receptor
- AT2R
- angiotensin type-2 receptor
- AVP
- vasopressin
- BAC
- bacterial artificial chromosome
- BNST
- bed nucleus of the stria terminalis
- BP
- blood pressure
- C21
- compound 21
- eGFP
- enhanced green fluorescent protein
- FG
- FluoroGold
- GABA
- γ-aminobutyric acid
- Gad1
- glutamic acid decarboxylase-1
- icv
- intracerebroventricular
- IHC
- immunohistochemistry
- IPSC
- inhibitory postsynaptic current
- ISH
- in situ hybridization
- KPBS
- potassium phosphate buffered saline
- LVS
- lateral ventral septum
- MnPO
- median preoptic nucleus
- NP
- neurophysin
- OT
- oxytocin
- PVN
- paraventricular nucleus of the hypothalamus
- ROI
- region of interest
- RVLM
- rostral ventro-lateral medulla
- TTX
- tetrodotoxin
- vGlut2
- vesicular glutamate transporter-2.
References
- 1. Toney GM, Porter JP. Functional role of brain AT1 and AT2 receptors in the central angiotensin II pressor response. Brain Res. 1993;603:57. [DOI] [PubMed] [Google Scholar]
- 2. Suzuki Y, Ruiz-Ortega M, Lorenzo O, Ruperez M, Esteban V, Egido J. Inflammation and angiotensin II. Int J Biochem Cell Biol. 2003;35:881. [DOI] [PubMed] [Google Scholar]
- 3. Shi P, Diez-Freire C, Jun JY, et al. Brain microglial cytokines in neurogenic hypertension. Hypertension. 2010;56:297–303. [DOI] [PMC free article] [PubMed] [Google Scholar]
- 4. Toney GM, Pedrino GR, Fink GD, Osborn JW. Does enhanced respiratory-sympathetic coupling contribute to peripheral neural mechanisms of angiotensin II-salt hypertension? Exp Physiol. 2010;95:587–594. [DOI] [PMC free article] [PubMed] [Google Scholar]
- 5. de Kloet AD, Krause EG, Scott KA, et al. Central angiotensin-II has catabolic action at white and brown adipose tissue. Am J Physiol Endocrinol Metab. 2011;301:E1081–E1091. [DOI] [PMC free article] [PubMed] [Google Scholar]
- 6. Krause EG, de Kloet AD, Scott KA, et al. Blood-borne angiotensin II acts in the brain to influence behavioral and endocrine responses to psychogenic stress. J Neurosci. 2011;31:15009–15015. [DOI] [PMC free article] [PubMed] [Google Scholar]
- 7. Navalkar S, Parthasarathy S, Santanam N, Khan BV. Irbesartan, an angiotensin type 1 receptor inhibitor, regulates markers of inflammation in patients with premature atherosclerosis. J Am Coll Cardiol. 2001;37:440. [DOI] [PubMed] [Google Scholar]
- 8. Ando H, Zhou J, Macova M, Imboden H, Saavedra JM. Angiotensin II AT1 receptor blockade reverses pathological hypertrophy and inflammation in brain microvessels of spontaneously hypertensive rats. Stroke. 2004;35:1726–1731. [DOI] [PubMed] [Google Scholar]
- 9. Saavedra JM. Angiotensin II AT(1) receptor blockers ameliorate inflammatory stress: a beneficial effect for the treatment of brain disorders. Cell Mol Neurobiol. 2012;32:667–681. [DOI] [PMC free article] [PubMed] [Google Scholar]
- 10. Shimizu H, Miyoshi M, Matsumoto K, Goto O, Imoto T, Watanabe T. The effect of central injection of angiotensin-converting enzyme inhibitor and the angiotensin type 1 receptor antagonist on the induction by lipopolysaccharide of fever and brain interleukin-1Î2 response in rats. J Pharmacol Exp Ther. 2004;308:865–873. [DOI] [PubMed] [Google Scholar]
- 11. Sanchez-Lemus E, Murakami Y, Larrayoz-Roldan IM, et al. Angiotensin II AT1 receptor blockade decreases lipopolysaccharide-induced inflammation in the rat adrenal gland. Endocrinology. 2008;149:5177–5188. [DOI] [PMC free article] [PubMed] [Google Scholar]
- 12. de Kloet AD, Wang L, Ludin JA, et al. Reporter mouse strain provides a novel look at angiotensin type-2 receptor distribution in the central nervous system. Brain Struct Funct. 2016;221:891–912. [DOI] [PMC free article] [PubMed] [Google Scholar]
- 13. Lenkei Z, Palkovits M, Corvol P, Llorens-Cortès C. Expression of angiotensin type-1 (AT1) and type-2 (AT2) receptor mRNAs in the adult rat brain: a functional neuroanatomical review. Front Neuroendocrinol. 1997;18:383. [DOI] [PubMed] [Google Scholar]
- 14. Tucker DC, Saper CB. Specificity of spinal projections from hypothalamic and brainstem areas which innervate sympathetic preganglionic neurons. Brain Res. 1985;360:159–164. [DOI] [PubMed] [Google Scholar]
- 15. Coote JH, Yang Z, Pyner S, Deering J. Control of sympathetic outflows by the hypothalamic paraventricular nucleus. Clin Exp Pharmacol Physiol. 1998;25:461–463. [DOI] [PubMed] [Google Scholar]
- 16. Cato MJ, Toney GM. Angiotensin II excites paraventricular nucleus neurons that innervate the rostral ventrolateral medulla: an in vitro patch-clamp study in brain slices. J Neurophysiol. 2005;93:403–413. [DOI] [PMC free article] [PubMed] [Google Scholar]
- 17. Swanson LW, Sawchenko PE. Paraventricular nucleus: a site for the integration of neuroendocrine and autonomic mechanisms. Neuroendocrinology. 1980;31:410–417. [DOI] [PubMed] [Google Scholar]
- 18. Häuser W, Jöhren O, Saavedra JM. Characterization and distribution of angiotensin II receptor subtypes in the mouse brain. Eur J Pharmacol. 1998;348:101–114. [DOI] [PubMed] [Google Scholar]
- 19. Smith JA, Wang L, Hiller H, Taylor CT, de Kloet AD, Krause EG. Acute hypernatremia promotes anxiolysis and attenuates stress-induced activation of the hypothalamic-pituitary-adrenal axis in male mice. Physiol Behav. 2014;136:91–96. [DOI] [PMC free article] [PubMed] [Google Scholar]
- 20. Ueta Y, Fujihara H, Serino R, et al. Transgenic expression of enhanced green fluorescent protein enables direct visualization for physiological studies of vasopressin neurons and isolated nerve terminals of the rat. Endocrinology. 2005;146:406–413. [DOI] [PubMed] [Google Scholar]
- 21. Kádár A, Sánchez E, Wittmann G, et al. Distribution of hypophysiotropic thyrotropin-releasing hormone (TRH)-synthesizing neurons in the hypothalamic paraventricular nucleus of the mouse. J Comp Neurol. 2010;518:3948–3961. [DOI] [PMC free article] [PubMed] [Google Scholar]
- 22. Jessberger S, Toni N, Clemenson GD, Jr, Ray J, Gage FH. Directed differentiation of hippocampal stem/progenitor cells in the adult brain. Nat Neurosci. 2008;11:888–893. [DOI] [PMC free article] [PubMed] [Google Scholar]
- 23. Ben-Barak Y, Russell JT, Whitnall MH, Ozato K, Gainer H. Neurophysin in the hypothalamo-neurohypophysial system. I. Production and characterization of monoclonal antibodies. J Neurosci. 1985;5:81–97. [DOI] [PMC free article] [PubMed] [Google Scholar]
- 24. Dimitrov EL, Yanagawa Y, Usdin TB. Forebrain GABAergic projections to locus coeruleus in mouse. J Comp Neurol. 2013;521:2373–2397. [DOI] [PMC free article] [PubMed] [Google Scholar]
- 25. Franklin KBJ, Paxinos G. The Mouse Brain: In Stereotaxic Coordinates. 3rd ed New York, NY: Elsevier; 2008. [Google Scholar]
- 26. Potapenko ES, Biancardi VC, Florschutz RM, Ryu PD, Stern JE. Inhibitory-excitatory synaptic balance is shifted toward increased excitation in magnocellular neurosecretory cells of heart failure rats. J Neurophysiol. 2011;106:1545–1557. [DOI] [PMC free article] [PubMed] [Google Scholar]
- 27. Stern JE. Electrophysiological and morphological properties of pre-autonomic neurones in the rat hypothalamic paraventricular nucleus. J Physiol. 2001;537:161–177. [DOI] [PMC free article] [PubMed] [Google Scholar]
- 28. Park JB, Skalska S, Stern JE. Characterization of a novel tonic γ-aminobutyric acidA receptor-mediated inhibition in magnocellular neurosecretory neurons and its modulation by glia. Endocrinology. 2006;147:3746–3760. [DOI] [PubMed] [Google Scholar]
- 29. Wang L, de Kloet AD, Pati D, et al. Increasing brain angiotensin converting enzyme 2 activity decreases anxiety-like behavior in male mice by activating central Mas receptors. Neuropharmacology. 2016;105:114–123. [DOI] [PMC free article] [PubMed] [Google Scholar]
- 30. Macova M, Pavel J, Saavedra JM. A peripherally administered, centrally acting angiotensin II AT2 antagonist selectively increases brain AT1 receptors and decreases brain tyrosine hydroxylase transcription, pituitary vasopressin and ACTH. Brain Res. 2009;1250:130–140. [DOI] [PMC free article] [PubMed] [Google Scholar]
- 31. Li Z, Iwai M, Wu L, et al. Role of AT2 receptor in the brain in regulation of blood pressure and water intake. Am J Physiol Heart Circ Physiol. 2003;284:H116–H121. [DOI] [PubMed] [Google Scholar]
- 32. Höhle S, Spitznagel H, Rascher W, Culman J, Unger T. Angiotensin AT1 receptor-mediated vasopressin release and drinking are potentiated by an AT2 receptor antagonist. Eur J Pharmacol. 1995;275:277–282. [DOI] [PubMed] [Google Scholar]
- 33. Zini S, Fournie-Zaluski MC, Chauvel E, Roques BP, Corvol P, Llorens-Cortes C. Identification of metabolic pathways of brain angiotensin II and III using specific aminopeptidase inhibitors: predominant role of angiotensin III in the control of vasopressin release. Proc Natl Acad Sci USA. 1996;93:11968–11973. [DOI] [PMC free article] [PubMed] [Google Scholar]
- 34. Zhu Q, Guo SY, Gong S, Yin QZ, Hisamitsu T, Jiang XH. Losartan blocks the excitatory effect of peripheral hypertonic stimulation on vasopressinergic neurons in hypothalamic paraventricular nucleus in rats: electrophysiological and immunocytochemical evidence. Neurosci Lett. 2005;380:12–16. [DOI] [PubMed] [Google Scholar]
- 35. Veltmar A, Culman J, Qadri F, Rascher W, Unger T. Involvement of adrenergic and angiotensinergic receptors in the paraventricular nucleus in the angiotensin II-induced vasopressin release. J Pharmacol Exp Ther. 1992;263:1253–1260. [PubMed] [Google Scholar]
- 36. Littlejohn NK, Siel RB, Jr, Ketsawatsomkron P, et al. Hypertension in mice with transgenic activation of the brain renin-angiotensin system is vasopressin dependent. Am J Physiol Regul Integr Comp Physiol. 2013;304:R818–R828. [DOI] [PMC free article] [PubMed] [Google Scholar]
- 37. Gonzalez AD, Wang G, Waters EM, et al. Distribution of angiotensin type 1a receptor-containing cells in the brains of bacterial artificial chromosome transgenic mice. Neuroscience. 2012;226:489–509. [DOI] [PMC free article] [PubMed] [Google Scholar]
- 38. Thrasher TN, Keil LC. Regulation of drinking and vasopressin secretion: role of organum vasculosum laminae terminalis. Am J Physiol. 1987;253:R108–R120. [DOI] [PubMed] [Google Scholar]
- 39. Ferguson AV, Renaud LP. Systemic angiotensin acts at subfornical organ to facilitate activity of neurohypophysial neurons. Am J Physiol. 1986;251:R712–R717. [DOI] [PubMed] [Google Scholar]
- 40. Chiodera P, Volpi R, Caiazza A, Giuliani N, Magotti MG, Coiro V. Arginine vasopressin and oxytocin responses to angiotensin II are mediated by AT1 receptor subtype in normal men. Metabolism. 1998;47:893–896. [DOI] [PubMed] [Google Scholar]
- 41. Decavel C, Van den Pol AN. GABA: a dominant neurotransmitter in the hypothalamus. J Comp Neurol. 1990;302:1019–1037. [DOI] [PubMed] [Google Scholar]
- 42. Ferguson AV, Latchford KJ. Local circuitry regulates the excitability of rat neurohypophysial neurones. Exp Physiol. 2000;85 Spec No:153S–161S. [DOI] [PubMed] [Google Scholar]
- 43. Tasker JG, Dudek FE. Local inhibitory synaptic inputs to neurones of the paraventricular nucleus in slices of rat hypothalamus. J Physiol. 1993;469:179–192. [DOI] [PMC free article] [PubMed] [Google Scholar]
- 44. Roland BL, Sawchenko PE. Local origins of some GABAergic projections to the paraventricular and supraoptic nuclei of the hypothalamus in the rat. J Comp Neurol. 1993;332:123–143. [DOI] [PubMed] [Google Scholar]
- 45. Boudaba C, Szabó K, Tasker JG. Physiological mapping of local inhibitory inputs to the hypothalamic paraventricular nucleus. J Neurosci. 1996;16:7151–7160. [DOI] [PMC free article] [PubMed] [Google Scholar]
- 46. Ulrich-Lai YM, Herman JP. Neural regulation of endocrine and autonomic stress responses. Nat Rev Neurosci. 2009;10:397–409. [DOI] [PMC free article] [PubMed] [Google Scholar]
- 47. Bosnyak S, Welungoda IK, Hallberg A, Alterman M, Widdop RE, Jones ES. Stimulation of angiotensin AT2 receptors by the non-peptide agonist, compound 21, evokes vasodepressor effects in conscious spontaneously hypertensive rats. Br J Pharmacol. 2010;159:709–716. [DOI] [PMC free article] [PubMed] [Google Scholar]
- 48. Joseph JP, Mecca AP, Regenhardt RW, et al. The angiotensin type 2 receptor agonist compound 21 elicits cerebroprotection in endothelin-1 induced ischemic stroke. Neuropharmacology. 2014;81:134–141. [DOI] [PMC free article] [PubMed] [Google Scholar]
- 49. Min LJ, Mogi M, Tsukuda K, et al. Direct stimulation of angiotensin II type 2 receptor initiated after stroke ameliorates ischemic brain damage. Am J Hypertens. 2014;27:1036–1044. [DOI] [PubMed] [Google Scholar]
- 50. Brouwers S, Smolders I, Wainford RD, Dupont AG. Hypotensive and sympathoinhibitory responses to selective central AT2 receptor stimulation in spontaneously hypertensive rats. Clin Sci (London). 2015;129:81–92. [DOI] [PMC free article] [PubMed] [Google Scholar]
- 51. Armstrong WE, Stern JE. Electrophysiological and morphological characteristics of neurons in perinuclear zone of supraoptic nucleus. J Neurophysiol. 1997;78:2427–2437. [DOI] [PubMed] [Google Scholar]
- 52. Wang L, Ennis M, Szabó G, Armstrong WE. Characteristics of GABAergic and cholinergic neurons in perinuclear zone of mouse supraoptic nucleus. J Neurophysiol. 2015;113:754–767. [DOI] [PMC free article] [PubMed] [Google Scholar]
- 53. Gao J, Zhang H, Le KD, Chao J, Gao L. Activation of central angiotensin type 2 receptors suppresses norepinephrine excretion and blood pressure in conscious rats. Am J Hypertens. 2011;24:724–730. [DOI] [PMC free article] [PubMed] [Google Scholar]
- 54. Kang J, Posner P, Sumners C. Angiotensin II type 2 receptor stimulation of neuronal K+ currents involves an inhibitory GTP binding protein. Am J Physiol. 1994;267:C1389–C1397. [DOI] [PubMed] [Google Scholar]
- 55. Kang J, Richards EM, Posner P, Sumners C. Modulation of the delayed rectifier K+ current in neurons by an angiotensin II type 2 receptor fragment. Am J Physiol. 1995;268:C278–C282. [DOI] [PubMed] [Google Scholar]
- 56. Kang J, Sumners C, Posner P. Angiotensin II type 2 receptor-modulated changes in potassium currents in cultured neurons. Am J Physiol. 1993;265:C607–C616. [DOI] [PubMed] [Google Scholar]
- 57. Zhu M, Sumners C, Gelband CH, Posner P. Chronotropic effect of angiotensin II via type 2 receptors in rat brain neurons. J Neurophysiol. 2001;85:2177–2183. [DOI] [PubMed] [Google Scholar]
- 58. Li DP, Pan HL. Angiotensin II attenuates synaptic GABA release and excites paraventricular-rostral ventrolateral medulla output neurons. J Pharmacol Exp Ther. 2005;313:1035–1045. [DOI] [PubMed] [Google Scholar]
- 59. Chen Q, Pan HL. Signaling mechanisms of angiotensin II-induced attenuation of GABAergic input to hypothalamic presympathetic neurons. J Neurophysiol. 2007;97:3279–3287. [DOI] [PubMed] [Google Scholar]
- 60. Krause EG, de Kloet AD, Flak JN, et al. Hydration state controls stress responsiveness and social behavior. J Neurosci. 2011;31:5470–5476. [DOI] [PMC free article] [PubMed] [Google Scholar]
- 61. Oliverio MI, Delnomdedieu M, Best CF, et al. Abnormal water metabolism in mice lacking the type 1A receptor for ANG II. Am J Physiol Renal Physiol. 2000;278:F75–F82. [DOI] [PubMed] [Google Scholar]