

Abstract
Alcohol-induced intestinal hyperpermeability (AIHP) is a known risk factor for alcoholic liver disease (ALD), but only 20–30% of heavy alcoholics develop AIHP and ALD. The hypothesis of this study is that circadian misalignment would promote AIHP. We studied two groups of healthy subjects on a stable work schedule for 3 mo [day workers (DW) and night workers (NW)]. Subjects underwent two circadian phase assessments with sugar challenge to access intestinal permeability between which they drank 0.5 g/kg alcohol daily for 7 days. Sleep architecture by actigraphy did not differ at baseline or after alcohol between either group. After alcohol, the dim light melatonin onset (DLMO) in the DW group did not change significantly, but in the NW group there was a significant 2-h phase delay. Both the NW and DW groups had no change in small bowel permeability with alcohol, but only in the NW group was there an increase in colonic and whole gut permeability. A lower area under the curve of melatonin inversely correlated with increased colonic permeability. Alcohol also altered peripheral clock gene amplitude of peripheral blood mononuclear cells in CLOCK, BMAL, PER1, CRY1, and CRY2 in both groups, and inflammatory markers lipopolysaccharide-binding protein, LPS, and IL-6 had an elevated mesor at baseline in NW vs. DW and became arrhythmic with alcohol consumption. Together, our data suggest that central circadian misalignment is a previously unappreciated risk factor for AIHP and that night workers may be at increased risk for developing liver injury with alcohol consumption.
Keywords: intestinal permeability, alcoholic liver disease, melatonin
alcohol is the most frequently abused drug in the world, and about 9% of the U.S. population meets criteria for alcohol use disorder (AUD) (29). However, the risk for the most serious complication of heavy drinking, alcoholic liver disease (ALD), remains only partially understood. The amount and duration of alcohol consumed appear to be the most important risk factors for the development of ALD with a threshold of over 30 g/day for 10 years associated with an increased risk for cirrhosis (47). An estimated 20–30% of individuals who consume alcohol above this threshold develop ALD, but there does not appear to be a clearly linear dose effect, since certain groups of extremely heavy drinkers (>120 g/day) developed cirrhosis at a low rate (18.5%) (4). Therefore, while epidemiological studies have shown that alcohol is a necessary cofactor to cause clinically significant ALD, other additional cofactors are required.
The most well supported pathogenesis of ALD is that alcohol increases intestinal permeability, which increases gut-derived endotoxin, such as lipopolysaccharide (LPS), in the blood (45), promoting inflammation-mediated hepatocellular damage. Identifying other risk factors for increased intestinal permeability related to alcohol consumption is important to identify individuals at risk for clinically significant ALD and to better understand mechanisms of alcohol-related pathologies like liver injury. The finding that clock genes are present in the epithelial cells of the intestinal tract (14, 40), which make up the intestinal barrier, makes it highly plausible that the disruption of circadian homeostasis could impact the intestinal barrier. For human studies, the best model of chronic circadian misalignment is night shift workers. From data in 2010, 29% of U.S. workers worked an alternate or nonday shift (1), and 15% of workers regularly worked the night shift, which includes 23 million people (23). This enormous prevalence of circadian misalignment is important, since shift work has been linked to breast cancer (12), cardiovascular disease (50), and metabolic syndrome (38). Indeed several gastrointestinal disorders are more common in shift workers who have disrupted circadian rhythms such as peptic ulcer disease (32), colon cancer (21), and irritable bowel syndrome (28). Accordingly, the goals of the current study were to: 1) determine if night workers with central circadian misalignment, as measured by plasma melatonin phase and amplitude over 24 h, had increased alcohol-induced intestinal hyperpermeability (AIHP) compared with day workers after 7 days of alcohol consumption and 2) determine if alcohol differentially impacted the central or peripheral clock in either group.
METHODS
Participants
Participants were recruited through advertisements, posted flyers, or self-referral. All subjects gave written informed consent, and all procedures were approved by the Rush University Institutional Review Board (no. 10012604). Day workers (DW) were healthy subjects (primarily nurses) who had been on a stable work schedule of 0700–1900 of at least three shifts a week for >3 mo and did not fulfill the criteria for AUD per Lifetime Drinking History (LDH) questionnaire (39). Night workers (NW) were healthy subjects on a stable work schedule of 1900-0700 of at least three shifts a week for >3 mo and did not fit criteria for AUD by LDH. All subjects completed blood tests and questionnaires at their initial visit and were excluded if they met any of the following criteria: 1) any history or blood tests consistent with liver disease (liver functions tests >1.5 normal), renal impairment (creatinine >1.5), cardiovascular disease, or diabetes (Hgb-A1c >8); 2) major depression (score ≥15 or any endorsement of suicidal intent on the Beck Depression Inventory) (3); 3) sleep apnea (score high risk ≥2 or more categories on the Berlin Questionnaire) (27); 4) restless leg syndrome consensus criteria according to the International Restless Legs Syndrome Study Group; 5) infection in the previous month, recent history of antibiotic use; or 6) regular use of medications that affect intestinal permeability, intestinal motility, and/or endogenous melatonin, including metoclopramide, nonsteroidal anti-inflammatory drugs, β-blocker, psychotropic medication, and exogenous melatonin products during 4 wk before the study.
Baseline Measures
LDH is a structured interview that is designed to provide a validated measure of alcohol consumption (39). After a baseline questionnaire assessment and blood tests, all subjects were asked to keep their usual sleep schedule for the week before the 24-h circadian phase assessment. All subjects kept a sleep diary, an alcohol diary, and wore a wrist monitor (Spectrum Actiwatch; Phillips) for 7 days before each phase assessment, and the 7 days of alcohol consumption. After the first phase assessment, all subjects were given red wine, a 2013 Bota Box Malbec, alcohol 13.5%, origin Mendoza, Argentina, and instructed to drink 0.5 g of alcohol/kg of body wt each day for the 7 days before the second 24-h phase assessment. For most subjects this meant two to four glasses of wine a day. Subjects were instructed to drink the wine after finishing work and before bedtime.
Melatonin assessment.
Plasma melatonin was collected hourly for 24 h between 1300 and 1200, for a total of 24 samples in the Biological Rhythms Research Lab. Patients were kept in dim light (<5 lux, measured every 2 h with a Minolta TIL-1 light meter), seated in a recliner chair in constant posture. Subjects were given small nutritionally balanced snacks instead of meals during the phase assessment. After 30 min in dim light, a 3-ml blood sample was collected every 60 min. An intravenous line was placed to avoid multiple needle sticks as previously reported. During the session, subjects were kept awake, watched a dim television, or talked to each other. After collection, the samples were centrifuged at 4°C and 1,000 revolutions/min (rpm) for 15 min. The plasma was then frozen and shipped on dry ice to SolidPhase (Portland, ME) using the Bühlmann Direct Plasma Melatonin RIA kit (ALPCO Diagnostics, Windham, NH), which has an analytical sensitivity of 0.2 pg/ml. Interassay variability ranged from 7.9 to 11.7%.
Intestinal permeability measurement.
Each subject ingested 300 ml of liquid containing 7.5 grams of lactulose, 2 grams of mannitol, 40 grams of sucrose, and 2 grams of sucralose. Before ingestion of the sugar probes, each subject was asked to empty his bladder completely. Thereafter, all urine was collected for 24 h in the first 5-h, next 7-h, and last 12-h aliquots. Subjects were not allowed to eat for 4 h before or after the start of the urine collection. Urine volumes were recorded, and aliquots of urine were stored at −80°C until analysis. Measurement of urinary sugars was done by gas chromatography and calculated as percent excretion of oral intake. Five-hour urinary lactulose, mannitol, and lactulose-to-mannitol ratio (L/M) are primarily markers of small bowel permeability, and 24-h urinary sucralose is a marker of total gut permeability, with 13- to 24-h sucralose primarily representing colonic permeability (2). This is due to both sucralose and lactulose being able to permeate through both the small and large intestine (colon). However, sucralose is not fermented by colonic bacteria while ∼75% of lactulose and mannitol are fermented by colonic bacteria (25).
Circadian clock gene expression in peripheral blood mononuclear cells.
Peripheral blood mononuclear cells were isolated every 240 min during the 24-h phase assessment at 1600, 2000, 0000, 0400, 0800, and 1200. For each sample, 10 ml of whole blood were spun through a FICOLL gradient in BD Vacutainer tubes (reference no. 368753) at 2,000 rpm for 20 min at 20°C and stored at −80°C in Trizol reagent (Invitrogen Canada, Burlington, ON). RNA was then extracted, reverse transcribed, and quantified by RT-PCR as previously described. Briefly, with the use of unbiased iScript reverse transcriptase (Bio-Rad, Hercules, CA) quantification of clock genes (CLOCK, BMAL, PER1, PER2, CRY1, and CRY2) was then performed by real-time PCR using SYBR Green (Applied Biosystems, Foster City, CA). Fold change was calculated relative to the average of the two housekeeping genes B-actin and GAPDH by the 2−ΔΔCT method with a calibration sample based on a pooled analysis from all samples from the first day.
Endotoxin and inflammatory cytokine measurement.
Lipopolysaccharide-binding protein (LBP) (ng/ml) was measured in serum using an ELISA kit from Cell Sciences (catalog no. HK315). LPS (EU/ml) was measured in serum using the PYROGENT-5000 assay kit from LONZA (catalog no. N384). IL-6 was measured by the Quantikine high-sensitivity ELISA kit from R&D Systems (catalog no. SS600B) in pictograms per milliliter in plasma.
Statistical Analysis
The area under the curve (AUC) was calculated for each melatonin profile using the trapezoidal method. The dim light melatonin onset (DLMO) was calculated by the “3k” method as the point in time when the melatonin concentration exceeded and remained above the threshold for 1 h as previously reported (49).
For clock genes analysis, a single cosinor method was used to analyze the data over time as previously described (9, 26). The equation for the cosinor fit is a follows:
| (1) |
where M is the mesor (Midline Statistic of Rhythm, a rhythm adjusted mean), A is the amplitude (a measure of half the extent of the variation within the cycle), ϕ is the acrophase (a measure of the time of overall highest value), and τ is the period.
The fit of the model was determined by the residuals of the fitted wave (36). A 24-h period was used for all analysis. A Multivariate Wald test was used to test the null hypothesis that the mesor, amplitude, or acrophase differ by the covariate (alcohol or group). Chi square tests or Mann-Whitney U-test was used to compare the two subject groups' variables and outputs. A Moore paired test was used to compare phase angles of DLMO, and circular plots were computed on Oriana (Kovach Computing Services, Wales, UK). A linear regression analysis was performed to examine the relationship between melatonin (AUC, DLMO) and intestinal permeability. All statistical analyses were two tailed, and statistical significance was determined by using a P < 0.05. For clock gene expression, a small percentage (<5%) of missing or outlier values was imputed by the k-nearest neighbor method. Statistics were performed using SPSS version 19.0 and in R (version 3.8.1) in the cosinor and DMwR package.
RESULTS
Clinical Variables and Actigraphy
A total of 32 subjects was screened for the trial, and 22 participated. The most common reason the subjects did not participate after being screened was they voluntarily withdrew usually because of scheduling conflicts (6), there was an issue with maintaining their intravenous line (2), or they did not drink the wine for the full week as expected in the protocol (2) (Fig. 1). There was no statistical difference between the two groups in terms of age, gender, race, or body mass index (Table 1). There was also no difference in Pittsburgh Sleep Quality Index, Beck's Depression Inventory, or Personal Inventory for Depression and Seasonal Affective Disorder at baseline before beginning the study. In the 22 subjects in either DW or NW, sleep duration, wake after sleep onset, total sleep time, sleep percentage, and fragmentation were not significantly different at baseline or after 7 days of moderate red wine consumption between the two groups (Table 1). Similarly, there was no statistically significant difference between actigraphy calculated sleep parameters by repeated measures in each group before or after moderate alcohol consumption.
Fig. 1.
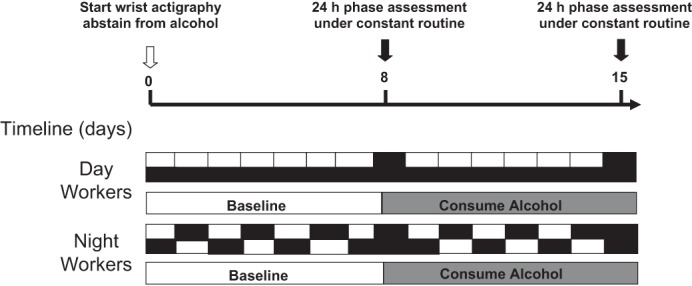
Schematic of the experimental protocol. After obtaining baseline blood tests and questionnaires, subjects wore a wrist actiwatch and were told to abstain from alcohol for 1 wk. A 24-h phase assessment was then done in the Biological Rhythms Lab where subjects were kept under dim light conditions (<5 lux) and constant posture. An iv was inserted to draw hourly plasma melatonin, every 4 h peripheral blood mononuclear cells (PBMCs) for clock gene expression, and a 24-h urine collection after sugar challenge for intestinal permeability. Subjects were then given red wine and told to drink 2–4 glasses of wine a day for ∼0.5 g of alcohol/kg body wt before repeating an identical 24-h phase assessment.
Table 1.
Subject characteristics
| DW (n = 11) |
NW (n = 11) |
||||
|---|---|---|---|---|---|
| Mean | SD | Mean | SD | P | |
| Age, mean | 34.7 | 11.2 | 29.1 | 7.4 | <0.18 |
| Ethnicity | 8 C; 3 AA | 8 C; 2 AA; 1A | NA | ||
| BMI | 27.8 | 7.1 | 24.1 | 4.7 | <0.30 |
| Alcohol consumed, g/kg | 0.45 | 0.1 | 0.48 | 0.1 | <0.87 |
| Actigraphy | |||||
| Baseline | |||||
| Wake after sleep onset, min | 56.0 | 31.0 | 43.7 | 13.3 | <0.85 |
| Total sleep time, min | 373.7 | 66.2 | 374.3 | 67.9 | <0.22 |
| Fragmentation, % | 18.2 | 5.1 | 16.1 | 3.2 | <0.25 |
| After alcohol for 7 days | |||||
| Wake after sleep onset, min | 49.5 | 24.6 | 40.4 | 18.8 | <0.35 |
| Total sleep time, min | 360.1 | 41.6 | 374.3 | 58.1 | <0.44 |
| Fragmentation, % | 17.1 | 4.3 | 15.7 | 5.4 | <0.52 |
n, No. of subjects; C, Caucasian; AA, African American; A, Asian; DW, day shift worker; NW, night shift worker; BMI, body mass index; NA, not available.
Comparison of Melatonin Profiles in Day Workers and Night Workers
The DLMO was 19 h 49 min ± 1 h 33 min in the DW and 22 h ± 2 h 48 min in the NW group, which was significantly later in the night workers, P = 0.04 (Fig. 2A). After moderate red wine consumption for 7 days the DLMO was essentially unchanged in the DW group and even later in the NW group and at 19 h 40 min ± 2 h 47 min vs. 23 h 57 min ± 3 h 36 min, respectively, with a P < 0.01 (Fig. 2B). After red wine consumption, there was a nonsignificant 7-min phase advance in the DW group, but in the NW group there was a 1 h 57 min phase delay, P < 0.01 by group. By paired analysis from baseline, there was no change in the DW group DLMO, but there was a significant phase delay in the NW group DLMO after alcohol (Fig. 2, C and D). The mean number of night shifts worked the week of the phase assessment in the NW group was 2.1 ± 1.1 in the baseline week and 2.5 ± 1.0 in the second week, which was not significantly different (P = 0.93). There also was no correlation between the change in the number of night shifts worked between the two weeks and changes to the DLMO (P = 0.91). The AUC for plasma melatonin in DW was 406.4 ± 324.9 and in the NW was 639.3 ± 370.3 in pg·ml−1·h−1, which was not significantly different, P = 0.12. After 7 days of alcohol the AUC was 393.5 ± 334.0 in DW and 695.0 ± 524.8 in NW, which was also not significantly different, P = 0.13 by group or by paired analysis with P = 0.25 and 0.92, respectively.
Fig. 2.

Melatonin profiles in day workers (DW) and night workers (NW) before and after moderate alcohol consumption. Blood was drawn every hour under dim light (<5 lux) and dim light melatonin onset (DLMO) was calculated by the 3k method as described in methods. A: there was a nonsignificant 7-min phase advance in the DW after alcohol consumption. There was a significant 1 h 57 min phase delay in the NW group, P < 0.01 by group (B). A circular plot of the time of each DLMO in the DW group before (C) and after (D) alcohol and in the NW group before (E) and after (F) alcohol shows a phase delay in the NW group.
Intestinal Permeability Data between Groups
Primarily gastroduodenal permeability in 5-h urinary sucrose was not significantly different between the DW vs. NW before or after alcohol at 0.40 ± 0.31 vs. 0.46 ± 0.25 and 0.43 ± 0.18 vs. 0.58 ± 0.39, P = 0.42 and 0.25, respectively (Fig. 3A). Urinary mannitol and lactulose, which represent primarily small bowel permeability, were 17.71 ± 9.46 vs. 20.61 ± 7.96 and 1.24 ± 1.77 vs. 1.27 ± 1.56 in DW compared with NW at baseline, respectively. After alcohol they were 15.67 ± 12.17 vs. 17.61 ± 8.24 and 0.95 ± 0.72 vs. 0.62 ± 0.25, respectively (Fig. 3, B and C). There was no significant change in urinary mannitol or lactulose by paired analysis, P = 0.21 and 0.93 vs. 0.25 and 0.09 despite an increase in the L/M ratio in the DW and NW groups, P = 0.03 vs. 0.04. The 24-hour urinary sucralose, which represents whole gut permeability, was not significantly increased in DW but was in NW after alcohol at 0.97 ± 0.42 vs. 0.75 ± 0.46 and 1.07 ± 0.67 vs. 1.53 ± 1.31, with P = 0.60 and 0.04, respectively (Fig. 3D). The 13- to 24-h urinary sucralose, which represents primarily colonic permeability, was 0.17 ± 0.13 vs. 0.32 ± 0.36 and 0.11 ± 0.12 vs. 0.57 ± 1.14 in DW vs. NW before and after alcohol (Fig. 3E). There was not a significant correlation between the change in DLMO and urinary sucralose, P = 0.47. However, there was a significant negative linear correlation between AUC of plasma melatonin and urinary sucralose in DW and NW (r = −0.53, P < 0.01, Fig. 3F).
Fig. 3.

Comparison of intestinal permeability in day workers and night workers before and after moderate alcohol consumption. All values are %oral dose for 5-h urinary sucrose (primarily gastroduodenal; not statistically different) (A); 5-h urinary mannitol (B) and 5-h urinary lactulose (C) (both primarily small bowel; not significantly different); 24-h urinary sucralose (whole gut) (D) and 13- to 24-h urinary sucralose (primarily colon) (E) (significantly increased in the NW but not DW group). F: linear regression showed a significant negative correlation between the change in melatonin area under the curve (AUC) and colonic permeability. G: 13- to 24-h urinary sucraolose correlated with lipopolysaccharide-binding protein (LBP) at midnight. Analysis in F and G excluded 2 subjects with permeability values >2 SD above the mean. ns, Not significant. *P < 0.05 by Wilcox Signed-Rank Test.
Rhythmicity of Clock Genes in Day Workers and Night Workers by Group
Both DW and NW had a significant cosinor fit for clock gene expression before and after moderate alcohol consumption in all clock genes, with a P < 0.05 and F statistic from 2.25 to 5.63 as previously described in methods (Fig. 4) (26). The only clock gene that did not have a significant fit to the cosinor model was PER2 in the DW group with a P = 0.71. The amplitudes of expression of CLOCK, BMAL, PER1, and CRY1 were all significantly increased after alcohol consumption in both DW and NW by a Wald test (Table 2). In CRY2 the amplitude was increased in the NW group and decreased in the DW group. The acrophase of clock gene expression was also altered in NW in CLOCK, BMAL, and PER1 and in DW in CLOCK and CRY1. The mesor of CLOCK and CRY1 was also changed in DW after alcohol. As a validation measure, the phase angle or acrophase between the central and peripheral circadian clocks, where phase angle = [phaseperipheral] − [phasecentral] (Fig. 5). There was a very significant linear correlation (P < 0.01) or consistency between the phase angle of melatonin and for all six clock genes by individual subject except for PER2, which as mentioned did not fit the cosinor model.
Fig. 4.

Clock gene expression in PBMCs before and after alcohol consumption. A cosinor model fit over a 24-h period was performed as described in Statistical Analysis. The mesor, amplitude, and acrophase were calculated for each group before and after moderate alcohol consumption. A Wald test was performed to analyze the impact of the covariate (alcohol) on the model. *Amplitude P < 0.05; **amplitude and acrophase P < 0.05; ***amplitude, acrophase, and mesor P < 0.05.
Table 2.
Cosinor anlaysis of clock genes in DW and NW before and after alcohol
| Cosinor Parameters |
||||||||
|---|---|---|---|---|---|---|---|---|
| Gene | Type | EtOH | Mesor | P | Amplitude | P | Acrophase, h:min | P |
| Clock | DW | No | 0.95 | <0.01 | 0.16 | <0.03 | 10:30 | <0.01 |
| DW | Yes | 0.66 | 0.23 | 18:39 | ||||
| NW | No | 0.87 | <0.21 | 0.27 | <0.02 | 15:05 | <0.01 | |
| NW | Yes | 0.72 | 0.31 | 16:44 | ||||
| BMAL | DW | No | 1.27 | <0.45 | 0.14 | <0.001 | 4:41 | <0.34 |
| DW | Yes | 1.44 | 0.74 | 22:48 | ||||
| NW | No | 1.19 | <0.12 | 0.33 | <0.02 | 1:54 | <0.03 | |
| NW | Yes | 1.55 | 0.55 | 8:36 | ||||
| PER1 | DW | No | 1.55 | <0.12 | 0.87 | <0.001 | 1:29 | <0.68 |
| DW | Yes | 2.06 | 1.45 | 23:39 | ||||
| NW | No | 1.19 | <0.14 | 0.49 | <0.02 | 0:27 | <0.05 | |
| NW | Yes | 1.57 | 0.59 | 3:19 | ||||
| PER2 | DW | No | 0.82 | <0.96 | 0.17 | <0.59 | 16:46 | <0.46 |
| DW | Yes | 0.83 | 0.06 | 5:16 | ||||
| NW | No | 0.86 | <0.85 | 0.11 | <0.001 | 15:03 | <0.95 | |
| NW | Yes | 0.87 | 0.33 | 11:55 | ||||
| CRY1 | DW | No | 1.37 | <0.001 | 0.29 | <0.03 | 19:45 | <0.01 |
| DW | Yes | 0.79 | 0.43 | 16:28 | ||||
| NW | No | 1.08 | <0.21 | 0.35 | <0.02 | 16:23 | <0.10 | |
| NW | Yes | 0.86 | 0.40 | 14:42 | ||||
| CRY2 | DW | No | 0.99 | <0.46 | 0.48 | <0.01 | 7:34 | <0.93 |
| DW | Yes | 0.90 | 0.08 | 12:34 | ||||
| NW | No | 0.94 | <0.08 | 0.20 | <0.001 | 8:22 | <0.09 | |
| NW | Yes | 1.14 | 0.41 | 13:47 | ||||
EtOH, ethanol.
Fig. 5.

Comparison of individual central and peripheral circadian phases. Individual comparison of time of the fitted peak, or acrophase, was performed for each subject before and after alcohol where the phase angle = [phaseperipheral] − [phasecentral]. A linear regression was performed to compare the timing between of the phase angle before and after alcohol. The relationship between the timing of the peripheral and central clock was highly preserved even after moderate alcohol consumption in CLOCK, BMAL, PER1, CRY1, and CRY2 as evidenced by a significant linear regression. The linear regression results were as follows: CLOCK (r = 1.05, R2 = 0.93, P < 0.0001); BMAL (r = 0.94, R2 = 0.51, P < 0.0001); PER1 (r = 1.01, R2 = 0.93, P < 0.0001); CRY1 (r = 0.70, R2 = 0.31, P = 0.007); and CRY2 (r = 0.88, R2 = 0.47, P = 0.0001). Only PER2 had a nonsignificant correlation for phase angle after moderate alcohol at r = 0.05, R2 = 0.00, and P = 0.89, which is due to a poor cosinor model fit of PER2.
Markers of Endotoxemia and Inflammatory Cytokines
The mean LBP levels were not different between DW and NW at baseline vs. DW and NW after alcohol consumption, at 11,109.92 ± 1,699.89 and 12,787.61 ± 3,363.39 vs. 10,744.10 ± 1,192.70 and 11,014.52 ± 1,515.24, with P = 0.39 and 0.63, respectively. Similarly, the mean LPS levels between DW and NW at baseline vs. after alcohol consumption were not significantly different at 0.11 ± 0.12 and 0.14 ± 0.12 vs. 0.19 ± 0.29 and 0.13 ± 0.13, P = 0.20 and 0.73, respectively, or in IL-6 at 2.04 ± 1.53 and 2.42 ± 1.23 vs. 2.00 ± 1.57 and 2.54 ± 1.69, P = 0.64 and 0.34. By linear regression, time 0 (midnight) LBP levels correlated with 13- to 24-h urinary sucralose after alcohol at r = 0.46, P = 0.02 (Fig. 3G). LBP and LPS levels did not similarly correlate with 13- to 24-h sucralose after alcohol.
Additional analysis of LBP, LPS, and IL-6 levels by nonlinear regression or cosinor analysis was performed to incorporate time as described in methods. A statistical fit to a cosinor model was seen in LBP, LPS, and IL-6 in DW and NW before alcohol with F = 2.10–3.30, P < 0.05. The mesor and amplitude of LBP were significantly lower in the DW group compared with the NW group before alcohol at 11,111.01 vs. 12,456.04 (Table 3). The amplitude of LBP in the DW vs. NW group was also elevated in NW at 452.85 vs. 1,481.36 (Fig. 6). For LPS, the baseline mesor was higher in the NW group at 0.08 vs. 1.47 in DW vs. NW. After alcohol, LBP and LPS levels both lost rhythmicity and did not significantly fit the cosinor model. For IL-6 levels, the mesor was higher in NW vs. DW (Table 3). After alcohol there was again not a significant fit to the cosinor model of IL-6 levels in DW and NW.
Table 3.
Cosinor anlaysis of markers of endotoxemia and inflammation in DW and NW before and after alcohol
| Cosinor Parameters |
||||||||
|---|---|---|---|---|---|---|---|---|
| Type | EtOH | Mesor | P value | Amplitude | P value | Acrophase, h:min | P value | |
| LBP | DW | No | 11,111.01 | <0.01 | 452.85 | <0.01 | 14:14 | <0.04 |
| NW | 12,465.03 | 1,481.36 | 14:49 | |||||
| DW | Yes | Nonsignificant cosinor fit | ||||||
| NW | ||||||||
| LPS | DW | No | 0.08 | <0.01 | 0.01 | <0.55 | 22:03 | <0.95 |
| NW | 1.47 | 0.01 | 23:37 | |||||
| DW | Yes | Nonsignificant cosinor fit | ||||||
| NW | ||||||||
| IL-6 | DW | No | 1.73 | <0.02 | 0.17 | <0.08 | 4:55 | <0.02 |
| NW | 2.21 | 0.35 | 7:18 | |||||
| DW | Yes | Nonsignificant cosinor fit | ||||||
| NW | ||||||||
LBP, lipopolysaccharide-binding protein.
Fig. 6.

Markers of endotoxemia and inflammation before and after alcohol consumption. A cosinor model fit over a 24-h period was performed as described in Statistical Analysis. The mesor, amplitude, and acrophase were calculated for each group before and after moderate alcohol consumption. A Wald test was performed to analyze the impact of the covariate (group) on the model. *Amplitude P < 0.05 and ***amplitude, acrophase, and mesor P < 0.05.
DISCUSSION
This study's main finding is that moderate alcohol consumption of 0.5 g/kg of red wine a day for 7 days caused increased whole gut permeability, and this increase is primarily the result of increased colonic permeability in healthy night workers but not in healthy day workers. Moderate alcohol did not increase small bowel permeability, as measured by 5-h urinary lactulose or mannitol excretion, in either DW or NW. The small bowel finding is similar to previous reports (43, 44). Of note, the L/M ratio was increased in both DW and NW with alcohol, but the total excretion of lactulose and mannitol was not, emphasizing the potential misleading results of using the L/M ratio in the absence of villous atrophy as previously reported (7, 37). It is also notable that parameters of sleep architecture where similar between the DW and NW groups because of night shift work adaptation (13), so these difference are due to chronic circadian misalignment and not sleep architecture alone. Consistent with our previous finding of low melatonin AUC in alcoholic subjects correlating with colonic permeability (43), we also found that the change in colonic permeability correlated with the percentage change in melatonin AUC in the day worker and night worker groups. Low melatonin AUC may indicate disrupted circadian homeostasis, and is an established biomarker of other diseases such as diabetes (24), obesity (46), and aging (31). This finding is also supported by our animal studies that show chronic central circadian disruption by 12-h light-dark shift for 3 mo increases the risk of hyperpermeability with an injurious agent like Dextran-sodium sulfate colitis (33), and alcohol-fed rats with either an environmentally or genetic (clock mutant) circadian alteration results in increased AIHP, endotoxemia, and liver pathology (41). Thus, our study is the first report that night work may increase the susceptibility to AIHP in the colon.
Our finding that circadian misalignment primarily impacts colonic permeability is not surprising. In our previous work, we showed in vitro that alcohol increased circadian clock genes, CLOCK and PER2, in the intestinal epithelial CaCo-2 cell line, and blocking CLOCK or PER2 with siRNA prevented alcohol-induced monolayer hyperpermeability (42). Colonic permeability is particularly relevant, since the largest concentration of microbiota is found in the colon (1012/g compared with the small bowel 106/g) (30). Indeed, in our study we found a marker of endotoxemia and bacterial translocation, LBP, correlated with colonic permeability at time 0. LBP has been previously reported to be elevated in cirrhosis with increased permeability and bacterial translocation (34), and, in a PER2 mutant mouse model with decreased expression of occludin and claudin-1 in the colon, nocturnal permeability was increased (22). Although LPS and LBP have not been extensively studied in NW previously, sleep deprivation has been shown to increase levels of LPS and inflammatory cytokines like IL-6 (16, 17, 20). In our study we found rhythmic levels of these markers in DW and NW and an elevated mesor in LBP, LPS, and IL-6 in our NW group. After alcohol, there was a loss of the rhythm in LBP, LPS, and IL-6. The loss of rhythmicity is a marker of circadian disruption that has been associated with other inflammatory and autoimmune diseases in humans and animals (48).
The impact of moderate alcohol on central circadian rhythms in this study was measured by the gold standard of central circadian assessment, the DLMO. The DLMO was later in the NW compared with DW group at baseline as expected. What was notable in this study was, while alcohol had little effect on the DLMO in DW, it was associated with a significant phase delay in NW. This suggests that alcohol is impacting central circadian rhythms in NW but not DW. This is also the first study to evaluate the impact of alcohol on the DLMO in NW. In healthy controls (on a day schedule), acute alcohol intake at night was associated with reducing melatonin levels in plasma melatonin (35) but was not associated with a change in DLMO. In subjects with alcohol dependence who were 3–12 wk abstinent, the DLMO had a small but significant 18-min phase delay compared with healthy controls (8). In total, the findings of increased AIHP and a central phase delay of the DLMO in the NW group but not the DW group suggest that central circadian misalignment is a key cofactor in AIHP in humans.
To further access the circadian rhythm system, we studied clock gene expression in peripheral blood mononuclear cells (PBMCs), which are a known peripheral circadian system with a robust circadian oscillation (5). In this study we found that alcohol significantly altered the amplitude of peripheral clock genes in CLOCK, BMAL, PER1, CRY1, and CRY2. Only in PER2, which in our study did not significantly fit the cosinor model, was there no change in the amplitude. Peripheral circadian disruption therefore appeared to be present in both day workers and night workers with alcohol and was not a marker that could differentiate the two study groups. In humans, the one prior study examining clock gene expression in PBMCs in alcoholics found decreased levels compared with controls (15) but measured clock gene expression at only one time point. The finding that alcohol can impact peripheral circadian clock gene expression in DW and NW is novel. It is also not unreasonable, since other substances like glucocorticoids have been previously reported to alter peripheral clock gene expression in PBMCs (10), and alcohol is known to impact the hypothalamic-pituitary axis (51). Studies in PBMCs in night shift workers have found that clock gene expression is preserved in night workers and adjusts within days after simulated night work (18). These key studies also showed a significant interindividual variability in PBMC clock gene expression between subjects, which was also found in the present study; however, there was a very significant correlation between the phase angle of the central and peripheral clock rhythms that was preserved with alcohol consumption (Fig. 5). This would be expected if the central clock is the master clock coordinating the timing of peripheral clocks.
There are several important limitations to the present study. First, as mentioned, we could not standardize the time of alcohol consumption due to work schedules, and the DW group drank the wine in the evening after work while the NW group drank their wine in the morning after work or the evening if not working. In addition, our study design was not placebo controlled, since the primary aim of this study was to determine if NW are more susceptible to AIHP, not the impact of alcohol on intestinal permeability (19) or melatonin (6) on which we have previously published. This study also examined patients who were at home in their natural environments during the two weeks of the study. Subjects did not have a set sleep or wake time. In addition, we could not completely control for the number of night shifts worked each week due to varying work schedules, and we had a small nonsignificant difference in the number of night shifts worked each week. Our study also includes a relatively small number of subjects, due in part to our decision to do more intensive 24-h in-lab phase assessments with plasma melatonin and not a partial 24-h phase assessment measuring salivary melatonin. In addition, we did not collect baseline urine for food contamination, although in our experience we have not detected any measurable contamination after the fast in our protocol (11). Finally, we measured peripheral circadian rhythms in PBMCs due to ease of accessing multiple time points. Because intestinal permeability was the main endpoint of this study, measuring circadian rhythms in the gastrointestinal tract would have been a more ideal comparison with the suprachiasmatic nucleus; however, this would have required multiple flexible sigmoidoscopies over 24 h.
In summary, the main findings of this study are night workers have increased AIHP and a central phase delay with moderate alcohol consumption for one week. Further studies are needed to assess how night work impacts colonic and intestinal epithelial cell barrier function, such as tight junction protein expression and intestinal microbiota. Shift work has not been typically accessed in alcohol research as a risk factor for ALD, which needs to be further examined. Identifying circadian misalignment as a key cofactor in AIHP offers not only risk stratification for clinicians but could also lead to the development of possible chronotherapeutics for future investigations such as melatonin supplementation or light therapy in night workers with at-risk drinking behaviors.
GRANTS
This work was supported by the Alvin Baum Family fund to G. R. Swanson and A. Keshavarzian and by National Institute of Alcohol and Alcoholism Grant K23-AA-019966 to G. R. Swanson.
DISCLOSURES
The authors have no conflicts of interest to disclose.
AUTHOR CONTRIBUTIONS
G.R.S., C.F., F.W.T., H.J.B., and A.K. conception and design of research; G.R.S., A.G., M.S., J.V.D.B., S.R., and M.H.V. performed experiments; G.R.S., A.G., M.S., V.D., T.K., J.V.D.B., T.M., S.R., M.H.V., C.F., H.J.B., and A.K. analyzed data; G.R.S., A.G., M.S., V.D., T.K., J.V.D.B., T.M., S.R., M.H.V., C.F., F.W.T., and H.J.B. interpreted results of experiments; G.R.S., A.G., M.S., V.D., T.K., J.V.D.B., H.J.B., and A.K. prepared figures; G.R.S., M.S., C.F., and F.W.T. drafted manuscript; G.R.S., F.W.T., H.J.B., and A.K. edited and revised manuscript; G.R.S., F.W.T., H.J.B., and A.K. approved final version of manuscript.
REFERENCES
- 1.Alterman T, Luckhaupt SE, Dahlhamer JM, Ward BW, Calvert GM. Prevalence rates of work organization characteristics among workers in the U.S: data from the 2010 National Health Interview Survey. Am J Ind Med 56: 647–659, 2013. [DOI] [PMC free article] [PubMed] [Google Scholar]
- 2.Arrieta MC. Alterations in intestinal permeability. Gut 55: 1512 1520, 2006. [DOI] [PMC free article] [PubMed] [Google Scholar]
- 3.Beck AT, Ward CH, Mendelson M, Mock J, Erbaugh J. An inventory for measuring depression. Arch Gen Psychiatry 4: 561–571, 1961. [DOI] [PubMed] [Google Scholar]
- 4.Bellentani S, Saccoccio G, Costa G, Tiribelli C, Manenti F, Sodde M, Saveria Croce L, Sasso F, Pozzato G, Cristianini G, Brandi G. Drinking habits as cofactors of risk for alcohol induced liver damage. The Dionysos Study Group. Gut 41: 845–850, 1997. [DOI] [PMC free article] [PubMed] [Google Scholar]
- 5.Boivin DB, James FO, Wu A, Cho-Park PF, Xiong H, Sun ZS. Circadian clock genes oscillate in human peripheral blood mononuclear cells. Blood 102: 4143–4145, 2003. [DOI] [PubMed] [Google Scholar]
- 6.Burgess HJ, Rizvydeen M, Fogg LF, Keshavarzian A. A single dose of alcohol does not meaningfully alter circadian phase advances and phase delays to light in humans. Am J Physiol Regul Integr Comp Physiol In press. [DOI] [PMC free article] [PubMed] [Google Scholar]
- 7.Camilleri M, Nadeau A, Lamsam J, Nord SL, Ryks M, Burton D, Sweetser S, Zinsmeister AR, Singh R. Understanding measurements of intestinal permeability in healthy humans with urine lactulose and mannitol excretion. Neurogastroenterol Motil 22: e15–e26, 2010. [DOI] [PMC free article] [PubMed] [Google Scholar]
- 8.Conroy DA, Hairston IS, Arnedt JT, Hoffmann RF, Armitage R, Brower KJ. Dim light melatonin onset in alcohol-dependent men and women compared with healthy controls. Chronobiol Int 29: 35–42, 2012. [DOI] [PMC free article] [PubMed] [Google Scholar]
- 9.Cornelissen G. Cosinor-based rhythmometry. Theor Biol Med Model 11: 16-4682-11-16, 2014. [DOI] [PMC free article] [PubMed] [Google Scholar]
- 10.Cuesta M, Cermakian N, Boivin DB. Glucocorticoids entrain molecular clock components in human peripheral cells. FASEB J 29: 1360–1370, 2015. [DOI] [PubMed] [Google Scholar]
- 11.Farhadi A, Keshavarzian A, Holmes EW, Fields J, Zhang L, Banan A. Gas chromatographic method for detection of urinary sucralose: application to the assessment of intestinal permeability. J Chromatogr B Analyt Technol Biomed Life Sci 784: 145–154, 2003. [DOI] [PubMed] [Google Scholar]
- 12.Hansen J, Stevens RG. Case-control study of shift-work and breast cancer risk in Danish nurses: impact of shift systems. Eur J Cancer 48: 1722–1729, 2012. [DOI] [PubMed] [Google Scholar]
- 13.Hilliker NA, Muehlbach MJ, Schweitzer PK, Walsh JK. Sleepiness/alertness on a simulated night shift schedule and morningness-eveningness tendency. Sleep 15: 430–433, 1992. [DOI] [PubMed] [Google Scholar]
- 14.Hoogerwerf WA, Hellmich HL, Cornelissen G, Halberg F, Shahinian VB, Bostwick J, Savidge TC, Cassone VM. Clock gene expression in the murine gastrointestinal tract: endogenous rhythmicity and effects of a feeding regimen. Gastroenterology 133: 1250–1260, 2007. [DOI] [PubMed] [Google Scholar]
- 15.Huang MC, Ho CW, Chen CH, Liu SC, Chen CC, Leu SJ. Reduced expression of circadian clock genes in male alcoholic patients. Alcohol Clin Exp Res 34: 1899–1904, 2010. [DOI] [PubMed] [Google Scholar]
- 16.Irwin MR, Carrillo C, Olmstead R. Sleep loss activates cellular markers of inflammation: sex differences. Brain Behav Immun 24: 54–57, 2010. [DOI] [PMC free article] [PubMed] [Google Scholar]
- 17.Irwin MR, Wang M, Campomayor CO, Collado-Hidalgo A, Cole S. Sleep deprivation and activation of morning levels of cellular and genomic markers of inflammation. Arch Intern Med 166: 1756–1762, 2006. [DOI] [PubMed] [Google Scholar]
- 18.James FO, Cermakian N, Boivin DB. Circadian rhythms of melatonin, cortisol, and clock gene expression during simulated night shift work. Sleep 30: 1427–1436, 2007. [DOI] [PMC free article] [PubMed] [Google Scholar]
- 19.Keshavarzian A, Fields JZ, Vaeth J, Holmes EW. The differing effects of acute and chronic alcohol on gastric and intestinal permeability. Am J Gastroenterol 89: 2205–2211, 1994. [PubMed] [Google Scholar]
- 20.Khosro S, Alireza S, Omid A, Forough S. Night work and inflammatory markers. Indian J Occup Environ Med 15: 38–41, 2011. [DOI] [PMC free article] [PubMed] [Google Scholar]
- 21.Kolstad HA. Nightshift work and risk of breast cancer and other cancers–a critical review of the epidemiologic evidence. Scand J Work Environ Health 34: 5–22, 2008. [DOI] [PubMed] [Google Scholar]
- 22.Kyoko OO, Kono H, Ishimaru K, Miyake K, Kubota T, Ogawa H, Okumura K, Shibata S, Nakao A. Expressions of tight junction proteins Occludin and Claudin-1 are under the circadian control in the mouse large intestine: implications in intestinal permeability and susceptibility to colitis. PLoS One 9: e98016, 2014. [DOI] [PMC free article] [PubMed] [Google Scholar]
- 23.Liira J, Verbeek JH, Costa G, Driscoll TR, Sallinen M, Isotalo LK, Ruotsalainen JH. Pharmacological interventions for sleepiness and sleep disturbances caused by shift work. Cochrane Database Syst Rev 8: CD009776, 2014. [DOI] [PMC free article] [PubMed] [Google Scholar]
- 24.McMullan CJ, Schernhammer ES, Rimm EB, Hu FB, Forman JP. Melatonin secretion and the incidence of type 2 diabetes. J Am Med Assoc 309: 1388–1396, 2013. [DOI] [PMC free article] [PubMed] [Google Scholar]
- 25.Meddings JB, Gibbons I. Discrimination of site-specific alterations in gastrointestinal permeability in the rat. Gastroenterology 114: 83–92, 1998. [DOI] [PubMed] [Google Scholar]
- 26.Nelson W, Tong YL, Lee JK, Halberg F. Methods for cosinor-rhythmometry. Chronobiologia 6: 305–323, 1979. [PubMed] [Google Scholar]
- 27.Netzer NC, Stoohs RA, Netzer CM, Clark K, Strohl KP. Using the Berlin Questionnaire to identify patients at risk for the sleep apnea syndrome. Ann Intern Med 131: 485–491, 1999. [DOI] [PubMed] [Google Scholar]
- 28.Nojkov B, Rubenstein JH, Chey WD, Hoogerwerf WA. The impact of rotating shift work on the prevalence of irritable bowel syndrome in nurses. Am J Gastroenterol 105: 842–847, 2010. [DOI] [PMC free article] [PubMed] [Google Scholar]
- 29.O'Connor PG, Schottenfeld RS. Patients with alcohol problems. N Engl J Med 338: 592–602, 1998. [DOI] [PubMed] [Google Scholar]
- 30.Ohland CL, Jobin C. Microbial activities and intestinal homeostasis: a delicate balance between health and disease. Cell Mol Gastroenterol Hepatol 1: 28–40, 2015. [DOI] [PMC free article] [PubMed] [Google Scholar]
- 31.Pandi-Perumal SR, Zisapel N, Srinivasan V, Cardinali DP. Melatonin and sleep in aging population. Exp Gerontol 40: 911–925, 2005. [DOI] [PubMed] [Google Scholar]
- 32.Pietroiusti A, Forlini A, Magrini A, Galante A, Coppeta L, Gemma G, Romeo E, Bergamaschi A. Shift work increases the frequency of duodenal ulcer in H pylori infected workers. Occup Environ Med 63: 773–775, 2006. [DOI] [PMC free article] [PubMed] [Google Scholar]
- 33.Preuss F, Tang Y, Laposky AD, Arble D, Keshavarzian A, Turek FW. Adverse effects of chronic circadian desynchronization in animals in a “challenging” environment. Am J Physiol Regul Integr Comp Physiol 295: R2034–R2040, 2008. [DOI] [PMC free article] [PubMed] [Google Scholar]
- 34.Reiberger T, Ferlitsch A, Payer BA, Mandorfer M, Heinisch BB, Hayden H, Lammert F, Trauner M, Peck-Radosavljevic M, Vogelsang H, Vienna Hepatic Hemodynamic Lab. Non-selective betablocker therapy decreases intestinal permeability and serum levels of LBP and IL-6 in patients with cirrhosis. J Hepatol 58: 911–921, 2013. [DOI] [PubMed] [Google Scholar]
- 35.Rupp TL, Acebo C, Carskadon MA. Evening alcohol suppresses salivary melatonin in young adults. Chronobiol Int 24: 463–470, 2007. [DOI] [PubMed] [Google Scholar]
- 36.Sachs MC, Shoben A, Levin GP, Robinson-Cohen C, Hoofnagle AN, Swords-Jenny N, Ix JH, Budoff M, Lutsey PL, Siscovick DS, Kestenbaum B, de Boer IH. Estimating mean annual 25-hydroxyvitamin D concentrations from single measurements: the Multi-Ethnic Study of Atherosclerosis. Am J Clin Nutr 97: 1243–1251, 2013. [DOI] [PMC free article] [PubMed] [Google Scholar]
- 37.Shaikh M, Rajan K, Forsyth CB, Voigt RM, Keshavarzian A. Simultaneous gas-chromatographic urinary measurement of sugar probes to assess intestinal permeability: use of time course analysis to optimize its use to assess regional gut permeability. Clin Chim Acta 442: 24–32, 2015. [DOI] [PMC free article] [PubMed] [Google Scholar]
- 38.Shi SQ, Ansari TS, McGuinness OP, Wasserman DH, Johnson CH. Circadian disruption leads to insulin resistance and obesity. Curr Biol 23: 5372–381, 2013. [DOI] [PMC free article] [PubMed] [Google Scholar]
- 39.Skinner HA, Sheu WJ. Reliability of alcohol use indices. The Lifetime Drinking History and the MAST. J Stud Alcohol 43: 1157–1170, 1982. [DOI] [PubMed] [Google Scholar]
- 40.Sladek M, Rybova M, Jindrakova Z, Zemanova Z, Polidarova L, Mrnka L, O'Neill J, Pacha J, Sumova A. Insight into the circadian clock within rat colonic epithelial cells. Gastroenterology 133: 1240–1249, 2007. [DOI] [PubMed] [Google Scholar]
- 41.Summa KC, Voigt RM, Forsyth CB, Shaikh M, Cavanaugh K, Tang Y, Vitaterna MH, Song S, Turek FW, Keshavarzian A. Disruption of the circadian clock in mice increases intestinal permeability and promotes alcohol-induced hepatic pathology and inflammation. PLoS One 8: 6: e67102, 2013. [DOI] [PMC free article] [PubMed] [Google Scholar]
- 42.Swanson G, Forsyth CB, Tang Y, Shaikh M, Zhang L, Turek FW, Keshavarzian A. Role of intestinal circadian genes in alcohol-induced gut leakiness. Alcohol Clin Exp Res 35: 1305–1314, 2011. [DOI] [PMC free article] [PubMed] [Google Scholar]
- 43.Swanson GR, Gorenz A, Shaikh M, Desai V, Forsyth CB, Fogg L, Burgess HJ, Keshavarzian A. Decreased melatonin secretion is associated with increased intestinal permeability and marker of endotoxemia in alcoholics. Am J Physiol Gastrointest Liver Physiol 308: G1004–G1011, 2015. [DOI] [PMC free article] [PubMed] [Google Scholar]
- 44.Swanson GR, Tieu V, Shaikh M, Forsyth C, Keshavarzian A. Is moderate red wine consumption safe in inactive inflammatory bowel disease? Digestion 84: 238–244, 2011. [DOI] [PMC free article] [PubMed] [Google Scholar]
- 45.Szabo G. Gut-liver axis in alcoholic liver disease. Gastroenterology 148: 30–36, 2015. [DOI] [PMC free article] [PubMed] [Google Scholar]
- 46.Tan DX, Manchester LC, Fuentes-Broto L, Paredes SD, Reiter RJ. Significance and application of melatonin in the regulation of brown adipose tissue metabolism: relation to human obesity. Obes Rev 12: 167–188, 2011. [DOI] [PubMed] [Google Scholar]
- 47.Teli MR, Day CP, Burt AD, Bennett MK, James OF. Determinants of progression to cirrhosis or fibrosis in pure alcoholic fatty liver. Lancet 346: 987–990, 1995. [DOI] [PubMed] [Google Scholar]
- 48.Turek FW. Staying off the dance floor: when no rhythm is better than bad rhythm. Am J Physiol Regul Integr Comp Physiol 294: R1672–R1674, 2008. [DOI] [PubMed] [Google Scholar]
- 49.Voultsios A, Kennaway DJ, Dawson D. Salivary melatonin as a circadian phase marker: validation and comparison to plasma melatonin. J Biol Rhythms 12: 457–466, 1997. [DOI] [PubMed] [Google Scholar]
- 50.Vyas MV, Garg AX, Iansavichus AV, Costella J, Donner A, Laugsand LE, Janszky I, Mrkobrada M, Parraga G, Hackam DG. Shift work and vascular events: systematic review and meta-analysis. Br Med J 345: e4800, 2012. [DOI] [PMC free article] [PubMed] [Google Scholar]
- 51.Wand GS, Dobs AS. Alterations in the hypothalamic-pituitary-adrenal axis in actively drinking alcoholics. J Clin Endocrinol Metab 72: 1290–1295, 1991. [DOI] [PubMed] [Google Scholar]