

Abstract
Key points
Glucose transporters are central players in glucose homeostasis.
There are two major classes of glucose transporters in the body, the passive facilitative glucose transporters (GLUTs) and the secondary active sodium‐coupled glucose transporters (SGLTs).
In the present study, we report the use of a non‐invasive imaging technique, positron emission tomography, in mice aiming to evaluate the role of GLUTs and SGLTs in controlling glucose distribution and utilization.
We show that GLUTs are most significant for glucose uptake into the brain and liver, whereas SGLTs are important in glucose recovery in the kidney.
This work provides further support for the use of SGLT imaging in the investigation of the role of SGLT transporters in human physiology and diseases such as diabetes and cancer.
Abstract
The importance of sodium‐coupled glucose transporters (SGLTs) and facilitative glucose transporters (GLUTs) in glucose homeostasis was studied in mice using fluorine‐18 labelled glucose molecular imaging probes and non‐invasive positron emission tomography (PET) imaging. The probes were: α‐methyl‐4‐[F‐18]‐fluoro‐4‐deoxy‐d‐glucopyranoside (Me‐4FDG), a substrate for SGLTs; 4‐deoxy‐4‐[F‐18]‐fluoro‐d‐glucose (4‐FDG), a substrate for SGLTs and GLUTs; and 2‐deoxy‐2‐[F‐18]‐fluoro‐d–glucose (2‐FDG), a substrate for GLUTs. These radiolabelled imaging probes were injected i.v. into wild‐type, Sglt1–/–, Sglt2–/– and Glut2–/– mice and their dynamic whole‐body distribution was determined using microPET. The distribution of 2‐FDG was similar to that reported earlier (i.e. it accumulated in the brain, heart, liver and kidney, and was excreted into the urinary bladder). There was little change in the distribution of 2‐FDG in Glut2–/– mice, apart from a reduction in the rate of uptake into liver. The major differences between Me‐4FDG and 2‐FDG were that Me‐4FDG did not enter the brain and was not excreted into the urinary bladder. There was urinary excretion of Me‐4FDG in Sglt1–/– and Sglt2–/– mice. However, Me‐4FDG was not reabsorbed in the kidney in Glut2–/– mice. There were no differences in Me‐4FDG uptake into the heart of wild‐type, Sglt1–/– and Sglt2–/– mice. We conclude that GLUT2 is important in glucose liver transport and reabsorption of glucose in the kidney along with SGLT2 and SGLT1. Complete reabsorption of Me‐4FDG from the glomerular filtrate in wild‐type mice and the absence of reabsorption in the kidney in Glut2–/– mice confirm the importance of GLUT2 in glucose absorption across the proximal tubule.
Key points
Glucose transporters are central players in glucose homeostasis.
There are two major classes of glucose transporters in the body, the passive facilitative glucose transporters (GLUTs) and the secondary active sodium‐coupled glucose transporters (SGLTs).
In the present study, we report the use of a non‐invasive imaging technique, positron emission tomography, in mice aiming to evaluate the role of GLUTs and SGLTs in controlling glucose distribution and utilization.
We show that GLUTs are most significant for glucose uptake into the brain and liver, whereas SGLTs are important in glucose recovery in the kidney.
This work provides further support for the use of SGLT imaging in the investigation of the role of SGLT transporters in human physiology and diseases such as diabetes and cancer.
Abbreviations
- CT
computed tomography
- 2‐FDG
2‐deoxy‐2‐[F‐18]‐fluoro‐d–glucose
- 4‐FDG
4‐deoxy‐4‐[F‐18]‐fluoro‐d‐glucose
- GLUT
facilitative glucose transporter
- αMDG
methyl‐d‐glucopyranoside
- Me‐4FDG
α‐methyl‐4‐[F‐18]‐fluoro‐4‐deoxy‐d‐glucopyranoside
- PET
positron emission tomography
- SGLT
sodium‐dependent glucose transporter
Introduction
Glucose transporters are central to glucose homeostasis in the body. There are two major classes of transporters for transport into cells: the passive facilitated glucose transporters (GLUTs) (Mueckler & Thorens, 2013) and the active sodium‐coupled glucose transporters (SGLTs) (Wright et al. 2011; Wright, 2013). The SGLTs couple inward glucose transport to the inward transport of sodium down the sodium electrochemical potential gradient across the cell membrane. Although the GLUTs are ubiquitously expressed throughout the body, it is generally considered that SGLTs are only expressed in the intestine to absorb glucose from food and in the kidney to reabsorb filtered glucose that would otherwise be lost in the urine. However, SGLT genes and proteins are expressed throughout the body (Nishimura & Naito, 2005; Chen et al. 2010; Vrhovac et al. 2015) and functional SGLTs are expressed in specific cells within the brain (Yu et al. 2010; Yu et al. 2013) and in cancer (Scafoglio et al. 2015). Their functional relevance in the body apart from that observed in the kidneys and intestine is yet to be determined.
The activity of GLUTs in animals and humans has been studied extensively using non‐invasive positron emission tomography (PET) and the glucose analogue 2‐deoxy‐2‐[F‐18]‐fluoro‐d–glucose (2‐FDG) (Phelps, 2004). In the present study, we have extended PET imaging to the SGLTs using two newly developed imaging probes, α‐methyl‐4‐[F‐18]‐fluoro‐4‐deoxy‐d‐glucopyranoside (Me‐4FDG) and 4‐deoxy‐4‐[F‐18]‐fluoro‐d‐glucose (4‐FDG). As reported previously, 2‐FDG is a high affinity substrate for GLUTs and a low affinity substrate for SGLTs. Me‐4FDG is a high affinity substrate for SGLT1, a medium affinity substrate for SGLT2 and a very low affinity substrate for GLUTs. 4‐FDG is a substrate for both GLUTs and SGLTs (Table 1) (Wright et al. 2011). 2‐FDG accumulation in cells is based on its phosphorylation by hexokinase to its 6‐phosphate, although neither Me‐4FDG, nor 4‐FDG are phosphorylated (Yu et al. 2010; Yu et al. 2013). 2‐FDG is accumulated in cells after entry via GLUTs as a result of a metabolic sink effect, whereas Me‐4FDG is only accumulated in cells expressing SGLTs via sodium cotransport. Me‐4FDG is effectively trapped as a result of the low rate of exit via SGLTs and also because it is a poor substrate for GLUTs (Table 1).
Table 1.
Sugar selectivity of human SGLT1, SGLT2 and GLUT2
| hSGLT2 K 0.5 or | hGLUT2 K 0.5 or | ||
|---|---|---|---|
| hSGLT1 K0.5 (mm) | K i (mm) | K i (mm) | |
| Glucose | 0.5* | 5 (K 0.5)*** | ∼17 (K 0.5)**** |
| 2‐FDG | >300** | 34 ± 6 (K i) | 7 ± 2 (K i) |
| 4‐FDG | 0.1* | 3±1 (K i) | 14 ± 7 (K i) |
| Me‐4FDG | 0.06 ± 0.02 | 16 ± 7 (K i) | 118 ± 40 (K i) |
The K 0.5 value for Me‐4FDG in hSGLT1 (mean ± SEM, n = 4) and the K i values for 2‐FDG, 4‐FDG and Me‐4FDG in hSGLT2 and hGLUT2 (mean ± SEM, n = 3 each) were estimated experimentally in the present study (Fig. 2), as described in the Methods. Other K 0.5 values are taken from previous studies: *Diez‐Sampedro et al. (2001); **Wright et al. (2011); ***Hummel et al. (2011); ****Mueckler & Thorens (2013). It is customarily assumed that the K 0.5 and K i parameters are interchangeable measures of transporter affinities for substrates.
We have explored the functional activity of SGLTs and GLUT2 in the body of conscious mice using Me‐4FDG, 4‐FDG and 2‐FDG microPET imaging in wild‐type mice, as well as in Sglt1–/–, Sglt2–/– and Glut2–/– mice. PET is a powerful non‐invasive method with high spatial (3 mm3) and temporal (seconds) resolution for imaging the dynamic distribution of these fluorine‐18 probes in vivo. Our results confirm that, in vivo, Me‐4FDG is a poor substrate for GLUT1 or GLUT2; 4‐FDG is a substrate for SGLTs and GLUTs; and 2‐FDG is a poor substrate for SGLT1 and SGLT2 (Table 1). In the kidney, SGLT1 and 2 in series with GLUT2 are responsible for the bulk of glucose reabsorption of glucose from the glomerular filtrate. Under physiological conditions, SGLTs are the main pathway for glucose transport in the kidney and intestine, although our results suggest that, in other major organs, such as the brain, heart and liver, GLUTs are responsible for most of the glucose uptake. However, SGLT‐mediated glucose utilization has been shown to be important in the brain (Yu et al. 2010) and in certain cancers (Scafoglio et al. 2015).
Methods
Animals
All animal procedures followed guidelines approved by the University of California Chancellor's Committee on Animal Research and the National Institutes of Health. We understand the ethical principles under which The Journal of Physiology operates and our work complies with the animal ethics policy and checklist as outlined recently (Grundy, 2015). Male and female wild‐type C57Bl/6 mice (25–35 g; Jackson Laboratory, Bar Harbor, ME, USA), female Glut2–/– and male Sglt1–/– on a C57Bl/6‐background, and male Sglt2–/– mice on a mixed 129S5/SvEvBrd x C57BL/6‐Tyrc‐Brd background (Thorens et al. 2000), (Gorboulev et al. 2012; Powell et al. 2013; Vallon, 2011) were housed at the UCLA Division of Laboratory Animal Medicine facilities and maintained under a 12:12 h light/dark cycle, with food and water available ad libitum. The Sglt1–/– mice were maintained on a low carbohydrate diet (Teklad TD08212; Harlan, Indianapolis, IN, USA) to avoid diarrhoea as a result of glucose‐galactose‐malabsorption (Wright et al. 2001; Gorboulev et al. 2012). Some animals, as indicated in the text, were fasted overnight prior to each study, with free access to water, and studies were conducted between 10.00 h and 14.00 h. At the termination of experiments, animals were killed by terminal exsanguinations under deep isoflurane anaesthesia, followed by thoracotomy.
Radiochemistry
2‐FDG was obtained from the UCLA Cyclotron and Radiochemistry Technology Centre, and Me‐4FDG and 4‐FDG were synthesized from the corresponding acetylated galactose triflate by radiofluorination with cyclotron‐produced [F‐18]‐fluoride, followed by deacetylation. Probes had high radiochemical purities of >97% and specific radioactivity >2,000 (Ci/mmol) (Wright et al. 2014).
In vivo microPET scanning
Experiments were performed at the Preclinical Imaging Technology Centre of the UCLA Crump Institute for Molecular Imaging. To determine the distribution of radiotracers in conscious mice, the protocol was to inject the tracer directly into the tail vein under isoflurane anaesthesia and, after recovery from the anaesthesia (<1 min), the animals were allowed to roam freely in their holding cage for 40 min before conducting a 10 min PET scan under anaesthesia, 50–60 min after injection of the tracer. Mice were anaesthetized in a heated induction box by inhalation of 2% isoflurane (Abbot Laboratories, North Chicago, IL, USA) in 100% oxygen. In mice subjected to 60 min dynamic PET scans, a small catheter (Intramedic PE20; Clay Adams, Sparks, MD, USA) was inserted in the proximal tail vein (Kreissl et al. 2011) and the tracer was injected after mounting the mouse on the microPET scanner. The mice were positioned on a heated custom PET‐CT small animal holder, which allowed for continuous anaesthesia (Suckow et al. 2009). A MicroPET Focus 220 scanner (CTI Concorde Microsystems, Knoxville, TN, USA) was used for PET data acquisition. For dynamic scans, the acquired data were binned into 25 image frames (3 × 20, 4 × 30, 5 × 60, 5 × 120, 3 × 180, 3 × 300 and 2 × 600 s). After the PET scans were completed, a 10 min computerized tomography (CT) scan was performed to provide anatomical information, using a MicroCAT II X‐ray Tomograph (ImTek Inc., Knoxville, TN, USA). PET images were reconstructed using Fourier rebinning and a filtered back‐projection algorithm (Kreissl et al. 2011; Wong et al. 2013) and microCT images were co‐registered with microPET data for attenuation correction (Chow et al. 2005).
Data analysis
AMIDE software (Loening & Gambhir, 2003) was used for image display and volume‐of‐interest analysis. Kinetic modelling of the excretion of 2‐FDG or Me‐4FDG into the urinary bladder was performed using the Kinetic Imaging System (Huang et al. 2005). The standard 2‐FDG model was simplified to three compartments, plasma, kidney and bladder (Fig. 1), as a result of both 2‐FDG and Me‐4FDG being excreted into the urine unchanged (Gallagher et al. 1978; Yu et al. 2010). The rate constants describing tracer exchange between the three compartments are: (i) K (ml min−1), the clearance of tracer from plasma by the kidney by glomerular filtration; (ii) k 2 (min−1), the reabsorption of tracer from the glomerular filtrate; and (iii) k 3 (min−1), the rate of excretion of the tracer into the bladder from the kidney. It is also assumed that there is no secretion of 2‐FDG or Me‐4FDG from blood into the tubules (i.e. k –2 is zero) and there is no backflow of tracer from the bladder into the kidney (i.e. k –4 is zero). If there is little or no reabsorption of tracer from the glomerular filtrate, k 2 is zero, whereas , if there is little or no tracer excretion into the bladder, k 2 would approach K. It is straightforward to measure the rate of tracer excretion into the bladder by following the whole bladder region of interest, although it is problematic to measure the activity in plasma as a function of time, the input function (IF), because of the small blood volume in mice (Ferl et al. 2007; Kreissl et al. 2011; Wong et al. 2011). In the present study, we chose to estimate the input function by recording the activity in the heart and assuming that the total activity is within the heart chambers (total volume of 20 μl in a 200–150 mg heart in a mouse weighing 27 g), and assuming a haematocrit of 50%. This is a reasonable first approximation because 2‐FDG and Me‐4FDG are not accumulated in the ventricular wall of the fasted mouse heart (see Results; see also Kreissl et al. 2011). Images were analysed using AMIDE where three dimensional ellipsoidal volumes were drawn over the region of interest (heart and bladder) on the PET image using the CT as an anatomic reference. There were no significant changes in the urinary bladder volume over the course of the 60 min microPET scans. The average radioactivity was calculated on each time frame to obtain the time course of the distribution in the heart and bladder. Each data point was converted to absolute radioactivity concentration (MBq ml−1) with the calibration factor derived from routine cylinder phantom experiments.
Figure 1. Kinetic model for urinary excretion of PET tracers .
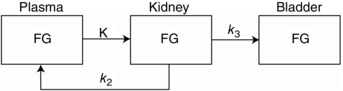
Three‐compartment model of urinary excretion of radiotracers (FG) from plasma. FG is the concentration of the radiotracer in plasma, kidney and urinary bladder. K is the rate of glomerular filtration, k 2 is the rate of tubular reabsorption of filtered FG and k 3 is the rate of excretion from the kidney into the urinary bladder.
In vivo metabolism of Me‐4FDG
Me‐4FDG, 4‐FDG and 2‐FDG were neither phosphorylated by hexokinase in vitro, nor metabolized in rats (Yu et al. 2010). In the present study, we tested whether or not Me‐4FDG was metabolized in Sglt1–/– mice. Some 70 min after the injection of the probe into three Sglt1–/– mice for microPET/CT, blood (0.05 ml) and urine (0.1 ml) samples were collected. Plasma was extracted with three volumes of methanol and a sample analysed along with urine by radio‐thin layer chromatography (silica gel thin layer chromatography plates, developed with 85% acetonitrile aqueous solution; read and quantitated by autoradiography); 98% and 91% of the [F‐18] in plasma and urine ran as Me‐4FDG.
Probe selectivity
We examined the selectivity of 2‐FDG, Me‐4FDG and 4‐FDG with respect to human SGLT1, SGLT2 and GLUT2 using transport assays in heterologous expression systems (Fig. 2 and Table 1). hSGLT1‐mediated Me‐4FDG transport was measured in Xenopus laevis oocytes expressing the transporter by means of two‐electrode voltage clamp electrophysiology, and the apparent affinity constant K 0.5 for Me‐4FDG transport was determined by fitting the concentration‐dependent Na+/sugar currents to a Michaelis–Menten relationship, as described previously in studies from our laboratory (Diez‐Sampedro et al. 2001). 2‐FDG, 4‐FDG and Me‐4FDG interactions with hSGLT2 and hGLUT2 were determined by competition assays in HEK293T cells transfected with the transporter cDNAs, as described previously (Hummel et al. 2011; Ghezzi et al. 2014). Briefly, the uptake of 50 μm [C‐14]‐d‐α‐methyl‐d‐glucopyranoside (for hSGLT2; Moravek Biochemicals, Brea, CA, USA) or 2 mm [C‐14]‐2‐deoxy‐d‐glucose (for hGLUT2; PerkinElmer, Boston, MA, USA) was measured in the absence and presence of increasing concentrations of external 2‐FDG, 4‐FDG or Me‐4FDG, and the results were corrected for uptake in untransfected cells. The apparent inhibitory constant K i values were estimated from the relationship for competitive inhibition (eqn III‐5 in Segel, 1975):
| (1) |
where J is the fractional inhibition of uptake at each concentration of inhibitor I; S is the substrate concentration; and K m is the apparent affinity of the substrate. The K 0.5 value for Me‐4FDG in hSGLT1 and the K i values for 2‐FDG, 4‐FDG and Me‐4FDG in hSGLT2 and hGLUT2 estimated experimentally in the present study are shown in Table 1, alongside other relevant K 0.5 values from previous studies.
Figure 2. Sugar selectivity of hSGLT2 and hGLUT2 .
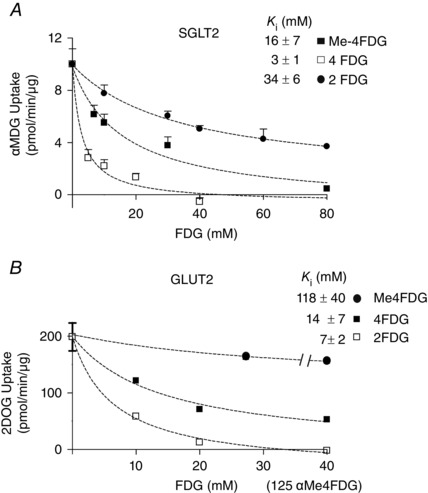
A, sugar K i values for hSGLT2. [14C] αMDG uptake was measured in HEK‐293T cells expressing hSGLT2 at increasing concentrations of Me‐4FDG (black squares), 4‐FDG (white squares) and 2‐FDG (black circles). Data were fitted to eqn (1) to estimate the apparent inhibitory constant (K i). Data are the mean ± SEM (n ≥ 4). B, sugar K i values for GLUT2 [14C] 2‐Deoxy‐d‐glucose uptake was measured in HEK‐293T cells expressing hGLUT2 at increasing concentrations of Me‐4FDG (black circles), 4‐FDG (black squares) and 2‐FDG (white squares). The break in the Me‐4FDG curve indicates a break in the Me‐4FDG concentration to a maximum of 125 mm, as noted in parenthesis on the abscissa. Data were fitted to eqn (1) to estimate the apparent inhibitory constant (K i). Data points are the mean ± SEM (n ≥ 4).
Statistical analysis
SigmaPlot, version 10.0 (Systat Software, San Jose, CA, USA) and CorelDRAW X3, version 13.0 (Corel Corporation, Mountain View, CA, USA) were used for data analysis and figure preparation. Unless otherwise noted, data are shown as the mean ± SEM of at least three experiments. Statistical analyses were performed with OriginLab (Northampton, MA, USA). For each tracer (Figs 3 B, 4 B and 5 B), the differences in 60 min conscious uptake were examined in two independent sets. On the one hand, differences in tissue accumulation between mouse types were evaluated by means of two‐way ANOVA followed by Tukey's test, using organ (brain, heart, muscle and kidney) and genotype (wild‐type and Sglt1–/–, Sglt2–/– or Glut2–/–, as appropriate) as the independent variables; statistically significant differences (P < 0.05) are indicated (Figs 3 B, 4 B and 5 B, left). On the other hand, differences in tracer excretion into the urinary bladder between mouse types were investigated by means of one‐way ANOVA and post hoc Tukey's test (Figs 3 B, 4 B and 5 B, right; P < 0.05 was considered statistically significant). Additionally, where indicated in the text, one‐way ANOVA and the Tukey test were applied to examine differences between isotopes in certain organs and mouse genotypes; the significance values are given as appropriate.
Figure 3. Bio‐distribution of novel SGLT‐specific PET tracer Me‐4FDG in mice .
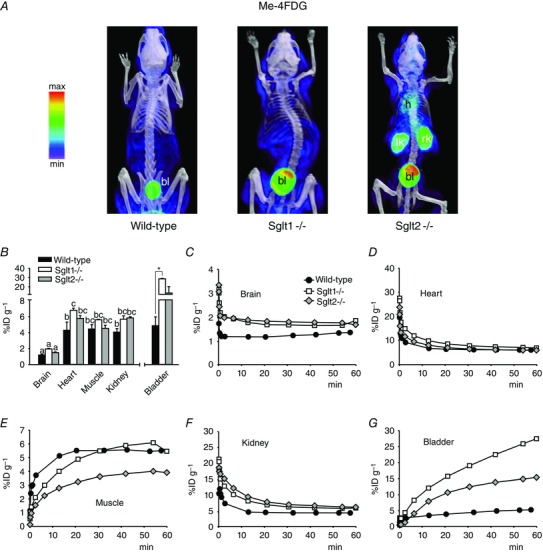
A and B, non‐metabolized glucose analogue Me‐4FDG (300 μCi) was administered by tail vein injection into conscious wild‐type, Sglt1–/– or Sglt2–/– mice and, after 40 min, the animals were anaesthetized for short PET/CT scans. A, volumetric renderings of representative co‐registered scans; PET images are displayed according to the NIH intensity scale for tracer activity, from red (highest) to green (intermediate) to purple (lowest). Target organs are indicated: heart (h), urinary bladder (bl), left kidney (lk) and right kidney (rk). B, 60 min tracer activity detected in major target organs and tissues in conscious mice, as quantified by volume‐of‐interest (VOI) analysis for the experiments in (A); Kidney refers to the right kidney and Muscle refers to a 64 mm3 spherical VOI from the inner right thigh (the same in all mice). Data are the mean ± SEM of three to six experiments. Significant differences in tissue distribution (brain, heart, muscle and kidney) between wild‐type, Sglt1‐ and Sglt2‐null mice are indicated by different lowercase letters (P < 0.05, two‐way ANOVA and Tukey's test). Significant differences in excretion into the urinary bladder between mouse types are indicated by an asterisk (P < 0.05, one way ANOVA and Tukey's test). C–G, time‐course of Me‐4FDG distribution in unconscious mice. Tracer (300 μCi) was injected into anaesthetized animals, and continuous PET data were acquired for 60 min. For clarity, only select time points are represented. All data are from the same wild‐type, Sglt1–/– or Sglt2–/– mouse, and are representative of at least three experiments in different mice.
Figure 4. Bio‐distribution of GLUT‐specific PET tracer 2‐FDG in mice .
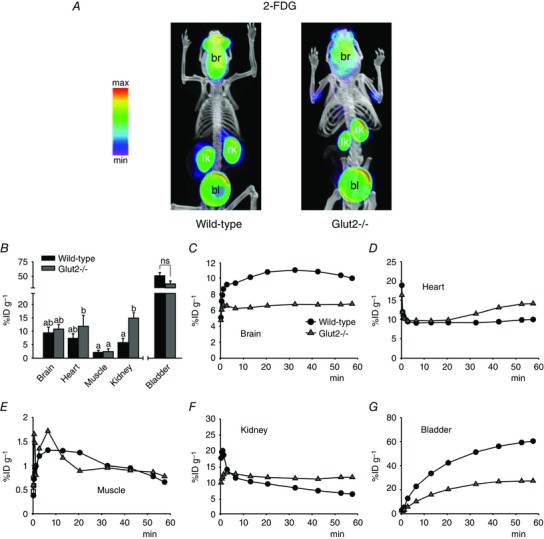
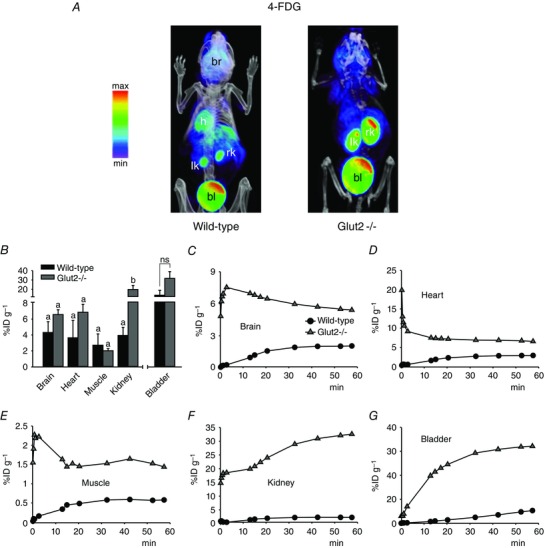
A and B, standard PET tracer 2‐FDG (300 μCi) was administered by tail vein injection into conscious wild‐type or Glut2–/– mice and, after 40 min, the animals were anaesthetized for short PET/CT scans. A, volumetric renderings of representative co‐registered scans; PET images are displayed and labelled as in Fig. 3 A. B, 60 min tracer activity detected in major target organs and tissues in conscious mice, as in Fig. 3 B. Data are the mean ± SEM of five to seven experiments. Significant differences in tissue distribution (brain, heart, muscle and kidney) between wild‐type and Glut2‐null mice are indicated by different lowercase letters (P < 0.05, two‐way ANOVA and Tukey's test). Differences in excretion into the urinary bladder between mouse types were not significant (ns; P = 0.09, one‐way ANOVA and Tukey's test). C–G, time‐course of 2‐FDG distribution in unconscious mice. Tracer (300 μCi) was injected into anaesthetized animals, and continuous PET data were acquired for 60 min. For clarity, only select time points are represented. All data are from the same wild‐type or Glut2–/– mouse, and are representative of at least three experiments in different mice.
Figure 5. Bio‐distribution of novel glucose PET tracer 4‐FDG in mice .
A and B, 4‐FDG (300 μCi) was administered by tail vein injection into conscious wild‐type or Glut2–/– mice and, after 40 min, the animals were anaesthetized for short PET/CT scans. A, volumetric renderings of representative co‐registered scans; PET images are displayed and labelled as in Fig. 3 A. B, 60 min tracer activity detected in major target organs and tissues in conscious mice, as in Fig. 3 B. Data are the mean ± SEM of three to six experiments. Significant differences in tissue distribution (brain, heart, muscle and kidney) between wild‐type and Glut2‐null mice are indicated by different letters (P < 0.05, two‐way ANOVA and Tukey's test). Differences in excretion into the urinary bladder between mouse types were not significant (ns; P = 0.1, one‐way ANOVA and Tukey's test). C–G, time‐course of 4‐FDG distribution in unconscious mice. Tracer (300 μCi) was injected into anaesthetized animals, and continuous PET data were acquired for 60 min. For clarity, only select time points are represented. All data are from the same wild‐type or Glut2–/–mouse, and are representative of at least three experiments in different mice.
Results
As a prelude to our microPET/CT studies aiming to examine the distribution of the three molecular imaging glucose tracers in conscious wild‐type mice and in mice lacking three different glucose transporter genes, Sglt1, Sglt2 and Glut2, we completed experiments on the selectivity of the tracers for hSGLT2 and hGLUT2. Figure 2 shows competition for hSGLT2 methyl‐d‐glucopyranoside (αMDG) uptake by 2‐FDG, 4‐FDG and Me‐4FDG (Fig. 2 A) and competition for hGLUT2 [C‐14]‐2‐deoxy‐d‐glucose uptake by 2‐FDG, 4‐FDG and Me‐4FDG (Fig. 2 B). As summarized in Table 1 the K 0.5 and K i values show that Me‐4FDG is specific for SGLTs; 2‐FDG is fairly specific for GLUT2; and 4‐FDG, is transported by both SGLTs and GLUTs. A major difference between 2‐FDG and the other two glucose tracers is that, although 2‐FDG converted by hexokinase within cells to 2‐FDG‐6‐phosphate, neither Me‐4FDG, nor 4‐FDG are metabolized in rats (Yu et al. 2010). This means that 2‐FDG is accumulated in cells by a metabolic sink affect, whereas Me‐4FDG and 4‐FDG are accumulated through the activity of SGLTs. We measured the steady‐state distribution (at 60 min) of the three tracers in conscious mice (static scans) and the time course of the distribution of the imaging tracers in anaesthetized mice (dynamic scans).
The present study aimed to locate the functional expression of SGLTs throughout the whole body of the mouse. The data are presented in three ways; the first shows volumetric images of the distribution of each glucose tracer at 60 min in conscious wild‐type and knockout mice (Figs 3 A to 5 A); the second tabulates the accumulation of the tracer in each major organ of these conscious mice at 60 min post tracer injection in terms of the percentage of the injected dose per gramme of each organ (%ID/g) (Figs 3 B to 5 B); and the third presents the time course of tracer accumulation in the major organs under isoflurane anaesthesia (Figs 3 to 5 C–G and 6).
Pilot studies were conducted on fasted and non‐fasted, conscious and anaesthetized and male and female mice. Where possible, at least two of the three tracers were compared on the same mice within 2 weeks. The distribution of 2‐FDG and Me‐4FDG in male, anaesthetized wild‐type mice was similar in fasted and fed animals, except that 2‐FDG was accumulated in the heart of fed but not fasted mice as reported previously (Kreissl et al. 2011). Similarly, there were no consistent changes in the distribution of 2‐FDG, Me‐4FDG and 4‐FDG between conscious and anaesthetized fed mice (data not shown).
Me‐4FDG
Immediately following i.v. injection of the tracer into the anaesthetized mouse and following blood flow, the [F‐18] activity distributed to the major organs of the body. The blood activity then declined gradually as the tracer was taken up into tissues and excreted into the urine (Fig. 3 C, D and F). Only in skeletal muscle was there clear evidence of a time‐dependent slow accumulation of Me‐4FDG (Fig. 3 E), although there were no apparent differences in the time course between wild‐type, Sglt1–/– and Sglt2–/– mice (Fig. 3 E) and the 60 min uptake values (∼5%ID/g) were not significantly different (Fig. 3 B). Me‐4FDG was evenly distributed throughout wild‐type mouse organs, except that there was almost no uptake into the brain (Fig. 3 B). At 60 min, the percentage of the initial injected dose in heart, kidney and skeletal muscle was ∼4%ID/g, which is significantly higher than for brain at 1%ID/g (Fig. 3 B). The 60 min uptake into heart and kidney was higher for the Sglt1 and Sglt2 knockout animals (5–7 vs. 4%ID/g), although differences were only significant between the hearts of WT and Sglt1–/– mice. There was a very low excretion of Me‐4FDG into the urinary bladder of wild‐type mice and, as expected, this increased dramatically in the Sglt1 and Sglt2 knockout animals (Fig. 3 B). This is discussed further below.
2‐FDG
The 60 min distribution of 2‐FDG in fasted wild‐type conscious mice is very similar to that reported previously for anaesthetized mice (Landau et al. 2007; Wong et al. 2011). The most obvious differences between 2‐FDG and Me‐4FDG in wild‐type animals were that 2‐FDG accumulated in the brain (Figs 3 B and C and 4 B and C) and was excreted into the urinary bladder (Figs 3 A, B and G and 4 A, B and G). The 60 min accumulation of 2‐FDG in he brain or excretion into the bladder (Fig. 3 B) was significantly higher than that for Me‐4FDG (Fig. 3 B), respectively ∼10 vs. 1%ID/g and ∼50 vs. 5%ID/g (P < 0.01 for both, one‐way ANOVA and Tukey's test). There were no significant differences between wild‐type and Glut2 knockout animals with respect to the average accumulation of 2‐FDG in the brain, muscle and urinary bladder and, although tracer uptake in the heart was 60% higher in Glut2–/– than in wild‐type mice, these differences were not statistically significant. On the other hand, there was a significant, 2.5‐fold increase in 2‐FDG uptake in the kidney of Glut2‐null animals with respect to wild‐type (Fig. 4 B). In Glut2 knockouts, the slightly higher 60 min 2‐FDG uptake in the heart is reflected in a slow accumulation of the tracer in tissue after the initial clearance of the vascular pool (Fig. 4 D).
4‐FDG
Unlike Me‐4FDG, 4‐FDG accumulated in the brain of wild‐type mice (Figs 5 B and C and 3 B and C), ∼4 vs. 1%ID/g at 60 min (P < 0.01, one‐way ANOVA and Tukey's test), and at levels comparable to those of 2‐FDG (Figs 3 B and C and 5 B and C), ∼4 vs. 10%ID/g at 60 min (P = 0.15, one‐way ANOVA and Tukey's test). This was expected given that 4‐FDG is a substrate for both SGLTs and GLUTs, there is no metabolic sink for 4‐FDG, and 4‐FDG may exit the cell via GLUTs. The 60 min accumulation of 4‐FDG in the muscle, heart and kidney of wild‐type mice was similar in magnitude to that observed for Me‐4FDG in wild‐type mice and for 6‐FDG (6‐[F‐18]‐fluoro‐6‐deoxy‐d‐glucose) in rat (Landau et al. 2007). 6‐FDG is a substrate for both SGLTs and GLUTs. Similar to 4‐FDG, 6‐FDG is not phosphorylated because it has no hydroxyl group at carbon‐6. In Glut2 knockouts, there was a significantly higher accumulation of 4‐FDG in the kidney with respect to wild‐type (i.e. ∼20 vs. 4%ID/g at 60 min) (Fig. 5 B), which may reflect a slower exit of 4‐FDG accumulated through brush‐border SGLTs. 4‐FDG accumulation into brain and heart of Glut2‐null mice was ∼1.5‐ and ∼2‐fold higher than in the WT, respectively, and excretion into the urinary bladder was ∼2.5‐fold higher, although these differences were not found to be statistically significant (Fig. 5 B).
Tracer uptake into liver
The liver was of particular interest because this organ plays an important role in glucose homeostasis and GLUT2 is the major glucose transporter for hepatic glucose utilization (Guillam et al. 1998). The time course of 2‐FDG accumulation in the liver of wild‐type mice exhibited a rapid phase corresponding to early tissue uptake of the tracer followed by washout, t1/2 ∼10 min, to a 60 min level of 5.0 ± 0.2%ID/g (Fig. 6). The difference in the time/activity curves for 2‐FDG in wild‐type and Glut2–/– mice reflects the importance of GLUT2‐mediated 2‐FDG uptake into liver. There were no differences in the Me‐4FDG time/activity curves for wild‐type, Sglt1–/– and Sglt2–/– mice (not shown), with 60 min distributions of 6.0 ± 0.4%ID/g (n = 2), 6.0 ± 0.2%ID/g (n = 3) and 5.3 ± 0.2%ID/g (n = 5), respectively. This indicates the absence of significant SGLT activity in liver.
Figure 6. Time course of 2‐FDG distribution in the liver of wild‐type and Glut2–/– mice .
2‐FDG (300 μCi) was administered by tail vein into anaesthetized wild‐type and Glut2–/– mice and the activity in the right lobe of the liver was monitored for 60 min as in the experiments shown in Figs 3, 4, 5. Data are the mean ± SEM for three wild‐type and three Glut2–/– mice.
Urinary excretion
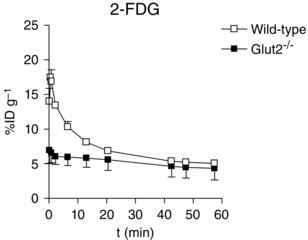
Striking differences were noted for the activities of the three glucose tracers in the urinary bladder of wild‐type and knockout mice (Figs 3 B, 4 B and 5 B). In terms of kidney function, it is desirable to express the activity as the total amount of tracer excreted into the bladder rather than the concentration in urine (Figs 3, 4, 5). The total amount of 2‐FDG and Me‐4FDG excreted into the urinary bladder (MBq) for representative wild‐type, Sglt1–/–, Sglt2–/– and Glut2–/– mice is shown in Fig. 6. Note that these mice did not urinate during the experiments (i.e. no loss of activity from the animal) and so the amount in the bladder was an accurate reflection of the difference between the amounts of sugar tracer filtered and reabsorbed. It was previously reported that 2‐FDG and Me‐4FDG are excreted unchanged into urine (Gallagher et al. 1978; Yu et al. 2010). There was a low excretion of Me‐4FDG into the urinary bladder of the wild‐type mouse (<0.05 MBq in 60 min), whereas 2‐FDG excretion in wild‐type and Glut2‐null (not shown) mice increased rapidly after an initial delay of 1–2 min and approached a maximum of 2 MBq in 30 min: at 60 min, the amount of 2‐FDG in the bladder was 1.9 ± 0.3 MBq in wild‐type mice (n = 3) and 2.5 ± 0.3 MBq in Glut2–/– mice (n = 2).
The excretion of Me‐4FDG in the Glut2–/– mouse followed a similar time course and magnitude to that observed for 2‐FDG (Fig. 7). The rate and magnitude of Me‐4FDG excretion in the Sglt1–/– and Sglt2–/– mice were intermediate between those observed for wild‐type and Glut2–/– mice (Fig. 7). At 60 min, the bladder activity of Me‐4FDG in Sglt1–/– or Sglt2–/– mice, 1.3 ± 0.1 MBq (n = 3) and 1.2 ± 0.9 MBq (n = 6), respectively, was significantly higher than in wild‐type mice, 0.05 ± 0.03 MBq (n = 5) (P < 0.05, one‐way ANOVA and Tukey's test). Kinetic modelling of the rates of 2‐FDG and Me‐4FDG excretion shown in Fig. 6 provides an approximate estimate of glomerular filtration rate (K 1) and the rate of glucose tracer reabsorption (Fig. 1). Uncertainty is a result of the indirect method required to estimate the input function (IF; plasma tracer concentration as a function of time after i.v. injection). Nevertheless, fits to the urinary excretion data (Fig. 7) give glomerular filtration rates of between 60 and 120 μl min−1, which are comparable to estimates based on plasma clearance kinetics of fluorescein isothiocyanate‐insulin (200–300 μl min−1) (Vallon et al. 2010; Vallon, 2011; Powell et al. 2013). Modelling also provides estimates of the rates of Me‐4FDG reabsorption in the range from 0.3 min−1 for wild‐type to 0.02 min−1 for the Glut2 knockout animal. The low rate of reabsorption of Me‐4FDG for the Glut2 knockout was similar to that for 2‐FDG in both wild‐type and knockout mice, suggesting an important role of basolateral GLUT2 in sugar reabsorption. The rates of Me‐4FDG reabsorption in Sglt1–/– and Sglt2–/– mice were intermediate between Me‐4FDG and 2‐FDG in wild‐type mice (i.e. 100%, 40% and 25% of the Me‐4FDG filtered load was absorbed in 1 h in wild‐type, Sgt1–/– and Sglt2–/– mice).
Figure 7. Urinary excretion of PET tracers 2‐FDG and Me‐4FDG in wild‐type, Glut2–/–, Sglt1–/– and Sglt2–/– mice .
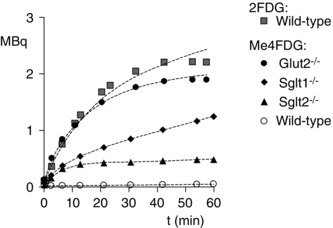
The total amount of 2‐FDG and Me‐4FDG in the urinary bladder of representative WT, Sglt1–/–, Sglt2–/– and Glut2–/– mice as a function of time after i.v. injection of radiotracer (11 MBq) is shown. The data were fit to a three‐compartment model (Fig. 1) using the Kinetic Imaging System (Huang et al. 2005). Fits to the urinary excretion data give glomerular filtration rates between 60 and 120 μl min−1. Estimates of the rate of tubular reabsorption (k 2) for Me‐4FDG were 0.23 ± 0.26 for WT, 0.060 ± 0.03 for Sglt1–/–, 0.09 ± 0.01 for Sglt2–/– and 0.02 ± 0.003 for Glut2–/–; estimates for 2‐FDG were 0.03 ± 0.01 for WT and 0.03 ± 0.02 for Glut2−/− (time‐course not shown). The large error for the estimate of k 2 for the wild‐type mouse is a result of the low level of excretion.
Discussion
Glucose homeostasis involves complex relationships between glucose input (diet and gluconeogenesis in the liver and kidney), exchange between blood and tissues, metabolism, and excretion by the kidneys. In glucose exchange between blood and tissues, attention has focused almost exclusively on plasma membrane GLUTs. Another class of transporters, the SGLTs, are expressed in the small intestine and kidney and are largely responsible for intestinal glucose absorption from food in the small intestine (SGLT1) and glucose reabsorption from the glomerular filtrate in the kidney (SGLT2 and SGLT1) (Wright et al. 2011). Although SGLT proteins are known to be expressed and functional in other organs (e.g. the brain) (Yu et al. 2010; Yu et al. 2013), relatively little is known about their physiological importance in vivo. A powerful non‐invasive method, 2‐FDG PET, has been developed to study glucose distribution in the whole body of animals and humans. 2‐FDG is taken up into cells through GLUTs in the plasma membrane and is trapped intracellularly by conversion to 2‐FDG‐6‐phosphate, which is not a substrate for GLUTs. As a result, 2‐FDG PET imaging is used for experimental and clinical studies to monitor glucose uptake into normal cells and tumours in the body (Phelps, 2004).
The advantages of PET are that it is a non‐invasive method, which enables several experiments to be conducted on the same subject over time as a result of the short half‐life of [F‐18] (110 min), and the images of the [F‐18] tracer distribution are obtained with high temporal and spatial resolution. Although the spatial resolution is high (3 mm3), this does pose a limitation in mice when a limited number of cells in a small organ express glucose transporters, as revealed, for example, by the immunohistochemical location of SGLT1 in liver bile ducts (Balen et al. 2008; Vrhovac et al. 2015).
2‐FDG is a poor substrate for SGLTs (Table 1) and, as a result, 2‐FDG PET does not report accurately on SGLT activity in the body. Although SGLT2 has a low affinity for 2‐FDG, this does not appear to be relevant physiologically because little 2‐FDG s reabsorbed in the proximal tubule (i.e. <10% of the filtered 2‐FDG load is absorbed) (Fig. 6).
As expected, the whole distribution of 2‐FDG in the anaesthetized, fasted control mice was similar to that reported previously (i.e. 2‐FDG was accumulated in the brain, heart, and kidney, and was avidly excreted into the urinary bladder, whereas there was low accumulation in skeletal muscle) (Landau et al. 2007; Wong et al. 2011). There was no dramatic change in 2‐FDG distribution in Glut2–/– mice apart from the significant increase in the kidney uptake (Fig. 4 B), possibly as a result of uptake by other GLUTs. In the urinary bladder, there was no significant change in the amount of 2‐FDG in Glut2–/– mice at 60 min compared to wild‐type controls (Fig. 4 B) (i.e. the filtered load was excreted in both mice). In the liver, there is evidence that 2‐FDG uptake is compromised in the absence of GLUT2 in hepatocytes (Fig. 6) (Guillam et al. 1998).
The most obvious differences between the distribution of Me‐4FDG and 2‐FDG in conscious control mice were that Me‐4FDG neither entered the brain, nor was excreted into the urinary bladder (Figs 3 and 4). In wild‐type, Sglt1–/– and Sglt2–/– mice, the amount of Me‐4FDG in brain amounted to only 1%ID/g, which is lower than any other region of the body, ∼ 4%ID/g (Fig. 3), and consistent with previous findings that Me‐4FDG, [C‐11]‐methyl‐d‐glucopyranoside and [F‐18]‐fluoro‐n‐alkyl‐β‐d‐glucopyranoside do not normally cross the rat blood–brain barrier (Bormans et al. 2003; de Groot et al. 2003; Yu et al. 2010). Osmotic opening of the blood–brain barrier permits Me‐4FDG to enter the brain and accumulate in specific regions, such as the hippocampus and cerebellum (Yu et al. 2013). The washout of Me‐4FDG from the brain (Fig. 3 C) probably represents the clearance of tracer from the brain vascular bed and there were no significant changes in the time course in Sglt1–/– and Sglt2–/– animals (Fig. 3 C). Negligible amounts of Me‐4FDG were excreted into the urinary bladder in control mice, although substantial amounts were excreted in the Sglt1–/– and Sglt2–/– mice (Figs 3 G and 7).
The results for 4‐FDG brain uptake into the brain are consistent with our previous results showing accumulation in brain regions where SGLTs are expressed (Yu et al. 2010, 2013). 4‐FDG is poorly excreted by the kidney into the urinary bladder relative to 2‐FDG 13 vs. 57%ID/g) (Figs 4 and 5). Our results for 4‐FDG are similar to those reported previously for 6‐FDG in the rat (Landau et al. 2007) and suggest that 4‐FDG and 6‐FDG are equally good tracers for PET studies activity because both are substrates for SGLTs and GLUTs. In Glut2–/– mice, there were no significant changes in the 60 min uptake of 4‐FDG in the brain, heart or skeletal muscle, although there were notable increases in 4‐FDG activity in the kidney (Fig. 5 B). This demonstrates that GLUT2 is relatively unimportant in glucose uptake into the brain and muscle, although it is required for glucose reabsorption from glomerular filtrate back into the blood (see below).
Overall, the present study confirms that GLUT2 is required for glucose uptake into the liver (Guillam et al. 1998) and for glucose reabsorption from glomerular filtrate in the kidney (Guillam et al. 1997; Thorens et al. 2000; Santer et al. 2002) . Excretion of 2‐FDG into the urinary bladder approaches the filtered load and there is no increase in Glut2–/– mice. Recall that 2‐FDG is not a high‐affinity substrate for SGLTs in the apical membrane. GLUT2 plays a minor role, if any, in glucose uptake into brain across the blood–brain barrier, skeletal muscleor heart. A minor caveat is that Me‐4FDG uptake into heart is increased in Sglt1–/– mice (Fig. 3), suggesting a role for SGLTs in heart glucose metabolism. In mice and humans lacking functional GLUT2 transporters, there is no apparent defect in intestinal glucose absorption (Guillam et al. 1997; Stumpel et al. 2001; Santer et al. 2003 a).
SGLTs appear to have a relatively minor role in overall glucose utilization in the liver, skeletal muscle, heart and brain, although they are essential for glucose reabsorption in the kidney. In our studies, SGLT1 and SGLT2 appear to be equally important in Me‐4FDG reabsorption from the glomerular filtrate. This is somewhat different from the results reported for urinary glucose excretion where there were only 2–3% and 25–35% decreases in reabsorption in Sglt1–/– and Sglt2–/– mice (Vallon et al. 2010; Vallon, 2011; Gorboulev et al. 2012; Powell et al. 2013). The differences may be partly explained by the variations in renal glucose excretion seen in the knockout mice (Fig. 5) (Powell et al. 2013). In wild‐type mice, it is estimated that SGLT2 in the early proximal tubule accounts for the reabsorption of 80% of the filtered glucose (Vallon et al. 2010) but, at least in the Sglt2 knockout animals, the reserve capacity of SGLT1 of the late proximal tubule can salvage 50% or more of the glucose in the absence of SGLT2 (Powell et al. 2013). A similar conclusion may be drawn about patients without functional SGLT2 protein where substantial amounts of glucose are reabsorbed (Santer et al. 2003 b).
Finally, these results raise a question concerning the role of GLUT2 in the reabsorption of glucose in the kidney: Me‐4FDG and αMDG are low affinity substrates for GLUT2, yet both are completely absorbed in wild‐type mice. How then does Me‐4FDG (and MDG) exit from the proximal tubular epithelum into the blood across the basolateral membrane? One possibility is that GLUT2, with a very low affinity for Me‐4FDG (Ki ∼100 mm) (Table 1) is adequate to permit the escape of acccumulated Me‐4FDG into blood. As supporting evidence, Me‐4FDG is not reabsorbed from the glomerular filtrate in Glut2–/– mice (Fig. 7).
Additional information
Competing interests
The authors declare that they have no competing interests.
Author contributions
MS‐R, EMW and JRB were responsible for the study concept and design. MS‐R, BAH, CG and JL were responsible for the acquisition of data. MS‐R, BAH, JL, VK, AY, HK, S‐CH, DRP and EMW were responsible for data analysis. JL and VK were responsible for chemical design, synthesis and analysis. MS‐R, JRB and EMW were responsible for manuscript preparation and revision. EMW, JRB, M‐SR, DRP, S‐HH and HK were responsible for interpretation of the data. All authors have approved the final version of the manuscript and agree to be accountable for all aspects of the work. All persons designated as authors qualify for authorship, and all those who qualify for authorship are listed.
Funding
This work was supported by grants from the National Institutes of Health (Grants RO1‐DK19567 (Wright) and RO1‐DK077133 (Wright) and the Elizabeth and Thomas Plott Endowed Chair in Gerontology (Barrio). Additional funding was provided by a Pilot and Feasibility Grant from the UCLA Digestive Diseases Research Centre, and the Mitzi and William Blahd Pilot Research Grant from the Society of Nuclear Medicine (Sala‐Rabanal).
Translational perspective
The introduction of 2‐FDG PET imaging some 30 years ago revolutionized our ability to monitor glucose metabolism in human subjects. This led to new perspectives in the human physiology of the brain and heart, and novel ways to identify, stage cancers and follow cancer therapy. Unfortunately, 2‐FDG PET did not report on the activity of the second class of glucose transporters, the SGLTs. Our new specific imaging probe for SGLTs promises to provide novel insights into the human physiology of SGLTs, and diseases such as diabetes and cancer. SGLT2 inhibitors have been approved for the treatment of type 2 diabetes mellitus, and SGLT2 has been shown to be expressed in pancreatic and prostate cancers. We envisage that SGLT PET imaging will prove to be a powerful tool in the development of new drugs for treating diabetes and cancer, and for determining their efficacy and safely.
Acknowledgements
Glut2–/– mice were provided by Colin Nichols (Washington University in Saint Louis, MO, USA). Sglt1–/– mice were provided by Volker Vallon (University of California San Diego, CA, USA). Sglt2–/– mice were obtained from Lexicon Pharmaceuticals, Inc., The Woodlands, TX, USA. Waldemar Ladno is greatly appreciated for his skill, patience and instruction on all aspects of mouse microPET determinations. The authors thank William F. Borschel (Washington University School of Medicine) for assistance with two‐way ANOVA.
Linked articles This article is highlighted by a Perspective by Cheeseman. To read this Perspective, visit http://dx.doi.org/10.1113/JP272457.
References
- Balen D, Ljubojevic M, Breljak D, Brzica H, Zlender V, Koepsell H & Sabolic I (2008). Revised immunolocalization of the Na+‐D‐glucose cotransporter SGLT1 in rat organs with an improved antibody. Am J Physiol Cell Physiol 295, C475–C489. [DOI] [PubMed] [Google Scholar]
- Bormans GM, Van Oosterwyck G, De Groot TJ, Veyhl M, Mortelmans L, Verbruggen AM & Koepsell H (2003). Synthesis and biologic evaluation of (11)c‐methyl‐d‐glucoside, a tracer of the sodium‐dependent glucose transporters. J Nucl Med 44, 1075–1081. [PubMed] [Google Scholar]
- Chen J, Williams S, Ho S, Loraine H, Hagan D, Whaley JM & Feder JN (2010). Quantitive PCR tissue expression profiling of the human SGLT2 gene and related family members. Diabetes 1, 57–92. [DOI] [PMC free article] [PubMed] [Google Scholar]
- Chow PL, Rannou FR & Chatziioannou AF (2005). Attenuation correction for small animal PET tomographs. Phys Med Biol 50, 1837–1850. [DOI] [PMC free article] [PubMed] [Google Scholar]
- de Groot TJ, Veyhl M, Terwinghe C, Vanden Bempt V, Dupont P, Mortelmans L, Verbruggen AM, Bormans GM & Koepsell H (2003). Synthesis of 18F‐fluoroalkyl‐beta‐D‐glucosides and their evaluation as tracers for sodium‐dependent glucose transporters. J Nucl Med 44, 1973–1981. [PubMed] [Google Scholar]
- Diez‐Sampedro A, Wright EM & Hirayama BA (2001). Residue 457 controls sugar binding in the Na(+)/glucose cotransporter. J Biol Chem 276, 49188–49194. [DOI] [PubMed] [Google Scholar]
- Ferl GZ, Zhang X, Wu HM, Kreissl MC & Huang SC (2007). Estimation of the 18F‐FDG input function in mice by use of dynamic small‐animal PET and minimal blood sample data. J Nucl Med 48, 2037–2045. [DOI] [PMC free article] [PubMed] [Google Scholar]
- Gallagher BM, Fowler JS, Gutterson NI, MacGregor RR, Wan CN & Wolf AP (1978). Metabolic trapping as a principle of oradiopharmaceutical design: some factors resposible for the biodistribution of [18F] 2‐deoxy‐2‐fluoro‐D‐glucose. J Nucl Med 19, 1154–1161. [PubMed] [Google Scholar]
- Ghezzi C, Hirayama BA, Gorraitz E, Loo DD, Liang Y & Wright EM (2014). SGLT2 inhibitors act from the extracellular surface of the cell membrane. Physiol Rep 2, e12058. [DOI] [PMC free article] [PubMed] [Google Scholar]
- Gorboulev V, Schurmann A, Vallon V, Kipp H, Jaschke A, Klessen D, Friedrich A, Scherneck S, Rieg T, Cunard R, Veyhl‐Wichmann M, Srinivasan A, Balen D, Breljak D, Rexhepaj R, Parker HE, Gribble FM, Reimann F, Lang F, Wiese S, Sabolic I, Sendtner M & Koepsell H (2012). Na+‐D‐glucose cotransporter SGLT1 is pivotal for intestinal glucose absorption and glucose‐dependent incretin secretion. Diabetes 61, 187–196. [DOI] [PMC free article] [PubMed] [Google Scholar]
- Grundy D (2015). Principles and standards for reporting animal experiments in The Journal of Physiology and Experimental Physiology . J Physiol 593, 2547–2549. [DOI] [PMC free article] [PubMed] [Google Scholar]
- Guillam MT, Burcelin R & Thorens B (1998). Normal hepatic glucose production in the absence of GLUT2 reveals an alternative pathway for glucose release from hepatocytes. Proc Natl Acad Sci USA 95, 12317–12321. [DOI] [PMC free article] [PubMed] [Google Scholar]
- Guillam MT, Hummler E, Schaerer E, Yeh JI, Birnbaum MJ, Beermann F, Schmidt A, Deriaz N & Thorens B (1997). Early diabetes and abnormal postnatal pancreatic islet development in mice lacking Glut‐2. Nat Genet 17, 327–330. [DOI] [PubMed] [Google Scholar]
- Huang SC, Truong D, Wu HM, Chatziioannou AF, Shao W, Wu AM & Phelps ME (2005). An internet‐based ‘kinetic imaging system’ (KIS) for MicroPET. Mol Imaging Biol 7, 330–341. [DOI] [PMC free article] [PubMed] [Google Scholar]
- Hummel CS, Lu C, Liu J, Ghezzi C, Hirayama BA, Loo DD, Kepe V, Barrio JR & Wright EM (2011). Structural selectivity of human SGLT inhibitors. Am J Physiol Cell Physiol 302, C373–C382. [DOI] [PMC free article] [PubMed] [Google Scholar]
- Kreissl MC, Stout DB, Wong KP, Wu HM, Caglayan E, Ladno W, Zhang X, Prior JO, Reiners C, Huang SC & Schelbert HR (2011). Influence of dietary state and insulin on myocardial, skeletal muscle and brain [F]‐fluorodeoxyglucose kinetics in mice. EJNMMI Res 1, 8. [DOI] [PMC free article] [PubMed] [Google Scholar]
- Landau BR, Spring‐Robinson CL, Muzic RF Jr., Rachdaoui N, Rubin D, Berridge MS, Schumann WC, Chandramouli V, Kern TS & Ismail‐Beigi F (2007). 6‐Fluoro‐6‐deoxy‐D‐glucose as a tracer of glucose transport. Am J Physiol Endocrinol Metab 293, E237–E245. [DOI] [PubMed] [Google Scholar]
- Loening AM & Gambhir SS (2003). AMIDE: a free software tool for multimodality medical image analysis. Mol Imaging 2, 131–137. [DOI] [PubMed] [Google Scholar]
- Mueckler M & Thorens B (2013). The SLC2 (GLUT) family of membrane transporters. Mol Aspects Med 34, 121–138. [DOI] [PMC free article] [PubMed] [Google Scholar]
- Nishimura M & Naito S (2005). Tissue‐specific mRNA expression profiles of human ATP‐binding cassette and solute carrier transporter superfamilies. Drug Metab Pharmacokinet 20, 452–477. [DOI] [PubMed] [Google Scholar]
- Phelps ME (2004). PET Molecular Imaging and Its Biological Applications. Springer, New York, NY. [Google Scholar]
- Powell DR, DaCosta CM, Gay J, Ding ZM, Smith M, Greer J, Doree D, Jeter‐Jones S, Mseeh F, Rodriguez LA, Harris A, Buhring L, Platt KA, Vogel P, Brommage R, Shadoan MK, Sands AT & Zambrowicz B (2013). Improved glycemic control in mice lacking Sglt1 and Sglt2. Am J Physiol Endocrinol Metab 304, E117–E130. [DOI] [PubMed] [Google Scholar]
- Santer R, Groth S, Kinner M, Dombrowski A, Berry GT, Brodehl J, Leonard JV, Moses S, Norgren S, Skovby F, Schneppenheim R, Steinmann B & Schaub J (2002). The mutation spectrum of the facilitative glucose transporter gene SLC2A2 (GLUT2) in patients with Fanconi‐Bickel syndrome. Hum Genet 110, 21–29. [DOI] [PubMed] [Google Scholar]
- Santer R, Hillebrand G, Steinmann B & Schaub J (2003. a). Intestinal glucose transport: evidence for a membrane traffic‐based pathway in humans. Gastroenterology 124, 34–39. [DOI] [PubMed] [Google Scholar]
- Santer R, Kinner M, Lassen CL, Schneppenheim R, Eggert P, Bald M, Brodehl J, Daschner M, Ehrich JH, Kemper M, Li Volti S, Neuhaus T, Skovby F, Swift PG, Schaub J & Klaerke D (2003. b). Molecular analysis of the SGLT2 gene in patients with renal glucosuria. J Am Soc Nephrol 14, 2873–2882. [DOI] [PubMed] [Google Scholar]
- Scafoglio C, Hirayama BA, Kepe V, Liu J, Ghezzi C, Satyamurthy N, Moatamed NA, Huang J, Koepsell H, Barrio JR & Wright EM (2015). Functional expression of sodium‐glucose transporters in cancer. Proc Natl Acad Sci USA 112, E4111–E4119. [DOI] [PMC free article] [PubMed] [Google Scholar]
- Segel IH (1975). Enzyme kinetics: Behavior and analysis of rapid equilibrium and steady state kinetics. John Wiley & Sons, Inc, New York. [Google Scholar]
- Stumpel F, Burcelin R, Jungermann K & Thorens B (2001). Normal kinetics of intestinal glucose absorption in the absence of GLUT2: evidence for a transport pathway requiring glucose phosphorylation and transfer into the endoplasmic reticulum. Proc Natl Acad Sci USA 98, 11330–11335. [DOI] [PMC free article] [PubMed] [Google Scholar]
- Suckow C, Kuntner C, Chow P, Silverman R, Chatziioannou A & Stout D (2009). Multimodality rodent imaging chambers for use under barrier conditions with gas anesthesia. Mol Imaging Biol 11, 100–106. [DOI] [PMC free article] [PubMed] [Google Scholar]
- Thorens B, Guillam MT, Beermann F, Burcelin R & Jaquet M (2000). Transgenic reexpression of GLUT1 or GLUT2 in pancreatic beta cells rescues GLUT2‐null mice from early death and restores normal glucose‐stimulated insulin secretion. J Biol Chem 275, 23751–23758. [DOI] [PubMed] [Google Scholar]
- Vallon V (2011). Molecular determinants of renal glucose reabsorption. Focus on ‘Glucose transport by human renal Na+/D‐glucose cotransporters SGLT1 and SGLT2’. Am J Physiol Cell Physiol 300, C6–C8. [DOI] [PMC free article] [PubMed] [Google Scholar]
- Vallon V, Platt KA, Cunard R, Schroth J, Whaley J, Thomson SC, Koepsell H & Rieg T (2010). SGLT2 mediates glucose reabsorption in the early proximal tubule. J Am Soc Nephrol 22, 104–112. [DOI] [PMC free article] [PubMed] [Google Scholar]
- Vrhovac I, Balen Eror D, Klessen D, Burger C, Breljak D, Kraus O, Radovic N, Jadrijevic S, Aleksic I, Walles T, Sauvant C, Sabolic I & Koepsell H (2015). Localizations of Na‐D‐glucose cotransporters SGLT1 and SGLT2 in human kidney and of SGLT1 in human small intestine, liver, lung, and heart. Pflügers Arch 467, 1881–1898. [DOI] [PubMed] [Google Scholar]
- Wong KP, Sha W, Zhang X & Huang SC (2011). Effects of administration route, dietary condition, and blood glucose level on kinetics and uptake of 18F‐FDG in mice. J Nucl Med 52, 800–807. [DOI] [PMC free article] [PubMed] [Google Scholar]
- Wong KP, Zhang X & Huang SC (2013). Improved derivation of input function in dynamic mouse [18F]FDG PET using bladder radioactivity kinetics. Mol Imaging Biol 15, 486–496. [DOI] [PMC free article] [PubMed] [Google Scholar]
- Wright EM (2013). Glucose transport families SLC5 and SLC50. Mol Aspects Med 34, 183–196. [DOI] [PubMed] [Google Scholar]
- Wright EM, Barrio JR, Hirayama B & Kepe V (2014). Tracers for monitoring the activity of sodium/glucose cotransporters in health and disease. United States Patent US 8,845,99 B2.
- Wright EM, Loo, DDF & Hirayama BA (2011). Biology of human sodium glucose transporters. Physiol Rev 91, 733–794. [DOI] [PubMed] [Google Scholar]
- Wright EM, Martin MG & Turk E (2001). Familial glucose‐galactose malabsorption and hereditary renal glycosuria In The Metabolic & Molecular Bases of Inherited Disease, eds Scriver CR, Beaudet AL, Sly WS, Valle D, Childs B, Kinzler KW. & Vogelstein B, pp. 4891–4908. McGraw‐Hill, New York, NY. [Google Scholar]
- Yu AS, Hirayama BA, Timbol G, Liu J, Diez‐Sampedro A, Kepe V, Satyamurthy N, Huang SC, Wright EM & Barrio JR (2013). Regional distribution of SGLT activity in rat brain in vivo. Am J Physiol Cell Physiol 304, C240–C247. [DOI] [PMC free article] [PubMed] [Google Scholar]
- Yu AS, Hirayama BA, Timbol G, Liu, J , Basarah E, Kepe V, Satyamurthy N, Wright EM, Huang S‐C & Barrio JR (2010). Functional expression of SGLTs in rat brain. Am J Physiol Cell Physiol 299, C1277–C1284. [DOI] [PMC free article] [PubMed] [Google Scholar]