Abstract
Obesity, which affects over one-third of reproductive-age women, has negative effects on reproduction and results in oocyte defects in both mice and humans. In this study, we used a mouse model to examine whether the adverse effects of an obesogenic diet, specifically abnormal oocyte spindle formation, mitochondrial metabolism, and lipid accumulation, can be reversed by return to normal weight and metabolic profile. Female C57BL6/J mice were placed on either a high-fat diet (HFD; 35.8% fat and 20.2% protein by nutritional content) or an isocaloric control diet (CD; 13% fat and 25% protein) for six weeks. All mice were then maintained on CD for eight weeks. We found that whereas metabolic parameters (weight, glucose tolerance, and cholesterol levels) of the HFD mice returned to normal after this “diet reversal” period, several oocyte defects were not reversible. Oocytes from the diet reversal mice demonstrated a significantly higher percentage of abnormal meiotic spindles than those from control mice. The HFD diet reversal GV oocytes also had lower mitochondrial membrane potential, lower levels of ATP and citrate, and higher percentages of abnormal lipid accumulation and distribution and abnormally distributed mitochondria than oocytes from control mice. Thus, despite normalization of weight, glucose utilization, and cholesterol levels eight weeks after switching from a high fat to a regular chow, oocytes from diet reversal mice exhibited significantly higher rates of meiotic spindle, lipid, and mitochondrial defects than found in mice maintained on regular chow. These results suggest that the negative effects of an obesogenic diet on oocyte quality are not as reversible as the overall metabolic parameters. These data may provide better insight when counseling obese women regarding reproductive options and success.
Keywords: Meiotic spindle, Obesity, Oocyte quality, Diet reversal
Introduction
Obesity currently affects over one-third of reproductive-age women in the United States [1]. In addition to its effects on overall health and cardiovascular health, obesity also impairs reproductive health. For example, obese women have an increased incidence of anovulation, as well as altered oocyte and embryo quality leading to decreased pregnancy rates[2, 3]. The exact reason behind this negative impact has not yet been identified, but could be secondary to many factors affecting oocyte maturation, including an altered follicular environment [4, 5]. Additionally, once obese women do conceive, they have an increased risk of miscarriage, as well as pregnancy-related morbidity including gestational diabetes, preeclampsia, and cesarean delivery.
Obese and overweight women struggling with infertility are often counseled to lose weight prior to conception. However, the majority of clinical data evaluate weight loss in two specific types of cases. In anovulatory women, a reduction in body mass index can lead to an increase in ovulation and therefore improved fertility [6]. In women who have undergone gastric bypass surgery, the data are currently unclear as to whether or not rapid weight loss leads to overall improved fertility and decreased rates of pregnancy loss [7-11]. Furthermore, this patient population does not represent patients who have lost weight through non-surgical methods. Studying the effects of weight loss on fertility in humans has proven to be difficult, as complete lifestyle changes with total reversibility of an obesogenic diet is not realistic for most patients [12]. Thus, little research has been performed to evaluate the reversibility of negative effects of obesity in the setting of a healthy diet and weight loss.
The mouse has proved to be a useful model for addressing the impact of obesity on reproduction. In such studies, mice are fed a high-fat diet (HFD) to recapitulate obesity, hypercholesterolemia, and glucose intolerance [13]. After consuming an HFD for a period as short as four weeks, C57Bl/6J mice recapitulate many of the oocyte defects observed in obese women, including abnormal architecture of the Meiosis II spindle [14], distorted mitochondrial distribution [14], altered mitochondrial membrane potential[15], and abnormal mitochondrial morphology by electron microscopy [14]. In this study, we have used this mouse model of obesity to ask whether any of the oocyte defects can be reversed by exposure to a non-obesogenic diet and return to normal weight.
Results
Metabolic parameters and reversibility of obese phenotype
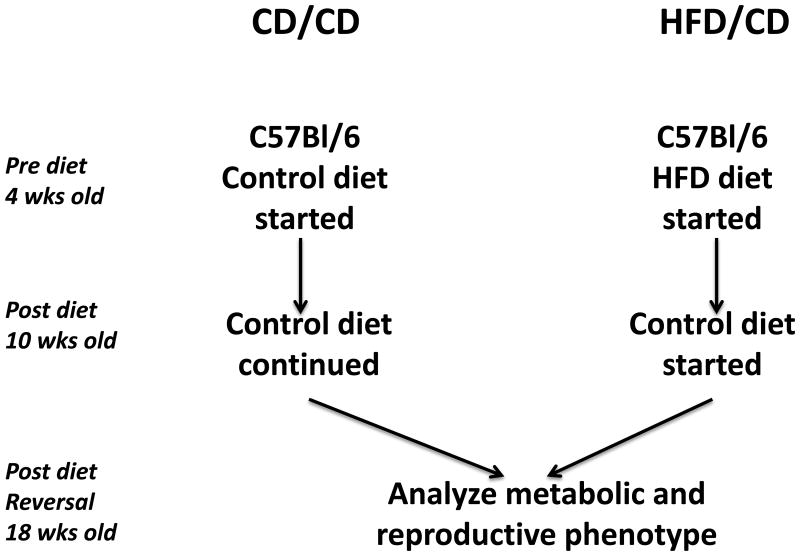
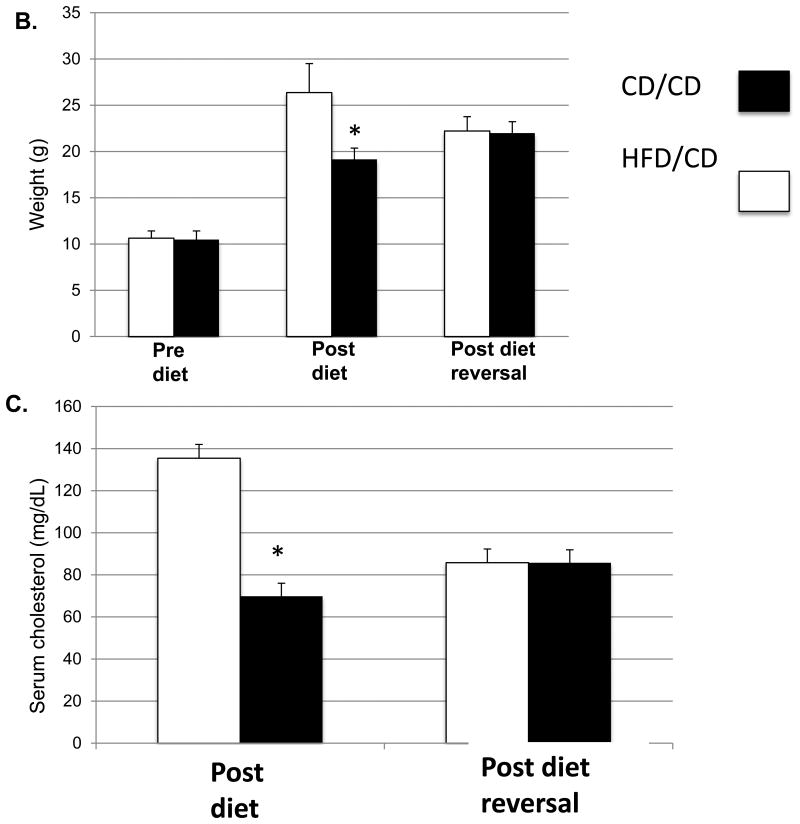
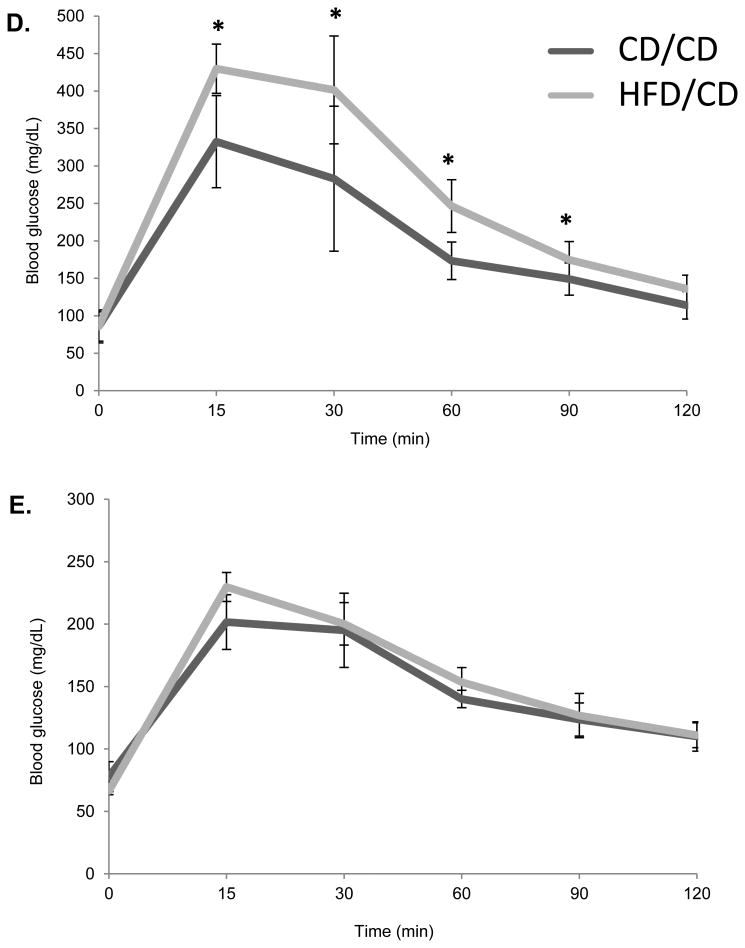
We aimed to model the effects of weight loss after obesity in mice. Thus, we maintained mice on either a high-fat diet (HFD) or control diet (CD) beginning at four weeks of age (defined as the Pre Diet time point (Figure 1A). After six weeks on the respective diets, also referred to as the Post Diet time point, mice on the CD were maintained on the CD for another eight weeks (CD/CD group), whereas those on the HFD were switched to the CD for eight more weeks (HFD/CD group). This final time point is referred to as Post Diet Reversal time point. We first confirmed that the HFD induced the expected metabolic effects. After 6 weeks on the HFD, the HFD/CD mice were significantly heavier than mice on CD/CD (Figure 1B; Post Diet time point) and were hypercholesterolemic (Figure 1C) and glucose intolerant (Figure 1D). After 8 weeks on a control diet, at the Post Diet Reversal time point, the HFD effects on weight, cholesterol levels, and glucose tolerance were reversed in the HFD/CD group, making them indistinguishable from the CD/CD group (Figures 1B-D). Additionally, serum levels of triglycerides (85.75 mg/dl ± 6.56 vs. 85.71 mg/dl ± 6.19, P=0.99) and non-esterified fatty acids (1.102 mg/dl ± 0.38 vs. 1.54 ± 0.57, P=0.08) did not differ between HFD/CD and CD/CD mice at the Post Diet Reversal time point. Together, these data confirm that return to CD for eight weeks fully reversed the metabolic effects of exposure to HFD.
Figure 1. The metabolic effects of obesity are reversible.
(A) Experimental design for the study. Female C57BL/6J mice aged four weeks were placed on either HFD or CD at the Pre Diet Time point. After six weeks on the diet, labeled the Post Diet time point, metabolic parameters were assessed, and both groups of mice were placed on the CD for the subsequent eight weeks. Metabolic parameters were again assessed at this Post Diet Reversal time point. The two groups of mice are the CD/CD mice, on the control diet throughout the experiment, and the HFD/CD mice, placed on a HFD for 6 week and then switch to the CD for another 8 weeks. (B) Mouse weights were measured at all three time points. Serum Cholesterol (C) and Glucose tolerance tests (D and E) were performed at the Post Diet and Post Diet Reversal time points. N = 7 per group. * P < 0.05.
Oocyte spindle defects are not reversible
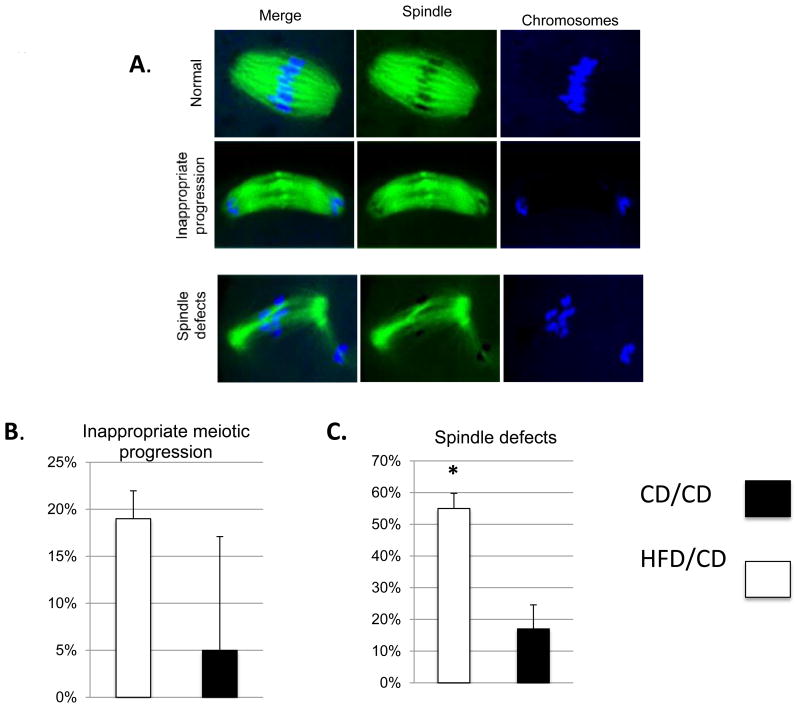
Obesity negatively affects the meiotic spindle of oocytes in obese women [2] and in mice, HFD exposure for as little as four weeks results in abnormally fragmented spindles and disturbance of chromosomes [14]. We aimed to determine whether these negative effects were reversible in the oocytes after the phenotypic effects of the obesogenic diet were reversed. We collected ovulated meiosis II (MII) oocytes from CD/CD and HFD/CD mice at the Post Diet Reversal time point. These oocytes were fixed on slides, immunolabeled with a β-tubulin antibody to visualize the spindle, co-stained with TO-PRO to visualize chromosomes, and subjected to confocal microscopy. We classified appearance of the spindles into three groups: “normal”, in which chromosomes aligned on the metaphase plates and the spindle was uniform; “inappropriate progression”, in which oocytes were out of phase; and “abnormal”, in which the metaphase spindles were disordered. Most control MII oocytes had a typical barrel-shaped spindle and well-aligned chromosomes on the metaphase plate (Figure 2A). In the CD/CD group, only 17.0 ± 7.6% and 5.0 ± 12.1% of oocyte spindles were categorized as “abnormal” and “inappropriate progression”, respectively (n = 40; Figure 2B and C). In contrast, 55 ± 5.8% and 19 ± 3.0% of the spindles from the HFD/CD group oocytes were categorized as “abnormal” and “inappropriate progression”, respectively (n=57; Figure 2B and C). The increased frequency of spindle defects was statistically significant (P<0.05). These data indicate that the oocyte spindle and chromosomal abnormalities caused by the obese phenotype in a mouse model are not entirely reversible even with correction of the metabolic abnormalities.
Figure 2. Obesity-induced oocyte spindle defects and chromosome misalignment are not reversible.
(A) Examples of the categories of spindles in ovulated MII oocytes from CD/CD and HFD/CD mice. Spindles were stained with β-tubulin antibody (green) and TO-PRO (blue). (B) Quantification of spindle phenotypes. Data are expressed as mean percentage ± SD. *, P < 0.05 vs. control. NEED NS
Oocyte lipid distribution defects are not reversible
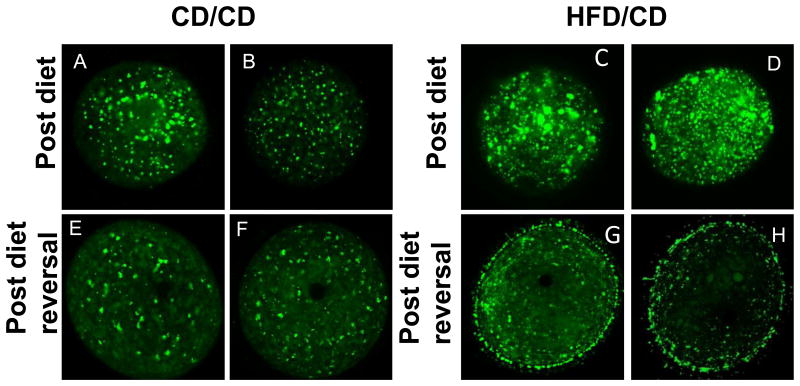
Abnormal lipid accumulation and distribution within oocytes has been demonstrated in mice on an obesogenic diet for as little as four weeks[15]. We first confirmed that the HFD resulted in alterations in lipid distribution by staining germinal vesicle (GV)-stage oocytes with BODIPY, a lipid-specific dye, at the Post Diet time point. As expected, the oocytes collected from the HFD/CD mice at the Post Diet time point demonstrated abnormal lipid accumulation and distribution. BODIPY staining was brighter and in larger aggregates in oocytes from the HFD/CD mice (Figure 3C and D) as compared to the CD/CD mice (Figure 3A and B). Next, we stained GV oocytes from CD/CD and HFD/CD mice with BODIPY at the Post Diet Reversal time point. Whereas those from the control group appeared identical to the Post Diet time point since nothing had changed (Figure 3E and D), those from the HFD/CD group showed abnormal lipid accumulation despite reversal of the diet (Figure 3G and H). In two out of three experiments, we observed a novel “rimming” or “blebbing” pattern of BODIPY staining in oocytes from mice in the diet reversal group (Figure 3G and H). These data indicate that the abnormal lipid droplet distribution caused by the obese phenotype in a mouse model is not entirely reversible even with correction of the metabolic abnormalities.
Figure 3. Abnormal lipid distribution in GV oocytes from HFD/CD mice.
Representative GV oocytes from CD/CD (A, B, E, and F) and HFD/CD (C, D, G, and H) mice at the Post Diet (top row) and Post Diet reversal (bottom row) timepoints. NEED NS
Mitochondrial function – metabolite levels
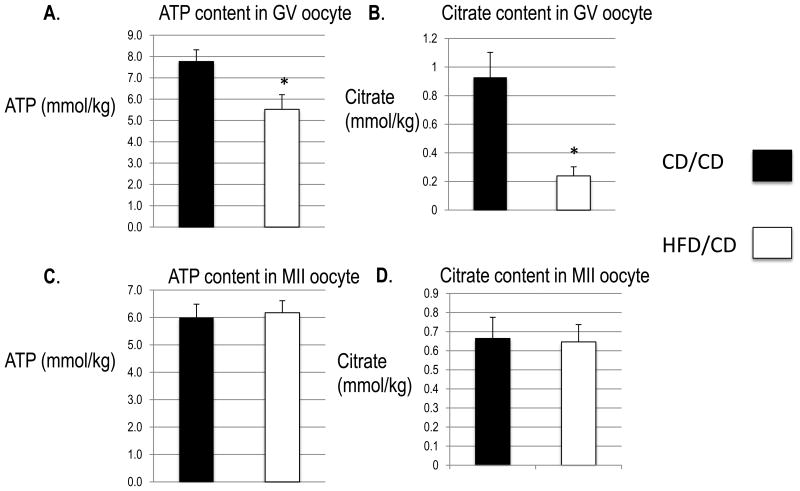
We next wondered whether reversing obesity can reverse mitochondrial function defects in mice. First, we measured citric acid cycle metabolites, which are altered in oocytes from both the diabetic and the obese mouse models [14, 16]. We used microanalytical assays to measure the levels of ATP and citrate in single ovulated oocytes from CD/CD and HFD/CD mice. As shown in Figure 4A, the average ATP levels in the HFD/CD GV oocytes were significantly lower than in CD/CD (5.524 ± 0.177 mmol/kg vs. 7.770 ± 0.141 mmol/kg; n =15 each; P<0.05). Additionally, the average levels of citrate levels were significantly lower in HFD/CD GV oocytes than in CD/CD (0.239 ± 0.016 mmol/kg vs. 0.929 ± 0.045 mmol/kg; n =15 each; P<0.05) (Figure 4B). In contrast, we found no significant differences in either ATP (6.174 ± 0.113 mmol/kg vs. 6.002 ± 0.125 mmol/kg; n =15 each) or citrate (0.646 ± 0.024 mmol/kg vs. 0.664 ± 0.029 mmol/kg; n =15 each) between HFD/CD and CD/CD MII oocytes (Figures 4C and D). The differences at the GV stage may reflect persistent inefficiency of TCA cycle metabolism in the HFD/CD model and indicate that reversal of the metabolic phenotype of obesity and removal of the obesogenic diet does not readily reverse the deleterious effects on the oocyte and mitochondrial metabolism. However, the reversal of these effects in MII oocytes may indicate that a longer diet reversal time will reveal normalization of all parameters in GV oocytes. These data indicate that the abnormal oocyte metabolism caused by the obese phenotype in a mouse model is not entirely reversible even with correction of the metabolic abnormalities.
Figure 4. ATP and citrate levels in GV and MII oocytes.
Both metabolites are expressed as millimoles/kilogram wet weight (mmol/kg) based on the wet weight of each oocyte. Data are represented as mean ± SD. N = 15 for each group. *, P < 0.05 vs. controls.
Mitochondrial membrane potential defects are not reversible
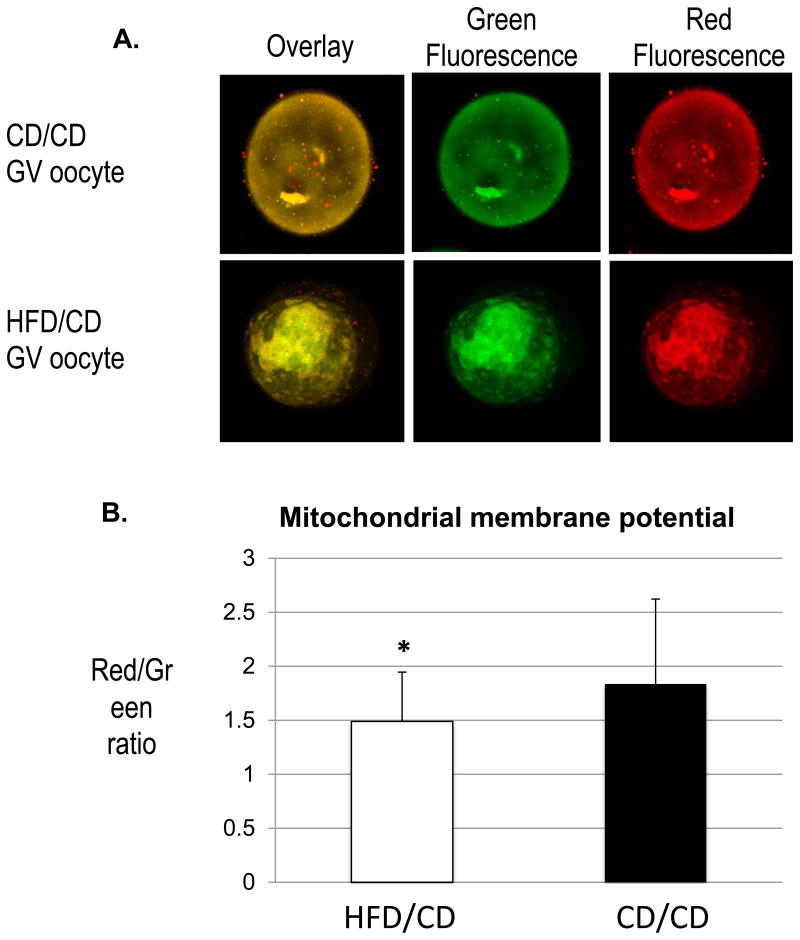
Work from our lab [14, 16] and others [15, 17] has demonstrated altered mitochondrial membrane polarization in oocytes from diabetic and obese mouse models. Thus, we used JC-1, a fluorescent probe that selectively enters mitochondria and reversibly changes color from green to red as the membrane potential increases [18], to compare oocyte mitochondria in control and diet reversal mice. As shown in Figure 5A, mitochondria in oocytes from CD/CD and HFD/CD mice were a combination of both low and high membrane potential organelles, as evident by the green and red fluorescence. For quantitative analysis, we measured the intensity of red and green fluorescence and calculated the ratio of red/green to characterize the membrane potential. This ratio was significantly lower in the GV oocytes of HFD/CD mice than in those of CD/CD mice (1.489 ±0.46 vs. 1.83±0.79; *p<0.05). This finding suggests that reversal of the metabolic phenotype seen in obesity does not reverse the mitochondrial damage.
Figure 5. Decreased mitochondrial membrane potential in diet reversal oocytes.
(A) Representative images of oocytes stained with JC-1. (B) Quantification of the ratio of red to green fluorescence intensity. Data are represented as mean ± SD. * P<0.05 vs controls. NEED NS
Mitochondrial distribution defects are not reversible
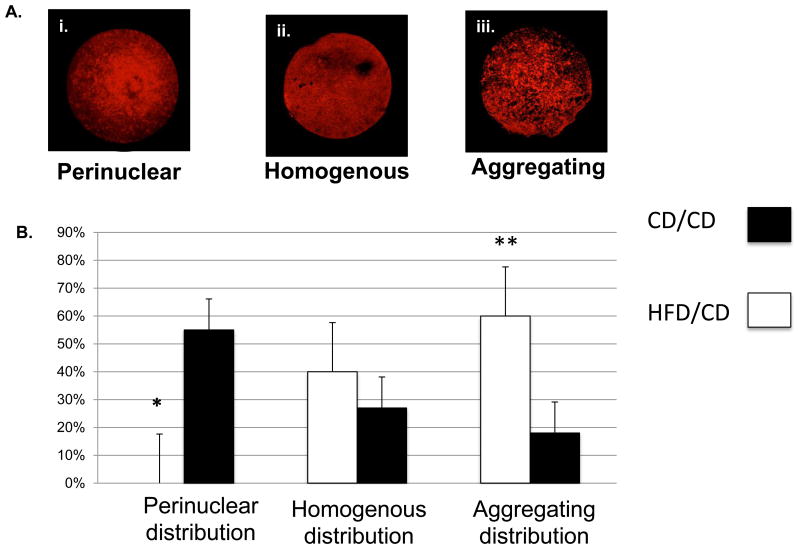
Mitochondria can serve as a useful indicator of the ability of a cell to adapt and react to its surroundings, as evidenced by several previous studies [19]. During oocyte maturation, mitochondria undergo stage-specific changes [20] that are critical for progression from the immature GV stage to mature form that is capable of fertilization. The GV stage is characterized by a perinuclear distribution of mitochondria, which progresses to a more homogenous appearance with localization to the meiotic spindle in the more mature oocyte [21]. Alterations in this mitochondrial distribution may affect not only the energetics of the oocyte, but also its capacity to undergo proper maturation and thus become receptive to fertilization. We have previously shown that mitochondrial distribution is altered in oocytes from diabetic mice [14, 16], so here we used MitoTracker staining to compare patterns of mitochondrial distribution between GV oocytes from CD/CD and HFD/CD. We classified mitochondrial distribution patterns in GV oocytes into three different categories: (i) “perinuclear”, in which mitochondria surrounded the nucleus; (ii) “homogeneous”, in which mitochondria were evenly spread throughout the cytoplasm; and (iii) “aggregating”, in which mitochondria aggregated in the cytoplasm (Figure 6A). As reported previously [21], we observed perinuclear mitochondria in the majority of CD/CD GV oocytes. Significantly fewer GV oocytes from HFD/CD mice than CD/CD mice showed a perinuclear distribution of mitochondria (0% vs. 55%; *p<0.05). Conversely, significantly more oocytes from HFD/CD mice than from CD/CD mice showed the aggregating distribution pattern of mitochondria (60% vs. 18% control, **p<0.05; Figure 6B). These results indicate a persistent abnormal redistribution of mitochondria in GV oocytes from HFD/CD mice, despite correction of the metabolic phenotypes associated with obesity.
Figure 6. Normal mitochondrial distribution is altered in diet reversal mice.
(A) Representative examples of the three categories of mitochondrial distribution. (B) Quantification of GV oocytes with each mitochondrial distribution pattern from CD/CD and HFD/CD. Data are represented as mean ± SD. * P<0.05 vs. controls. NEED NS
Discussion
Here we sought to determine to what extent weight loss and reversal of the metabolic effects of obesity can reverse reproductive abnormalities caused by obesity. This information is crucial for counseling obese patients who wish to conceive. In contrast to human subjects in whom mandating a controlled, balanced, isocaloric diet is exceedingly difficult, our mouse model allowed for a drastic change in diet. Our experiment therefore served as a model of pure weight loss, in the absence of increased exercise, in a controlled environment. Interestingly, despite reversal of the metabolic phenotypes of obesity, the diet reversal mice did not show reversal of the negative effects of the HFD at the level of the oocyte. Spindle defects persisted in the diet reversal model, as did changes in lipid accumulation, alterations in TCA cycle metabolite levels and mitochondrial membrane potential, and abnormalities in mitochondrial distribution. We suspect that these persistent abnormalities occur as a result of oxidative and lipotoxic damage that is not readily reversible. Accumulation of supraphysiologic levels of free fatty acids, such as is seen in the HFD mouse, may lead to the formation of cytotoxic and highly reactive lipid peroxides, which can be especially damaging to oocyte mitochondria [15]. In previous work, we have observed an increased percentage of abnormal appearing mitochondria with irregular, disorganized cristae and vacuolization[14]. The formation and organization of cristae depends on the activity and assembly of the ATP synthase complex [22]. Thus, future studies will examine the effect of the HFD diet on expression and function of this complex.
It remains unclear why the effects of obesity would not be reversible in the oocytes. It is possible that oxidative damage could result in an inability of the oocyte to replicate healthy mitochondria to replace the damaged organelles during the progression from primary follicle to GV stage to a mature MII oocyte [19], thus severely compromising reproductive energetics. We have previously shown that mice fed an HFD experience a significant increase in mitochondrial DNA (mtDNA) copy number and increased expression of PGC1alpha, a marker of mitochondrial biogenesis [14]. We concluded that this was a compensatory response, and perhaps this compensation significantly compromised the energetics of the oocyte. Alternatively, this increase in mtDNA copy number could be due to an error in the removal of damaged mitochondria by the process of mitophagy. Either response could result in the phenotype seen and will be investigated in future studies.
Caution is required when using fluorescent dyes such as JC-1 to measure mitochondrial membrane potential because measurements can be influenced by the dye-loading protocol, dye concentration, export of dye from the mitochondria [23, 24], and the membrane potential of the plasma membrane, which may be altered by experimental manipulations[24]. Furthermore, the red aggregated signal has been reported to be affected by factors other than membrane potential[25]. Nonetheless, our findings, along with the altered mitochondrial distribution, are consistent with our hypothesis that mitochondrial damage caused by obesity persist well into the reversal phase of an obesogenic diet.
Interestingly, whereas ATP and citrate levels differed between GV oocytes from diet reversal and control mice, levels of these metabolites did not differ between the MII oocytes from diet reversal and control mice. Perhaps the oocytes with dysfunctional energetics at the GV stage did not survive or progress, so those observed at the MII stage were those with more normal energetics or those that were able to self-correct to generate sufficient ATP and citrate to progress normally through meiosis. These findings reflect the theory that bioenergetic defects that reduce net cytoplasmic ATP levels below a stage-specific threshold compromise the progression of oocyte maturation and preimplantation embryogenesis.
One of the more novel and surprising findings from our diet reversal model was the appearance of diet reversal cohort GV oocytes when stained with the lipophilic dye, BODIPY. We at least four weeks of exposure to HFD results in oocytes with increased lipid density [14]. In our diet reversal model, we expected to see either normal lipid distribution or persistence of the abnormalities seen in the HFD model. Instead, oocytes from the diet reversal mice exhibited a novel “rimming” appearance of lipid distribution. This pattern appears similar to the blebbing demonstrated by oocytes that have been subjected to oxidative stress in the form of microgravity [26], as well as by oocytes that are undergoing DNA fragmentation and apoptosis [27]. This “blebbing” or “rimming” pattern seen in HFD GV oocytes could also be explained by the oocyte attempting to exocytose the excess lipid deposited during the period of HFD feeding. If this rimming pattern is caused by the oocyte attempting to move excess lipid out of the cell to regain a more physiologic state, this process would require additional energy in the form of ATP; this would place an additional strain on the oocyte, which is already in a state of altered bioenergetics. Further studies are required to confirm and explain these findings.
We have used a model of weight loss to simulate a “diet reversal” of the effects of an obesogenic diet. Our findings have demonstrated that, although the obese phenotype created by six weeks of HFD feeding is reversible within eight weeks, the deleterious effects on the oocyte caused by the obese environment are not reversible in this timeframe. These findings are clinically quite important, as patients are often told to lose weight before undergoing fertility treatment, the theory being that weight loss will help them conceive. Although losing weight can increase rates of ovulation in anovulatory, obese women[6], the effects of weight loss on fertility and oocyte quality in obese women is unclear. The findings we present here suggest that weight loss, at least in the short term, does not in fact improve oocyte quality and that obesity may have longer-lasting effects on the oocyte and reproduction than originally assumed.
Materials and Methods
Animals and diet
This study was carried out in strict accordance with the recommendations in the Guide for the Care and Use of Laboratory Animals of the National Institutes of Health. The protocol was approved by the IACUC-accredited Animal Studies Committee of Washington University School of Medicine [Study # 20120051]. Female C57BL/6J mice [Jackson Laboratories, Bar Harbor, ME] aged four weeks were housed five per cage. Experimental timeline, with diet interventions, is shown in Figure 1. Beginning at the Pre Diet time point (four weeks of age), mice were fed either a high-fat diet (HFD; Diet 58R3; TestDiet, Richmond, IN; containing 35.8% fat and 20.2% protein by nutritional content) or an isocaloric control diet (CD; PicoLab Mouse diet 20; LabDiet; Richmond, IN; containing 13% fat and 25% protein) for six weeks. At the Post Diet time point, after 6 weeks of either CD or HFD, the mice originally fed the HFD were switched to the CD for a period of 8 weeks, at which time it was confirmed that all metabolic parameters normalized. Mice originally fed the CD were maintained on the CD for and additional 8 weeks (Figure 1). This last time point is the Post Diet Reversal time point. Weights were recorded weekly for all animals from the Pre Diet time point through the Post Diet Reversal time point. All mice were humanely sacrificed and evaluated after the Post Diet Reversal time point, at the completion of the experiment.
Imaging of meiotic spindle
Mice from both diet groups were initially injected intraperitoneally with 10 IU of pregnant mare serum gonadotropin (PMSG), followed by 5 IU of human chorionic gonadotropin 48 hours later. After 12 to 14 hours, mice were sacrificed, and cumulus-enclosed oocytes were collected from the ampulla. Visualization of oocyte spindle and chromosome organization was conducted by an observer blinded to the treatment regimen as previously described [16]. A confocal microscope (Meta 510; Carl Zeiss, Germany) was used for fluorescence microscopy. Each experiment was performed in triplicate. In total, we evaluated 57 and 40 Meiosis II spindles from 9 HFD/CD and 8 CD/CD mice, respectively.
BODIPY analysis of GV oocytes
Mice from both diet groups were injected intraperitoneally with 10 IU PMSG. After 46 to 48 hours, mice were sacrificed, and germinal vesicle (GV)-stage oocytes were obtained by mechanically mincing the ovaries in warmed media. The lipid-specific lipophilic dye BODIPY 493/503 (Invitrogen) was used to localize lipid droplets as previously described [28].
Measurement of metabolite levels
Denuded GV oocytes were frozen on a glass slide by dipping in isopentane equilibrated with liquid nitrogen. After freeze-drying overnight under vacuum at −35°C, the oocytes were extracted in a nanoliter volume under oil. ATP and citrate levels were measured by using an enzyme-linked assay as previously described [29]. At least 15 oocytes in each group were analyzed for each experiment.
Analysis of mitochondrial membrane polarization
Mitochondrial membrane potential was assessed by using the MitoPT-JC1 assay kit (#924; Immunochemistry, Bloomington, MN). Briefly, cumulus-enclosed oocytes were incubated in assay buffer with JC-1 for 15 min at 37°C. After two washes, cells were mounted on slides with a drop of assay buffer and then examined with a fluorescence microscope. The ratios of red/green fluorescence intensity were calculated to characterize the membrane potential [30, 31]. Ten different regions from each of seven oocytes in each group were randomly selected. Fluorescence intensities in these regions were measured and quantified with Image J (National Institute of Health).
Mitochondrial distribution
GV oocytes were cultured in M2 medium containing 200 nM MitoTracker Red (Molecular Probes, Eugene, OR) for 30 min at 37°C. After washes, samples were mounted on glass slides and immediately analyzed by confocal microscopy (Meta 510; Carl Zeiss, Germany).
Acknowledgments
Funding: This work was funded by grant from the National Institutes of Health T32 HD0040135-11 (KAR) and from the American Diabetes Association (KHM).
Footnotes
Author Contributions: K.H.M. and K.A.R. conceived and designed the experiments. K.A.R. and A.L.B performed the experiments. K.A.R analysed the data. K.A.R and Q.W. contributed reagents/materials/analysis tools. K.A.R and K.H.M. wrote the paper.
References
- 1.Ogden CL, et al. Prevalence of obesity and trends in body mass index among US children and adolescents, 1999-2010. JAMA. 2012;307(5):483–90. doi: 10.1001/jama.2012.40. [DOI] [PMC free article] [PubMed] [Google Scholar]
- 2.Machtinger R, et al. The association between severe obesity and characteristics of failed fertilized oocytes. Hum Reprod. 2012;27(11):3198–207. doi: 10.1093/humrep/des308. [DOI] [PubMed] [Google Scholar]
- 3.Shah DK, et al. Effect of obesity on oocyte and embryo quality in women undergoing in vitro fertilization. Obstet Gynecol. 2011;118(1):63–70. doi: 10.1097/AOG.0b013e31821fd360. [DOI] [PubMed] [Google Scholar]
- 4.Jungheim ES, et al. Diet-induced obesity model: abnormal oocytes and persistent growth abnormalities in the offspring. Endocrinology. 2010;151(8):4039–46. doi: 10.1210/en.2010-0098. [DOI] [PMC free article] [PubMed] [Google Scholar]
- 5.Valckx SD, et al. BMI-related metabolic composition of the follicular fluid of women undergoing assisted reproductive treatment and the consequences for oocyte and embryo quality. Hum Reprod. 2012;27(12):3531–9. doi: 10.1093/humrep/des350. [DOI] [PubMed] [Google Scholar]
- 6.Jungheim ES, Moley KH. Current knowledge of obesity's effects in the pre- and periconceptional periods and avenues for future research. Am J Obstet Gynecol. 2010;203(6):525–30. doi: 10.1016/j.ajog.2010.06.043. [DOI] [PMC free article] [PubMed] [Google Scholar]
- 7.Tan O, Carr BR. The impact of bariatric surgery on obesity-related infertility and in vitro fertilization outcomes. Semin Reprod Med. 2012;30(6):517–28. doi: 10.1055/s-0032-1328880. [DOI] [PubMed] [Google Scholar]
- 8.Shah DK, Ginsburg ES. Bariatric surgery and fertility. Curr Opin Obstet Gynecol. 2010;22(3):248–54. doi: 10.1097/GCO.0b013e3283373be9. [DOI] [PubMed] [Google Scholar]
- 9.Magdaleno R, Jr, et al. Pregnancy after bariatric surgery: a current view of maternal, obstetrical and perinatal challenges. Arch Gynecol Obstet. 2012;285(3):559–66. doi: 10.1007/s00404-011-2187-0. [DOI] [PubMed] [Google Scholar]
- 10.Musella M, et al. Effect of bariatric surgery on obesity-related infertility. Surg Obes Relat Dis. 2012;8(4):445–9. doi: 10.1016/j.soard.2011.09.021. [DOI] [PubMed] [Google Scholar]
- 11.Guelinckx I, Devlieger R, Vansant G. Reproductive outcome after bariatric surgery: a critical review. Hum Reprod Update. 2009;15(2):189–201. doi: 10.1093/humupd/dmn057. [DOI] [PubMed] [Google Scholar]
- 12.Mutsaerts MA, et al. Dropout is a problem in lifestyle intervention programs for overweight and obese infertile women: a systematic review. Hum Reprod. 2013;28(4):979–86. doi: 10.1093/humrep/det026. [DOI] [PubMed] [Google Scholar]
- 13.Rinnankoski-Tuikka R, et al. Effects of high-fat diet and physical activity on pyruvate dehydrogenase kinase-4 in mouse skeletal muscle. Nutr Metab (Lond) 2012;9(1):53. doi: 10.1186/1743-7075-9-53. [DOI] [PMC free article] [PubMed] [Google Scholar]
- 14.Luzzo KM, et al. High fat diet induced developmental defects in the mouse: oocyte meiotic aneuploidy and fetal growth retardation/brain defects. PLoS One. 2012;7(11):e49217. doi: 10.1371/journal.pone.0049217. [DOI] [PMC free article] [PubMed] [Google Scholar]
- 15.Wu LL, et al. High-fat diet causes lipotoxicity responses in cumulus-oocyte complexes and decreased fertilization rates. Endocrinology. 2010;151(11):5438–45. doi: 10.1210/en.2010-0551. [DOI] [PubMed] [Google Scholar]
- 16.Wang Q, et al. Maternal diabetes causes mitochondrial dysfunction and meiotic defects in murine oocytes. Mol Endocrinol. 2009;23(10):1603–12. doi: 10.1210/me.2009-0033. [DOI] [PMC free article] [PubMed] [Google Scholar]
- 17.Igosheva N, et al. Maternal diet-induced obesity alters mitochondrial activity and redox status in mouse oocytes and zygotes. PLoS One. 2010;5(4):e10074. doi: 10.1371/journal.pone.0010074. [DOI] [PMC free article] [PubMed] [Google Scholar]
- 18.Smiley ST, et al. Intracellular heterogeneity in mitochondrial membrane potentials revealed by a J-aggregate-forming lipophilic cation JC-1. Proc Natl Acad Sci U S A. 1991;88(9):3671–5. doi: 10.1073/pnas.88.9.3671. [DOI] [PMC free article] [PubMed] [Google Scholar]
- 19.Van Blerkom J. Mitochondrial function in the human oocyte and embryo and their role in developmental competence. Mitochondrion. 2011;11(5):797–813. doi: 10.1016/j.mito.2010.09.012. [DOI] [PubMed] [Google Scholar]
- 20.Van Blerkom J. Mitochondria in human oogenesis and preimplantation embryogenesis: engines of metabolism, ionic regulation and developmental competence. Reproduction. 2004;128(3):269–80. doi: 10.1530/rep.1.00240. [DOI] [PubMed] [Google Scholar]
- 21.Dumollard R, Duchen M, Sardet C. Calcium signals and mitochondria at fertilisation. Semin Cell Dev Biol. 2006;17(2):314–23. doi: 10.1016/j.semcdb.2006.02.009. [DOI] [PubMed] [Google Scholar]
- 22.Paumard P, et al. The ATP synthase is involved in generating mitochondrial cristae morphology. EMBO J. 2002;21(3):221–30. doi: 10.1093/emboj/21.3.221. [DOI] [PMC free article] [PubMed] [Google Scholar]
- 23.Perry SW, et al. Mitochondrial membrane potential probes and the proton gradient: a practical usage guide. Biotechniques. 2011;50(2):98–115. doi: 10.2144/000113610. [DOI] [PMC free article] [PubMed] [Google Scholar]
- 24.Duchen MR. Mitochondria in health and disease: perspectives on a new mitochondrial biology. Mol Aspects Med. 2004;25(4):365–451. doi: 10.1016/j.mam.2004.03.001. [DOI] [PubMed] [Google Scholar]
- 25.Chinopoulos C, Tretter L, Adam-Vizi V. Depolarization of in situ mitochondria due to hydrogen peroxide-induced oxidative stress in nerve terminals: inhibition of alpha-ketoglutarate dehydrogenase. J Neurochem. 1999;73(1):220–8. doi: 10.1046/j.1471-4159.1999.0730220.x. [DOI] [PubMed] [Google Scholar]
- 26.Wu C, et al. Simulated microgravity compromises mouse oocyte maturation by disrupting meiotic spindle organization and inducing cytoplasmic blebbing. PLoS One. 2011;6(7):e22214. doi: 10.1371/journal.pone.0022214. [DOI] [PMC free article] [PubMed] [Google Scholar]
- 27.Jin X, et al. Apotosis in ovary. Front Biosci (Schol Ed) 2011;3:680–97. doi: 10.2741/s180. [DOI] [PubMed] [Google Scholar]
- 28.Jimenez PT, et al. DHEA-mediated inhibition of the pentose phosphate pathway alters oocyte lipid metabolism in mice. Endocrinology. 2013;154(12):4835–44. doi: 10.1210/en.2012-2140. [DOI] [PMC free article] [PubMed] [Google Scholar]
- 29.Chi MM, Hoehn A, Moley KH. Metabolic changes in the glucose-induced apoptotic blastocyst suggest alterations in mitochondrial physiology. Am J Physiol Endocrinol Metab. 2002;283(2):E226–32. doi: 10.1152/ajpendo.00046.2002. [DOI] [PubMed] [Google Scholar]
- 30.Park DW, et al. ATP-induced apoptosis of human granulosa luteal cells cultured in vitro. Fertil Steril. 2003;80(4):993–1002. doi: 10.1016/s0015-0282(03)01118-x. [DOI] [PubMed] [Google Scholar]
- 31.Wadia JS, et al. Mitochondrial membrane potential and nuclear changes in apoptosis caused by serum and nerve growth factor withdrawal: time course and modification by (-)-deprenyl. J Neurosci. 1998;18(3):932–47. doi: 10.1523/JNEUROSCI.18-03-00932.1998. [DOI] [PMC free article] [PubMed] [Google Scholar]


