

ABSTRACT
A role of the transcription factor Krüppel-like factor 4 (KLF4) in the generation of mature plasma cells (PC) is unknown. Indeed, KLF4 is critical in controlling the differentiation of various cell linages, particularly monocytes and epithelial cells. KLF4 is expressed at low levels in pro-B cells and its expression increases as they mature into pre-B cells, resting naïve B cells and memory B cells. We show here that KLF4 is expressed in human bone marrow plasma cells and its function was studied using an in vitro model of differentiation of memory B cells into long lived plasma cells. KLF4 is rapidly lost when memory B cells differentiate into highly cell cycling plasmablasts, poorly cycling early plasma cells and then quiescent long-lived plasma cells. A forced expression of KLF4 in plasmablasts enhances the yield of their differentiation into early plasma cell and long lived plasma cells, by inhibiting apoptosis and upregulating previously unknown plasma cell pathways.
KEYWORDS: B cell, differentiation, KLF4, maturation, Plasma cell
Introduction
Plasma cells (PCs), the sole producers of immunoglobulins, are crucial for an effective immune response, yet they can cause severe autoimmune diseases and cancers (multiple myeloma). PCs can survive for years in the bone marrow or mucosas in vivo, insuring long-term immune memory. So, the differentiation of B cells into PCs and survival of PCs need to be tightly controlled.1 Krüppel-like factors are a family of transcription factors, which are essential in major biologic processes including development, proliferation, differentiation, and apoptosis.
A main function of KLF4 is to block cell cycle by inducing expression of CDKN1A gene coding for the p21Cip1 cell cycle inhibitor, in cooperation with p53.2 KLF4 also induces expression of CDKN1B gene coding for the p27Kip1, another cell cycle inhibitor.3 But, whereas KLF4 acts in synergy with p53 to inhibit cell cycle, KLF4 counteracts its apoptotic activity.4 KLF4 is detected in the mouse embryo, with the highest expression occurring in the later stages. Its expression is most important in the intestine, where it mediates the switch from transit-amplifying cells to the various differentiated cell types in the colonic crypts.5,6 KLF4 is also expressed in the lung, skin, testis, thymus, cornea, cardiac myocytes and lymphocytes where it appears to be involved in a wide variety of cellular processes, including protein and cholesterol synthesis, transcription, cell growth, and DNA repair.5
In T cells, KLF4 is directly targeted by ELF4, suggesting that KLF4 functions to maintain T-cell quiescence downstream of ELF4, likely by activating p21CIP1 in CD8+ T cells.7 ELF4 is a transcription factor controlling balance between activation and quiescence in haematopoietic stem cells.8,9 ELF4 expression is significantly downregulated in acute myeloid leukemia suggesting a tumor suppressor function in haematopoietic stem cells.8,10 ELF4 activates KLF4 in the T cell antigen receptor signaling pathway.8 Furthermore, KLF4 was shown to be involved in differentiation of functional memory CD8+ T cells in response to infection.11 KLF4 is expressed in a stage-specific manner during myelopoiesis and regulates monocyte commitment, differentiation, and macrophage activation. Actually, PU.1, an important ETS transcription factor for specifying progenitor cell fate along macrophages, granulocytes, B and T cells and NK lineages, binds KLF4 promoter.7,12,13
KLF4 is expressed at low levels in pro-B cells and its expression increases as they mature into pre-B cells, resting naïve B cells (NBCs) and memory B cells (MBCs).14 Overexpression of KLF4 in proliferating B cells induces the cell cycle inhibitor p21Cip1, resulting in G1 cell-cycle arrest. KLF4 is a target gene of FOXO1, and accounts for FOXO1 cell cycle inhibition in B cells.15 KLF4 is also important in secondary immune responses. A study has shown that MBCs, which are rapidly activated during secondary responses express lower levels of KLF4 and KLF9 than naïve B cells.16 Overexpression of KLF4 reduces the number of recruited B cells and delays their entry into division by inducing a “naïve” B-cell phenotype. Because cyclin D1 is activated by NF-κB and KLF4 is able to repress cyclin D1, one possible explanation is that KLF4 may interact with NF-κB downstream of CD40 and BCR signaling to regulate B-cell proliferation independently from p21Cip1.
In addition to their role in normal B cell development and differentiation, KLF4 has also been shown to be a tumor suppressor gene in B-cell malignancies, through increasing the expression of p21Cip1 and decreasing the expression of c-Myc and cyclin D2.17
We have recently shown that KLF4 is expressed in malignant plasma cells of two out of the 7 molecular groups of patients with MM, i.e. the patients whose malignant plasma cells have the t(4;14) translocation or an overexpression of CCND1 or CCND3 genes. KLF4 blocks the proliferation of malignant plasma cells by increasing expression of p21Cip1 and p27Kip1 and its forced expression increased the resistance of malignant plasma cells to melphalan.18 Furthermore, KLF4 was identified to play a role in Carfilzomib resistance through prosurvival autophagy induction in MM cells.19
KLF4 is expressed in human healthy bone marrow plasma cells (BMPCs), but its function in plasma cell generation has not been reported yet. Using an in vitro model of plasma cell generation, we show that KLF4 is not expressed in early PCs (EPCs) and long-lived PCs (LLPCs). A forced expression of KLF4 increases the ability of plasmablasts (PBs) to generate EPCs and then LLPCs. In fact, forced expression of KLF4 induces the up regulation of a limited set of genes, among which 3 genes describe a novel molecular network controlling the cell cycle, cell morphology, cellular function and maintenance associated with a mature plasma cell phenotype.
Results
KLF4 gene is expressed in bone marrow plasma cells, unlike in vitro generated long-lived plasma cells
KLF4 gene was expressed in healthy purified peripheral blood NBCs, MBCs and BMPCs (≥ 98% purity) using both Affymetrix microarrays and real time RT-PCR (Fig. 1A and 1B). KLF4 expression was not expressed in EPCs or LLPCs, which are generated in vitro using Affymetrix microarrays (Fig. 1A) and at very low levels (relative expression 2.9 or 4 vs. 400 for BMPCs) using quantitative RT-PCR (Fig. 1B). In vitro generated preplasmablasts (prePBs) and PBs did not express KLF4 gene also (Fig. 1A), as reported for activated MBCs.16
Figure 1.
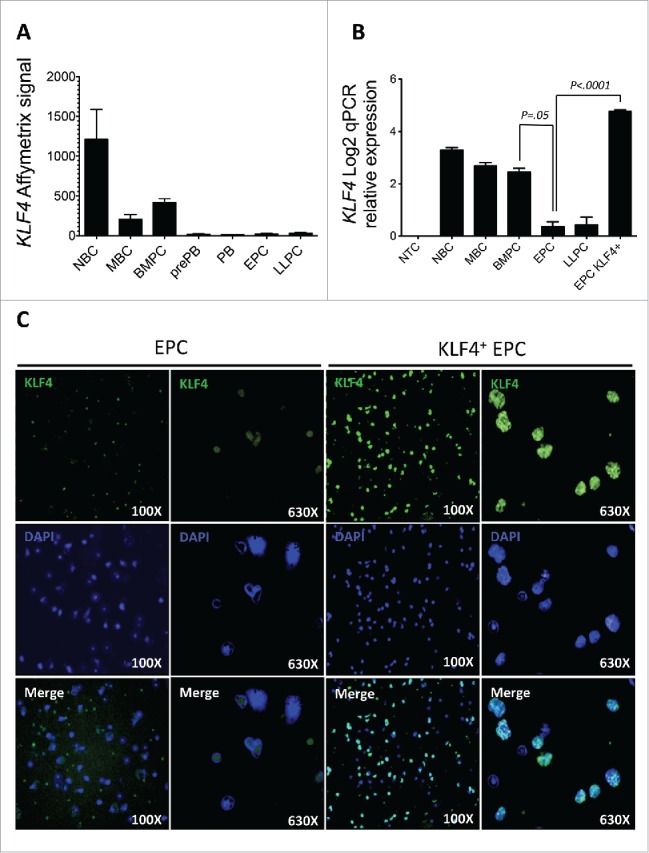
KLF4 gene and protein expression during plasma cell differentiation. A. KLF4 gene expression was assayed using Affymetrix microarray (probe set 220266_s_at) Histogram data are the mean signal from 5 purified primary Naïve B cell (NBC) samples, 5 purified primary memory B cell (MBC) samples, and 5 purified primary bone marrow plasma cell (BMPC) samples. Next four samples were obtained by differentiating MBCs in vitro into preplasmablasts (prePB, 5 samples), plasmablasts (PB, 5 samples), early plasma cells (EPC, 5 samples), and 5 long lived plasma cells (LLPC, 5 samples). B. KLF4 log2 relative expression normalized by GAPDH expression using real time PCR. Histogram data are the mean signal from 6 PCR amplifications (2 PCR/samples and 3 samples) for each purified cell population. C. Nuclei were labeled with dapi and KLF4 protein expression using staining with a anti-KLF4 rabbit antibody and a Alexa488-conjugated goat anti-rabbit antibody. Data are of one experiment representative of 3. PBs generated at day 7 were transduced with KLF4 or control lentiviruses, induced to differentiate into EPCs for 3 days and KLF4 expression analyzed at day 10. The percentages are those of KLF4+ cells determined by counting 1000 cells, and in this experiment 87% of cells were double labeled by dapi and conjugated antibody (merge panel). The statistical comparisons were done using a t-test and a P value ≤ .05 was considered as significant.
A forced expression of KLF4 promotes plasma cell generation in vitro
To investigate the role of KLF4 in the process of plasma cell differentiation, in vitro generated PBs were transduced with a KLF4-expressing measles-envelop pseudotyped lentivirus or a control lentivirus and induced to differentiate into EPCs for 3 days in the presence of IL-6, IL-15 and IFNα as reported.20 Measles envelop pseudotyped lentiviruses were used because they can transduce human PCs unlike vsv-g envelop pseudotyped ones18 (Fig. 1B). KLF4 protein was expressed in 85% ± 8% (mean value ± SD of 3 experiments) of EPCs as assessed using immunofluorescence staining with an anti-KLF4 mAb (Fig. 1C). KLF4 transduction increased 2-fold the counts of CD138+ EPCs obtained at day 10 (P = .0031) (Fig. 2A). Transducing in vitro generated PBs with a control measles lentivirus did not change EPC counts as previously indicated (results not shown).18 This increase in EPC counts by a forced KLF4 expression is the result of combined increases in cell survival (from 48% in control EPCs to 65% in KLF4+ EPCs, P = .004, Fig. 2B) and in the efficacy of the differentiation of PBs into EPCs (from 49% CD138+ EPCs in the control group to 57% CD138+ EPCs in the KLF4 group, P = .02, Fig. 2C). FACS data of a representative experiment are shown on Fig. 2D showing both the increase in cell viability (FSC/SSC gate) and in the percentage of CD138+ EPCs. In agreement with the increase in cell viability, caspase 3/7, 8 and 9 activities were decreased significantly in KLF4+ EPCs compared to control transduced EPCs (P < .0001) (Fig. 3A). The ability of a forced KLF4 expression in PBs to promote plasma cell differentiation was even more marked for the generation of LLPCs. At day 25, 3 fold more LLPCs were obtained starting from KLF4-lentivirus transduced PBs compared to control lentivirus transduced PBs (P < .0001) (Fig. 3B). Total cell counts were on average 3 fold higher after transfection with KLF4 after D7 (1.75x at D10, 4.03x at D17 and 2.86x at D25 (P = .04)), and dead cell counts were on average 1.24 fold higher without transfection with KLF4 after D7 (1.58x at D10 (P = .02), 1.19x at D17 (NS) and 0.95x at D25 (NS)) (Data not shown) suggesting that KLF4 increases plasma cell recovery by making these cells resistant to apoptosis.
Figure 2.

KLF4 increases plasma cell differentiation efficiency. A. Number of EPCs obtained at day 10 in vitro and following either control (CTRL) or KLF4 transduction at day 7. Data are the mean product of live cell counts obtained at day 10 starting from 500 000 live PBs at day 7 and of the percentage of CD138+ cells in the live population assessed by FACS staining (n = 5). B. Viability of EPCs obtained at day 10 in vitro and following either control or KLF4 transduction of PBs at day 7 assayed using Trypan Blue staining (n = 5). C. Percentages of CD138+ EPCs obtained at day 10 in vitro and following either control or KLF4 transduction of PBs at day 7 assayed by CD138 FACS staining (n = 5). D. FACS staining of EPCs obtained at day 10 in vitro and following either control or KLF4 transduction at day 7. Data are from one experiment representative of 5.
Figure 3.
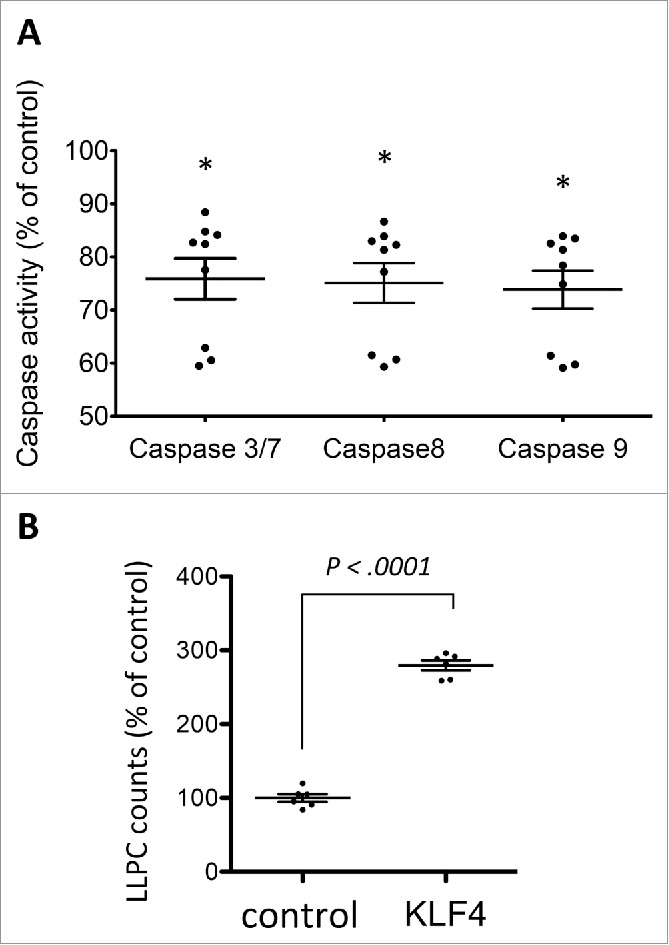
KLF4 decreases caspase activity in early plasma cells and increases their ability to generate long lived plasma cells. A. Caspase 3/7, caspase 8 and caspase 9 activities in EPCs obtained at day 10 in vitro following either control or KLF4 transduction of PBs at day 7. Data are the mean ratio of the caspase activity in KLF4+ EPCs and control EPCs (3 experiments and 3 replicates/experiment). *indicates a significant decrease in activity using a t-test (P < .0001). B. EPCs were obtained from PBs transduced at day 7 with control or KLF4 lentiviruses and then induced to differentiate into LLPCs for 25 days. Data are the ratio of LLPC counts generated from KLF4+ EPCs and control EPCs. *indicates a significant increase in LLPC counts generated from KLF4+ EPCs using a t-test for pairs (P < .0001).
We next investigated whether the overexpression of KLF4 induced changes in the expression level of immunoglobulin genes using Affymetrix U133 P2 microarray data. Our data didn't reveal any significant difference between control PCs and KLF4-overexpressing PCs (Table S1 and Fig. S2).
KLF4 expression induces a BMPC gene expression profile in EPCs
As KLF4 is a transcription factor, we looked for the transcriptional changes induced in EPCs generated from PBs transduced with KLF4 lentiviruses. Thirteen probe sets interrogating 12 coding genes were significantly upregulated and no probe set downregulated (2 fold change, FDR ≤ .05) in KLF4+ EPCs compared to control EPCs, using supervised SAM analysis. The ontology characteristics of these genes are provided in Table 1.
Table 1.
List of genes found significantly overexpressed (SAM analysis FC ≥ 2, FDR ≤.05) in EPCs following KLF4 transduction.
| Symbol | Probe set | Gene name | Cytoband | GO molecular function | GO biological process | Location |
|---|---|---|---|---|---|---|
| NEFM | 205113_at | neurofilament, medium polypeptide | 8p21 | structural constituent of cytoskeleton, protein binding | cytoskeleton organization, axon cargo transport | Cytoplasm |
| KLF4 | 220266_s_at | Kruppel-like factor 4 | 9q31 | DNA binding transcription factor | transcription, negative regulation of cell proliferation, stem cell maintenance, cell differentiation | Nucleus |
| CALD1 | 212077_at | caldesmon 1 | 7q33 | actin binding, calmodulin binding, myosin binding | cellular component movement, positive regulation of protein binding, actin filament bundle assembly | cytoplasm |
| AKAP12 | 210517_s_at, 227530_at | A kinase anchor protein 12 | 6q24-q25 | protein binding, adenylate cyclase binding, protein kinase A binding | protein targeting, signal transduction, G-protein coupled receptor signaling pathway, positive regulation of protein kinase A signaling cascade, positive regulation of cAMP biosynthetic process | Cytoplasm |
| D4S234E | 209570_s_at | DNA segment on chromosome 4 expressed sequence 234 | 4p16.3 | dopamine receptor binding | dopamine receptor signaling pathway | Cytoplasm |
| NEFH | 33767_at | neurofilament, heavy polypeptide | 22q12.2 | — | microtubule cytoskeleton organization, nervous system development, cell death, intermediate filament cytoskeleton organization | Cytoplasm |
| PPL | 203407_at | periplakin | 16p13.3 | structural constituent of cytoskeleton, protein binding | keratinization | Cytoplasm |
| CSRP2 | 207030_s_at | cysteine and glycine-rich protein 2 | 12q21.1 | zinc ion binding, metal ion binding | multicellular organismal development, cell differentiation, cell differentiation, myoblast differentiation | Nucleus |
| PSMC3IP | 213951_s_at | PSMC3 interacting protein | 17q21.2 | DNA binding, estrogen receptor binding, ligand-dependent nuclear receptor transcription coactivator activity, glucocorticoid receptor binding | DNA recombination, meiosis, positive regulation of transcription from RNA polymerase II promoter | nucleus |
| C20orf202 | 1556266_a_at | chromosome 20 open reading frame 202 | 20p13 | — | — | — |
| PALM3 | 231018_at | paralemmin 3 | 19p13.12 | nucleotide binding, protein binding, ATP binding | negative regulation of cytokine-mediated signaling pathway, Toll signaling pathway, response to lipopolysaccharide | cytoplasm, plasma membrane |
| PNMAL1 | 218824_at | paraneoplastic Ma antigen family-like 1 | 19q13.32 | — | — | — |
Clustering NBCs, MBCs, prePBs, PBs, EPCs, KFL4+EPCs, LLPCs, and BMPCs according to the expression of these 12 genes resulted in two major clusters: A “B cell to early plasma cell” cluster comprising NBCs, MBCs, prePBs, PBs and EPCs, and a “mature plasma cell” cluster comprising KFL4+ EPCs, BMPCs and LLPCs (Fig. 4A).
Figure 4.
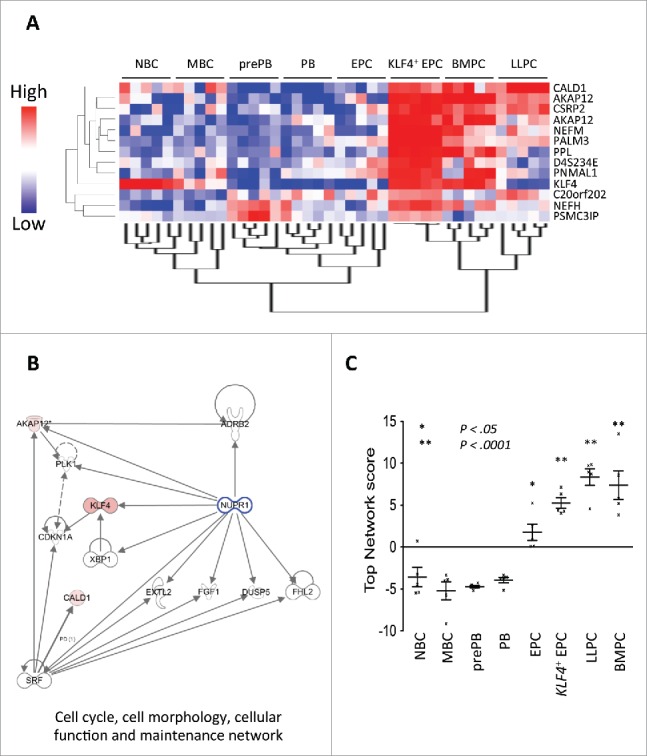
KLF4 induces a mature plasma cell molecular network. A. Unsupervised clustering of gene-expression profiles of purified NBCs, MBCs, prePBs, PBs, EPCs, KLF4+ EPCs, LLPCs and BMPCs. Samples were profiled using Affymetrix U133 plus 2.0 microarray and an unsupervised hierarchical clustering was run with the 13 probe sets (interrogating 12 unique genes) significantly overexpressed in KLF4+ EPCs vs. control EPCs (log transform, center genes, uncentered correlation and average linkage). Signals of each 13 probe sets were standardized across samples and are depicted according to the color scale shown on the left hand side. B. Ingenuity Pathway Analysis of the 12 genes overexpressed in KLF4+ EPCs vs. control EPCs showing enrichment for a “cell cycle, cell morphology, cellular function and maintenance” network comprising 13 proteins. C. Values of the “cell cycle, cell morphology, cellular function and maintenance” network score in NBCs, MBCs, prePBs, PBs, EPCs, KLF4+ EPCs, LLPCs and BMPCs (5 samples/population). The score is the sum of standardized expression of each of the 13 genes among the 5 samples of a population. In case of several probe sets for a same gene, the probe set with the highest variance was used. * or ** indicates a significant increase in the score compared to that in MBCs using a t-test (* P ≤ .05 and ** P ≤ .001).
Ingenuity pathway analysis of this transcriptional profile showed an enrichment of a “cell cycle, cell morphology, cellular function and maintenance” network encoded by 13 genes, 3 (KLF4, CALD1 and AKAP12) of these 13 genes being upregulated in KLF4+ EPCs versus EPCs (Fig. 4B). Analyzing gene expression profiling of these 13 genes in the process of MBC to PC differentiation using a standardized score indicates this network is significantly up regulated in EPCs (P < .05), KLF4+ EPCs (P < .0001), LLPCs (P < .0001) and BMPCs (P < .0001) compared to NBCs, MBCs, prePBs or PBs (Fig. 4C). Thus, this “cell cycle, cell morphology, cellular function and maintenance” network is a network associated with plasma cell differentiation.
Discussion
A major finding of the current study is that the KLF4 transcription factor enhances 2 fold the ability of plasmablasts to generate syndecan-1+ early PCs in vitro and 3 fold their ability to generate long-lived PCs. This in vitro property should occur in vivo as KLF4 is expressed in highly purified bone marrow PCs.
The generation of early PCs and then of LLPCs from plasmablasts in vitro is an apoptotic process with 50% cell death occurring during early PC generation and 80% during LLPC generation.20,21 KLF4 increases early PC and LLPC generation by reducing cell death, in association with a reduction of effector caspase. This anti-apoptotic activity could be explained by its ability to antagonize apoptosis triggered by p53.4
Together with its ability to reduce cell death occurring during the differentiation of PBs into LLPCs, a forced KLF4 expression also activated transcription of genes, which are highly expressed in bone marrow mature plasma cells. The 12 genes, which are upregulated in KLF4+ EPCs vs. control EPCs, make it possible to delineate a cluster of mature plasma cells comprising KLF4+ EPCs, BMPCs and LLPCs in one hand and a cluster of B cells, preplasmablasts, plasmablasts and EPCs in the other hand. A role of the proteins encoded by these 12 genes in plasma cell biology is presently unknown.
Three of these genes (AKAP12, KLF4, and CALD1) belong to a molecular network comprising 13 proteins and associated to “cell cycle, cell morphology, cell function and maintenance,” which is mainly driven by the transcription regulator NUPR1. Incorporating the expression of these 13 genes into a single score shows a progressive increase of this “cell cycle, cell morphology, cell function and maintenance” network score in the process of B cell to mature plasma cell generation. Thus, this network, driven by NUPR1, could play a major role for the generation and maintenance of mature PCs.
NUPR1 was first described as a gene strongly induced in pancreatic acinar cells during the acute phase of pancreatitis.22 Induction of transcriptional regulator NUPR1 mRNA is rapid, strong, and transient in response to various stresses such as exposure to LPS or chemical inducers of cell cycle arrest.23 The NUPR1 nuclear small protein is capable of producing multiple effects depending on the scenario of its expression. NUPR1 can promote tumor growth and aggressiveness and protect tumor cells from apoptosis.24 In non-cancer cells, NUPR1 expression is required for an appropriate stress response, suggesting its expression is beneficial. It is likely that the timing, the level, and the cellular context of its expression further increase NUPR1 complexity.23 NUPR1 knockdown alters the expression of several genes coding for proteins involved in DNA repair and cell-cycle progression25 such as Aurora kinase A and KLF4 and also for proteins associated with stress response (XBP1 and DUSP5). XBP1 is a major transcription actor controlling the response to unfold protein,26 and is essential to drive plasma cell differentiation and survival facing their ability to produce high amounts of immunoglobulins.27 DUSP5 is a member of the family of dual specificity phosphatases that show distinct substrate specificities for various mitogen-activated protein kinases known to negatively regulate members of the kinase superfamily (MAPK/ERK, SAPK/JNK, p38), which are associated with cellular proliferation and differentiation.28 We show here that the expression of NUPR1 gene is increased throughout B cell to plasma cell differentiation (Supplementary Fig. 1), suggesting the protein could be important to support plasma cell survival given the high stress induced by their production of large amounts of immunoglobulin.
A-kinase anchor proteins (AKAPs) have the common function of binding to the regulatory subunit of protein kinase A (PKA) and confining the holoenzyme to discrete locations within the cell. AKAP12 associates with protein kinases A and C and phosphatases, and serves as a scaffold protein in signal transduction. The cAMP signaling pathway is a key regulator of haematopoietic cell proliferation, differentiation, and apoptosis. Signal specificity is achieved through local activation of signaling enzymes that are anchored to subcellular organelles and membranes, in particular through AKAP12 binding.29,30 A knockout of AKAP12 in mice leads to an increase in pre B and immature B cells in the bone marrow, and significantly reduced numbers of recirculating and splenic B cells suggesting it is required in mature B cell generation. Another interesting member of this plasma cell network is FGF1. FGF1 belongs to the fibroblast growth factor family and possesses broad mitogenic and cell survival activities. FGF1 is involved in a plethora of biological processes, including cell growth, proliferation, migration, differentiation, and survival in different cell types.31
According to the role of KLF4 in supporting plasma cell generation and survival, KLF4 deregulation could be involved in plasma cell tumorigenesis or autoimmune diseases. High levels of KLF4 expression have been reported myeloma patients with t(4;14) translocation, an overexpression of CCND1 or CCND3.18,32 Furthermore, KLF4 overexpression was described to be associated with melphalan and carfilzomib drug resistance in myeloma cells.18,19
In conclusion, we have shown that KLF4 promotes the generation of human mature plasma cells in vitro, enhancing both the ability of plasmablasts to generate early and long lived plasma cells and the survival of plasma cells. This plasma cell property of KLF4 should be relevant in vivo since this protein is expressed in bone marrow plasma cells. Elucidating the mechanisms of action of KLF4 will require further study but it is of note its forced expression in EPCs induced the upregulation of previously unknown plasma cells genes, in particular linked to a “cell cycle, cell morphology, cell function and maintenance” network driven by NUPR1.
Materials and methods
Reagents
Human recombinant IL-2 was purchased from R&D Systems (Minneapolis, MN), IFN-α (IntronA) from Merck Canada Inc. (Kirckland, Canada), IL-6 and IL-15 from AbCys SA (Paris, France), IL-10, from Peprotech (Rocky Hill, NJ, USA). Mouse (or rat when indicated) mAbs conjugated to allophycocyanin (APC), fluorescein isothiocyanate (FITC), peridinin chlorophyll protein-cyanin 5.5 (PerCP-Cy5.5), phycoerythrin (PE), specific for human CD19 (clone HIB19), CD27 (clone M-T271), CD38 (clone HIT2) and CD138 (clone RF8B2) were purchased from BD Biosciences (Le Pont De Claix, France); CD20 (clone B9E9) from Beckman Coulter (Fullerton, CA).
Cell samples
Peripheral blood cells from healthy volunteers were purchased from the French Blood Center (Toulouse, France) and CD19+CD27+MBCs purified (≥ 95% purity) as described.20 When indicated, D10 early PCs (CD138+) were FACS-sorted using an APC-conjugated anti-CD138 mAb. The purity of FACS-sorted cell populations was ≥ 95% as assayed by cytometry. The Resto-6 lymph node stromal cell (SC) line was kindly provided by Pr. Tarte (Rennes, France).33
Cell cultures
PCs were generated through a four-step culture as reported.20,21 All cultures were performed in Iscove's modified Dulbecco medium (IMDM, Invitrogen) and 10% FCS.20,21,34 In step 1, purified peripheral blood MBCs (1.5 × 10⁵/ml) were activated for 4 days by CpG oligodeoxynucleotide and CD40 ligand (sCD40L) - 10 µg/ml of phosphorothioate CpG oligodeoxynucleotide 2006 (Sigma), 50 ng/ml histidine tagged sCD40L, and anti-poly-histidine mAb (5 µg/ml), (R&D Systems) - with IL-2 (20 U/ml), IL-10 (50 ng/ml) and IL-15 (10 ng/ml) in 6 well culture plates. In step 2, PBs were generated by removing CpG oligonucleotides and sCD40L and changing the cytokine cocktail (IL-2, 20 U/ml, IL-6, 50 ng/ml, IL-10, 50 ng/ml and IL-15, 10 ng/ml). In step 3, PBs were differentiated into EPCs adding IL-6 (50 ng/ml), IL-15 (10 ng/ml) and IFN-α (500 U/ml) for 3 days. In step 4, EPCs were differentiated into LLPCs using IL-6 and Resto6 SC conditioned medium was obtained by culturing confluent monolayers of SCs for 5 days with culture medium. The culture supernatant was 0.2 μM filtered and frozen and 50% of SC-CM was added to PC cultures, and renewed every week. Finally, LLPCs were also obtained adding IL-6 (10 ng/ml).
Assay for cell viability and cell growth
Cell concentration and viability were assessed using trypan blue dye exclusion test. The number of metabolic active cells at day 25 was also determined using intracellular ATP quantitation with a Cell Titer Glo Luminescent Assay (Promega Corporation, Madison, WI).
Measurement of caspase activity
Caspase 3/7 activity was determined using the Caspase-Glo® 3/7 Assay (Promega, Madison, WI) according to manufacturer's instructions. The assay provides a luminogenic caspase 3/7 substrate, which contains the tetrapeptide sequence DEVD selective for caspases 3/7. Addition of Caspase-Glo® 3/7 reagent results in cell lysis, followed by caspase cleavage of the substrate and release of luminescent signal. The luminescence produced is proportional to the amount of caspase activity present. At the time of apoptosis measurement, 50 microlitres of each samples was transferred into a single well of a 96-well plate and 50 microlitres of Caspase-Glo® 3/7 Assay mixture added. After incubation for 30 minutes at 22°C luminescence was measured using a Berthold luminometer.
Caspase 8 and caspase 9 activity was determined using the Caspase-Glo® 8 and the Caspase-Glo® 9 Assays, respectively, (Promega, Madison, WI) according to manufacturer's instructions and the above protocol.
Caspase 3/7, caspase 8 and caspase 9 activation was measured with Caspase Glo Assay (Promega, Madison, WI) according to the kit protocol and after normalization with ATP content. For Caspase Glo 3/7 and Caspase Glo 9 assays, the intensity of bioluminescence is proportional to the activation of caspases 3/7 and caspase 9 respectively.
Immunophenotypic analysis
Flow cytometry analysis was performed with a FACSAria cytometer using FACSDiva 6.1 (Becton Dickinson, San Jose, CA) and with a Cyan ADP cytometer driven by the Summit software (Beckman Coulter). Kaluza software (Beckman Coulter) was used for data analysis. The fluorescence intensity of the cell populations was quantified using the stain index (SI) formula: [mean fluorescence intensity (MFI) obtained from a given mAb minus MFI obtained with a control mAb]/[2 times the standard deviation of the MFI obtained with the same control mAb].20
Lentiviral production
Self-inactivating HIV-1–derived vectors were generated by transient transfection of 293T cells in DMEM medium (Invitrogen, Carlsbad, NM) as described.35 Briefly, 3 µg of each envelope plasmid (H and F proteins) were transfected together with a gag and pol packaging plasmid and a plasmid encoding a lentiviral vector with KLF4 or GFP genes. The virus was concentrated using overnight low-speed (3000 g at 4°C) centrifugation of viral supernatant and frozen at −80°C until use. The transduction efficiency and infectious titers were assayed adding to 293T cells serial concentrations of vector preparation and monitoring GFP+ cells by immunofluorescence or KLF4 gene expression by qPCR.
Transduction
PBs were generated at day 7 after completing the first 2 steps of differentiation and lentiviral particles were added for 3 days in step 3 conditions in order to generate EPCs. Transduced cells were then cultured in step 4 conditions to generate LLPCs.
Immunofluorescence staining
5 × 10⁴ cells Day 10 cells were deposited onto poly-L-lysine coated slides, fixed in 4% paraformaldehyde and permeabilized with 0,1% Triton. Nonspecific staining was blocked by incubating the slides in PBS containing 5% bovine serum albumin, after which the slides were subjected to the primary rabbit polyclonal anti-KLF4 antibody (Abcam) for 1 h in a moist chamber. Slides were washed with PBS, and incubated for 1 h with an Alexafluor 488-conjugated goat anti-rabbit antibody (Molecular Probes, Invitrogen) in a dark moist chamber. Slides were washed, mounted with Vectashield containing 4'-6-Diamidino-2-phenylindole (DAPI) (Sigma Aldrich, St Louis, MO), and the labeling evaluated with an epifluorescence microscope (Leica microsystems, Germany).
Real-time RT-PCR
RNA was converted to cDNA using the Qiagen QuantiTect Reverse Transcription Kit (Qiagen, Hilden, Germany). The assays-on-demand primers and probes and the TaqMan Universal Master Mix were used according to the manufacturer's instructions (Applied Biosystems, Courtaboeuf, France). The measurement of gene expression was performed using the Roche LC480 Sequence Detection System. For each primer, serial dilutions of a standard cDNA were amplified to create a standard curve, and values of unknown samples were estimated relative to this standard curve in order to assess PCR efficiency. Ct values were obtained for GAPDH and the respective genes of interest during log phase of the cycle. Gene expression was normalized to that of GAPDH (dCt = Ct gene of interest – Ct GAPDH) and compared with the values obtained for a known positive control using the following formula: 100/2ddCt where ddCt = dCt unknown – dCt positive control.
Microarray hybridization and bioinformatics analysis
RNA was extracted and hybridized to human genome U133 Plus 2.0 GeneChip microarrays, according to the manufacturer's instructions (Affymetrix, Santa Clara, CA). Gene expression data are deposited in the ArrayExpress public database (http://www.ebi.ac.uk/microarray-as/ae/). The accession number is E-MTAB-2670 for EPCs with or without KLF4 expression. Genes differentially expressed between cell populations were determined with the statistical microarray analysis (SAM) method using the SAM package on R software (FC ≥ 2, FDR ≤ .05, 1000 permutations)36 and analyzed with Genomicscape.37 Gene annotation and networks were generated with Ingenuity (http://www.ingenuity.com/).
Statistical analysis
Statistical comparisons were made using a student's t-test on Prism software. P values ≤ .05 were considered as significant.
Supplementary Material
Disclosure of potential conflicts of interest
No potential conflicts of interest were disclosed.
Acknowledgments
We thank the Microarray Core Facility of IRB.
Author contributions
MS performed the experiments and wrote the paper. MJ developed the in vitro model for plasma cell generation. AK provided help for microarray analysis. VP performed the microarray experiments. AS and DH provided BMPC data and participated in the writing of the paper.
BK and JM are the senior investigators who designed research and wrote the paper.
Funding
This work was supported by grants from ARC (SL220110603450, Paris France), from ANR (2012-109/087437, Paris France), and the European Community (FP7-OVERMYR).
References
- [1].Tangye SG. Staying alive: regulation of plasma cell survival. Trends Immunol 2011; 32:595-602; PMID:22001488; http://dx.doi.org/ 10.1016/j.it.2011.09.001 [DOI] [PubMed] [Google Scholar]
- [2].Rowland BD, Bernards R, Peeper DS. The KLF4 tumour suppressor is a transcriptional repressor of p53 that acts as a context-dependent oncogene. Nat Cell Biol 2005; 7:1074-82; PMID:16244670; http://dx.doi.org/ 10.1038/ncb1314 [DOI] [PubMed] [Google Scholar]
- [3].Wei D, Kanai M, Jia Z, Le X, Xie K. Kruppel-like factor 4 induces p27Kip1 expression in and suppresses the growth and metastasis of human pancreatic cancer cells. Cancer Res 2008; 68:4631-9; PMID:18559508; http://dx.doi.org/ 10.1158/0008-5472.CAN-07-5953 [DOI] [PMC free article] [PubMed] [Google Scholar]
- [4].Zhou Q, Hong Y, Zhan Q, Shen Y, Liu Z. Role for Kruppel-like factor 4 in determining the outcome of p53 response to DNA damage. Cancer Res 2009; 69:8284-92; PMID:19826046; http://dx.doi.org/ 10.1158/0008-5472.CAN-09-1345 [DOI] [PubMed] [Google Scholar]
- [5].Evans PM, Liu C. Roles of Krupel-like factor 4 in normal homeostasis, cancer and stem cells. Acta Biochim Biophys Sin (Shanghai) 2008; 40:554-64; PMID:18604447; http://dx.doi.org/ 10.1111/j.1745-7270.2008.00439.x [DOI] [PMC free article] [PubMed] [Google Scholar]
- [6].Yu T, Chen X, Zhang W, Li J, Xu R, Wang TC, Ai W, Liu C. Kruppel-like factor 4 regulates intestinal epithelial cell morphology and polarity. PLoS One 2012; 7:e32492; PMID:22384261; http://dx.doi.org/ 10.1371/journal.pone.0032492 [DOI] [PMC free article] [PubMed] [Google Scholar]
- [7].Cao Z, Sun X, Icli B, Wara AK, Feinberg MW. Role of Kruppel-like factors in leukocyte development, function, and disease. Blood 2010; 116:4404-14; PMID:20616217; http://dx.doi.org/ 10.1182/blood-2010-05-285353 [DOI] [PMC free article] [PubMed] [Google Scholar]
- [8].Yamada T, Park CS, Mamonkin M, Lacorazza HD. Transcription factor ELF4 controls the proliferation and homing of CD8+ T cells via the Kruppel-like factors KLF4 and KLF2. Nat Immunol 2009; 10:618-26; PMID:19412182; http://dx.doi.org/ 10.1038/ni.1730 [DOI] [PMC free article] [PubMed] [Google Scholar]
- [9].Lacorazza HD, Yamada T, Liu Y, Miyata Y, Sivina M, Nunes J, Nimer SD. The transcription factor MEF/ELF4 regulates the quiescence of primitive hematopoietic cells. Cancer Cell 2006; 9:175-87; PMID:16530702; http://dx.doi.org/ 10.1016/j.ccr.2006.02.017 [DOI] [PubMed] [Google Scholar]
- [10].Alcalay M, Meani N, Gelmetti V, Fantozzi A, Fagioli M, Orleth A, Riganelli D, Sebastiani C, Cappelli E, Casciari C, et al.. Acute myeloid leukemia fusion proteins deregulate genes involved in stem cell maintenance and DNA repair. J Clin Invest 2003; 112:1751-61; PMID:14660751; http://dx.doi.org/ 10.1172/JCI17595 [DOI] [PMC free article] [PubMed] [Google Scholar]
- [11].Mamonkin M, Shen Y, Lee PH, Puppi M, Park CS, Lacorazza HD. Differential roles of KLF4 in the development and differentiation of CD8+ T cells. Immunol Lett 2013; 156:94-101; PMID:24075846; http://dx.doi.org/ 10.1016/j.imlet.2013.09.008 [DOI] [PMC free article] [PubMed] [Google Scholar]
- [12].Alder JK, Georgantas RW 3rd, Hildreth RL, Kaplan IM, Morisot S, Yu X, McDevitt M, Civin CI. Kruppel-like factor 4 is essential for inflammatory monocyte differentiation in vivo. J Immunol 2008; 180:5645-52; PMID:18390749; http://dx.doi.org/ 10.4049/jimmunol.180.8.5645 [DOI] [PMC free article] [PubMed] [Google Scholar]
- [13].Feinberg MW, Wara AK, Cao Z, Lebedeva MA, Rosenbauer F, Iwasaki H, Hirai H, Katz JP, Haspel RL, Gray S, et al.. The Kruppel-like factor KLF4 is a critical regulator of monocyte differentiation. EMBO J 2007; 26:4138-48; PMID:17762869; http://dx.doi.org/ 10.1038/sj.emboj.7601824 [DOI] [PMC free article] [PubMed] [Google Scholar]
- [14].Klaewsongkram J, Yang Y, Golech S, Katz J, Kaestner KH, Weng NP. Kruppel-like factor 4 regulates B cell number and activation-induced B cell proliferation. J Immunol 2007; 179:4679-84; PMID:17878366; http://dx.doi.org/ 10.4049/jimmunol.179.7.4679 [DOI] [PMC free article] [PubMed] [Google Scholar]
- [15].Yusuf I, Kharas MG, Chen J, Peralta RQ, Maruniak A, Sareen P, Yang VW, Kaestner KH, Fruman DA. KLF4 is a FOXO target gene that suppresses B cell proliferation. Int Immunol 2008; 20:671-81; PMID:18375530; http://dx.doi.org/ 10.1093/intimm/dxn024 [DOI] [PubMed] [Google Scholar]
- [16].Good KL, Tangye SG. Decreased expression of Kruppel-like factors in memory B cells induces the rapid response typical of secondary antibody responses. Proc Natl Acad Sci U S A 2007; 104:13420-5; PMID:17673551; http://dx.doi.org/ 10.1073/pnas.0703872104 [DOI] [PMC free article] [PubMed] [Google Scholar]
- [17].Kharas MG, Yusuf I, Scarfone VM, Yang VW, Segre JA, Huettner CS, Fruman DA. KLF4 suppresses transformation of pre-B cells by ABL oncogenes. Blood 2007; 109:747-55; PMID:16954505; http://dx.doi.org/ 10.1182/blood-2006-03-011106 [DOI] [PMC free article] [PubMed] [Google Scholar]
- [18].Schoenhals M, Kassambara A, Veyrune JL, Moreaux J, Goldschmidt H, Hose D, Klein B. Kruppel-like factor 4 blocks tumor cell proliferation and promotes drug resistance in multiple myeloma. Haematologica 2013; 98:1442-9; PMID:23585530; http://dx.doi.org/ 10.3324/haematol.2012.066944 [DOI] [PMC free article] [PubMed] [Google Scholar]
- [19].Riz I, Hawley TS, Hawley RG. KLF4-SQSTM1/p62-associated prosurvival autophagy contributes to carfilzomib resistance in multiple myeloma models. Oncotarget 2015; 6:14814-31; PMID:26109433; http://dx.doi.org/ 10.18632/oncotarget.4530 [DOI] [PMC free article] [PubMed] [Google Scholar]
- [20].Jourdan M, Caraux A, De Vos J, Fiol G, Larroque M, Cognot C, Bret C, Duperray C, Hose D, Klein B. An in vitro model of differentiation of memory B cells into plasmablasts and plasma cells including detailed phenotypic and molecular characterization. Blood 2009; 114:5173-81; PMID:19846886; http://dx.doi.org/ 10.1182/blood-2009-07-235960 [DOI] [PMC free article] [PubMed] [Google Scholar]
- [21].Jourdan M, Cren M, Robert N, Bollore K, Fest T, Duperray C, Guilloton F, Hose D, Tarte K, Klein B. IL-6 supports the generation of human long-lived plasma cells in combination with either APRIL or stromal cell-soluble factors. Leukemia 2014; 28(8):1647-56; PMID:24504026; http://dx.doi.org/ 10.1038/leu.2014.61 [DOI] [PubMed] [Google Scholar]
- [22].Mallo GV, Fiedler F, Calvo EL, Ortiz EM, Vasseur S, Keim V, Morisset J, Iovanna JL. Cloning and expression of the rat p8 cDNA, a new gene activated in pancreas during the acute phase of pancreatitis, pancreatic development, and regeneration, and which promotes cellular growth. J Biol Chem 1997; 272:32360-9; PMID:9405444; http://dx.doi.org/ 10.1074/jbc.272.51.32360 [DOI] [PubMed] [Google Scholar]
- [23].Goruppi S, Iovanna JL. Stress-inducible protein p8 is involved in several physiological and pathological processes. J Biol Chem 2010; 285:1577-81; PMID:19926786; http://dx.doi.org/ 10.1074/jbc.R109.080887 [DOI] [PMC free article] [PubMed] [Google Scholar]
- [24].Chowdhury UR, Samant RS, Fodstad O, Shevde LA. Emerging role of nuclear protein 1 (NUPR1) in cancer biology. Cancer Metastasis Rev 2009; 28:225-32; PMID:19153668; http://dx.doi.org/ 10.1007/s10555-009-9183-x [DOI] [PubMed] [Google Scholar]
- [25].Hamidi T, Cano CE, Grasso D, Garcia MN, Sandi MJ, Calvo EL, Dagorn JC, Lomberk G, Urrutia R, Goruppi S, et al.. Nupr1-aurora kinase A pathway provides protection against metabolic stress-mediated autophagic-associated cell death. Clin Cancer Res 2012; 18:5234-46; PMID:22899799; http://dx.doi.org/ 10.1158/1078-0432.CCR-12-0026 [DOI] [PubMed] [Google Scholar]
- [26].Yoshida H, Matsui T, Yamamoto A, Okada T, Mori K. XBP1 mRNA is induced by ATF6 and spliced by IRE1 in response to ER stress to produce a highly active transcription factor. Cell 2001; 107:881-91; PMID:11779464; http://dx.doi.org/ 10.1016/S0092-8674(01)00611-0 [DOI] [PubMed] [Google Scholar]
- [27].Todd DJ, McHeyzer-Williams LJ, Kowal C, Lee AH, Volpe BT, Diamond B, McHeyzer-Williams MG, Glimcher LH. XBP1 governs late events in plasma cell differentiation and is not required for antigen-specific memory B cell development. J Exp Med 2009; 206:2151-9; PMID:19752183; http://dx.doi.org/ 10.1084/jem.20090738 [DOI] [PMC free article] [PubMed] [Google Scholar]
- [28].Mandl M, Slack DN, Keyse SM. Specific inactivation and nuclear anchoring of extracellular signal-regulated kinase 2 by the inducible dual-specificity protein phosphatase DUSP5. Mol Cell Biol 2005; 25:1830-45; PMID:15713638; http://dx.doi.org/ 10.1128/MCB.25.5.1830-1845.2005 [DOI] [PMC free article] [PubMed] [Google Scholar]
- [29].Gelman IH. Emerging Roles for SSeCKS/Gravin/AKAP12 in the control of cell proliferation, cancer malignancy, and barriergenesis. Genes Cancer 2010; 1:1147-56; PMID:21779438; http://dx.doi.org/ 10.1177/1947601910392984 [DOI] [PMC free article] [PubMed] [Google Scholar]
- [30].Akakura S, Gelman IH. Pivotal Role of AKAP12 in the regulation of cellular adhesion dynamics: control of cytoskeletal architecture, cell migration, and mitogenic signaling. J Signal Transduct 2012; 2012:529179; PMID:22811901; http://dx.doi.org/ 10.1155/2012/529179 [DOI] [PMC free article] [PubMed] [Google Scholar]
- [31].Raju R, Palapetta SM, Sandhya VK, Sahu A, Alipoor A, Balakrishnan L, Advani J, George B, Kini KR, Geetha NP, et al.. A Network Map of FGF-1/FGFR Signaling System. J Signal Transduct 2014; 2014:962962; PMID:24829797; http://dx.doi.org/ 10.1155/2014/962962 [DOI] [PMC free article] [PubMed] [Google Scholar]
- [32].Agnelli L, Bicciato S, Mattioli M, Fabris S, Intini D, Verdelli D, Baldini L, Morabito F, Callea V, Lombardi L, et al.. Molecular classification of multiple myeloma: a distinct transcriptional profile characterizes patients expressing CCND1 and negative for 14q32 translocations. J Clin Oncol 2005; 23:7296-306; PMID:16129847; http://dx.doi.org/ 10.1200/JCO.2005.01.3870 [DOI] [PubMed] [Google Scholar]
- [33].Ame-Thomas P, Maby-El Hajjami H, Monvoisin C, Jean R, Monnier D, Caulet-Maugendre S, Guillaudeux T, Lamy T, Fest T, Tarte K. Human mesenchymal stem cells isolated from bone marrow and lymphoid organs support tumor B-cell growth: role of stromal cells in follicular lymphoma pathogenesis. Blood 2007; 109:693-702; PMID:16985173; http://dx.doi.org/ 10.1182/blood-2006-05-020800 [DOI] [PubMed] [Google Scholar]
- [34].Jourdan M, Caraux A, Caron G, Robert N, Fiol G, Reme T, Bollore K, Vendrell JP, Le Gallou S, Mourcin F, et al.. Characterization of a transitional preplasmablast population in the process of human B cell to plasma cell differentiation. J Immunol 2011; 187:3931-41; PMID:21918187; http://dx.doi.org/ 10.4049/jimmunol.1101230 [DOI] [PubMed] [Google Scholar]
- [35].Schoenhals M, Frecha C, Bruyer A, Caraux A, Veyrune JL, Jourdan M, Moreaux J, Cosset FL, Verhoeyen E, Klein B. Efficient transduction of healthy and malignant plasma cells by lentiviral vectors pseudotyped with measles virus glycoproteins. Leukemia 2012; 26(7):1663-70; PMID:22318450; http://dx.doi.org/ 10.1038/leu.2012.36 [DOI] [PubMed] [Google Scholar]
- [36].Tusher VG, Tibshirani R, Chu G. Significance analysis of microarrays applied to the ionizing radiation response. Proc Natl Acad Sci U S A 2001; 98:5116-21; PMID:11309499; http://dx.doi.org/ 10.1073/pnas.091062498 [DOI] [PMC free article] [PubMed] [Google Scholar]
- [37].Kassambara A, Reme T, Jourdan M, Fest T, Hose D, Tarte K, Klein B. GenomicScape: an easy-to-use web tool for gene expression data analysis. Application to investigate the molecular events in the differentiation of B cells into plasma cells. PLoS Comput Biol 2015; 11:e1004077; PMID:25633866; http://dx.doi.org/ 10.1371/journal.pcbi.1004077 [DOI] [PMC free article] [PubMed] [Google Scholar]
Associated Data
This section collects any data citations, data availability statements, or supplementary materials included in this article.