Supplemental Digital Content is available in the text.
Abstract
Biomedical laboratory experiments routinely use negative controls to identify possible sources of bias, but epidemiologic studies have infrequently used this type of control in their design or measurement approach. Recently, epidemiologists proposed the routine use of negative controls in observational studies and defined the structure of negative controls to detect bias due to unmeasured confounding. We extend this previous study and define the structure of negative controls to detect selection bias and measurement bias in both observational studies and randomized trials. We illustrate the strengths and limitations of negative controls in this context using examples from the epidemiologic literature. Given their demonstrated utility and broad generalizability, the routine use of prespecified negative controls will strengthen the evidence from epidemiologic studies.
Negative controls are used in laboratory science to help detect problems with the experimental method. In epidemiologic studies, a negative control outcome acts as a surrogate for the actual outcome—the negative control should be subject to the same potential sources of bias as the outcome but is not caused by the exposure of interest. Negative control exposures are conceptually the same, but defined relative to the actual exposure. Lipsitch et al.1 defined the structure of negative controls to detect unmeasured confounding and described by way of example how negative controls could be used to detect selection bias and measurement (information) bias. Here, we define the causal structure of negative controls with respect to selection bias2 and measurement bias,3 and illustrate their use with published examples.
NEGATIVE CONTROLS TO DETECT SELECTION BIAS
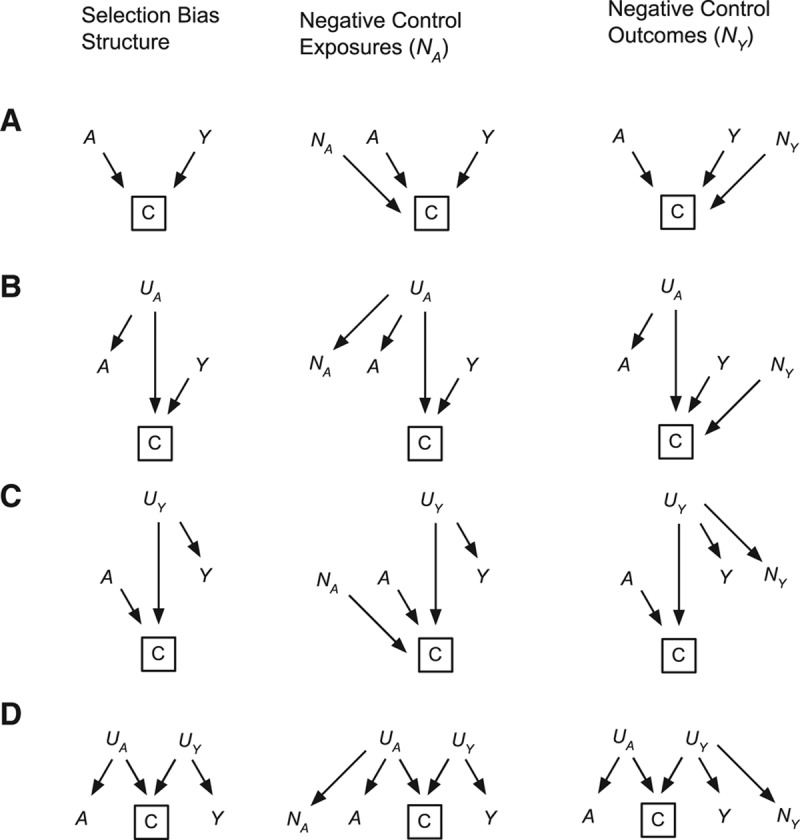
For clarity, we have focused on structures of selection bias under the null (no effect of exposure) and have focused on four structures we would expect to be most relevant to epidemiologic research (Fig. 1).2 Selection bias occurs when the analysis conditions on a third variable C that is a common descendant of exposure A and outcome Y or a common descendant of unmeasured causes of either A or Y or both, denoted UA or UY.2 Defining C as the combination of censoring mechanisms during enrollment, follow-up, and analysis, standard epidemiologic measures are limited to the stratum of C = 0 (uncensored, available data). We denote negative control exposures as NA and negative control outcomes as NY—they could be dichotomous, categorical, or continuous.
FIGURE 1.

Simplified causal diagrams of selection bias for exposure A and outcome Y along with negative control exposures (NA) and outcomes (NY). In all four structures, selection bias results from conditioning on C, a common descendant of (A) exposure A and outcome Y, (B) cause of exposure UA and outcome Y, (C) exposure A and cause of outcome UY, or (D) cause of exposure UA and cause of outcome UY.
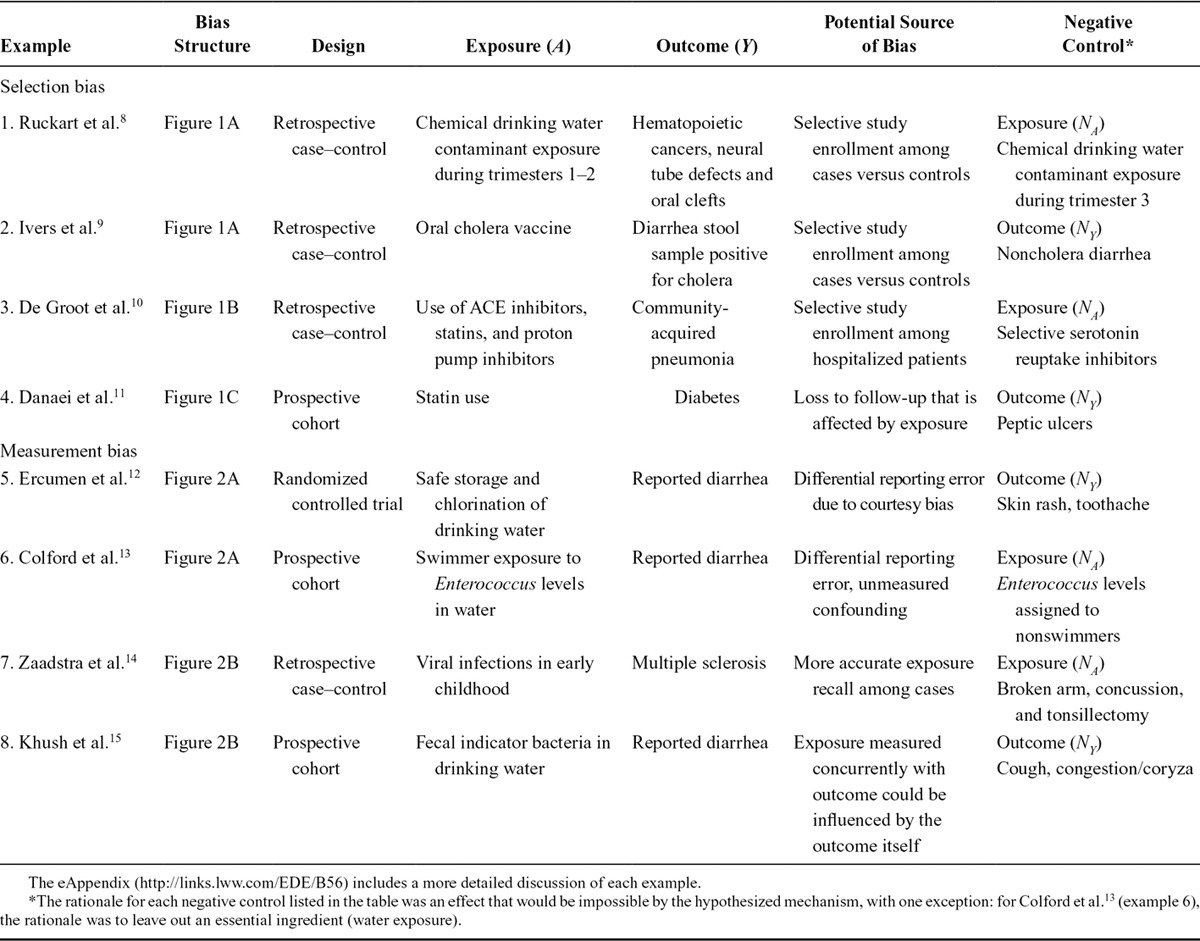
A common form of selection bias can result from conditioning on a common descendant of the exposure and outcome (Fig. 1A). For example, in case–control designs where selection into the study (C) conditions on the outcome (Y → C), selection bias results if the exposure affects participant selection (A → C) differentially by case/control status. This bias structure could also occur in the re-analysis of a case–control study for a secondary outcome Z, which is intermediate between the exposure and outcome: A → Z → Y → C. This design is used in genetic epidemiology studies that repurpose costly genomic measures A and look at their association with additional outcomes Z.4,5 Negative control outcomes or exposures to detect this type of bias would need to similarly affect participant selection (NA → C, Table, example 1 or NY → C, Table, example 2).
Table.
Examples of Studies that Have Used Negative Controls to Detect Selection or Measurement Bias Following Bias Structures in Figures 1 and 2

A second form of selection bias can occur in cross-sectional or retrospective studies when the outcome Y and an unmeasured cause of the exposure UA affect study enrollment C (Fig. 1B). This bias can be detected by using a negative control exposure that shares the same unmeasured parent of the exposure (UA → NA, Table, example 3) or a negative control outcome that similarly affects enrollment (NY → C).
A third form of selection bias can occur when a study conditions on a common descendant of the exposure and an unmeasured cause of the outcome (Fig. 1C). In per-protocol analyses of randomized trials, investigators limit the analysis to individuals that complied with their respective group assignments. Bias results if compliance (C) is determined by treatment assignment (A) and by unmeasured characteristics (UY) that affect both individuals’ willingness to comply with their assigned treatment and their outcome.6 For example, if individuals assigned to treatment who comply with their regimen are more health conscious than noncompliers, a naive per-protocol analysis could overestimate the benefits of the treatment. Figure 1C also applies to selection bias in prospective studies if exposure A and an unmeasured cause of the outcome UY affect loss to follow-up C. A negative control outcome that shares the same unmeasured parent as the outcome (UY → NY, Table, example 4) or a negative control exposure that similarly affects enrollment, loss to follow-up or compliance (NA → C) can be used to detect this type of selection bias.
Finally, selection bias can occur if a cause of the exposure UA and a cause of the outcome UY both affect enrollment C (Fig. 1D). One example is volunteer bias in cohort studies,2 where individuals’ underlying characteristics might affect their exposures and health outcomes as well as their decision to enroll in the study. This bias could be detected by using a negative control outcome that shares the same parent as the actual outcome (UY → NY) or a negative control exposure that shares the same parent as the actual exposure (UA → NA); however, we are unaware of a study that has used negative controls for this bias structure.
NEGATIVE CONTROLS TO DETECT MEASUREMENT BIAS
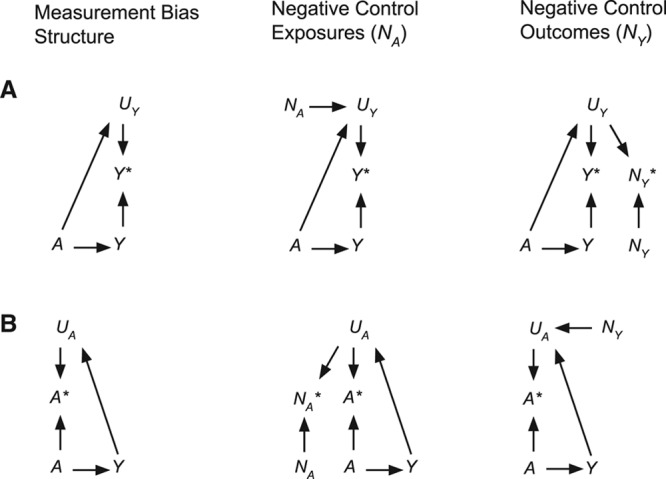
Many studies have measurement error so that investigators observe Y*, which is an error-prone version of the outcome Y.3 For example, if Y is an enteric infection that causes diarrhea, Y* could be caregiver-reported diarrhea symptoms. In the diagrams, we assume UY accounts for all other unmeasured causes of Y* beyond Y. Similarly, A* can be subject to unmeasured sources of error UA. We focus our definitions on differential measurement errors (Fig. 2) because they are most likely to cause bias and the consequent bias is often the least predictable.3 For parsimony, we have not provided formal definitions of negative controls under more complex (or simple nondifferential) measurement error scenarios, but in principle Figure 2 could be extended to accommodate them—for example, removing edges Y → UA or A → UY defines negative controls for independent, nondifferential errors.
FIGURE 2.

Simplified causal diagrams of differential measurement error for an exposure A that causes outcome Y. The basic structures for outcome measurement error (A) and exposure measurement error (B) are summarized along with negative control exposures (NA) and outcomes (NY). UY represents other causes of the measured value of Y* and UA represents other causes of the measured value of A*.
Differential outcome measurement error occurs when A influences the measured outcome Y* through UY (Fig. 2A). In an unblinded study, physician follow-up (UY) may be increased in treated patients compared with the untreated (A → UY), and selective follow-up causes differential measurement error of Y. Differential outcome reporting can also bias observational studies and unblinded trials with subjectively reported outcomes,7 where participant knowledge of their exposure or treatment assignment could influence reporting. An ideal negative control outcome for this scenario shares a common source of correlated measurement error (UY) with the true outcome (Table, example 5). Negative control exposures for differential outcome measurement error also exist—placebo drugs in clinical trials are a classic example. Negative control exposures that act like a placebo can be devised for observational studies (Table, example 6).
Differential exposure measurement error is possible when the exposure A is measured concurrently with or after the occurrence of the outcome Y (Fig. 2B) and is of greatest concern in retrospective or cross-sectional studies. For example, retrospective case–control studies can be biased if they rely on self-reported exposures A* as a proxy for true exposures A and cases remember exposures more accurately than controls. Negative controls for exposure measurement error need to share correlated errors (UA) with the exposure (Table, example 7). The bias described in Figure 2B can also occur if an outcome is measured concurrently with an exposure, where the measured exposure (A*) is used as a proxy for the same measure at a time in the past that is relevant for causing disease (A) (Table, example 8).8–15
DISCUSSION
We defined the structure of negative controls to detect common forms of selection and measurement bias in observational studies and randomized trials. The examples in the Table illustrate many recent applications, and the structural definitions in Figures 1 and 2 generalize to further applications we have not discussed—for example, Figure 1C describes the structure for healthy worker bias2 and healthy user/adherer bias.16 For extensions beyond the detection of bias, recent efforts have used negative controls in sensitivity analyses to quantify the magnitude of bias from unobserved confounding,17 as a tool to remove bias in standardized mortality ratios,18 and as a basis for large-scale empirical calibration of P values in drug safety studies.19 We envision similar extensions for the types of negative controls defined here.
Negative controls have some limitations that arise in practice. Lipsitch et al.1 characterized negative controls as a “blunt tool” to detect bias in the context of confounding, and that characterization is equally apt in the context of selection and measurement bias. Negative controls often lack specificity in the type of bias that they detect—many examples in the Table illustrate this limitation (Discussion in the eAppendix, http://links.lww.com/EDE/B56). Moreover, negative controls may identify the presence of bias but cannot in general determine its direction or magnitude without additional assumptions.1 Another limitation that many negative controls share is that they often fail to provide a definitive test of the absence of bias.1,20 All of these limitations coalesce into a common challenge for selecting negative controls: a control must meet its assumed structural definition, otherwise it can be an insensitive or inappropriate diagnostic for bias. Thus, the ability of a negative control to adequately detect bias ultimately relies on the plausibility of (often untestable) assumptions encoded in its causal diagram. Finally, prespecification of primary outcome and exposure definitions helps prevent the selective presentation of favorable results, and prespecification and complete reporting of negative controls would prevent similar problems.20
Selection bias or measurement bias threaten nearly every epidemiologic study design. Given their demonstrated utility and broad generalizability, the routine use of negative controls will help detect selection bias and measurement bias in epidemiologic studies.
Supplementary Material
Footnotes
Benjamin F. Arnold and Ayse Ercumen contributed equally to this study.
This study was funded in part by National Institutes of Health Grants 1R01HD078912, 1R21HD076216, 1R03HD076066, and 1K01AI119180.
The authors report no conflicts of interest.
Supplemental digital content is available through direct URL citations in the HTML and PDF versions of this article (www.epidem.com).
REFERENCES
- 1.Lipsitch M, Tchetgen Tchetgen E, Cohen T. Negative controls: a tool for detecting confounding and bias in observational studies. Epidemiology. 2010;21:383–388. doi: 10.1097/EDE.0b013e3181d61eeb. [DOI] [PMC free article] [PubMed] [Google Scholar]
- 2.Hernán MA, Hernández-Díaz S, Robins JM. A structural approach to selection bias. Epidemiology. 2004;15:615–625. doi: 10.1097/01.ede.0000135174.63482.43. [DOI] [PubMed] [Google Scholar]
- 3.Hernán MA, Cole SR. Invited commentary: causal diagrams and measurement bias. Am J Epidemiol. 2009;170:959–962; discussion 963. doi: 10.1093/aje/kwp293. [DOI] [PMC free article] [PubMed] [Google Scholar]
- 4.Tchetgen Tchetgen EJ. A general regression framework for a secondary outcome in case-control studies. Biostatistics. 2014;15:117–128. doi: 10.1093/biostatistics/kxt041. [DOI] [PMC free article] [PubMed] [Google Scholar]
- 5.Jiang Y, Scott AJ, Wild CJ. Secondary analysis of case-control data. Stat Med. 2006;25:1323–1339. doi: 10.1002/sim.2283. [DOI] [PubMed] [Google Scholar]
- 6.Hernán MA, Hernández-Díaz S. Beyond the intention-to-treat in comparative effectiveness research. Clin Trials. 2012;9:48–55. doi: 10.1177/1740774511420743. [DOI] [PMC free article] [PubMed] [Google Scholar]
- 7.Wood L, Egger M, Gluud LL, et al. Empirical evidence of bias in treatment effect estimates in controlled trials with different interventions and outcomes: meta-epidemiological study. BMJ. 2008;336:601–605. doi: 10.1136/bmj.39465.451748.AD. [DOI] [PMC free article] [PubMed] [Google Scholar]
- 8.Ruckart PZ, Bove FJ, Maslia M. Evaluation of exposure to contaminated drinking water and specific birth defects and childhood cancers at Marine Corps Base Camp Lejeune, North Carolina: a case-control study. Environ Health. 2013;12:104. doi: 10.1186/1476-069X-12-104. [DOI] [PMC free article] [PubMed] [Google Scholar]
- 9.Ivers LC, Hilaire IJ, Teng JE, et al. Effectiveness of reactive oral cholera vaccination in rural Haiti: a case-control study and bias-indicator analysis. Lancet Glob Health. 2015;3:e162–e168. doi: 10.1016/S2214-109X(14)70368-7. [DOI] [PMC free article] [PubMed] [Google Scholar]
- 10.de Groot MC, Klungel OH, Leufkens HG, van Dijk L, Grobbee DE, van de Garde EM. Sources of heterogeneity in case-control studies on associations between statins, ACE-inhibitors, and proton pump inhibitors and risk of pneumonia. Eur J Epidemiol. 2014;29:767–775. doi: 10.1007/s10654-014-9941-0. [DOI] [PubMed] [Google Scholar]
- 11.Danaei G, García Rodríguez LA, Fernandez Cantero O, Hernán MA. Statins and risk of diabetes: an analysis of electronic medical records to evaluate possible bias due to differential survival. Diabetes Care. 2013;36:1236–1240. doi: 10.2337/dc12-1756. [DOI] [PMC free article] [PubMed] [Google Scholar]
- 12.Ercumen A, Naser AM, Unicomb L, Arnold BF, Colford JM, Jr, Luby SP. Effects of source- versus household contamination of tubewell water on child diarrhea in rural Bangladesh: a randomized controlled trial. PLoS One. 2015;10:e0121907. doi: 10.1371/journal.pone.0121907. [DOI] [PMC free article] [PubMed] [Google Scholar]
- 13.Colford JM, Jr, Schiff KC, Griffith JF, et al. Using rapid indicators for Enterococcus to assess the risk of illness after exposure to urban runoff contaminated marine water. Water Res. 2012;46:2176–2186. doi: 10.1016/j.watres.2012.01.033. [DOI] [PMC free article] [PubMed] [Google Scholar]
- 14.Zaadstra BM, Chorus AM, van Buuren S, Kalsbeek H, van Noort JM. Selective association of multiple sclerosis with infectious mononucleosis. Mult Scler. 2008;14:307–313. doi: 10.1177/1352458507084265. [DOI] [PubMed] [Google Scholar]
- 15.Khush RS, Arnold BF, Srikanth P, et al. H2S as an indicator of water supply vulnerability and health risk in low-resource settings: a prospective cohort study. Am J Trop Med Hyg. 2013;89:251–259. doi: 10.4269/ajtmh.13-0067. [DOI] [PMC free article] [PubMed] [Google Scholar]
- 16.Brookhart MA, Patrick AR, Dormuth C, et al. Adherence to lipid-lowering therapy and the use of preventive health services: an investigation of the healthy user effect. Am J Epidemiol. 2007;166:348–354. doi: 10.1093/aje/kwm070. [DOI] [PubMed] [Google Scholar]
- 17.Tchetgen Tchetgen E. The control outcome calibration approach for causal inference with unobserved confounding. Am J Epidemiol. 2014;179:633–640. doi: 10.1093/aje/kwt303. [DOI] [PMC free article] [PubMed] [Google Scholar]
- 18.Richardson DB, Keil AP, Tchetgen Tchetgen E, Cooper G. Negative control outcomes and the analysis of standardized mortality ratios. Epidemiology. 2015;26:727–732. doi: 10.1097/EDE.0000000000000353. [DOI] [PMC free article] [PubMed] [Google Scholar]
- 19.Schuemie MJ, Ryan PB, DuMouchel W, Suchard MA, Madigan D. Interpreting observational studies: why empirical calibration is needed to correct p-values. Stat Med. 2014;33:209–218. doi: 10.1002/sim.5925. [DOI] [PMC free article] [PubMed] [Google Scholar]
- 20.Prasad V, Jena AB. Prespecified falsification end points: can they validate true observational associations? JAMA. 2013;309:241–242. doi: 10.1001/jama.2012.96867. [DOI] [PubMed] [Google Scholar]


