Abstract
The cytoskeleton controls cellular morphology and mediates the mechanical interactions between a cell and its environment. Atomic force microscopy (AFM) has the unique capability to map cytoskeletal mechanics and structures with nanometer resolution. However, whole–cell cytomechanical imaging with conventional AFM techniques is limited by low imaging speed. Here we present fast nanomechanical mapping of cells using high–bandwidth AFM (HB–AFM), where >106 nanoindentation measurements were acquired in ~10 min—a task that would take weeks to finish using conventional AFM. High bandwidth measurements enabled capture of the entire tip–sample interaction for each tap on cells, engendering a new measurement (“force phase”) that exceeds the contrast of conventional tapping mode, and enabling spectral visualization of >10 harmonics. The abundance of measurements allowed discovery of subtle cytomechanical features, including the stiffness of fibers of the cellular spectrin network in situ. This approach bridges HB–AFM and high–harmonic imaging, and opens future opportunity towards dynamic mechanical properties of living cells.
Keywords: AFM, high–bandwidth, multifrequency, harmonic, cells
Graphical Abstract
The cytoskeleton controls the mechanical state of cells and is crucial for cellular processes including proliferation, differentiation, migration, and cell–cell interaction.1 The mechanical nature of the cytoskeleton has been studied using a variety of imaging techniques,2 and yet a detailed, nanometer–scale understanding of its organization in living cells is still lacking. As a technique for scanning surfaces, atomic force microscopy (AFM) has been used to reveal the heterogeneity of cellular stiffnesses – both across the cell surface and deep into the cytoplasm3. However, the widely used technique, force volume AFM (FV–AFM, also called force–mapping), is too slow (~1 s per force measurement) to scan a whole cell (~1–100 µm) with sufficient spatial resolution (~1–10 nm) and within a scan time relevant to cellular activities (~1–10 min). A high rate of force measurements is needed to keep resolutions at the nanometer scale while scanning in a biologically relevant amount of time.
Various imaging techniques have begun to offer high–speed, nanometer–resolution mechanical mapping of biomolecules and cells through tapping–mode AFM (TM–AFM) or similar approaches, such as multiharmonic AFM4 and higher–harmonic AFM.5 In none of these approaches were the time–resolved, tip–sample interaction forces Fts (t) directly measured during the transient contact between the tip and the surface; instead, Fts was derived from observables averaged over many oscillation cycles. Reconstruction of the full Fts in TM–AFM is still an open problem both theoretically and experimentally.6 Regardless, the accuracy of the reconstructed Fts is ultimately bandwidth–limited.4a
One approach to capture the full Fts on each touch is to oscillate at a frequency well below the fundamental vibrational mode. Conventional FV–AFM falls into this paradigm, where the sought–after higher harmonics of Fts fall within the mechanical bandwidth of the cantilever, though as already mentioned, this technique is too slow to image over the size of whole cells. Similar techniques like pulsed–force AFM7 and PeakForce AFM8 require specialized instruments (e.g., fast electronics and piezo–actuators) to increase the rate of force–testing. PeakForce AFM achieves high force–testing rates (~1 kHz),9 but works for the most part only on stiff cells7 and at the cost of reduced accuracy.10 Further speed improvements in this direction will require faster hardware and exotic instruments.
The fastest technique to date that can fully measure the Fts is high–bandwidth AFM (HB–AFM), where a specialized cantilever equipped with an integrated high–bandwidth force sensor is driven as in TM–AFM at the resonance frequency (5–20 kHz in liquid by design). The sample is probed at every tap11 and the high–bandwidth force–sensor responds to Fts within its bandwidth without attenuation. By comparison, HB–AFM is 103–104 times faster than the conventional force mapping AFM and 10–100 times faster than PeakForce AFM. As an example, torsional probes have been commercialized and used for HB–AFM for adhesion mapping and stiffness mapping of protein and DNA molecules on flat surfaces.12 Interdigitated HB probes have been used to map elastic moduli of polymer materials in air13 and in liquid.14 Compared to torsional probes, interdigitated probes are less constrained in terms of mechanical design and are about 1 order of magnitude more sensitive optically.15 Here, we extended this approach to demonstrate a new capability for imaging cytoskeletal organization in fixed and live cells.
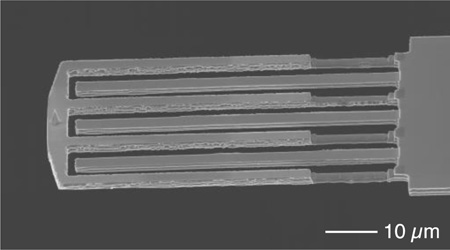
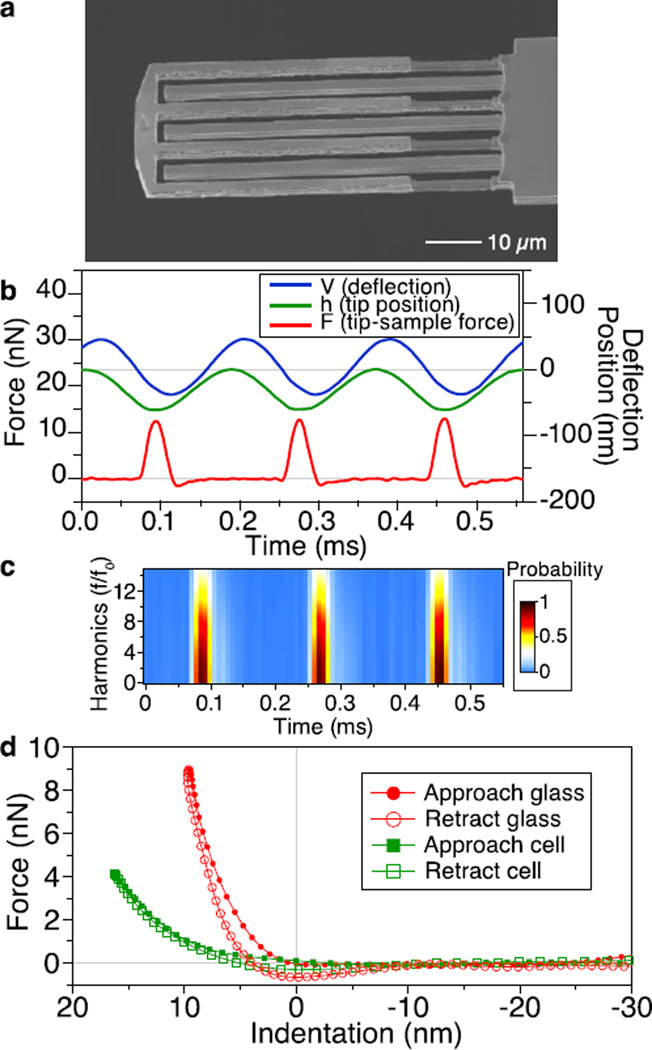
The high–bandwidth force sensor (or simply, “sensor”) in the interdigitated probe is a set of short parallel beams attached to the end of a conventional cantilever (the “body cantilever”) to form an interferometric grating14a (Figure 1a). The sensor has a resonance frequency of 50 kHz in liquid and a spring constant of ~22 N/m, while the body cantilever shows a resonance frequency of ~5 kHz in liquid and a spring constant of ~0.5 N/m. During imaging, the body cantilever is driven mechanically at the frequency of its fundamental vibrational mode (i.e., ~5 kHz in liquid). The deflection of the sensor caused by Fts upon tapping is sensed by the distribution of optical power between the zeroth and first order diffraction modes14a and is used to calculate force using the optical lever sensitivity and spring constant (Supporting Information).
Figure 1.
Probing tip–sample interaction forces at every tap. (a) Electron micrograph of an interferometric force sensor integrated to the end of a 280 µm long cantilever. The tip–coupled fingers were trimmed down by half the thickness for low force detection on soft cell samples. (b) Tip–sample interaction forces (F) of three consecutive taps acquired from tapping glass in liquid. The cantilever deflection (V) was phase–lagged to the forces but the calculated tip position (h) was in–phase to the forces. (c) The corresponding spectrogram of the forces shows the high frequency harmonics up to 15 times the drive frequency. (d) Reconstructed force–distance curves for tapping on glass and on a red blood cell.
To measure the elastic modulus of soft cell samples in liquid, we addressed two critical problems. First, the spring constant of the sensor needed to be low enough to measure the small Fts (~1 nN), so that indenting the cell deeply would not be necessary. For this reason, parts of the sensor fingers were trimmed by focused ion beam milling, reducing its spring constant to ~3 N/m and resonance frequency to 20 kHz (Figure 1a). Second, to calculate the local stiffness using contact mechanical models, knowledge of not only Fts but also the exact tip position (or indentation) is required. In the heavily–damped environment of liquids, the motion of the cantilever base being forcibly oscillated was comparable to the cantilever’s deflection and therefore can be used to correctly estimate the tip position.16 As shown in Figure 1b, the deflection signal (V) measuring the tip position relative to the base of the body cantilever showed an obvious time lag with respect to the force signal (F) measured by the sensor. By adding the calibrated base motion to the deflection (Supporting Information), we obtained the calculated tip position (h), which followed a sinusoidal trajectory when the tip was not in contact but was distorted by Fts during contact. The minimal (lowest) tip position coincided well with the peak force. As shown by the spectrogram representation when tapping upon a glass substrate in liquid, the frequency contents of the force signal beyond the 15th harmonic (i.e., 15 times the drive frequency) were visible, showing that the sensor successfully captured high frequency contents of Fts (t) well beyond the fundamental resonance frequency of the body cantilever (Figure 1c). With knowledge of both Fts (t) and tip–position, a force–distance curve, comprising dozens of measurements per tap, was established (Figure 1d) and used to extract nanomechanical properties using nanoindentation analysis (see below).
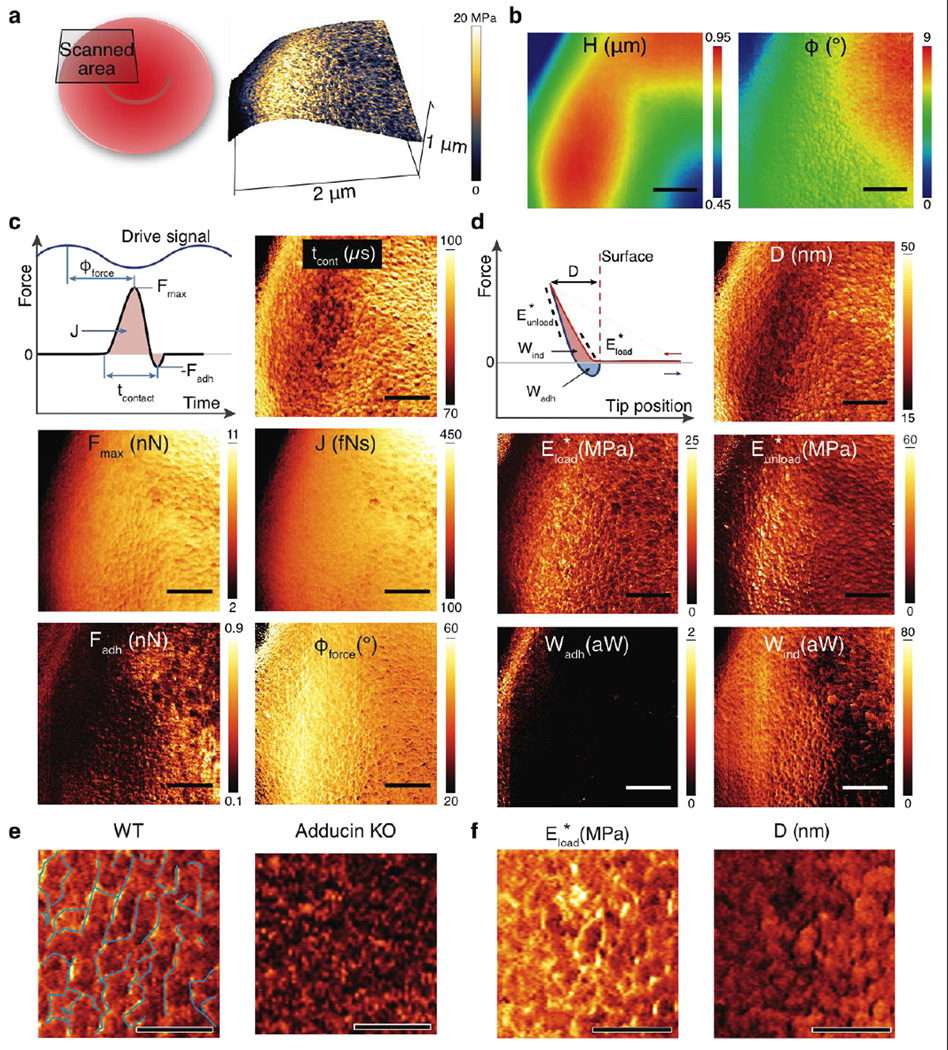
To demonstrate nanomechanical imaging on cells using HB–AFM, we imaged red blood cells (RBC) obtained from the peripheral blood of wild–type mice (Figure 2a). Gentle fixation was used to preserve the delicate cytoskeletal structures. In scanning a 2 µm × 2 µm region with 256 lines at 0.4 Hz rate, we collected on average ~7000 taps per line and ~4 × 10⁶ total measurements in 10 min. By comparison, the same measurements would have taken more than a month to complete using conventional FV mode at 1 measurement per second.
Figure 2. Nanomechanical images showing spectrin networks of a red blood cell (RBC).
(a) 3D Topography showing ~0.5 µm variation across the image and the concaved center of the RBC. The coloration of the 3D surface was from the reduced Young’s modulus image. The side–wall of RBC (the left edge) was imaged at a shallow angle, resulting in skewed measurements of nanomechanical properties. (b) Conventional topography (H) and phase(φ0) images (256 × 256 pixels) as in tapping–mode AFM. (c) Images of nanomechanical properties directly measured from the time–resolved tip–sample interaction force: tip–cell contact time (tcont), peak repulsive and adhesive forces (Fmax and Fadh), impulse (J, force integrated over time) and force phase (φforce, phase lag of the peak repulsive force to the driven base motion of the cantilever). (d) Images of nanomechanical properties derived from reconstructed force–distance curves using calculated indentation: maximal indentation (D), reduced Young’s moduli (stiffness) from the first 25 nm of loading and the upper half of the unloading force curve (E*load and E*unload, respectively), and energy dissipation due to indentation (Wind) and adhesion (Wadh). The nanomechanical images provide quantitative measures of local mechanical properties with a large number of force probing (25 taps per pixel). Scale bar is 500 nm and image size is 841 × 256 pixels. (e) Zoomed in map of elastic modulus of an RBC from a WT and Adducin KO mouse. Scale bar is 200 nm, color scale is identical to Figure 2d. The polygonal spectrin network is shown by superimposed, thin blue lines. (f) Zoomed in maps of elastic modulus and indentation depth show stark differences in the region of the spectrin network versus non–spectrin regions. Scale bar is 200 nm, color scale is identical to Figure 2d.
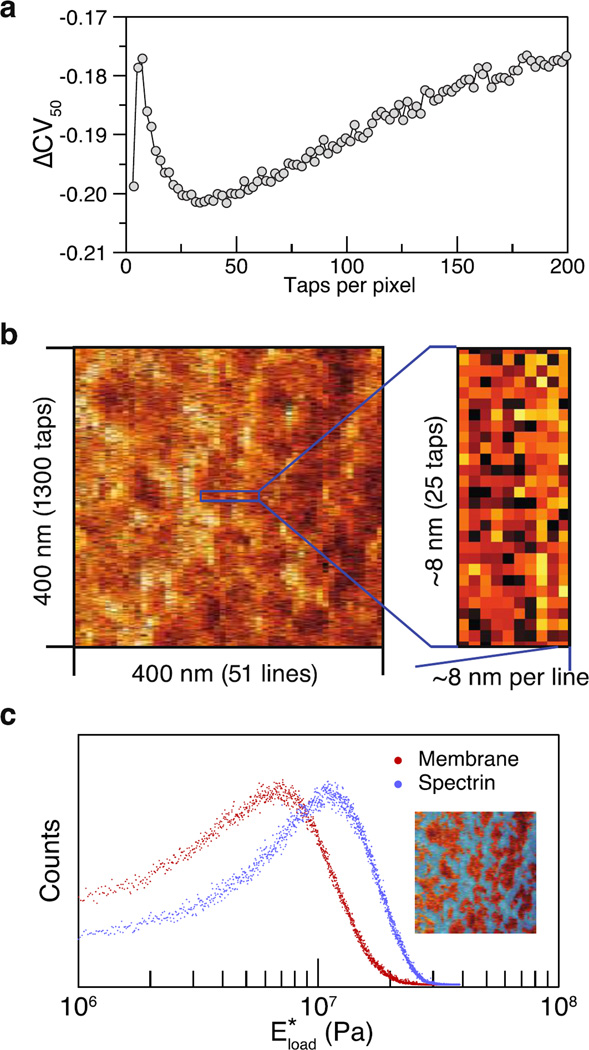
We have spatially oversampled the image but incurred noise; that is, individual taps may be low or high quality in their ability to derive an elastic modulus. Consequently, we hypothesized that calculating elasticity maps from an aggregation of sequential taps would increase signal and decrease noise. To test this hypothesis, we sought to determine how many taps would confer the best aggregation. We calculated a variation score using different numbers of aggregated taps, measuring the statistical property of the coefficient of variation (standard deviation / mean). To determine the quality of these scores, we compared them to a background distribution, which entailed calculation of a “scrambled image” that comprised randomly rearranged from the pixels of the original image. In using the scrambled image, as sequential taps were aggregated, we derived a background level of increased signal and decreased noise. We found that the lowest variation occurred when aggregating 25–35 taps into a synthetic pixel (Figure 3a and Supporting Information Figure S1). This optimal number of taps minimized noise that might arise from looking at too few taps, or from over–generous averaging of too many taps that fall across biologically distinct features. Based on this analysis, we synthesized the individual pixels of elastic modulus in our final image by taking the median value of 25 consecutive taps. Effectively, this choice resulted in a pixel size of ~7 nm, which happened to be the estimated radius of the AFM cantilever tip. Images comprising fewer taps, even single taps, are theoretically possible through reduction of noise, e.g., by using a softer force sensor, resulting in the possibility of subnanometer pixel resolution. It should be noted that, as for all scanning–probe imaging techniques, the spatial resolution of the scanned images is blurred by convolution of the true image with the shape of the finite–sized tip. Thanks to oversampling, and given finer pixel sizes, the limits on resolution could also be improved by blind deconvolution by improved estimation of the tip geometry.17
Figure 3. Statistics of nanomechanical probing based on single–tap measurements.
(a) Stiffness probing uncertainty is the lowest median coefficients of variance of all pixels from an image and its scrambled control, i.e., ΔCV50 = CV50,original − CV50,scrambled. (b) Zoomed–in region of the stiffness map (from Figure 2d) to show E*load value from each single tap. Tap–to–tap spacing was ~0.3 nm. (c) Histograms of the spectrin and surrounding membrane regions based on the single–tap stiffness in (b). The inset image shows the selected spectrin regions marked in blue.
To illustrate the variety of properties obtainable from our measurements on RBCs, we imaged the cellular topography (H) and phase (φ0, defined as the phase difference between the drive signal and the deflection signal) (Figure 2b), in a comparable fashion to conventional TM–AFM. In addition, from Fts (t), we were able to directly extract the following parameters for each tap (Figure 2c): peak repulsive force (Fmax), adhesion force (Fadh), impulse (J, force integrated over the duration of the tap), tip–sample contact time (tcont), and phase between the peak repulsive force and the drive signal (φforce). Finally, we calculated mechanical properties based on the reconstructed force curve (Figure 2d): reduced Young’s modulus for the loading part (E*load using Hertz model) and the unloading part (E*unload using DMT model) of the force curve, maximal indentation (D), energy dissipation due to adhesion (Wadh) and indentation (Wind) (Supporting Information for detailed calculations).
Analyses of these maps show that E*load and E*unload yielded elastic moduli values ~5–10 MPa (which is ~300 times higher than the conventional stiffness of RBCs). These seemingly high values of moduli for cells were due to the high loading rate (maximal tip velocity of ~1 mm/s). As reported by many,18 these loading–rate–dependent elastic moduli are dominated by the viscoelasticity of the cell where the apparent Young’s modulus is scaled with the probing frequency following a power–law relation: E* ∝ f0.2–0.75. Given the probing frequency of HB–AFM is 104 higher than that of conventional approaches, the apparent Young’s modulus is expected to be a few hundred times higher than the values obtained conventionally at low frequencies (0.1–1 Hz). Nonetheless, we obtain differences in E* more than an order of magnitude over the cell.
The most prominent feature in our scans of RBCs is a filamentous, polygonal network, presumably formed by the membrane–lining protein spectrin. This cytoskeletal network has been observed in RBCs using EM and TM–AFM;19 however, these other methods could only reveal topography with no quantitative mechanical properties. To test that this network was indeed spectrin, we acquired images of RBCs obtained from mice lacking alpha–adducin (Add1−/−), the cytoplasmic protein necessary for assembling a spectrin network.20 RBCs from these mice were devoid of polygonal features (Figure 2e and Supporting Information Figure S2 and S3), confirming that the networks observed in WT RBCs were indeed spectrin.
To quantify E*load of the spectrin polygonal network, we analyzed the E*load image formed by single taps. From histograms of E*load using the ~65000 taps in Figure 3b, we found that the filaments are ~50% higher in E*load than the surrounding membrane regions (Figure 3c). Conversely, the surrounding, nonfilamentous areas show greater indentation and contact time than for taps along the spectrin fibers (Figure 2f). These measurements directly capture the viscoelasticity of spectrin in situ and support the role of the spectrin network in controlling the rheological properties of erythrocyte membranes.21
Maintenance of good topographic tracking is critical to avoid destructive imaging force while scanning soft biological cells. Here we perform feedback control in the same way as in amplitude–modulation TM–AFM (by maintaining the amplitude of the fundamental mode of the body cantilever) and achieve good tracking. Importantly, the force sensor allows us to address potential candidates for feedback control not available in other AFM imaging techniques. For instance, the maps of Fmax and J (Figure 2c) show similar changes in the TM–AFM phase (φ0), suggesting their strong correlation with the scanning process. By performing feedback control using these two properties, the invasiveness of the imaging process could be directly minimized. Additionally, the force phase (φforce, Figure 2c) derived from Fts (t) shows a larger dynamic range than the conventional φ0 and improves contrast of the spectrin fibers, suggesting its potential as an improved, sensitive signal for mapping and feedback control.
HB–AFM can be directly used to recognize cell–surface features by mapping the adhesion force or energy dissipation due to adhesion. In this experiment, the maps of Fadh and Wadh (Figure 2) showed minimal contrast because the tip was not functionalized for mapping specific molecular or chemical interactions.
Together, these nanomechanical images provide a quantitative assessment of the biomechanical properties of cells with enhanced image contrast, nanometer spatial resolution, minimal invasiveness due to the low imaging force, and fast imaging rates – all critical features for further application on live cells.
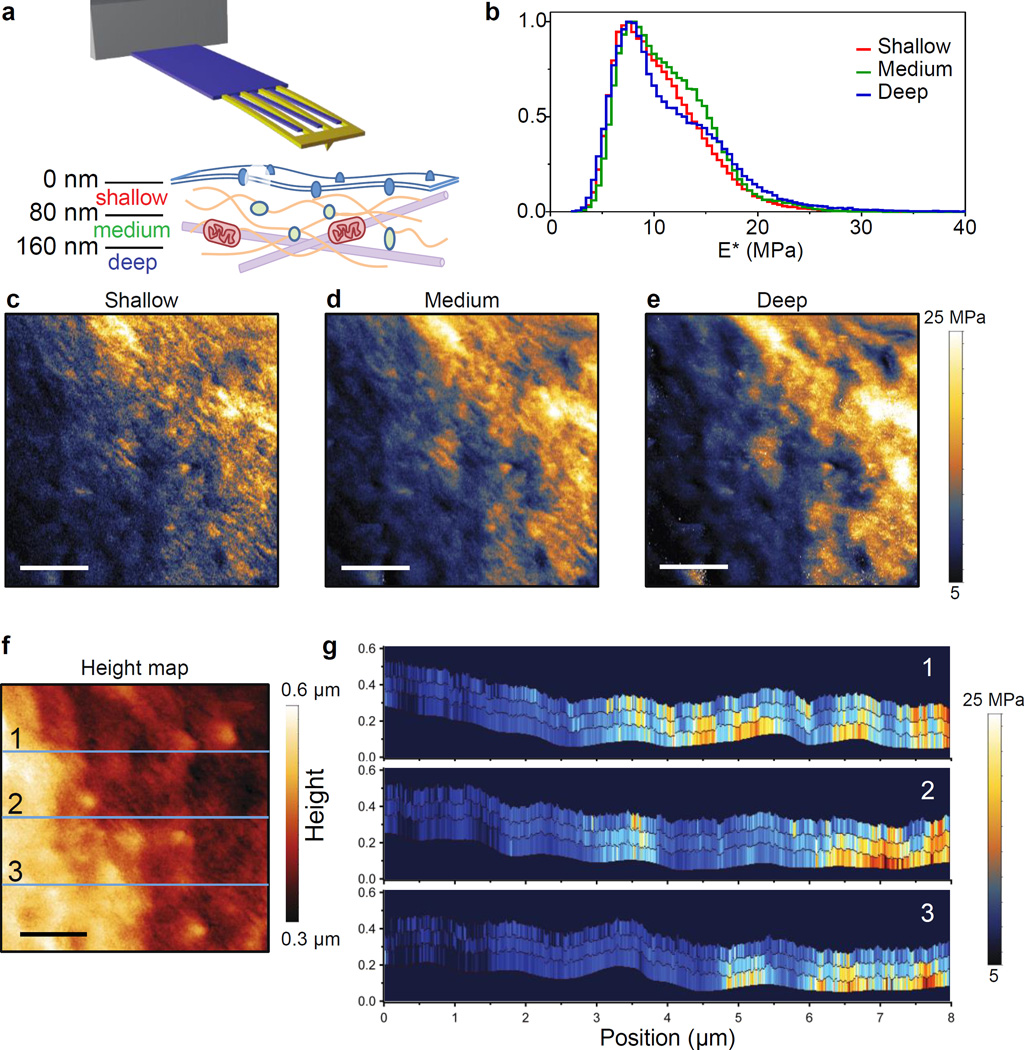
Ideally, measurements of cellular elasticity could distinguish subcellular structures by their depth beneath the cell surface. The idea of stiffness “tomography” has been applied to force–volume (FV) mapping, where the force–distance curves are acquired with a large indentation (up to a few µm).22 In this method, the loading part of the force curve is divided into segments based on indentation depth, and E* values are extracted from each segment, revealing structures deep beneath the cell membrane.23 Here we demonstrate that HB–AFM can generate similar stiffness tomographic maps at a much faster speed than conventional FV mapping. We imaged an 8 µm × 8 µm area on a fixed HeLa (cervical cancer) cell, driving the cantilever with a free amplitude of ~200 nm in liquid (schematically shown in Figure 4a). The histograms of E* values at the three indentation ranges are shown (0–80 nm (shallow), 80–160 nm (medium), and >160 nm (deep), Figure 4b). Maps of the loading E* values at the three depths are shown in Figure 4c–e. We placed three lines on the topography image (Figure 4f) and measured the depth dependent E* of pixels along that line (Figure 4g).
Figure 4. Stiffness tomography of a HeLa cell.
(a) Cartoon showing three indentation ranges: 0–80 nm, 80–160 nm, and beyond 160 nm, probed by the high–bandwidth cantilever. Deep indentation allows for probing stiffness of intracellular structures and extends nanomechanical imaging into the third dimension. (b) Normalized histograms of the loading stiffness (E*load) images for the three indentation ranges. E*load values for each pixel represented the statistically robustified mean of 25 consecutive taps estimated using a goodness–of –fit–weighted bootstrapping method. The E*load value was corrected for close–to–substrate effects.25 (c–e), Stiffness images for the three indentation ranges showing filamentous structures with shallow indentation and clusters of high stiffness structure with deep indentation. Scale bar is 2 µm and the stiffness image size is 665 × 200 pixels. (f) Height map calculated from the point of zero indentation. Three different lines in (f) are shown as depth tomograms in (g). The tomograms show features at different depths.
To demonstrate the power of oversampling of elasticity measurements and to reduce the impact of outlier values for any one tap, we used a weighted bootstrapping method24 to arrive at a robust estimate of E* (Supporting Information Figure S4). To perform the bootstrapping analysis, E* values from 25 consecutive taps were resampled with two imposed refinements: first, each tap was weighted by the R–square value of the stiffness model fit, and second, multiplication by a spatial Gaussian distribution that drops down to zero at the first and 25th tap. The median of the resampled Ē* distribution (E̿*) was calculated, and the E̿* values for the three indentation depth ranges were finally corrected for close–to–substrate effects25 (Supporting Information Figure S5).
When examining the E* maps and tomograms (Figure 4c–e and 4g), we found some interesting features resembling known intracellular structures. For example, a filamentous meshwork is observed in the shallow and medium range of indentation, similar to the spectrin network in RBCs. At deeper indentations, these superficial features become less prominent and finally are not visible in the deep indentation map. It is possible that the superficially located filamentous structures were either pushed aside as the tip moved to deep indentations, or could not be spatially resolved at deeper indentations due to the larger contact area. In the deep indentation map, we observed high stiffness regions that showed globular features resembling intracellular organelles. Nonetheless, to ensure the identities of these observed features, simultaneous fluorescent optical imaging of specifically labelled intracellular structures is needed.
Together these results show that HB–AFM with bootstrapping–based statistical signal processing enable stiffness mapping in quasi–3D with transversal, spatial resolution matching TM–AFM and axial resolution comparable to standard FV, but with much higher imaging speed.
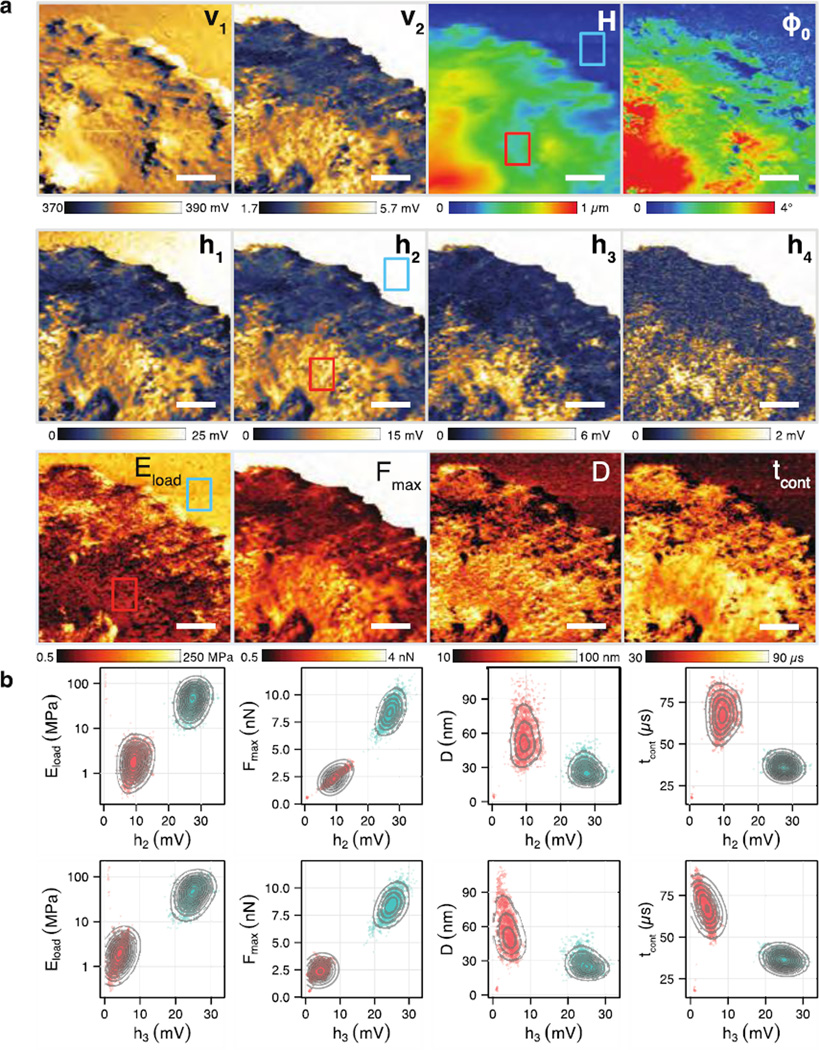
Higher–harmonic/multi–frequency AFM is a powerful imaging mode for generation of high–speed, high–resolution, and quantitative nanomechanical maps.26 However, interpretation of the harmonic images can be difficult without a proper mechanical model, rooted in a mechanistic understanding of the generation of harmonics. Here, with the nanomechanical properties directly measured or derived from the tip–sample interaction forces, we investigated the correlation between higher harmonics and nanomechanical properties. We prepared harmonic images derived from the Fourier components of the high–bandwidth force signal and corresponding nanomechanical images obtained from imaging the lamellipodium of a crawling CD4+ T lymphocyte (Figure 5a). This sample shows a broad range of sample stiffness, ranging from the stiff glass substrate (upper right corner) to the soft sheet of lamellipodium, suitable for exploring mechanical–harmonic correlations on a wide dynamic range.
Figure 5.
Correlation between nanomechanical and harmonic images of the lamellipodia of a CD4+ T lymphocyte. (a) Harmonic images of the cantilever deflection signal (v1 and v2) and sensor deflection signal (h1 through h4), regular TM–AFM images of topography (H) and phase (φ0), and nanomechanical images of stiffness (E*load), maximal indentation (D), peak repulsive force (Fmax) and contact time (tcont). The upper right corner shows the glass substrate and the ring–like structures on the glass region are suspected to be exosomes secreted by the T cell. Two regions of interest (blue: glass; red: cell) were selected to form the pairwise scatter plots. The image scale bar is 1.2 µm and the size is 360 × 200 pixels. (b) Pairwise scatter plots of the harmonic images h2 and h3 versus the four nanomechanical images. The higher harmonic h3 showed higher sensitivity to stiffness, indentation, and contact time compared to h2.
The harmonic images were constructed from the vertical and horizontal photodiode signals using digital comb filtering. The harmonic images of the vertical (v1 and v2) consist of the cantilever deflection and show low SNR beyond the third harmonic, while the harmonic images of the horizontal (h1, h2, h3, etc.) consist of signals from the high–bandwidth force sensor and show visible signals up to the sixth harmonic (Supporting Information Figure S6).
The contrast seen in the second harmonics (v2 and h2) were nearly identical (although the dynamic range of h2 is four times higher than v2), supporting prior work that v2 estimates the stiffness of soft biological samples.4a To test how well higher harmonics extracted from the horizontal force signal can estimate the elastic modulus, we examined the pairwise scatter plots of h2 or h3 with nanomechanical properties (Figure 5b). Two regions of interest (44 × 33 pixels each), one on the glass substrate (blue box) and the other on the cell (red box), were selected to highlight the separation of E* magnitudes. We found the correlation of h2 with the cell E* was 0.077 while h3 was 0.359. This trend was also seen in the glass. On the other hand, h2 showed high correlation with the Fmax on the cell (R2 of 0.869), whereas h3 did not (R2 of 0.101). These results show that both the h2 and h3 harmonics robustly differentiate between the stiff glass and the soft cell, but h3 shows stronger correlation with E*. This result also shows that h2 has a potential use for fast lock–in feedback control of imaging forces (akin to PeakForce), especially critical for scanning soft biological samples. In addition, h3 showed modest correlation with maximal indentation (D) and contact time (tcont) on the cell (R2 of 0.101 and 0.175) whereas h2 did not correlate with these parameters at all (R2 of 0 and 0.004, respectively). These results demonstrate that the higher harmonic signals of HB–AFM can act as surrogates for real–time probing of mechanical properties.
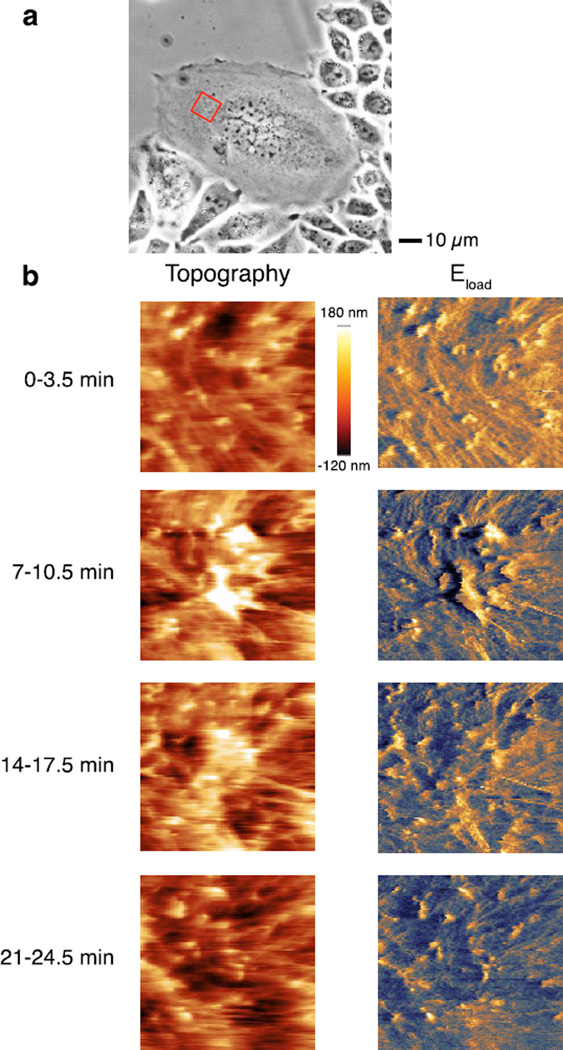
To further demonstrate the capability of this HB–AFM approach to scanning live cells, we serially scanned live CHO cells in a 10 µm × 10 µm region (Figure 6a). The same region of a cell was revisited four times over 30 min, with each scan taking ~3.5 min. As has been reported before, we expected the topographic images to show microvilli and nanoscale protrusions,27 however stiffness maps of these nanostructures have not been measured in tapping mode in the past. These structures are enriched for actin, and so we hypothesized that these structures would have higher mechanical stiffness than other regions of the cell surface. Indeed we found nanoscale features of microvilli and veils had a height of 150–300 nm above the regions without features (Figure 6b). These regions showed an increased stiffness as compared to regions without raised surface features, though we were not able to quantitate it reliably because the stiffness of these live CHO cells was at the floor of sensitivity of the cantilever employed due to its spring constant. There was no injury, such as perforation, to the cells during the scans. These results show that our HB–AFM cantilever and approach are suitable for scanning and measuring mechanical properties of live cells.
Figure 6.
Scanning live CHO cell using high bandwidth interferometric cantilever. (a) Optical microscope image of the cell. Red box shows the approximate region of a CHO cell scanned. (b) Topography and elastic modulus were measured repeatedly, starting each scan every 7 min. The lines were scanned at a rate of 0.6 Hz, with maps of 128 × 128 pixels.
Conclusion
In conclusion, we present a high–bandwidth, AFM–based technique to image mechanical properties of cells with nanometer–resolution, depth–dependence, and high imaging speed. The force–distance curve reconstructed at each tap enables direct calculation, for each nanoindentation, of elasticity, viscoelasticity, and poroelasticity.28 We believe that further increases in the imaging speed of high–bandwidth AFM can be realized by devising smaller, more sensitive force sensors, by improving feedback control (e.g., using the force phase φforce or higher harmonics), and by employing faster line scans (i.e., 100 Hz scan rate). This HB–AFM technique opens the door for practicable, nanomechanical imaging of live cells in states of health and disease (e.g., cancer).
Supplementary Material
Synopsis.
High–Bandwidth cantilever enables complete measurement of the tip–sample interaction force for each tap at 5000 Hz and allows for unprecedented mechanical imaging of cells.
Acknowledgments
We acknowledge assistance of the Stanford Nanocharacterization Laboratory Facility. We thank Dr. Timothy J. Thauland for providing the T cell samples and useful discussions, and Alex Xu for the HeLa cells.
Funding Sources
Financial support for work came from the Stanford Bio–X Interdisciplinary Initiatives Partnership, the Center for Probing the Nanoscale, an NSF NSEC (PHY 0830228), the NIH/NIAID (K08 AI079268), NIH/NIGMS (R01 GM110482), the NSF (CBET 1264833), and the Stanford Child Health Research Institute
ABBREVIATIONS
- AFM
Atomic Force Microscopy
- TM
tapping mode
- FV
Force–volume
- RBC
Red blood cell
- HB
high bandwidth
- CHO
Chinese hamster ovary
Footnotes
Supporting Information. The Supporting Information is available free of charge on the ACS Publications website at DOI: 10.1021/acsnano.5b03959.
REFERENCES
- 1.(a) Fletcher DA, Mullins RD. Cell mechanics and the cytoskeleton. Nature. 2010;463(7280):485–492. doi: 10.1038/nature08908. [DOI] [PMC free article] [PubMed] [Google Scholar]; (b) Vogel V, Sheetz M. Local force and geometry sensing regulate cell functions. Nat Rev Mol Cell Biol. 2006;7(4):265–275. doi: 10.1038/nrm1890. [DOI] [PubMed] [Google Scholar]
- 2.(a) Lim C, Zhou E, Li A, Vedula S, Fu H. Experimental techniques for single cell and single molecule biomechanics. Materials Science and Engineering: C. 2006;26(8):1278–1288. [Google Scholar]; (b) Kim DH, Wong PK, Park J, Levchenko A, Sun Y. Microengineered platforms for cell mechanobiology. Annual review of biomedical engineering. 2009;11:203–233. doi: 10.1146/annurev-bioeng-061008-124915. [DOI] [PubMed] [Google Scholar]
- 3.(a) Costa KD. Single-cell elastography: probing for disease with the atomic force microscope. Dis. Markers. 2003;19:139–154. doi: 10.1155/2004/482680. [DOI] [PMC free article] [PubMed] [Google Scholar]; (b) Muller DJ, Dufrene YF. Atomic force microscopy as a multifunctional molecular toolbox in nanobiotechnology. Nat Nanotechnol. 2008;3(5):261–269. doi: 10.1038/nnano.2008.100. [DOI] [PubMed] [Google Scholar]
- 4.(a) Raman A, Trigueros S, Cartagena A, Stevenson AP, Susilo M, Nauman E, Contera SA. Mapping nanomechanical properties of live cells using multi-harmonic atomic force microscopy. Nat Nanotechnol. 2011;6(12):809–814. doi: 10.1038/nnano.2011.186. [DOI] [PubMed] [Google Scholar]; (b) Forchheimer D, Platz D, Tholén EA, Haviland DB. Model-based extraction of material properties in multifrequency atomic force microscopy. Phys Rev B. 2012;85(19):195449. [Google Scholar]
- 5.Preiner J, Tang J, Pastushenko V, Hinterdorfer P. Higher harmonic atomic force microscopy: imaging of biological membranes in liquid. Phys Rev Lett. 2007;99(4):046102. doi: 10.1103/PhysRevLett.99.046102. [DOI] [PubMed] [Google Scholar]
- 6.(a) Gadelrab K, Santos S, Font J, Chiesa M. Single cycle and transient force measurements in dynamic atomic force microscopy. Nanoscale. 2013;5(22):10776–10793. doi: 10.1039/c3nr03338d. [DOI] [PubMed] [Google Scholar]; (b) Guzman HV, Perrino AP, Garcia R. Peak forces in high-resolution imaging of soft matter in liquid. ACS Nano. 2013;7(4):3198–3204. doi: 10.1021/nn4012835. [DOI] [PubMed] [Google Scholar]; (c) Katan AJ, van Es MH, Oosterkamp TH. Quantitative force versus distance measurements in amplitude modulation AFM: a novel force inversion technique. Nanotechnology. 2009;20(16):165703. doi: 10.1088/0957-4484/20/16/165703. [DOI] [PubMed] [Google Scholar]
- 7.Chopinet L, Formosa C, Rols M, Duval R, Dague E. Imaging living cells surface and quantifying its properties at high resolution using AFM in QI™ mode. Micron. 2013;48:26–33. doi: 10.1016/j.micron.2013.02.003. [DOI] [PubMed] [Google Scholar]
- 8.Pittenger B, Slade A. Performing Quantitative Nanomechanical AFM Measurements on Live Cells. Micros. Today. 2013;21(06):12–17. [Google Scholar]
- 9.Marti O, Holzwarth M, Beil M. Measuring the nanomechanical properties of cancer cells by digital pulsed force mode imaging. Nanotechnology. 2008;19(38):384015. doi: 10.1088/0957-4484/19/38/384015. [DOI] [PubMed] [Google Scholar]
- 10.Young T, Monclus M, Burnett T, Broughton W, Ogin S, Smith P. The use of the PeakForce™ quantitative nanomechanical mapping AFM-based method for high-resolution Young's modulus measurement of polymers. Measurement Science and Technology. 2011;22(12):125703. [Google Scholar]
- 11.Sahin O, Magonov S, Su C, Quate CF, Solgaard O. An atomic force microscope tip designed to measure time-varying nanomechanical forces. Nature nanotechnology. 2007;2(8):507–514. doi: 10.1038/nnano.2007.226. [DOI] [PubMed] [Google Scholar]
- 12.(a) Dong M, Sahin O. A nanomechanical interface to rapid single-molecule interactions. Nature communications. 2011;2:247. doi: 10.1038/ncomms1246. [DOI] [PubMed] [Google Scholar]; (b) Husale S, Persson HH, Sahin O. DNA nanomechanics allows direct digital detection of complementary DNA and microRNA targets. Nature. 2009;462(7276):1075–1078. doi: 10.1038/nature08626. [DOI] [PMC free article] [PubMed] [Google Scholar]
- 13.Sarioglu AF, Magonov S, Solgaard O. Tapping-mode force spectroscopy using cantilevers with interferometric high-bandwidth force sensors. Applied Physics Letters. 2012;100(5):053109-4–053109-4. [Google Scholar]
- 14.(a) Vijayraghavan K, Gellineau AA, Wang A, Butte MJ, Melosh NA, Solgaard O. High-bandwidth AFM probes for imaging in air and fluid. J. Microelectromech. Syst. 2013;22(3):603–612. [Google Scholar]; (b) Vijayraghavan K, Wang A, Solgaard O, Butte M, Melosh N. Measurement of elastic properties in fluid using high bandwidth atomic force microscope probes. Applied Physics Letters. 2013;102(10):103111. [Google Scholar]
- 15.Solgaard O. Photonic microsystems: Micro and nanotechnology applied to optical devices and systems. Springer; 2009. [Google Scholar]
- 16.Legleiter J, Park M, Cusick B, Kowalewski T. Scanning probe acceleration microscopy (SPAM) in fluids: mapping mechanical properties of surfaces at the nanoscale. Proc Natl Acad Sci U S A. 2006;103(13):4813–4818. doi: 10.1073/pnas.0505628103. [DOI] [PMC free article] [PubMed] [Google Scholar]
- 17.Villarrubia JS. Algorithm for scanned probe microscope image simulation, surface reconstruction, and tip estimation. Journal of Research- National Institute of Standards and Technology. 1997;102:425–454. doi: 10.6028/jres.102.030. [DOI] [PMC free article] [PubMed] [Google Scholar]
- 18.(a) Zhao M, Srinivasan C, Burgess DJ, Huey BD. Rate- and depth-dependent nanomechanical behavior of individual living Chinese hamster ovary cells probed by atomic force microscopy. Journal of Materials Research. 2006;21(08):1906–1912. [Google Scholar]; (b) Zhang CY, Zhang YW. Effects of membrane pre-stress and intrinsic viscoelasticity on nanoindentation of cells using AFM. Philosophical Magazine. 2007;87(23):3415–3435. [Google Scholar]; (c) Rosenbluth MJ, Lam WA, Fletcher DA. Force microscopy of nonadherent cells: a comparison of leukemia cell deformability. Biophys J. 2006;90(8):2994–3003. doi: 10.1529/biophysj.105.067496. [DOI] [PMC free article] [PubMed] [Google Scholar]
- 19.(a) Takeuchi M, Miyamoto H, Sako Y, Komizu H, Kusumi A. Structure of the erythrocyte membrane skeleton as observed by atomic force microscopy. Biophys J. 1998;74(5):2171–2183. doi: 10.1016/S0006-3495(98)77926-3. [DOI] [PMC free article] [PubMed] [Google Scholar]; (b) Nowakowski R, Luckham P, Winlove P. Imaging erythrocytes under physiological conditions by atomic force microscopy. Biochimica et biophysica acta. 2001;1514(2):170–176. doi: 10.1016/s0005-2736(01)00365-0. [DOI] [PubMed] [Google Scholar]
- 20.Matsuoka Y, Li X, Bennett V. Adducin: structure, function and regulation. Cellular and molecular life sciences : CMLS. 2000;57(6):884–895. doi: 10.1007/PL00000731. [DOI] [PMC free article] [PubMed] [Google Scholar]
- 21.Waugh RE, Agre P. Reductions of erythrocyte membrane viscoelastic coefficients reflect spectrin deficiencies in hereditary spherocytosis. J Clin Invest. 1988;81(1):133–141. doi: 10.1172/JCI113284. [DOI] [PMC free article] [PubMed] [Google Scholar]
- 22.Roduit C, Sekatski S, Dietler G, Catsicas S, Lafont F, Kasas S. Stiffness tomography by atomic force microscopy. Biophys J. 2009;97(2):674–677. doi: 10.1016/j.bpj.2009.05.010. [DOI] [PMC free article] [PubMed] [Google Scholar]
- 23.McLeod MA, Wilusz RE, Guilak F. Depth-dependent anisotropy of the micromechanical properties of the extracellular and pericellular matrices of articular cartilage evaluated via atomic force microscopy. Journal of biomechanics. 2013;46(3):586–592. doi: 10.1016/j.jbiomech.2012.09.003. [DOI] [PMC free article] [PubMed] [Google Scholar]
- 24.Barbe P, Bertail P. The Weighted Bootstrap. New York: Springer; 1995. [Google Scholar]
- 25.Gavara N, Chadwick RS. Determination of the elastic moduli of thin samples and adherent cells using conical atomic force microscope tips. Nat Nanotechnol. 2012;7(11):733–736. doi: 10.1038/nnano.2012.163. [DOI] [PMC free article] [PubMed] [Google Scholar]
- 26.(a) Hillenbrand R, Stark M, Guckenberger R. Higher-harmonics generation in tapping-mode atomic-force microscopy: Insights into the tip–sample interaction. Applied Physics Letters. 2000;76(23):3478–3480. [Google Scholar]; (b) Preiner J, Tang J, Pastushenko V, Hinterdorfer P. Higher harmonic atomic force microscopy: imaging of biological membranes in liquid. Physical Review Letters. 2007;99(4):6102. doi: 10.1103/PhysRevLett.99.046102. [DOI] [PubMed] [Google Scholar]; (c) Xu X, Melcher J, Basak S, Reifenberger R, Raman A. Compositional contrast of biological materials in liquids using the momentary excitation of higher eigenmodes in dynamic atomic force microscopy. Physical Review Letters. 2009;102(6):60801. doi: 10.1103/PhysRevLett.102.060801. [DOI] [PubMed] [Google Scholar]; (d) Lozano JR, Garcia R. Theory of Multifrequency Atomic Force Microscopy. Physical Review Letters. 2008;100(7):076102. doi: 10.1103/PhysRevLett.100.076102. [DOI] [PubMed] [Google Scholar]
- 27.Deng Z, Zink T, Chen HY, Walters D, Liu FT, Liu GY. Impact of actin rearrangement and degranulation on the membrane structure of primary mast cells: a combined atomic force and laser scanning confocal microscopy investigation. Biophys J. 2009;96(4):1629–1639. doi: 10.1016/j.bpj.2008.11.015. [DOI] [PMC free article] [PubMed] [Google Scholar]
- 28.Moeendarbary E, Valon L, Fritzsche M, Harris AR, Moulding DA, Thrasher AJ, Stride E, Mahadevan L, Charras GT. The cytoplasm of living cells behaves as a poroelastic material. Nat Mater. 2013;12(3):253–261. doi: 10.1038/nmat3517. [DOI] [PMC free article] [PubMed] [Google Scholar]
Associated Data
This section collects any data citations, data availability statements, or supplementary materials included in this article.


