

Abstract
Background and Aims Brachypodium distachyon (Brachypodium) is a model system for studying cereal, bioenergy, forage and turf grasses. The genetic and evolutionary basis of the adaptation of this wild grass species to drought stress is largely unknown. Peroxidase (POD) may play a role in plant drought tolerance, but whether the allelic variations of genes encoding the specific POD isoenzymes are associated with plant response to drought stress is not well understood. The objectives of this study were to examine natural variation of POD isoenzyme patterns, to identify nucleotide diversity of POD genes and to relate the allelic variation of genes to drought tolerance traits of diverse Brachypodium accessions.
Methods Whole-plant drought tolerance and POD activity were examined in contrasting ecotypes. Non-denaturing PAGE and liquid chromatography–mass spectrometry were performed to detect distinct isozymes of POD in 34 accessions. Single nucleotide polymorphisms (SNPs) were identified by comparing DNA sequences of these accessions. Associations of POD genes encoding specific POD isoenzymes with drought tolerance traits were analysed using TASSEL software.
Key Results Variations of POD isoenzymes were found among accessions with contrasting drought tolerance, while the most tolerant and susceptible accessions each had their own unique POD isoenzyme band. Eight POD genes were identified and a total of 90 SNPs were found among these genes across 34 accessions. After controlling population structure, significant associations of Bradi3g41340.1 and Bradi1g26870.1 with leaf water content or leaf wilting were identified.
Conclusions Brachypodium ecotypes have distinct specific POD isozymes. This may contribute to natural variations of drought tolerance of this species. The role of specific POD genes in differentiating Brachypodium accessions with contrasting drought tolerance could be associated with the general fitness of Brachypodium during evolution.
Keywords: Brachypodium distachyon, drought tolerance, gene and trait association, natural variation, peroxidase, single nucleotide polymorphism
INTRODUCTION
Brachypodium distachyon (Brachypodium) is a temperate, monocot wild grass species and it possesses all the qualities to make it an excellent model organism (Garvin et al., 2008; Bevan et al., 2010). It has diploid ecotypes containing five chromosomes, easily distinguishable chromosomes (2n = 10), small genome size (approx. 300 Mbp), self-fertility, small physical status, short life cycle and a simple growth requirement (Draper et al., 2001). This species is phylogenetically closer to some economically important food and bioenergy crops than is rice (Oryza sativa) (Draper et al., 2001), thus providing a powerful tool for studying functional and ecological genomics aimed at improving grain, forage and bioenergy crops. To date, genetic and genomic resources for Brachypodium have been developed, including the entire genomic sequence (Vogel et al., 2010), a genetic linkage map (Garvin et al., 2010), a high-efficiency transformation system (Vogel et al., 2006; Pãcurar et al., 2008; Vogel and Hill, 2008), T-DNA mutants (Bragg et al., 2012; Thole et al., 2012) and genome diversity (Gordon et al., 2014). All these tools and resources are valuable for examining the genetic and evolutionary basis of complex traits such as abiotic stress tolerance.
Antioxidant metabolism plays a role in drought tolerance of the plants. As one of the reactive oxygen species, hydrogen peroxide (H2O2) is a by-product of biological reactions in the plant cell. Adverse environmental conditions such as drought stress can promote excess accumulation of H2O2, potentially leading to oxidative damage to protein, DNA and lipids (Apel and Hirt, 2004). The degree of lipid peroxidation, indicated by the level of malondialdehyde (MDA) content, often increased under drought stress in plant species (Zhang and Kirkham, 1996; Jiang et al., 2010; Xu et al., 2011; Liu and Jiang, 2015). Removal of H2O2 is accomplished by the action of several antioxidant enzymes at different cellular locations. Of the antioxidative enzymes, peroxidase (POD) catalyses the reduction of H2O2 to water, followed by subsequent oxidation of small molecules (Smith and Veitch, 1998). Drought stress often induces POD activity in many plant species (Jung, 2004; Sofo et al., 2005; Upadhyaya et al., 2008; Selote and Khanna-Chopra, 2010; Ying et al., 2015). The tolerant genotype of maize (Zea mays) exhibited lower accumulation of MDA and H2O2 content related to increasing activities of POD and other antioxidant enzymes under water stress conditions (Moussa and Abdel-Aziz, 2008). Increases in POD activities were also found at the vegetative and flowering stages of seven species within the genus Avena under drought stress, coupled with an increased level of lipid peroxidation (Pandey et al., 2010). However, POD activity also remained unchanged in some annual and perennial grass species exposed to drought stress (Zhang and Kirkham, 1996; Zhang and Schmidt, 1999; Fu and Huang, 2001; Bian and Jiang, 2009; Jiang et al., 2010). Although two cultivars of Kentucky bluegrass (Poa pratensis) did not differ in POD activities under drought stress, the drought-tolerant cultivar exhibited significantly higher POD activities compared with the sensitive one after rewatering (Xu et al., 2011). The results demonstrated complex responses of POD to drought stress, influenced by plant species, cultivar, stress intensity and duration.
In spite of their role in detoxification, PODs have remarkable catalytic versatility involved in a broad range of physiological and developmental processes, including initiation of seed germination (Morohashi, 2002), cellular growth and cell wall loosening (Cosgrove, 2001), cell wall cross-linking (Passardi et al., 2004b ), lignification and suberization (Lopez-Serrano et al., 2004), differentiation (Kim et al., 2004), senescence (Ranieri et al., 2000) and plant–pathogen and plant–insect interactions (Delannoy et al., 2003; Gulsen et al., 2010a ). Existing as isoenzymes in plant species, the class III plant POD is a haem-containing glycoprotein encoded by a large number of superfamily genes in land plants (Welinder, 1992a , b ; Hiraga et al., 2001). For example, the Arabidopsis genome contains 73 genes encoding POD (Tognolli et al., 2002), while rice has 138 (Passardi et al., 2004a ). The homology between paralogues in a plant ranges from 30 to 100 %, but very close orthologues exist even between evolutionarily distant plants (Bakalovic et al., 2006). More recently, Wang et al. (2015) identified 119 non-redundant POD genes in maize, which were divided into 18 groups based on their phylogenetic relationships. Although plant PODs are a family of related proteins possessing highly conserved domains, grasses contain some unique POD clusters not seen in dicot plants, represented by Arabidopsis (Duroux and Welinder, 2003). By using POD gene polymorphism, genotypic diversity has been examined among Cynodon accessions (Gulsen et al., 2009), apple (Malus domestica) germplasm (Gulsen et al., 2010b ), and Buffalograss (Bouteloua dactyloides) and other perennial grass species (Gulsen et al., 2007). Peroxidase profiling also reveals genetic linkage between POD gene clusters and basal host and non-host resistance to rusts and mildew in barley (Hordeum vulgare) (González et al., 2010). These results demonstrate that the POD gene family can be used to study genotypic diversity and evolutionary relationships on an intra- and inter-specific basis. Senescence- and drought-related changes in two POD isoforms in leaves of Ramonda serbica have been observed (Veljovic-Jovanovic et al., 2006). Although research results have revealed the functional diversity of PODs, the role of a specific POD isoenzyme in drought tolerance is not clearly determined, especially at the population level for a grass species.
Natural populations are often collected from a wide range of geographical locations that have enormous diversity, which can maximize the potential of populations to withstand and adapt to biotic and abiotic environmental changes (Jump et al., 2009). Natural Brachypodium accessions broadly group into winter and spring annuals, and this may impact plant responses to environments. Luo et al. (2011) found that 57 Brachypodium natural accessions varied considerably in whole-plant responses to drought stress and they were classified into most tolerant, moderately tolerant, susceptible and most susceptible groups. Comparative analysis of the cold acclimation and freezing tolerance capacities of seven diploid Brachypodium accessions revealed only a limited capacity to develop freezing tolerance when compared with winter varieties of temperate cereals such as wheat (Triticum aestivum) and barley (Colton-Gagnon et al., 2014). In addition to stress tolerance, Schwartz et al. (2010) reported that VRN (vernalization regulator) and a portion of the phenotypic variation of flowering time and vernalization was associated with changes in expression of orthologues of VRN genes in Brachypodium accessions. Variation of phenotypic traits such as plant height, growth habit, stem density, flowering time, seed weight and cell wall composition were also observed among inbred lines (Tyler et al., 2014). Natural populations of Brachypodium exhibit distant genetic distance patterns (Vogel et al., 2009); however, the mechanisms of environmental adaptation during evolution are not well understood in Brachypodium. For example, it is not well understood whether some candidate genes encoding POD contribute to variable drought responses of natural accessions.
Although it can be challenging to determine the functions of a large number of isoenzymes in a single plant species, accumulation of information on individual genes should lead to a better understanding of the role of POD in natural variation of stress tolerance and related physiological processes. It is important to know whether allelic variation of genes encoding the specific isoenzymes is associated with plant response to stressful environments. For example, PODs appear to be associated with plant disease resistance based on the presence or absence of isozymes in resistant vs. susceptible varieties. Despite these associations, there is no evidence that the allelic variation of POD directly determines the level of disease resistance (González et al., 2010). Therefore, the objectives of this study were to examine natural variation of the POD isoenzyme, to identify nucleotide diversity of POD genes and to relate the allelic variation of genes to traits of diverse Brachypodium accessions. Knowledge obtained about Brachypodium natural variation of PODs increases our understanding of stress resistance among grass species or ecotypes within a species that have evolved in different geographic and adaptive conditions.
MATERIALS AND METHODS
Plant materials and growing conditions
For examining drought tolerance and isoenzymes, drought-tolerant (T-9) and intolerant (B2C) accessions of Brachypodium were propagated with the tillers in plastic pots containing a sandy-loam soil with a pH of 6·9 in a greenhouse at Purdue University, West Lafayette, IN, USA. Each pot had the same volume of soil and number of plants. Seedlings were grown in a greenhouse with a 12 h photoperiod at average temperatures of 23/20 °C (day/night). The average intensity of photosynthetically active radiation (PAR) was approx. 415 μmol m–2 s–1 during the experiment. Plants were watered every 2 d and fertilized once a week with a soluble fertilizer (N-P2O5-K2O, 24-8-16) (Scotts Inc., Marysville, OH, USA) and micronutrients at the rate of approx. 0·25 g nitrogen L–1. No nutrient deficiency symptoms were observed for any of the plants. The selection of these two accessions was based on our previous study of whole-plant drought response of Brachypodium (Luo et al., 2011). Subsequently, 34 accessions were selected for detecting POD isoenzyme pattern, population structure, and gene and trait association (Table 1), based on maximization of the geographic and genetic diversity available in these materials (Vogel et al., 2009) as well as phenotypic variation in drought responses (Luo et al., 2011). With the exception of B21, B3-1 and B2-3 from Iraq, all accessions were from Turkey, which lies in the centre of the natural range of Brachypodium and contains all of the environments Brachypodium inhabits, including co astal regions, hot interior deserts and cold northern highlands (Vogel et al., 2009). Growth conditions of the 34 Brachypodium accessions were the same as the conditions for growing T-9 and B2C described above.
Table 1.
Experiment identification (ID) and drought tolerance (DT) of Brachypodium distachyon accessions used in this study
| ID | Abbreviation | Accession* | DT † | ID | Abbreviation | Accession | DT |
|---|---|---|---|---|---|---|---|
| 34 | T-9 | Tek-9 | T | 19 | B30-1 | Bd30-1 | S |
| 31 | T-10 | Tek-10 | T | 17 | B2K | BdTR2K | S |
| 4 | B1-1 | Bd1-1 | T | 16 | B2D | BdTR2D | S |
| 27 | G-5 | Gaz-5 | M | 26 | B9K | BdTR9K | S |
| 8 | B13A | BdTR13A | M | 22 | B7B | BdTR7B | S |
| 9 | B13E | BdTR13E | M | 5 | B10C | BdTR10C | S |
| 1 | A-10 | Adi-10 | M | 10 | B13M | BdTR13M | S |
| 2 | A-14 | Adi-14 | M | 13 | B21 | Bd21 | S |
| 3 | A-2 | Adi-2 | M | 28 | Kh-1 | Kah-1 | S |
| 32 | T-2 | Tek-2 | M | 29 | Kh-3 | Kah-3 | S |
| 33 | T-7 | Tek-7 | M | 30 | Koz-4 | Koz-4 | S |
| 77 | B11C | BdTR11C | M | 15 | B2C | BdTR2C | MS |
| 6 | B11A | BdTR11A | M | 14 | B2B | BdTR2B | MS |
| 24 | B8I | BdTRB8I | M | 25 | B9B | BdTR9B | MS |
| 23 | B8C | BdTR8C | M | 18 | B3-1 | Bd3-1 | MS |
| 21 | B3R | BdTR3R | M | 12 | B2-3 | Bd2-3 | MS |
| 20 | B3J | BdTR3J | M | 11 | B18-1 | Bd18-1 | MS |
*B21, B3-1 and B2-3 are from Iraq; all other accessions are from Turkey (Vogel et al., 2009).
†T, M, S and MS indicate the most tolerant, moderately tolerant, susceptible and most susceptible accessions, respectively.
Results were based on a study by Luo et al. (2011).
Drought treatment
All pots of T-9 and B2C were kept well watered until drought stress was initiated. Drought stresses started on 6 April 2010 after grasses were grown for 21 d from tiller propagation on 16 March 2010. Drought stress was imposed by withholding water from the grasses until permanent wilting (the leaves were no longer rehydrated at night and in the morning) occurred to the plants, especially for the intolerant plants. Drought stress ended on 12 April 2010, at 7 d after stress was initiated. Leaves and roots were harvested at the end of drought treatment and kept frozen (–80 °C) for further analysis.
The experiment was a randomized complete block design with four replicates. The well-watered and drought-stressed grass pots were arranged randomly within a block. Data were analysed for the significance of the treatments for a given measurement using Statistical Analysis System (version 9.1; SAS Institute, Cary, NC, USA). The means of the treatments were separated using the Least Significant Difference (LSD) at a 0·05 significant level.
Whole-plant measurements
Leaf wilting was visually rated on a scale of 0 (no observable wilting) to 3 (severely wilted or almost dead) (Luo et al., 2011). Leaf photochemical efficiency was determined by measuring chlorophyll fluorescence (F v/F m) in the dark on randomly selected leaves in each pot using a fluorescence meter (OS-30P, OPTI-Sciences, Hudson, NH, USA). At the end of drought stress (7 d), approx. 3 g of leaf and 5 g of soil were collected, and leaf water content (LWC) and soil water content (SWC) were measured according to the equation: WC = (f. wt – d. wt)/f. wt × 100, where f. wt is fresh weight and d. wt is dry weight for leaf or soil samples, respectively.
Assay of hydrogen peroxide and malondialdehyde
The H2O2 content was determined according to the method of Bernt and Bergmeyer (1974) with some modifications. A 0·1 g powder sample of leaf or root was homogenized in 0·4 mL of 100 mm sodium phosphate buffer (pH 6·8), and extracts were then centrifuged at 16 000 g for 15 min at 4 °C. A 0·17 mL aliquot of supernatant was added to 0·83 mL of peroxidase reagent containing 83 mm sodium phosphate (pH 7·0), 0·005 % (w/v) o-dianisidine and 40 μg peroxidase mL–1. The mixture was incubated at 30 °C for 10 min, and 0·17 mL of 1 n perchloric acid was added to stop the reaction. The absorbance was read at 436 nm. The H2O2 concentration was calculated by using a standard curve with known concentration.
Malondialdehyde has been widely used as a convenient biomarker for lipid peroxidation of omega-3 and omega-6 fatty acids because of its facile reaction with thiobarbituric acid (TBA) (Esterbauer and Cheeseman, 1990; Ayala et al., 2014). The concentration of MDA was determined to assess the degree of lipid peroxidation using the method of Dhindsa et al. (1981) with minor modification. An 80 mg leaf or root sample was homogenized in 1·2 mL of 1 % trichloroacetic acid. The mixture was centrifuged at 10 000 g for 10 min. A 0·5 mL aliquot of supernatant was added to 2 mL of reaction solution (20 % trichloroacetic acid containing 0·5 % TBA). The mixture was heated at 95 °C for 30 min, quickly cooled in an ice bath, and then centrifuged at 10 000 g for 10 min. The absorbance was read at 532 and 600 nm.
POD activity and isoenzyme detection
For leaf enzyme extraction, 0·1 g of ground powder sample was homogenized with 1·2 mL of extraction buffer [50 mm potassium phosphate, 1 mm EDTA, 1 % polyvinylpyrrolidone (PVP), pH 7·8). For root enzyme extraction, 0·12 g of powder sample was homogenized with 0·72 mL of the same extraction buffer. The mixtures were centrifuged at 15 000 g for 25 min at 4 °C and the supernatant was collected. Protein content was determined according to Bradford (1976). POD activity was determined by following changes in absorbance at 470 nm (Bian and Jiang, 2009). Details of the methods were described by Zhang and Kirkham (1996).
Electrophoretic separation of isoenzymes was performed using non-denaturing PAGE described by Laemmli (1970), except that SDS was omitted; 8 % stacking and 3 % resolving polyacrylamide gels were used with running buffer at pH 8·5. Equal amounts of protein (30 μg) for the leaf samples were loaded. Native gels were stained for POD activity according to the method of Srivastava and Van Huystee (1977) with some modifications. Briefly, gels were soaked in 100 mm potassium phosphate buffer (pH 6·5) for 15 min and then stained in 12·5 mm guaiacol containing 12 mm H2O2.
Protein identification by mass spectrometry
Two mass spectroscopy techniques, matrix-assisted laser desorption (MALDI) (Baumgarner et al., 2013) and liquid chromatography-electrospray ionization (ESI) tandem mass spectrometry (LC-ESI-MS/MS) (Park et al., 2012), were used for protein identification. Briefly, distinct isoenzymes of POD from the selected drought-tolerant and susceptible accessions were recovered from a native PAGE gel. The bands were excised from the gel and processed in the Purdue University Proteomics core facility in the Bindley Biosciences Center for in-gel digestion (Jiménez et al., 1998) and then analysed by MADLI and LC-ESI-MS/MS analysis. The digested peptide solution was spotted on the plate, and peptide identification was performed using MALDI time-of-flight/time-of-flight (TOF/TOF) on an AB 4800 Plus Analyzer (Applied Biosystems) (Baumgarner et al., 2013). MALDI data were analysed using GPS Explorer™ Software (Applied Biosystems). Searches were performed using MS and MS/MS data against databases for Brachypodium, rice, Arabidopsis and green plants from the National Center for Biotechnology Information (NCBI). In addition, the digested peptides were extracted and separated in a nano-HPLC system (Agilent 110, Agilent Technologies, San Jose, CA, USA), coupled with an ESI hybrid linear ion trap quadrupole Orbitrap mass spectrometer (ESI-LTQ-Orbitrap XL) (Park et al., 2012). Peptides were separated with a C18 reversed phase ZORBAX 300SB-C18 analytical column (150 mm × 75 μm, 3·5 μm) from Agilent. The peptides were eluted from the column with a linear gradient of 5–40 % buffer B (acetonitrile/0·1 % formic acid) in buffer A (water/0·1 % formic acid) over 35 min at a rate of 0·3 μL min–1 followed by a gradient of 40–95 % B for 40–55 min. The column was equilibrated with 5 % buffer B (acetonitrile/0·1 % formic acid) for 55–70 min. The MS spectra were acquired in positive mode in a range from 300 to 2000. The MS/MS spectra were acquired in a data-dependent acquisition mode in which the full MS scan (resolution 30 000) was followed by four MS/MS scans for the most abundant molecular ions and fragmented by collision-induced dissociation (CID) using a normalized collision energy of 35 %. Peptide data (MS/MS) information from LTQ-Orbitap were analysed using the AB 4800 Plus/Protein Pilot software (Applied Biosystems) against the SwissProt database. Peptides with similarity values >95 % were considered toward identification of a given protein, with a minimum of two peptides required for positive identification.
DNA extraction and sequencing
Primers were designed to amplify genomic fragments for each gene (Table 3). Genomic DNA of the 34 accessions was extracted using a modified hexadecyltrimethylammonium bromide protocol (Doyle and Doyle, 1990) and purified using a PureLink™ Quick Gel Extraction Kit (Invitrogen, Carlsbad, CA, USA). PCR amplification of the gene fragment was conducted with one cycle at 95 °C for 4 min, followed by 35 cycles of 95 °C for 30 s, 53 °C for 30 s, 72 °C for 60 s, and a final extension step at 72 °C for 5 min. Bands of the expected size were cut from the gel and recovered using a ZR-96 Zymoclean™ Gel DNA Recovery Kit (Zymo Research Corporation, Irvine, CA, USA). The recovered DNA was used for sequencing PCRs with a BigDye Terminator kit with one cycle at 96 °C for 1 min, followed by 35 cycles of 96 °C for 10 s, 50 °C for 5 s and 60 °C for 4 min. After the clean up with ethanol/sodium acetate solution, the purified DNA was sequenced on an ABI 3730XL sequencer (Applied Biosystems Inc., Foster City, CA, USA) at the Genomics Core Facility at Purdue University.
Table 3.
Primers for gene amplification in Brachypodium distachyon
| Gene | Forward primer | Reverse primer |
|---|---|---|
| Bradi1g41900.1 | 5′-CATCCGCATCTTCTTCCACGA-3′ | 5′-TTGACCATCCGGCAATTCCT-3′ |
| Bradi2g04490.1 | 5′-ACTGTCCTGATGCCGAGGATA-3′ | 5′-TTGAAGAAGCTCGCGTCGAA-3′ |
| Bradi3g41340.1 | 5′-AGGAGATCAAGGCCAAGCTCAA-3′ | 5′-TACACGATCGAGAACCGATGGA-3′ |
| 5′-TGTTTCCTTCCCTTTTTTCTC-3′ | 5′-GCTTGGACAGACAGTCGATTA-3′ | |
| 5′-ACGAGATTAGTTAAAGCCAAGG-3′ | 5′-GTTCACGCTCCCCTCATCC-3′ | |
| Bradi1g63060.1 | 5′-AGCTGAGCTGGAACCATCAA-3′ | 5′-CAGTCGCAAATGCTCCACAA-3′ |
| 5′-TGTCCCTCAACTATTGGCATC-3′ | 5′-TTCTCAAAACCCTGGTGCTG-3′ | |
| 5′-AAGTAGAACATGCCTCCTCGAT-3′ | 5′-GGTAGGGTGAGGTCCACAAAAA-3′ | |
| Bradi1g26870.1 | 5′-TCGCGAATCCATTTCTCCGA-3′ | 5′-AAACACCTCCCGTGCATTGT-3′ |
| 5′-GTGCCCTACTGGTCGCTCAA-3′ | 5′-GGAGCGAAGTAGCACGCAGTA-3′ | |
| Bradi4g32800.1 | 5′-TCCAGTTCCATGACTGCTTCGT-3′ | 5′-AAGGCATTCTGGTCCTTGCT-3′ |
| Bradi5g00690.1 | 5′-AAATCGCCATTGGCCCGTAT-3′ | 5′-TACTGGTTGTCGAACCGGAACT-3′ |
| Bradi1g65820.2 | 5′-TTTACCTCCCAGTAGCAGCCAT-3′ | 5′-TTCCAAGAGCAACCAACCCA-3′ |
Nucleotide diversity (π) and linkage disequilibrium (LD)
DNA sequence data from 29–34 accessions were aligned by DNASTAR (DNASTAR, Inc., Madison, WI, USA), depending on the quality of sequencing results for the individual genes (Table 4). π, LD and neutrality tests were estimated using DnaSP5.0 (Rozas and Rozas, 1999). The nucleotide level was assayed by nucleotide polymorphism (θ) (Watterson, 1975) and π (Nei, 1987). Values from Tajima’s D test were separated by the standard deviation of π and θ w and reflected the differences between the number of singletons and total number of mutations (Tajima, 1989). Decay of LD with distance in base pairs between sites within the same gene was evaluated by non-linear regression. The LD descriptive statistic r 2 (Hill and Robertson, 1968) was calculated using TASSEL software (Bradbury et al., 2007). Neighbor–Joining trees were created based on haplotype sequences for each candidate gene using nucleotide number of differences as a distance measure and were calculated with TASSEL software.
Table 4.
Gene length, sequence length, single nucleotide polymorphism (SNP) and SNP frequency in the whole length and coding region of peroxidase genes
| Gene | n | Whole length (bp) | CDS for gene (bp) | Sequencing length (bp) | CDS for sequencing (bp) | Sequencing SNP number | Coding SNP number | Whole SNP frequency | Coding SNP frequency |
|---|---|---|---|---|---|---|---|---|---|
| Bradi1g41900.1 | 34 | 1332 | 1122 | 804 | 737 | 8 | 5 | 101 | 147 |
| Bradi2g04490.1 | 29 | 1608 | 981 | 1060 | 557 | 14 | 12 | 76 | 46 |
| Bradi3g41340.1 | 33 | 2911 | 1008 | 1184 | 151 | 3 | 0 | 395 | – |
| Bradi1g63060.1 | 32 | 3176 | 966 | 1782 | 424 | 12 | 5 | 149 | 85 |
| Bradi1g26870.1 | 34 | 1449 | 1047 | 1271 | 1032 | 9 | 7 | 141 | 147 |
| Bradi4g32800.1 | 30 | 1483 | 1044 | 841 | 624 | 18 | 10 | 47 | 62 |
| Bradi5g00690.1 | 33 | 1365 | 693 | 670 | 373 | 8 | 5 | 84 | 75 |
| Bradi1g65820.2 | 34 | 3166 | 753 | 1566 | 395 | 18 | 0 | 87 | – |
| Mean | 32 | 2061 | 952 | 1147 | 537 | 11 | 6 | 135 | 94 |
n, the number of accessions for which a certain gene could be sequenced; whole length, the genome sequence of the gene; CDS for gene, the coding region of a gene; sequencing length, the entire sequenced length for a gene in this study; CDS for sequencing, the sequenced length for the coding region in this study; sequencing SNP number, number of SNPd discovered in the entire sequenced length; coding SNP number, number of SNP discovered in the sequenced length for the coding region; whole SNP frequency, calculated by the entire sequenced length/SNP, stands for the average SNP per bp length; coding SNP frequency, the sequenced length for the coding region/SNP, stands for the average SNP per bp length.
Association analysis of single nucleotide polymorphisms (SNPs) with traits
The population structure was assessed using 46 simple sequence repeats (SSRs) (Vogel et al., 2009) by STRUCTURE software (Pritchard et al., 2000); the detailed procedure was described previously (Yu et al., 2013). Individual SNPs with each trait were tested with the simple linear model and population structure implemented model using TASSEL software (Bradbury et al., 2007). SNP markers with minor allele frequency <5 % were filtered from the association analysis. The SNPs that passed P < 0·05 were deemed significant.
Gene expression
Real-time quantitative reverse transcription–PCR (qRT–PCR) was conducted to examine gene expression in the control and drought-stressed leaf samples of T-9 and B2C. Briefly, total RNA was isolated with a Direct-zol™ RNA MiniPrep Kit (Zymo Research Corporation) and then used for reverse transcription with an iScript™ cDNA Synthesis Kit (Bio-Rad, Hercules, CA, USA). Reaction mixtures were incubated for 5 min at 25 °C, 30 min at 42 °C and 5 min at 85 °C. qRT–PCR was performed with a CFX96 Touch™ Real-Time PCR Detection System using an iTaq™ Universal SYBR® Green Kit (Bio-Rad), with reaction for 3 min at 95 °C followed by 40 amplification cycles of 10 s at 95 °C and 1 min at 60 °C. Primers for amplification were as follows: for Bradi3g41340.1, Forward 5′-GCAGCAACCTGGAGAAGAT-3′ and reverse 5′-GGCAGTCGTGGAAGAAGAG-3′; for Bradi1g26870.1, Forward 5′-TCTTCGGTTCTCTCCTTCCT-3′ and reverse 5′-ATCGCAGGCTTCCTTGTT-3′. The transcript level of S-adenosylmethionine decarboxylase (SamDC) was used as a housekeeping gene (Hong et al., 2008). The method of 2–ΔΔCT (Livak and Schmittgen, 2001) was used to calculate the expression level under drought-stressed conditions relative to that under control conditions. The analysis included three biological replicates (three pots) and three technical replicates for each accession under control and drought stress conditions.
RESULTS
Whole-plant response to drought stress
The SWC dropped from 19·5 to 5·5 % for T-9 and from 18·7 to 4·4 % for B2C under drought stress (Table 2). The reductions in SWC under drought stress was >70 % for both accessions, compared with their respective controls. The LWC was significantly reduced from 77·3 to 59·3 % for T-9 and from 76·0 to 46·2 % for B2C after 7 d of drought stress. Drought stress did not change chlorophyll fluorescence (F v/F m) for T-9, but significantly decreased F v/F m for B2C, compared with the control (Table 2).
Table 2.
Effects of 7 d drought stress on soil moisture content (SWC), leaf water content (LWC) and chlorophyll fluorescence (F v/F m) of Brachypodium distachyon
| Accession | Treatment | SWC (%) | LWC (%) | F v/F m |
|---|---|---|---|---|
| T-9 | Control | 19·5 ± 0·62a* | 77·3 ± 0·45a | 0·81 ± 0·002a |
| Drought | 5·5 ± 0·34b | 59·3 ± 4·46b | 0·81 ± 0·003a | |
| B2C | Control | 18·7 ± 1·01a | 76·0 ± 0·33a | 0·82 ± 0·005a |
| Drought | 4·4 ± 0·19b | 46·2 ± 8·92b | 0·78 ± 0·017b |
Values are mean ± s.d.
*Means followed by the same letter within a column for a given line were not significantly different at P < 0·05.
The production of H2O2 and MDA
Leaf H2O2 concentrations were increased by 1·8-fold for T-9 and 2·5-fold for B2C but remained unchanged in the roots for both accessions under drought stress (Fig. 1). The MDA concentrations were increased by 2·8- and 3·5-fold in the leaves for T-9 and B2C, respectively, compared with their controls; but remained unchanged in the roots for both accessions under drought stress (Fig. 1).
Fig. 1.
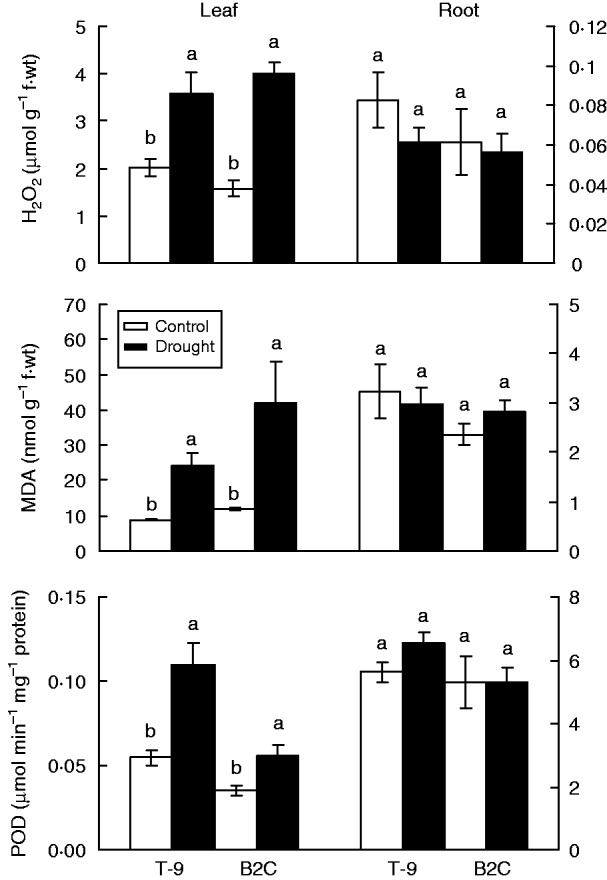
Effects of 7 d drought stress on the concentration of hydrogen peroxide (H2O2) and malondialdehyde (MDA) and activities of peroxidase (POD) in the leaves and roots of Brachypodium distachyon. Means followed by the same letter within the leaves or roots for a given line are not significantly different at P < 0·05. Vertical bars show ± s.d. T-9, Tek-9; B2C, BdTR2C.
Enzyme activity and isoenzyme stain
Compared with the control, drought stress increased leaf POD activities by 2·0-fold for T-9 and 1·6-fold for B2C, but did not affect root POD activities in both accessions (Fig. 1). Based on the non-denaturing PAGE protein gel, drought stress did not induce new anionic POD isoenzymes (pH 8·5) in either the tolerant accession T-9 or the susceptible B2C (Fig. 2). Both T-9 and B2C had their one own unique isoenzyme not shown in the other. Across the other 32 accessions, the drought-tolerant accessions T-2, T-7, T-10, Bd1-1, B8C and B8I had the same POD isoenzyme patterns as T-9, while the drought-susceptible accessions such as BD18-1, B2B, B9B and B7B had similar isoenzyme patterns to B2C (Fig. 3). Two cationic POD isoenzymes (pH 4·5) were also detected, but the patterns were the same among accessions (data not shown).
Fig. 2.
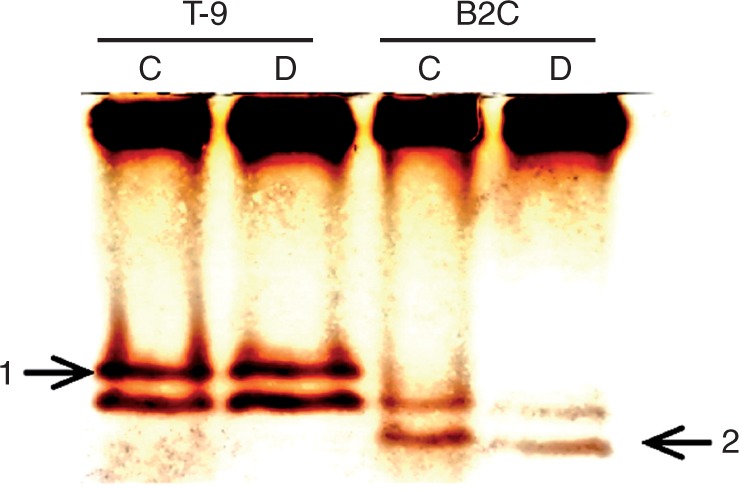
Electrozymogram showing the peroxidase profile of protein extracts from leaves of Brachypodium distachyon under well-watered control (C) and drought stress (D) conditions. Arrows indicate unique bands shown in the drought-tolerant T-9 (isoenzyme 1) and susceptible B2C (isoenzyme 2) accessions. T-9, Tek-9; B2C, BdTR2C.
Fig. 3.
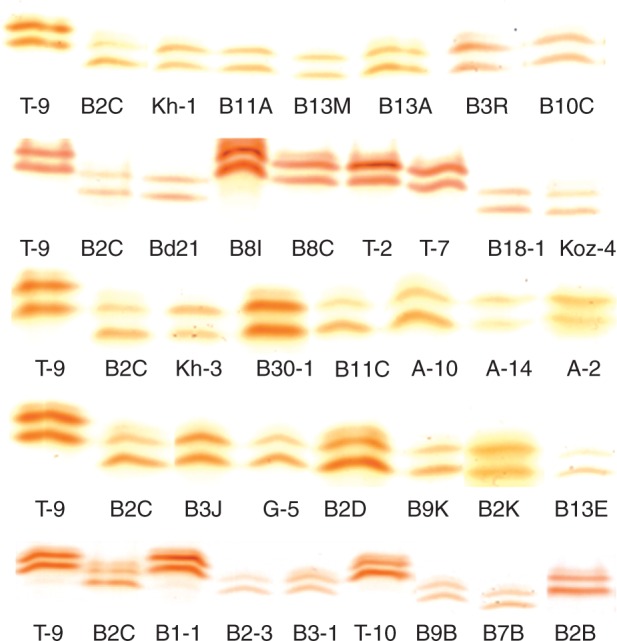
The total activity stain for peroxidase in the leaves of Brachypodium distachyon under well-watered conditions for accessions used in the study.
Protein and SNP identification
Protein sequences revealed that isoenzyme 1 in T-9 contained four different proteins (Bradi1g41900.1, Bradi2g04490.1, Bradi3g41340.1 and Bradi1g63060.1), while isoenzyme 2 in B2C also contained four different proteins (Bradi1g26870.1, Bradi4g32800.1, Bradi5g00690.1 and Bradi5g65820.2) (Supplementary Data Tables S1 and S2). Genes of Bradi1g41900.1, Bradi2g04490.1, Bradi5g41340.1, Bradi1g26870.1, Bradi4g32800.1 and Bradig00690.1 were identified through MALDI-TOF/TOF, while genes of Bradi63060.1 and Bradi65820.2 were identified by LTQ-Orbitrap (Tables S1 and S2). The genes encoding these proteins were identified and partially sequenced in genotypes with contrasting drought tolerance (Table 4). The total length of the sequences ranged from 670 to 1782 bp among eight genes, with a mean of 1147 bp, and covered approx. 41–88 % of the whole length of the genes (Table 4). The sequences of coding regions ranged from 151 to 1032 bp among the eight genes, with a mean of 546 bp. A total of 90 SNPs were detected in the eight POD genes, ranging from three (Bradi3g41340.1) to 18 SNPs (Bradi4g32800.1 and Bradi5g65820.2). The coding regions consisted of 44 SNPs ranging from 0 (Bradi3g41340.1 and Bradi5g65820.2) to 12 (Bradi2g04490.1). Across all the genes, the average SNP frequency was 1/135 bp, ranging from one SNP per 46 bp (Bradi4g32800.1) to one SNP per 395 bp (Bradi3g41340.1). The coding regions had an average SNP frequency of 1/94 bp (Table 4).
π and LD
Across eight genes, the values of π ranged from 0·00 (Bradi3g41340.1 and Bradi5g65820.2) to 0·0077 (Bradi4g32800.1) and Watterson’s θ w ranged from 0·00 (Bradi3g41340.1 and Bradi5g65820.2) to 0·0061 (Bradi4g04490.1), with a mean value of 0·0028 for π and 0·0019 for θ w, respectively (Table 5). The π values spanned from 0·00 (Bradi3g41340.1) to 0·0055 (Bradi5g00690.1) of synonymous areas with an average of 0·0019, and ranged from 0·0011 (Bradi1g26870.1) to 0·0095 (Bradi3g041340.1) of non-synonymous areas with an average of 0·0042 (Table 5). The average π synonymous/non-synonymous ratio was 0·81 (Table 5). The haplotype number varied from four (Bradi3g41340.1) to 16, with an average of 9·1 across genes. Haplotype diversity ranged from 0·51 (Bradi1g41900.1) to 0·91 (Bradi4g32800.1), with a mean value of 0·65. Through the neutrality test, positive Tajima’s D values were shown in Bradi3g41340.1, Bradi4g32800.1, Bradi5g00690.1 and Bradi5g65820.2, while negative Tajima’s D values were found in Bradi1g41900.1, Bradi2g04490.1, Bradi3g63060.1 and Bradi1g26870.1.
Table 5.
Nucleotide diversity, haplotype and neutrality test of peroxidase genes in Brachypodium distachyon
| Gene | π | θ w | π syn | π non-syn | π syn/non syn | H | Hd ± s.d. | Neutral test | Tajima’s D |
|---|---|---|---|---|---|---|---|---|---|
| Bradi1g41900.1 | 0·0003 | 0·0011 | 0·0009 | 0·0025 | 0·366 | 6 | 0·51 ± 0·089 | –0·529 | –0·603 |
| Bradi2g04490.1 | 0·0031 | 0·0061 | 0·0011 | 0·0022 | 0·498 | 15 | 0·82 ± 0·074 | –1·847 | –1·564 |
| Bradi3g41340.1 | 0·0000 | 0·0000 | 0·0000 | 0·0095 | 0·000 | 4 | 0·49 ± 0·091 | 1·060 | 0·856 |
| Bradi1g63060.1 | 0·0026 | NA | 0·0032 | 0·0014 | 2·331 | 9 | 0·61 ± 0·097 | 0·041 | –2·139 |
| Bradi1g26870.1 | 0·0015 | 0·0025 | 0·0012 | 0·0011 | 1·055 | 7 | 0·52 ± 0·093 | –2·197 | –1·057 |
| Bradi4g32800.1 | 0·0077 | NA | 0·0030 | 0·0086 | 0·352 | 16 | 0·91 ± 0·037 | 1·363 | 0·250 |
| Bradi5g00690.1 | 0·0073 | NA | 0·0055 | 0·0029 | 1·884 | 7 | 0·68 ± 0·059 | 0·380 | 1·009 |
| Bradi1g65820.2 | 0·0000 | 0·0000 | 0·0002 | 0·0053 | 0·0398 | 9 | 0·68 ± 0·075 | 1·066 | 1·522 |
| Mean | 0·0028 | 0·0019 | 0·0019 | 0·0042 | 0·812 | 9·1 | 0·65 ± 0·077 | –0·083 | –2·156 |
π and θ w, nucleotide diversity; π syn and π non-syn, synonymous and non-synonymous nucleotide diversity, respectively; H, number of haplotypes; Hd, haplotype diversity; NA, not available.
Population structure and LD
Two genetic population structures (G1 and G2) were found in 33 genotypes assessed by 46 SSR markers (B30-1 was not included due to missing SSR information) (Fig. 4). The sub-groups were identified based on likelihood plots of the models, stability of grouping patterns across different runs, and germplasm information (Vogel et al., 2009; Yu et al., 2013). G1 consisted of T-9, T-10, B1-1, T-2, T-7, B8I, B8C and B7B accessions with better drought tolerance, except for B7B, while G2 contained other accessions varying in drought tolerance but including the most susceptible materials. Based on our previous trait data in these accessions (Luo et al., 2011), G1 had an average value of 0·78, 56·3 and 30·6 % for leaf wilting, percentage reduction of LWC (R-LWC) and F v/F m (R-F v/F m), which was lower than 1·3, 76·7 and 56·7 % for leaf wilting, R-LWC and R-F v/F m observed in G2, respectively.
Fig. 4.

Hierarchical organization of genetic relatedness of 33 Brachypodium genotypes. Numbers on the x-axis represent each individual accession. Numbers on the y-axis indicate the membership coefficient for each individual accession. The colour of the bar indicates the two groups identified through the STRUCTURE program (G1, red; G2, green).
Linkage disequilibrium estimates r 2 plotted against pairwise distances between SNPs. Across genes, slow LD decay was found in Brachypodium (Fig. 5). Overall, LD decay extended to > 1·2 kb with an r 2 higher than 0·6. Similarly, LD decay of combined Bradi1g41900.1, Bradi2g04490.1, Bradi3g41340.1 and Bradi3g63060.1 extended to 1·2 kb with an r 2 of 0·6, while Bradi1g26870.1, Bradi4g32800.1, Bradi5g00690.1 and Bradi5g65820.2 expressed LD decay exceeding the distance of 1·2 kb with an r 2 higher than 0·6 (data not shown).
Fig. 5.
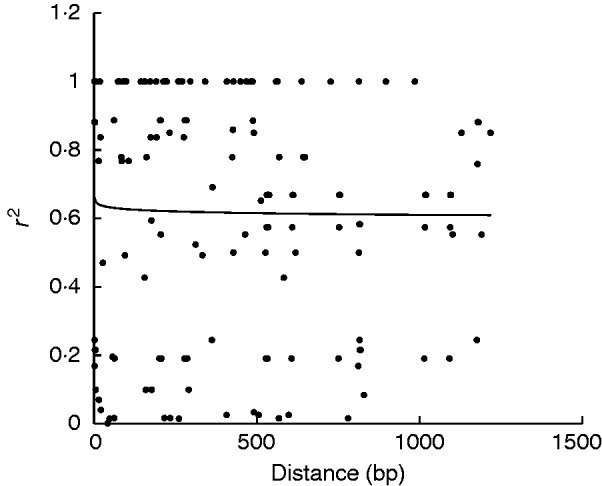
Pattern of linkage disequilibrium (LD) in eight POD genes in Brachypodium distachyon. The r 2 values for pairwise LD are plotted against physical distance.
Association of genes with traits
After controlling population structure, significant associations of Bradi3g41340.1 and Bradi1g26870.1 with traits were identified (Table 6). Specifically, SNPs at loci 1087 and 1584 from Bradi3g41340.1 were associated with R-LWC, with nucleotide changes of A/T and GT. Similarly, SNPs at loci 617, 708, 806, 1164 and 1181 from Bradi1g26870.1 were associated with R-LWC, with nucleotide changes of A/T, C/T, A/G, C/T and G/T. One SNP at locus 1164 from Bradi1g26870.1 was also associated with leaf wilting. Compared with using the simple linear model, this was an elimination of approx. 87 % significant associations by using the population structure implemented model (data not shown).
Table 6.
Association of peroxidase genes with traits and nucleotide changes in Brachypodium distachyon
| Gene | Trait | Locus | Nucleotide change |
|---|---|---|---|
| Bradi3g41340.1 | R-LWC | 1087 | A/G |
| R-LWC | 1574 | G/T | |
| Bradi1g26870.1 | R-LWC | 617 | A/G |
| R-LWC | 708 | C/T | |
| R-LWC | 806 | A/G | |
| R-LWC | 1164 | C/T | |
| R-LWC | 1181 | G/T | |
| Wilting | 1164 | C/T |
Wilting, leaf wilting under drought; R-LWC, percentage reduction of leaf water content under drought compared with the control.
Leaf wilting and LWC data were based on a study by Luo et al. (2011).
Gene expression
The expression of two significant genes of Bradi3g41340.1 and Bradi1g26870.1 was analysed in the leaves of both accessions under the non-stress and drought conditions (Fig. 6). Relative to their unstressed control, drought stress significantly increased expression levels of Bradi3g41340.1 and Bradi1g26870.1 in both accessions. Specifically, expression of Bradi3g41340.1 was significantly increased by 4·8-fold for T-9 and 3·1-fold for B2C. For Bradi1g26870.1, expression was increased by 5·6-fold for T-9 and 4·7-fold for B2C (Fig. 6) However, differences in fold change were not significant between T-9 and B2C. In addition, by using a reference gene as a control, the absolute expression levels of both genes were not significantly different between the two accessions under the unstressed control and drought stress (data not shown).
Fig. 6.
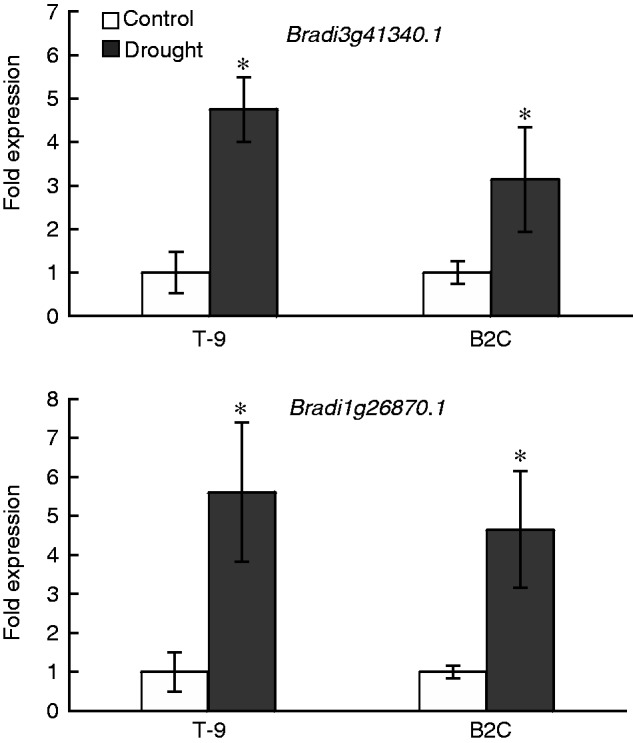
Effects of 7 d of drought stress on gene expression by using real-time quantitative reverse transcription–PCR in the control and drought-stressed leaf samples of T-9 and B2C. T-9, Tek-9; B2C, BdTR2C. Data were normalized in comparison with the control. *, significant at P < 0·05.
Phylogenetic tree
The Neighbor–Joining tree revealed certain relationships among the accessions based on sequences of eight genes. Drought-tolerant accessions such as T-2, T-9, T-7, T-10, B1-1, B8I and B8C were close to each other according to sequences of Bradi3g41340.1. The results were generally consistent with grouping revealed by population structure using SSR markers (Fig. 7). By using sequences of Bradi1g26870.1, grouping was somewhat different from the results from Bradi3g41340.1.
Fig. 7.

Neighbor–Joining trees representing gene haplotype relationships in Brachypodium distachyon.
DISCUSSION
Lesser reductions in LWC and F v/F m found in T-9 compared with B2C exposed to 7 d of drought stress indicated that T-9 was more drought tolerant than B2C. The results were consistent with a study in Brachypodium by Luo et al. (2011) who supported that more reductions in LWC and F v/F m were observed in B2C. Drought treatment was less severe in this experiment compared with that described by Luo et al. (2011). This could be the main reason for the relatively small decreases in LWC, and particularly F v/F m, in the present study when compared with previous results. However, the trends in drought responses of the two accessions were similar between the two studies. A more drought-tolerant perennial ryegrass (Lolium perenne) also showed higher LWC and F v/F m in the field (Yu et al., 2013), suggesting that drought-tolerant grass plants maintain adequate water status and physiological activity.
Moreover, the drought-tolerant T-9 also showed more increased POD activities and lower H2O2 and MDA concentrations, relative to the control. Similar results of increased POD activity were found in the drought-tolerant maize (Moussa and Abdel-Aziz, 2008). However, POD activity also remained unchanged in some grass species under drought stress (Zhang and Kirkham, 1996; Bian and Jiang, 2009; Jiang et al., 2010). Changes in POD activity under drought stress may depend on the species, variety, duration and intensity of the stress. At the transcript level, expression of the two significant genes, Bradi3g41340.1 and Bradi1g26870.1, was increased in T-9 and B2C under drought stress, relative to their control (Fig. 6). The results were consistent with the increased POD activities found in these two accessions under drought stress (Fig. 1). The increases in enzyme activity and gene expression indicated that enhanced POD plays a role in drought tolerance of Brachypodium, which could be associated with reducing oxidative injury. In addition, some POD genes were up-regulated and some were down-regulated in maize due to drought stress (Wang et al., 2015). Higher activities of POD and gene expression were also found in plants exposed to other abiotic stresses such as cold, salt stress, heavy metals and pathogen invasion (Hiraga et al., 2000; Sharma and Dubey, 2004; Azevedo Neto et al., 2006; Xu et al., 2008).
Drought stress could also affect POD isozymes in some plants species. Dehydration and senescence caused disturbance in the redox homeostasis of Ramonda leaves, while inducing different POD anionic and cationic isoenzymes (Veljovic-Jovanovic et al., 2006). In Arabidopsis, the intensity of two POD isoenzymes increased in drought-stressed young and mature leaves, especially a strong induction in one isoenzyme in mature leaves (Jung 2004). Some PODs were stress-responsive isoenzymes in the roots of wheat (Triticum aestivum L.) (Selote and Khanna-Chopra, 2010). In this study, T-9 and B2C showed their own unique isoenzyme of POD under normal conditions. Although drought stress did not induce new bands of POD, these specific POD isoenzymes can generally distinguish the more drought-tolerant accessions from the others (Table 1; Fig. 3). The results indicated that the POD isoenzyme could differentiate Brachypodium accessions with contrasting drought tolerance. Among those POD isoenzymes, two candidate genes of Bradi3g41340.1 and Bradi1g26870.1 encoding specific PODs were significantly associated with drought tolerance traits. Furthermore, the grouping of the drought-tolerant accessions by sequences of Bradi3g41340.1 was generally consistent with grouping revealed by population structure using genome-wide SSR markers. The results illustrated relationships among certain accessions by POD sequences, which could separate the most drought-tolerant accessions from the other accessions.
The average SNP frequency in eight POD genes observed in this study was one SNP every 135 bp in whole sequencing length. It was very similar to that of other antioxidant genes in Brachypodium (Luo et al., 2012). However, the average SNP frequency (1 SNP per 180 bp) in Bradi1g41900.1, Bradi2g04490.1, Bradi3g41340.1 and Bradi3g63060.1 initially found in the tolerant accession was only half compared with Bradi1g26870.1, Bradi4g32800.1, Bradi5g00690.1 and Bradi5g65820.2 shown in the susceptible accession. Moreover, the significantly associated genes of Bradi3g41340.1 and Bradi1g26870.1 had even lower SNP frequency, suggesting that SNP frequency in POD genes varied widely in one species. It indicated that SNP frequency may be influenced by selection, mutation, mating system, effective population size and demography (Nei, 1987). Mean nucleotide diversity (π = 0·0028, θ w = 0·0019) of POD genes was also similar to the values found in other antioxidant genes in Brachypodium (Luo et al., 2012) and in balsam poplar (Populus balsamifera) (Olson et al., 2010). The range of π values in Brachypodium was similar to the range of those of other genes tested in 34 ecotypes of arabidopsis (Lin et al., 2008). The value of θ w denotes the number of polymorphic segregating sites (Watterson, 1975). The difference between π and θ w found in Bradi1g41900.1, Bradi2g04490.1 and Bradi1g26870.1 could reflect the degree of non-equilibrium conditions in the genetic history of the population. Tajima’s D measures the standardized differences between π and θ w; negative D values might indicate an excess of low-frequency polymorphisms in Bradi1g41900.1, Bradi2g04490.1, Bradi3g63060.1 and Bradi1g26870.1, whereas positive values indicated an excess of intermediate polymorphisms in Bradi3g41340.1, Bradi4g32800.1, Bradi5g00690.1 and Bradi5g65820.2. The ratio between π non-syn and π syn is a strong indicator of selection (Li, 1997), varying greatly in these POD genes in Brachypodoum. A higher π non-syn value in Bradi3g41340.1 suggested a lack of selection of pressure during evolution in maintaining a high level of polymorphisms.
In summary, POD activity increased in the leaf of Brachypodium under drought stress, to a greater extent in the tolerant accession T-9, along with lesser accumulation of MDA and H2O2. Variations of POD isoenzymes were found among accessions with contrasting drought tolerance, while the most tolerant and susceptible accessions had their unique POD isoenzyme band. Eight POD genes were identified and a total of 90 SNPs were found across 34 accessions. Nucleotide diversity of POD genes ranged from 0·00 to 0·0077 with a mean of 0·0028, and the average synonymous/non-synonymous π ratio was 0·81. After controlling population structure, significant associations of Bradi3g41340.1 and Bradi1g26870.1 with R-LWC or leaf wilting were identified. The results suggested a role for specific POD genes in differentiating Brachypodium accessions with contrasting drought tolerance, which could be associated with general fitness of Brachypodium during evolution.
SUPPLEMENTARY DATA
Supplementary data are available online at www.aob.oxfordjournals.org and consist of the following. Table S1: the proteins identified by using MALDI-TOF/TOF MS in Tek-9 and BdTR2C Brachypodium distachyon accessions. Table S2: the proteins identified by LC-ESI-LTQ-Orbitrap XL in Tek-9 and BdTR2C Brachypodium distachyon accessions
ACKNOWLEDGEMENTS
The authors would like to thank Dr Kehua Wang for assisting in isoenzyme detection, Dr Halina Dorota Inerowicz for LC-MS analysis, and Dr Zhixi Tian for bioinformatics analysis. The authors would also like to thank Dr John Vogel and Dr David Garvin for providing the seeds. This research was supported by the Guangdong Provincial Natural Science Foundation of China (Grant # S2013040014817).
LITERATURE CITED
- Apel K, Hirt H. 2004. Reactive oxygen species: metabolism, oxidative stress, and signal transduction. Annual Review of Plant Biology 55: 373–399. [DOI] [PubMed] [Google Scholar]
- Ayala A, Muñoz MF, Argüelles S. 2014. Lipid peroxidation: production, metabolism, and signaling mechanisms of malondialdehyde and 4-hydroxy-2-nonenal. Oxidative Medicine and Cellular Longevity 2014: 360438. [DOI] [PMC free article] [PubMed] [Google Scholar]
- Azevedo Neto AD, Prisco JT, Eneas-Filho J, de Abreu CEB, Gomes-Filho E. 2006. Effect of salt stress on antioxidative enzymes and lipid peroxidation in leaves and roots of salt-tolerant and salt-sensitive maize genotypes. Environmental and Experimental Botany 56: 87–94. [Google Scholar]
- Bakalovic N, Passardi F, Ioannidis V, et al. 2006. PeroxiBase: a class III plant peroxidase database. Phytochemistry 67: 534–539. [DOI] [PubMed] [Google Scholar]
- Baumgarner BL, Bharadwaj AS, Inerowicz DH, Goodman AS, Brown PB. 2013. Proteomic analysis of rainbow trout (Oncorhynchus mykiss) intestinal epithelia: physiological acclimation to short-term starvation. Comparative Biochemistry and Physiology. Part D, Genomiccs and Proteomics 8: 58–64. [DOI] [PubMed] [Google Scholar]
- Bernt E, Bergmeyer HU. 1974. Inorganic peroxides In: Bergmeyer HU, ed. Methods of enzymatic analysis. New York: Academic Press, 2246–2248. [Google Scholar]
- Bevan MW, Garvin DF, Vogel JP. 2010. Brachypodium distachyon genomics for sustainable food and fuel production. Current Opinion in Biotechnology 21: 211–217. [DOI] [PubMed] [Google Scholar]
- Bian S, Jiang Y. 2009. Reactive oxygen species, antioxidant enzyme activities and gene expression patterns in leaves and roots of Kentucky bluegrass in response to drought stress and recovery. Scientia Horticulturae 120: 264–270. [Google Scholar]
- Bradbury PJ, Zhang Z, Kroon DE, Casstevens TM, Ramdoss Y, Buckler ES. 2007. TASSEL: software for association mapping of complex traits in diverse samples. Bioinformatics 23: 2633–2635. [DOI] [PubMed] [Google Scholar]
- Bradford MM. 1976. A rapid and sensitive method for the quantitation of microgram quantities of protein utilizing the principle of protein–dye binding. Analytical Biochemistry 72: 248–254. [DOI] [PubMed] [Google Scholar]
- Bragg JN, Wu JJ, Gordon SP, et al. 2012. Generation and characterization of the western regional research center Brachypodium T-DNA insertional mutant collection. PLoS One 7: e41916. doi:10.1371/journal.pone.0041916. [DOI] [PMC free article] [PubMed] [Google Scholar]
- Colton-Gagnon K, Ali-Benali MA, Mayer BF, et al. 2014. Comparative analysis of the cold acclimation and freezing tolerance capacities of seven diploid Brachypodium distachyon accessions. Annals of Botany 113: 681–693. [DOI] [PMC free article] [PubMed] [Google Scholar]
- Cosgrove DJ. 2001. Wall structure and wall loosening. A look backwards and forwards. Plant Physiology 125: 131–134. [DOI] [PMC free article] [PubMed] [Google Scholar]
- Delannoy E, Jallou IA, Assigbetse K, et al. 2003. Activity of class III peroxidases in the defense of cotton to bacterial blight. Molecular Plant-Microbe Interactions 16: 1030–1038. [DOI] [PubMed] [Google Scholar]
- Dhindsa RS, Plumb-Dhindsa P, Thorpe TA. 1981. Leaf senescence: correlated with increased leaves of membrane permeability and lipid peroxidation and decreased levels of superoxide dismutase and catalase. Journal of Experimental Botany 32: 93–101. [Google Scholar]
- Doyle JJ, Doyle JL. 1990. Isolation of plant DNA from fresh tissue. Focus 12: 13–15. [Google Scholar]
- Draper J, Mur LAJ, Jenkins G, et al. 2001. Brachypodium distachyon: a new model system for functional genomics in grasses. Plant Physiology 127: 1539–1555. [PMC free article] [PubMed] [Google Scholar]
- Duroux L, Welinder KG. 2003. The peroxidase gene family in plants: a phylogenetic overview. Journal of Molecular Evolution 57: 397–407. [DOI] [PubMed] [Google Scholar]
- Esterbauer H, Cheeseman KH. 1990. Determination of aldehydic lipid peroxidation products: malonaldehyde and 4-hydroxynonenal. Methods in Enzymology 186: 407–421. [DOI] [PubMed] [Google Scholar]
- Fu J, Huang B. 2001. Involvement of antioxidants and lipid peroxidation in the adaptation of two cool-season grasses to localized drought stress. Environmental and Experimental Botany 45: 105–114. [DOI] [PubMed] [Google Scholar]
- Garvin DF, Gu Y, Hasterok SP, et al. 2008. Development of genetic and genomic research resources for Brachypodium distachyon, a new model system for grass crop research. Plant Genome 48: 69–84. [Google Scholar]
- Garvin DF, McKenzie N, Vogel JP, et al. 2010. An SSR-based genetic linkage map of the model grass Brachypodium distachyon . Genome 53: 1–13. [DOI] [PubMed] [Google Scholar]
- González AM, Marcel TC, Kohutova Z, Stam P, Van der Linden CG, Niks RE. 2010. Peroxidase profiling reveals genetic linkage between peroxidase gene clusters and basal host and non-host resistance to rusts and mildew in barley. PLoS One 5: e10495. doi:10.1371/journal.pone.0010495. [DOI] [PMC free article] [PubMed] [Google Scholar]
- Gordon SP, Priest H, Des Marais DL, et al. 2014. Genome diversity in Brachypodium distachyon: deep sequencing of highly diverse inbred lines. The Plant Journal 79: 361–374. [DOI] [PubMed] [Google Scholar]
- Gulsen O, Shearman RC, Heng-Moss TM, Mutlu N, Lee DJ, Sarath G. 2007. Peroxidase gene polymorphism in Buffalograss and other grasses. Crop Science 47: 767–774. [Google Scholar]
- Gulsen O, Sever-Mutlu S, Mutlu N, et al. 2009. Polyploidy creates higher diversity among Cynodon accessions as assessed by molecular markers. Theoretical and Applied Genetics 118: 1309–1319. [DOI] [PubMed] [Google Scholar]
- Gulsen O, Eickhoff T, Heng-Moss T, et al. 2010a. Characterization of peroxidase changes in resistant and susceptible warm-season turfgrasses challenged by Blissus occiduus . Arthropod-Plant Interactions 4: 45–55. [Google Scholar]
- Gulsen O, Kaymak S, Ozongun S, Uzun A. 2010b. Genetic analysis of Turkish apple germplasm using peroxidase gene-based markers. Scientia Horticulturae 125: 368–373. [Google Scholar]
- Hill WG, Robertson A. 1968. Linkage disequilibrium in finite populations. Theoretical and Applied Genetics 38: 226–231. [DOI] [PubMed] [Google Scholar]
- Hiraga S, Ito H, Yamakawa H, et al. 2000. An HR-induced tobacco peroxidease gene is responsive to spermine, but not to salicylate, methyl jasmonate and ethaphon. Molecular Plant-Microbe Interactions 13: 210–216. [DOI] [PubMed] [Google Scholar]
- Hiraga S, Sasaki K, Ito H, Ohashi Y, Matsui H. 2001. A large family of class III plant peroxidases. Plant and Cell Physiology 42: 462–468. [DOI] [PubMed] [Google Scholar]
- Hong S-Y, Seo PJ, Yang MS, Xiang FN, Park CM. 2008. Exploring valid reference genes for gene expression studies in Brachypodium distachyon by real-time PCR. BMC Plant Biology 8: 112. doi:10.1186/1471-2229-8-112. [DOI] [PMC free article] [PubMed] [Google Scholar]
- Jiang Y, Watkins E, Liu S, Yu X, Luo N. 2010. Antioxidative responses and candidate gene expression in prairie junegrass under drought. Journal of the American Society for Horticultural Science 135: 303–309. [Google Scholar]
- Jiménez CR, Huang L, Qiu Y, Burlingame AL. 1998. Current protocols in protein science In: Coligan JE, ed. In-gel digestion of proteins for MALDI-MS fingerprint mapping. New York: John Wiley & Sons Inc, 16.4.1–16.4.5. [DOI] [PubMed] [Google Scholar]
- Jump AS, Marchant R, Peñuelas J. 2009. Environmental change and the option value of genetic diversity. Trends in Plant Science 14: 51–58. [DOI] [PubMed] [Google Scholar]
- Jung S. 2004. Variation in antioxidant metabolism of young and mature leaves of Arabidopsis thaliana subjected to drought. Plant Science 166: 459–466. [Google Scholar]
- Kim SS, Choi SY, Park JH, Lee DJ. 2004. Regulation of the activity of Korean radish cationic peroxidase promoter during dedifferentiation and differentiation. Plant Physiology and Biochemistry 42: 763–772. [DOI] [PubMed] [Google Scholar]
- Laemmli UK. 1970. Cleavage of structural proteins during the assembly of the head of bacteriophage T4. Nature 227: 680–685. [DOI] [PubMed] [Google Scholar]
- Li WH. 1997. Rates and patterns of nucleotide substitutions In: Molecular evolution. Sunderland, MA: Sinauer Associates, 177–213. [Google Scholar]
- Lin Y, Hwang SY, Hsu PY, et al. 2008. Molecular population genetics and gene expression analysis of duplicated CBF genes of Arabidopsis thaliana . BMC Plant Biology 8: 16. doi:10.1186/1471-2229-8-111. [DOI] [PMC free article] [PubMed] [Google Scholar]
- Liu M, Jiang J. 2015. Genotypic variation in growth and metabolic responses of perennial ryegrass exposed to short-term waterlogging and submergence stress. Plant Physiology and Biochemistry 95: 57–64. [DOI] [PubMed] [Google Scholar]
- Livak KJ, Schmittgen TD. 2001. Analysis of relative gene expression data using real-time quantitative PCR and the 2−ΔΔ C T method. Methods 25: 402–408. [DOI] [PubMed] [Google Scholar]
- Lopez-Serrano M, Fernandez MD, Pomar F, Pedreno MA, Ros Barcelo A. 2004. Zinnia elegans uses the same peroxidase isoenzyme complement for cell wall lignification in both single-cell tracheary elements and xylem vessels. Journal of Experimental Botany 55: 423–431. [DOI] [PubMed] [Google Scholar]
- Luo N, Liu J, Yu X, Jiang Y. 2011. Natural variation of drought response in Brachypodium distachyon . Physiologia Plantarum 141: 19–29. [DOI] [PubMed] [Google Scholar]
- Luo N, Yu X, Liu J, Jiang Y. 2012. Nucleotide diversity and linkage disequilibrium in antioxidant genes of Brachypodium distachyon . Plant Science 197: 122–129. [DOI] [PubMed] [Google Scholar]
- Morohashi Y. 2002. Peroxidase activity develops in the micropylar endosperm of tomato seeds prior to radicle protrusion. Journal of Experimental Botany 53: 1643–1650 [DOI] [PubMed] [Google Scholar]
- Moussa HR, Abdel-Aziz SM. 2008. Comparative response of drought tolerant and drought sensitive maize genotypes to water stress. Australian Journal of Crop Science 1: 31–36. [Google Scholar]
- Nei M. 1987. Molecular evolutionary genetics. New York: Columbia University Press. [Google Scholar]
- Olson MS, Robertson AL, Takebayashi N, Silim S, Schroeder WR, Tiffin P. 2010. Nucleotide diversity and linkage disequilibrium in Balsam Poplar (Populus balsamifera). New Phytologist 186: 526–536. [DOI] [PubMed] [Google Scholar]
- Păcurar DI, Thordal-Christensen H, Nielsen KK, Lenk I. 2008. A high-throughput Agrobacterium-mediated transformation system for the grass model species Brachypodium distachyon . Transgenic Research 17: 965–975. [DOI] [PubMed] [Google Scholar]
- Pandey HC, Baig MJ, Chandra A, Bhatt RK. 2010. Drought stress induced changes in lipid peroxidation and antioxidant system in genus Avena . Journal of Environmental Biology 31: 435–440. [PubMed] [Google Scholar]
- Park K-E, Inerowicz HD, Wang X, Li Y, Koser S, Cabot RA. 2012. Identification of karyopherin α1 and α7 interacting proteins in porcine tissue. PLoS One 7: e38990. doi:10.1371/journal.pone.0038990. [DOI] [PMC free article] [PubMed] [Google Scholar]
- Passardi F, Longet D, Penel C, Dunand C. 2004a. The class III peroxidase multigenic family in rice and its evolution in land plants. Phytochemistry 65: 1879–1893. [DOI] [PubMed] [Google Scholar]
- Passardi F, Penel C, Dunand C. 2004b. Performing the paradoxical: how plant peroxidases modify the cell wall. Trends in Plant Science 9: 534–540. [DOI] [PubMed] [Google Scholar]
- Pritchard JK, Stephens M, Donnelly P. 2000. Inference of population structure using multilocus genotype data. Genetics 155: 945–959. [DOI] [PMC free article] [PubMed] [Google Scholar]
- Ranieri A, Petacco F, Castagna A, Soldatini GF. 2000. Redox state and peroxidase system in sunflower plants exposed to ozone. Plant Science 159: 159–167. [DOI] [PubMed] [Google Scholar]
- Rozas J, Rozas R. 1999. DnaSP version 3: an integrated program for molecular population genetics and molecular evolution analysis. Bioinformatics 15: 174–175. [DOI] [PubMed] [Google Scholar]
- Schwartz CJ, Doyle MR, Manzaneda AJ, Rey PJ, Mitchell-Olds T, Amasino RM. 2010. Natural variation of flowering time and vernalization responsiveness in Brachypodium distachyon . Bioenergy Research 3: 38–46. [Google Scholar]
- Selote DS, Khanna-Chopra R. 2010. Antioxidant response of wheat roots to drought acclimation. Protoplasma 245: 153–163. [DOI] [PubMed] [Google Scholar]
- Sharma P, Dubey RS. 2004. Ascorbate peroxidase from rice seedlings: properties of enzyme isoforms, effects of stresses and protective roles of osmolytes. Plant Science 167: 541–550. [Google Scholar]
- Smith AT, Veitch NC. 1998. Substrate binding and catalysis in heme peroxidases. Current Opinion in Chemical Biology 2: 269–278. [DOI] [PubMed] [Google Scholar]
- Sofo A, Tuzio AC, Dichio B, Xiloyannis C. 2005. Influence of water deficit and rewatering on the components of the ascorbate–glutathione cycle in four interspecific Prunus hybrids. Plant Science 169: 403–412. [Google Scholar]
- Srivastava OP, Van Huystee RB. 1977. An inter-relationship among peroxidases, IAA oxidase, and polyphenol oxidase from peanut cells. Canadian Journal of Botany 55: 2630–2635. [Google Scholar]
- Tajima F. 1989. Statistical method for testing the neutral mutation hypothesis by DNA polymorphism. Genetics 123: 585–595. [DOI] [PMC free article] [PubMed] [Google Scholar]
- Thole V, Peraldi A, Worland B, Nicholson P, Doonan JH, Vain P. 2012. T-DNA mutagenesis in Brachypodium distachyon . Journal of Experimental Botany 63: 567–576. [DOI] [PubMed] [Google Scholar]
- Tognolli M, Penel C, Greppin H, Simon P. 2002. Analysis and expression of the class III peroxidase large gene family in Arabidopsis thaliana . Gene 288: 129–138. [DOI] [PubMed] [Google Scholar]
- Tyler L, Fangel JU, Fagerstrom AD, et al. 2014. Selection and phenotypic characterization of a core collection of Brachypodium distachyon inbred lines. BMC Plant Biology 14: 25. doi:10.1186/1471-2229-14-25. [DOI] [PMC free article] [PubMed] [Google Scholar]
- Upadhyaya H, Panda SK, Dutta BK. 2008. Variation of physiological and antioxidative responses in tea cultivars subjected to elevated water stress followed by rehydration recovery. Acta Physiologiae Plantarum 30: 457–468. [Google Scholar]
- Veljovic-Jovanovic S, Kukavica B, Stevanovic B, Navari-Izzo F. 2006. Senescence- and drought-related changes in peroxidase and superoxide dismutase isoforms in leaves of Ramonda serbica . Journal of Experimental Botany 57: 1759–1768. [DOI] [PubMed] [Google Scholar]
- Vogel JP, Hill T. 2008. High-efficiency Agrobacterium-mediated transformation of Brachypodium distachyon inbred line Bd21-3. Plant Cell Reports 27: 471–478. [DOI] [PubMed] [Google Scholar]
- Vogel JP, Garvin DF, Leong O, Hayden D. 2006. Agrobacterium-mediated transformation and inbred line development in the model grass Brachypodium distachyon . Plant Cell, Tissue and Organ Culture 85: 199–211. [Google Scholar]
- Vogel JP, Tuna M, Budak H, Huo NX, Gu YQ, Steinwand MA. 2009. Development of SRR markers and analysis of diversity in Turkish populations of Brachypodium distachyon . BMC Plant Biology 9: 88. doi:10.1186/1471-2229-9-88. [DOI] [PMC free article] [PubMed] [Google Scholar]
- Vogel JP, Garvin DF, Mockler TC, et al. 2010. Genome sequencing and analysis of the model grass Brachypodium distachyon . Nature 463: 763–768. [DOI] [PubMed] [Google Scholar]
- Wang Y, Wang Q, Zhao Y, Han G, Zhu S. 2015. Systematic analysis of maize class III peroxidase gene family reveals a conserved subfamily involved in abiotic stress response. Gene 566: 95–108. [DOI] [PubMed] [Google Scholar]
- Watterson GA. 1975. On the number of segregating sites on genetical models without recombination. Theoretical Population Biology 7: 256–276. [DOI] [PubMed] [Google Scholar]
- Welinder KG. 1992a. Plant peroxidases: structure–function relationships In: Penel C, Gaspar T, Greppin H, eds. Plant peroxidases. Switzerland: University of Geneva, 2–24. [Google Scholar]
- Welinder KG. 1992b. Superfamily of plant, fungal and bacterial peroxidases. Current Opinion in Structural Biology 2: 388–393. [Google Scholar]
- Xu L, Han L, Huang B. 2011. Antioxidant enzyme activities and gene expression patterns in leaves of Kentucky bluegrass in response to drought and post-drought recovery. Journal of the American Society for Horticultural Sciences 136: 247–255. [Google Scholar]
- Xu W, Shi W, Ueda A, Takabe T. 2008. Mechanisms of salt tolerance in transgenic Arabidopsis thaliana carrying a peroxisomal ascorbate peroxidase gene from barley. Pedosphere 18: 480–495. [Google Scholar]
- Ying Y, Song L, Jacobs DF, et al. 2015. Physiological response to drought stress in Camptotheca acuminata seedlings from two provenances. Frontiers in Plant Science 6: 3611. doi:10.3389/fpls.2015.00361. [DOI] [PMC free article] [PubMed] [Google Scholar]
- Yu X, Bai B, Liu S, et al. 2013. Association of candidate genes with drought tolerance traits in diverse perennial ryegrass accessions. Journal of Experimental Botany 64: 1537–1551. [DOI] [PMC free article] [PubMed] [Google Scholar]
- Zhang J, Kirkham MB. 1996. Antioxidant responses to drought in sunflower and sorghum seedlings. New Phytologist 132: 361–373. [DOI] [PubMed] [Google Scholar]
- Zhang X, Schmidt RE. 1999. Antioxidant response to hormone-containing product in Kentucky bluegrass subjected to drought. Crop Science 39: 545–551. [Google Scholar]
Associated Data
This section collects any data citations, data availability statements, or supplementary materials included in this article.