Abstract
An increasingly accepted concept is that the progression of colorectal cancer is accompanied by epithelial–mesenchymal transition (EMT). In our study, in order to characterize the properties of EMT in 16 colorectal cancer cell lines, the cells were first orthotopically implanted into nude mice, and the tumors in vivo, as well as cells cultured in vitro, were immunostained for EMT markers. The immunostaining revealed that seven of the cells had an epithelial phenotype with a high expression of E‐cadherin, whereas other cells showed opposite patterns, such as a high expression of vimentin (CX‐1, COLO205, CloneA, HCT116, and SW48). Among the cells expressing vimentin, some expressed vimentin in the orthotopic tumors but not in the cultured cells (SW480, SW620, and COLO320). We evaluated these findings in combination with microarray analyses, and selected five genes: CHST11, SERPINI1,AGR2, FBP1, and FOXA1. Next, we downregulated the expression of SERPINI1 with siRNA in the cells, the results of which showed reverse‐EMT changes at the protein level and in the cellular morphology. Along with immunohistochemical analyses, we confirmed the effect of the intracellular and secreted SERPINI1 protein of SW620 cells, which supported the importance of SERPINI1 in EMT. The development of therapeutic strategies targeting EMT is ongoing, including methods targeting the transforming growth factor‐β signaling pathway as well as the Wnt pathway. SERPINI1 is an important regulator of EMT. Our findings help to elucidate the signaling pathways of EMT, hopefully clarifying therapeutic pathways as well.
Keywords: Colorectal cancer, epithelial–mesenchymal transition, microarray analysis, orthotopic implantation mouse model, SERPINI1
Colorectal cancer is the third most commonly diagnosed malignant disease worldwide and the second most common cause of cancer mortality; approximately 694 000 deaths are attributed to this disease worldwide annually.1, 2 Distant metastases are responsible for the majority of cancer‐related deaths in CRC patients, and the presence of stage IV carcinoma with distant metastasis is correlated with a dramatic drop in the 5‐year survival rate to 10%.3, 4
An increasingly accepted concept is that CRC progression is accompanied by a cellular pathway often referred to as EMT, in which epithelial cells lose many of their epithelial characteristics and acquire properties typical of mesenchymal cells. In the 1980s, Greenburg and Hay reported EMT‐associated changes in cell phenotypes and mesenchymal states in adult and embryonic epithelia.5 Three types of EMT were categorized at the Cold Spring Harbor EMT Meeting in 2008, among which type 3 EMT was defined as the formation of migratory metastatic tumor cells by epithelial carcinoma cells.6, 7 Epithelial–mesenchymal transition is characterized by the loss of E‐cadherin expression and the gain of expression of mesenchymal markers, such as vimentin, β‐catenin, and N‐cadherin. Epithelial–mesenchymal transition also results in the acquisition of other properties involved in the progression of carcinoma, such as an increased capability to migrate, a higher resistance to apoptosis, and acquiring the properties of stemness.8, 9 E‐cadherin is regulated by various signal networks, such as the transcription factors Snail, Slug, TWIST, SIP1/ZEB2, and deltaEF1/ZEB1, which can directly bind the E‐cadherin promoter and repress E‐cadherin transcription.10 In the tumor microenvironment, EMT is triggered by a diverse set of stimuli, including growth factor signaling and tumor–stromal cell interactions.11 The hypoxic microenvironment common to cancer cells is also an important factor in the induction of the EMT, a key link in cancer progression.12
Ectopic s.c. tumor models have been used extensively in the past; however, these models are limited by the paucity of primary relevant CRC models. However, orthotopic models offer the advantage of allowing for the evaluation of tumor growth in the tissue of origin and metastatic site formation.13 In our previous study, we confirmed that the orthotopic implantation of human CRC cell lines is a useful model for mimicking the behavior of human CRC.14 This study aims to identify novel EMT‐associated genes as therapeutic targets of invasive tumor cells and metastasis. To identify genes possibly involved in the EMT of CRC, we analyzed EMT‐associated changes using an orthotopic implantation method in vivo and immunostaining of the orthotopic tumors and surgically resected colon cancer tissues in combination with cDNA microarray analyses of gene expression profiles.
Materials and Methods
Cell lines and culture conditions
Human CRC cancer cell lines were provided by ATCC (Manassas, VA, USA), Riken BioResource Center (Tsukuba, Japan), and Cell Resource Center for Biomedical Research, Institute of Development, Aging and Cancer, Tohoku University (Sendai, Japan). Sixteen CRC cell lines successfully authenticated for origin and purity were selected for this study.
In vivo orthotopic implantation mouse model
All of the procedures for the orthotopic implantation mouse model were described in our previous report.14 At 8 weeks after inoculation, the mice were killed and postmortem examinations were carried out.
Immunocytochemistry
The cell pellets were resuspended in fibrinogen (Mitsubishi Tanabe Pharma Corp., Osaka, Japan) PBS solution, and clotting was induced by adding thrombin (Mochida Pharmaceutical Corp., Osaka, Japan). Each of the cell clots was placed in a tissue cassette and fixed in 10% formalin for 24 h. Immunostaining was carried out using the same technique as that used for immunohistochemistry.
Immunohistochemistry
Tissue samples obtained from the orthotopically implanted tumors were fixed in IHC Zinc Fixative (Becton Dickinson Biosciences, San Jose, CA, USA) and embedded in paraffin blocks. Then the blocks were cut serially at 4‐μm thickness and H&E staining was used to assess tumor morphology. The Histofine Mousestain Kit (Nichirei Biosciences Inc., Tokyo, Japan) was used according to the universal immunoenzyme polymer method. The antigen–antibody complex was visualized with 3,3′‐diaminobenzidine solution (1 mM 3,3′‐diaminobenzidine, 50 mM Tris–HCl buffer [pH 7.6], and 0.006% H2O2) and counterstained with hematoxylin. The primary antibodies were as follows: mAbs for E‐cadherin (clone 4A2C7; Life Technologies, Carlsbad, CA, USA), vimentin (clone V9; Dako, Carpinteria, CA, USA), SERPINI1 (polyclonal HPA001565; Sigma‐Aldrich, St. Louis, MO, USA), and CHST11 (polyclonal HPA052828; Sigma‐Aldrich). As a negative control, normal mouse IgG was used instead of the primary antibodies. To determine conditions of immunostaining for E‐cadherin, CK20, and β‐catenin, normal colonic tissues with epithelial cells were used as a positive control. In regards to vimentin, gastrointestinal stromal tumors were used as a positive control. In immunostaining of the SERPINI1 and CHST11, normal duodenal tissues with epithelia and cerebrum were used as a positive control, respectively. In immunostaining of orthotopic tumors in mice, the immunostaining of normal epithelial cells in corresponding specimens was assessed as an internal control.
Immunostaining scoring
To semiquantify the E‐cadherin and vimentin expressions, the immunostained slides were scored according to the criteria proposed by Masunaga et al.15 Briefly, the staining intensity was scored as 0 (negative), 1 (weak), 2 (medium), or 3 (strong). The extent of staining was scored as 0 (0%), 1 (1–25%), 2 (26–50%), 3 (51–75%), or 4 (76–100%) according to the proportion of positively stained areas in relation to the area of the whole tumor. The sum of the intensity and extent scores was used as the final staining score (0–7).
cDNA microarray
Gene expression profiles were obtained for 16 CRC cell lines. The CodeLink Uniset Human 20KI Expression Bioarray (from GE Healthcare Life Sciences, now Applied Microarrays, Tempe, AZ, USA) was used to carry out the cDNA microarray analysis. The procedures have been previously described.14 All of the microarray raw data were deposited in the Gene Expression Omnibus at the NCBI under accession number GSE49811.
Data analysis and selection of differentially expressed genes
Analysis of raw microarray data was carried out with R statistical package version 2.15.1 (The R Foundation for Statistical Computing, Vienna, Austria). For comparisons among multiple arrays, probes were quantile‐normalized across arrays. We searched for genes differentially expressed among epithelial, EMT, and mesenchymal phenotypes using moderated t‐statistics in Bioconductor software, controlled by false discovery rate16 < 10−6 and log2[fold change] > 1.0. Information was obtained from the NCBI site and HPA site by the Royal Institute of Technology (Stockholm, Sweden) for the differentially expressed genes is summarized in Table 1.
Table 1.
Epithelial–mesenchymal transition candidate genes
| Official symbol | Gene name | Tissue specificity from HPA database | Gene ontology from NCBI Gene database | |
|---|---|---|---|---|
| Normal tissues | Tumor tissues | |||
| SERPINI1 | Serpin peptidase inhibitor, clade I, member 1 | Central nervous system | Carcinoid |
Central nervous system development Regulation of proteolysis |
| CHST11 | Carbohydrate sulfotransferase 11 | Male reproductive system | Liver cancer | Chondroitin sulfate biosynthetic process |
| AGR2 | Anterior gradient 2 homolog | Lung | Stomach cancer | – |
| FBP1 | Fructose‐1,6‐bisphosphatase 1 | Endocrine tissues | Urothelial cancer |
Cellular response to drug and Mg ion Negative regulation of Ras protein signal transduction, cell growth and glycolysis |
| FOXA1 | Forkhead box A1 | Kidney, endocrine tissues | Thyroid cancer |
Positive regulation of transcription from RNA polymerase II promoter Response to estradiol stimulus |
–, no data; HPA, Human Protein Atlas.
Small interfering RNA transfection
The siRNA oligonucleotide for SERPINI1 and CHST11 used in this study was the Stealth RNAi siRNA Duplex Oligoribonucleotide (Life Technologies). The sequences of siRNA against SERPINI1 (SERPINI1–HSS107974) were as follows: sense 5′‐GGCUGUGCUGUAUCCUCAAGUUAUU‐3′ and antisense 5′‐AAUAACUUGAGGAUACAGCACAGCC‐3′. The siRNA sequences against CHST11 (CHST11–HSS121327) were as follows: sense 5′‐CCCACCUAUGCAAAGUCUACGAGAA‐3′ and antisense 5′‐UUCUCGUAGACUUUGCAUAGGUGGG‐3′. The cells were plated in 6‐well plates, and the siRNAs were transfected into cultured cells with Lipofectamine RNAiMAX (Life Technologies) according to the manufacturer's instructions.
Real‐time RT‐PCR
The experiments were carried out using the RNeasy Mini Kit (Qiagen, Valencia, CA, USA), PrimeScript RT‐PCR Kit (Takara Bio, Kyoto, Japan), and SYBR Premix Ex Taq II, ROX plus (Takara Bio) on an ABI StepOne Plus (Life Technologies) according to the manufacturer's protocols. GAPDH was applied as the internal control. The primers used for PCR are listed in Table S1. The results were calculated using the 2−∆∆Ct method.
Western blot analysis
Protein was extracted from the cells using Pierce RIPA Buffer (Thermo Fisher Scientific, Rockford, IL, USA) with the cOmplete, EDTA‐free Protease Inhibitor Cocktail (Roche Diagnostics, Mannheim, Germany). A total of 20 μg whole cell extracts was loaded on mini protean TGX 4–15% gels (Bio‐Rad, Hercules, CA, USA) and transferred using the Trans‐Blot Turbo Blotting System (Bio‐Rad). The membranes were probed with the following primary antibodies: mAbs for E‐cadherin (clone 24E10; Cell Signaling Technology, Beverly, MA, USA), vimentin (clone D21H3; Cell Signaling Technology), Snail (clone C15D3; Cell Signaling Technology), SERPINI1 (clone 1D10; Sigma‐Aldrich), CHST11 (clone 1H3; Sigma‐Aldrich), or GAPDH (clone D16H11; Cell Signaling Technology) as a control at 4°C overnight. The secondary antibodies were peroxidase‐coupled goat anti‐rabbit or anti‐mouse antibodies and detected with Clarity Western ECL Substrate (Bio‐Rad), and the protein bands were visualized using the ImageQuant LAS 4000 mini system (GE Healthcare Life Sciences).
Immunofluorescence staining and confocal laser microscopy
Cells were seeded in 2‐well plates with glass coverslips (Asahi Techno Glass Corp., Tokyo, Japan). The cells were fixed in 4% paraformaldehyde before blocking in 5% normal goat serum and 0.3% Triton X‐100 in PBS. The cells were incubated with anti‐E‐cadherin antibodies (clone 24E10) at 4°C overnight, washed, then incubated with Alexa Fluor 488 secondary antibodies (Life Technologies) in the dark. The antibodies were diluted in 1% BSA and 0.3% Triton X‐100 in PBS according to the manufacturer's instructions. The cells were rinsed in PBS, and the cell nuclei were stained with DAPI (Life Technologies). The slides were examined under a confocal laser‐scanning microscope (C2si; Nikon, Tokyo, Japan).
Surgically resected colon cancer tissues
Primary colon cancer tissue specimens were obtained from 49 patients who had been diagnosed with stage I or stage IV CRC according to the 2nd English Edition of the Japanese Classification of Colorectal Carcinoma.17 To achieve an accurate diagnosis by immunostaining, tissue samples from stage I patients with limited numbers of cancer cells were excluded from the analysis. All of the patients had undergone operations at Tohoku University Hospital (Sendai, Japan), from 2008 to 2012. Written informed consent was obtained from all patients.
Sample preparation of culture supernatant for SDS‐PAGE
For each of the cell lines, 5 × 10⁶ cells were seeded and cultured for 24 h. The cells were washed with PBS, incubated with serum‐free RPMI medium for 1 h, washed again with PBS, and incubated for 48 h in serum‐free RPMI medium. The culture media were centrifuged at 1500 g to remove cell debris, and were concentrated 20‐fold using a PAGE Clean Up Kit (Nacalai Tesque, Kyoto, Japan).
Results
Orthotopic tumors and immunostaining
The CRC cells were implanted onto the cecal walls of nude mice, and all cell lines were successfully implanted and proliferated. Eight weeks after implantation, the mice were killed and the tumors were excised and diagnosed macroscopically (Fig. 1a) and microscopically (Fig. 1b). Immunostaining analyses were carried out for the 16 CRC cell lines in both in vitro cultured cells and the orthotopically implanted tumors (Fig. 1c). In the analyses, E‐cadherin and CK20 were immunostained as epithelial markers, and vimentin and β‐catenin were immunostained as mesenchymal markers. In both the cultured cells and orthotopic tumors, immunostaining for E‐cadherin and CK20 showed a positive correlation (data not shown). During the processes of EMT, both vimentin staining and nuclear staining of β‐catenin were observed in CRC. However, no positive correlations were observed between immunostaining for vimentin or β‐catenin because interpreting the results of β‐catenin immunostaining was difficult due to the diversity of immunostaining findings in the cytoplasm and nuclei (data not shown). Hence, for the subsequent analyses, vimentin was used as a mesenchymal marker and E‐cadherin was used as an epithelial marker.
Figure 1.
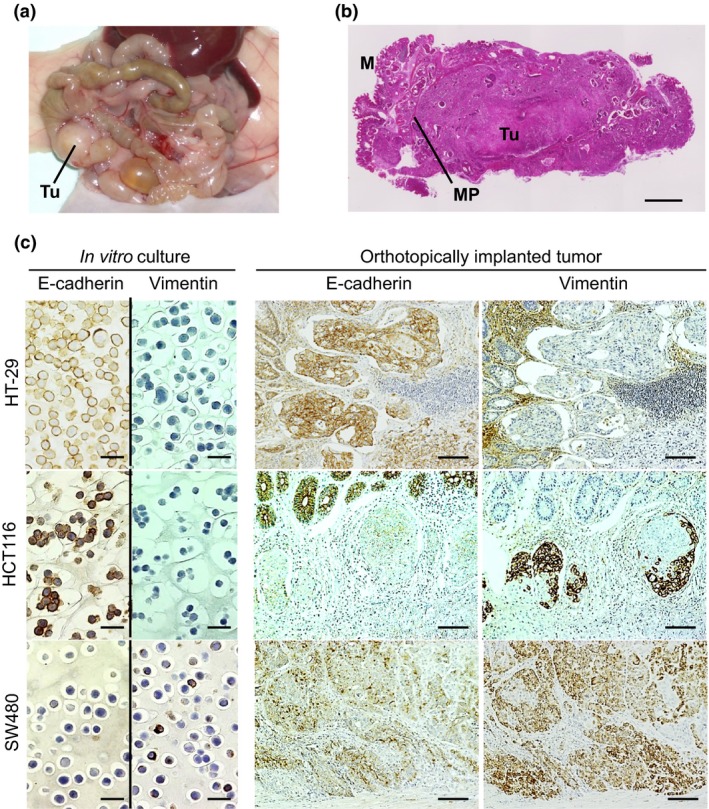
Immunostaining of cultured cells in vitro and orthotopically implanted colorectal tumors. (a) Macroscopic findings of the primary tumor (Tu). (b) Histological findings of an orthotopically implanted tumor. M, mucosa; MP, proper muscle layer. Scale bar = 1 mm. (c) E‐cadherin and vimentin were immunostained in cultured cells in vitro (scale bar = 25 μm) and serially sectioned, orthotopically implanted tumors (scale bar = 100 μm).
Representative images of immunocytochemistry of the in vitro cultured cells and immunohistochemistry of the orthotopic tumors are shown in Figure 1(c). In epithelial cells of the colorectum, epithelial markers, such as E‐cadherin, are generally strongly expressed, whereas mesenchymal markers, such as vimentin, are typically negatively expressed. In Figure 1(c), HT‐29 is positive for E‐cadherin and negative for vimentin, as the majority of epithelial cells are, HCT116 is positive for E‐cadherin and is focally positive for vimentin in the orthotopic tumors but negative in the cultured cells, and SW480 is positive for vimentin and slightly positive for E‐cadherin in both the cultured cells and orthotopic tumors.
“Epithelial,” “EMT,” and “mesenchymal” phenotypes
The images of immunocytochemistry of the in vitro cultured cells and immunohistochemistry of the orthotopic tumors in 16 cell lines are summarized in Figure S1. Based on the immunostaining, the sum of the intensity and extent (0–7) was scored as described in Materials and Methods, and the scores for the 16 cell lines were summarized in Figure 2. In seven cell lines (HT‐29, SW948, T84, LoVo, HCT8, HCT15, and DLD‐1), E‐cadherin was positive and vimentin was negative. In the majority of other cell lines, the expression of E‐cadherin was retained. In five cell lines (CX‐1, COLO205, CloneA, HCT116, and SW48), vimentin was focally positive in the orthotopic tumors and negative in the cultured cells (Fig. 2), which supports the idea that the five cell lines acquired the EMT phenotype following orthotopic implantation. Three cell lines (SW480, SW620, and COLO320) were positive in both the cultured cells and implanted tumors, which supports the idea that the mesenchymal phenotype is present in these cells in vitro and in vivo.
Figure 2.
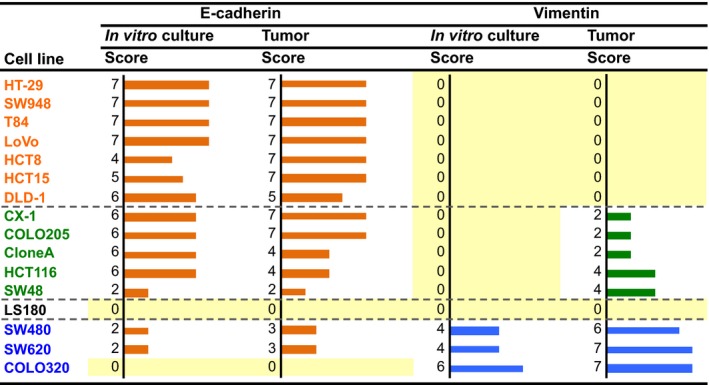
Immunostaining scores for expression of E‐cadherin and vimentin in cultured colorectal cancer cells in vitro and the orthotopically implanted tumors. Staining intensity was scored as 0 (negative), 1 (weak), 2 (medium), or 3 (strong). The extent of staining was scored as 0 (0%), 1 (1–25%), 2 (26–50%), 3 (51–75%), or 4 (76–100%) according to the proportion of positively stained areas in relation to the area of the whole tumor. The sum of the intensity and extent scores was used as the final staining score (0–7) for each specimen. Names of the cell lines were represented using three colors to discriminate their phenotypic belongings shown in Fig.3, 15
Based on the immunostaining results summarized in Figure 2, we classified the cell lines into three groups (Fig. 3a): those expressing the “epithelial phenotype” (E‐cadherin‐positive and vimentin‐negative), those expressing the “EMT phenotype” (focally vimentin‐positive in orthotopic tumors and negative in cultured cells), and those expressing the “mesenchymal phenotype” (vimentin‐positive in both cultured cells and orthotopic tumors). The LS180 cell line was negative for both E‐cadherin and vimentin and therefore excluded from the subsequent analyses.
Figure 3.
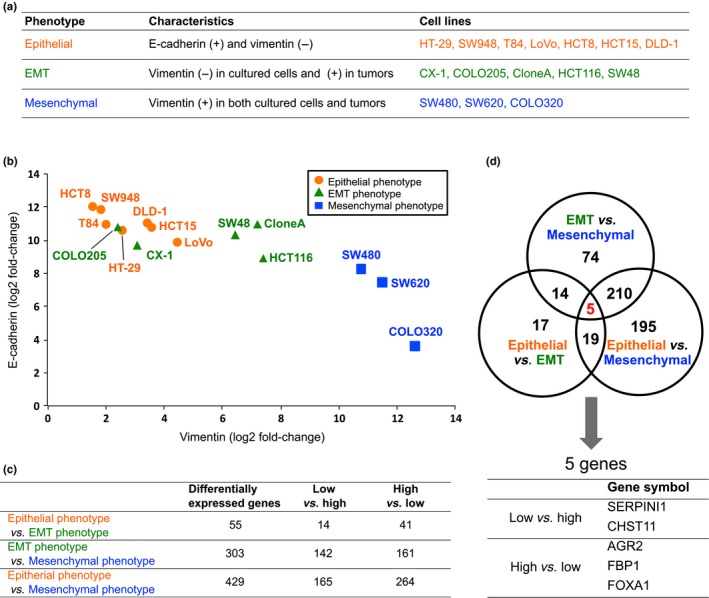
Expression analysis of the 16 colorectal cancer cell lines using cDNA microarray data. (a) Fifteen CRC cell lines were classified into three subgroups. (b) Array‐based normalized expression levels of the E‐cadherin and vimentin genes were two‐dimensionally plotted. (c) Differentially expressed genes were selected based on a ratio of the log2‐transformed values of the normalized expression levels between the two groups of log2[fold change] > 1.0 and a false discovery rate < 10−6. (d) Differentially expressed genes in common among the three comparisons in (c) were explored. EMT, epithelial–mesenchymal transition.
cDNA microarray analysis
Using the microarray data that were normalized and converted to log2 ratios, for each of the 15 cell lines, we two‐dimensionally plotted the expression levels of E‐cadherin and vimentin (Fig. 3b). The mRNA expression levels that were determined with the cDNA microarray were validated by a RT‐PCR. The results revealed that the expressions of E‐cadherin and vimentin at mRNA levels showed a negative correlation. The cells classified into the three groups based on the immunostaining patterns (Fig. 3a) were closely plotted again (Fig. 3b), which indicated that the expressions of E‐cadherin and vimentin observed at the mRNA level on the cDNA microarray analyses were closely related to those noted at the protein level on immunostaining.
Next, we compared the gene expressions among two of the three groups: the epithelial phenotype, EMT phenotype, and mesenchymal phenotype (Fig. 3c). For example, in the comparison of the epithelial phenotype and the EMT phenotype, 55 genes were listed. The genes listed in each comparison are summarized in Table S2. Furthermore, we explored genes that were commonly listed in the three comparisons (Fig. 3d) and identified five differentially expressed genes in common. Among them, the expressions of the SERPINI1 and CHST11 genes were lowest in the epithelial phenotype and highest in the mesenchymal phenotype. In contrast, the AGR2, FBP1, and FOXA1 genes showed the opposite pattern. Information obtained from the NCBI and HPA for these five genes is summarized in Table 1.
Knockdown of SERPINI1 and CHST11 genes
Considering SERPINI1 and CHST11 to be candidate genes associated with EMT, we knocked down these genes with siRNA. In the experiments, we chose SW620 cells, in which vimentin is highly expressed. First, the knockdown of SERPINI1 and CHST11 with siRNA for each gene (si SERPINI1 and si CHST11, respectively) was confirmed using RT‐PCR (Fig. 4a). Next, the downregulation of SERPINI1 and CHST11 at the protein level using each siRNA was confirmed with Western blotting (Fig. 4b). Subsequently, under knockdown of SERPINI1 and CHST11 using each siRNA, the induction of E‐cadherin and suppression of vimentin and Snail at the protein level was confirmed (Fig. 4b). In this experiment, suppression of Snail was more evident under si SERPINI1 than under si CHST11. Finally, the induction of E‐cadherin in the SW620 cells under knockdown of SERPINI1 or CHST11 was confirmed with a confocal microscope based on the remarkable expression of E‐cadherin in the cellular membranes (green) compared with that observed in the controls (Fig. 4c). Next, knockdown of SERPINI1 and CHST11 revealed morphologic alterations in the SW620 cells, with changes into an aggregated form (Fig. 4d).
Figure 4.
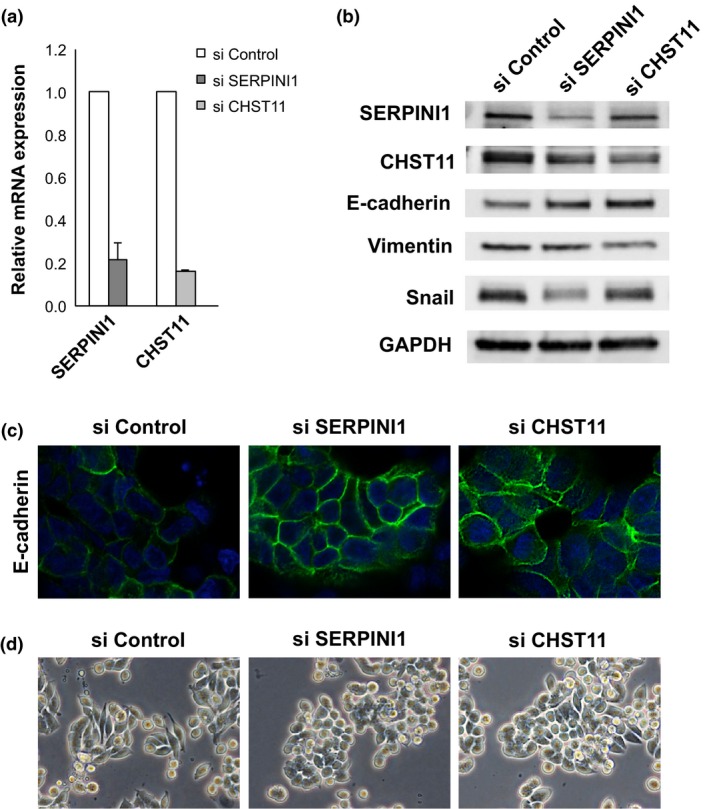
Knockdown of SERPINI1 and CHST11 genes in SW620 colorectal cancer cells. (a) Knockdown of SERPINI1 and CHST11 was confirmed using real‐time RT‐PCR. (b) Using Western blotting, the upregulation of E‐cadherin and downregulation of vimentin and Snail under knockdown of SERPINI1 and CHST11 were confirmed. (c) Using confocal microscopy, the induction of E‐cadherin (green) under knockdown of SERPIN1 and CHST11 was confirmed. (d) SW620 cells morphologically changed under knockdown of SERPINI1 and CHST11 into an aggregated form. si, knockdown using siRNA.
SERPINI1 and CHST11 immunostaining
To confirm the expression and localization of the SERPINI1 and CHST11 proteins, orthotopic tumors and surgically resected colon cancer tissues were subjected to immunostaining. SERPINI1 was strongly stained in all of the five orthotopic tumors with the EMT phenotype (CX‐1, COLO205, and others) and in some of the tumors with other phenotypes (Figs 5,S2). However, it was difficult to score the immunostaining of CHST11 (data not shown). In addition, as shown in Figure 6, the cancer cells at the invasive fronts were more strongly stained with SERPINI1 compared to those in the central cancer regions; this phenomenon was observed in several cell lines. To confirm the clinical significance, the SERPINI1 protein was immunostained in surgically resected tissue samples from colon cancer patients (Table S3). The median postoperative follow‐up time was 50.5 months (range, 10.6–62.7 months) and all of the stage I patients survived without recurrence for at least 3 years. In contrast, over 95% of the stage IV patients experienced a recurrence and died within this period. The histological features of stage IV tumors showed a lower degree of differentiation (poorly differentiated (por) and moderately differentiated (tub2) adenocarcinomas17). than stage I tumors. Furthermore, the stage IV tumors were strongly immunostained with SERPINI1 (Fig. 7a), and had a higher average SERPINI1 score than the stage I tumors (4.7 vs 2.8; Fig. 7b). In contrast, it was difficult to find patterns of CHST11 immunostaining with surgically resected cancer tissue specimens (data not shown).
Figure 5.
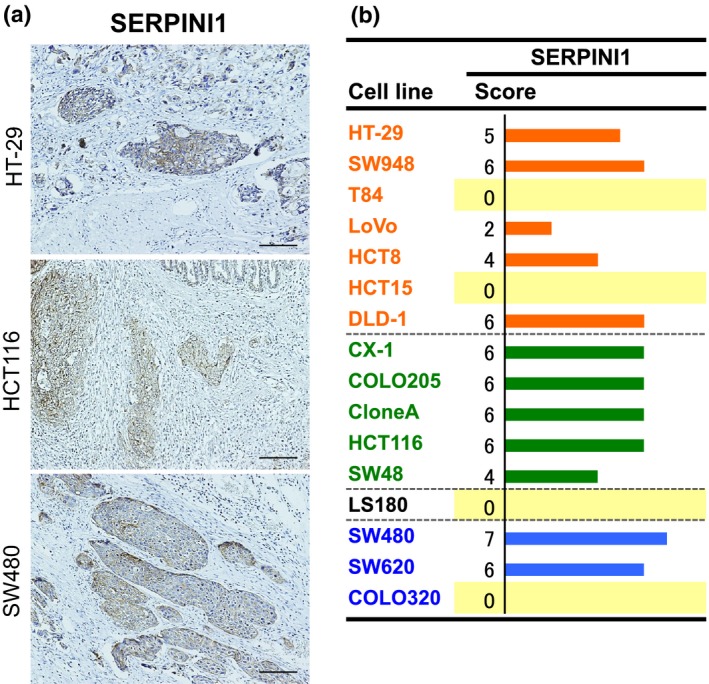
Immunostaining for SERPINI1 in orthotopically implanted colorectal tumors. (a) Immunostaining for SERPINI1 was carried out in serially sectioned, orthotopically implanted tumors (scale bar = 100 μm). (b) Immunostaining for expression of SERPINI1. Staining intensity was scored as 0 (negative), 1 (weak), 2 (medium), or 3 (strong). The extent of staining was scored as 0 (0%), 1 (1–25%), 2 (26–50%), 3 (51–75%), or 4 (76–100%) according to the proportion of positively stained areas in relation to the area of the whole tumor. The sum of the intensity and extent scores was used as the final staining score (0–7) for each specimen. Names of the cell lines were represented using three colors to discriminate their phenotypic belongings shown in Fig.3.15
Figure 6.
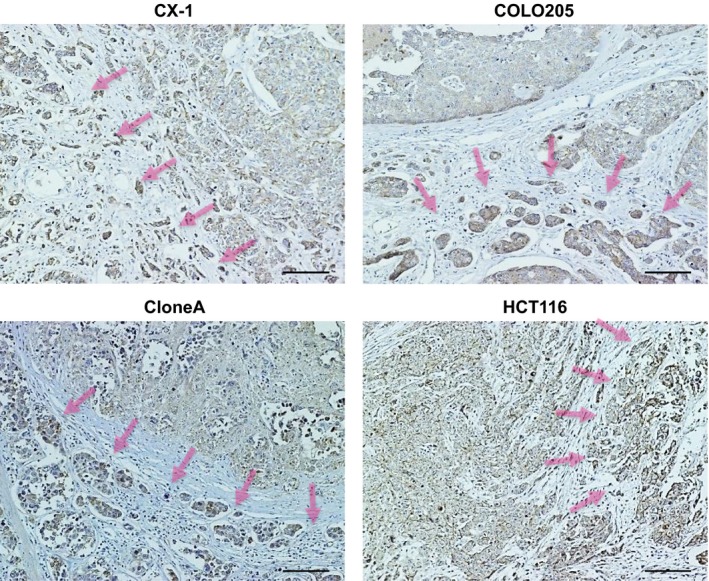
Immunostaining for SERPINI1 at the invasive fronts of orthotopically implanted colorectal tumors. Representative images of CX‐1, COLO205, CloneA, and HCT116 cells are shown. The invasive fronts are indicated with arrows. The cells at the invasive fronts show strong SERPINI1 immunostaining.
Figure 7.
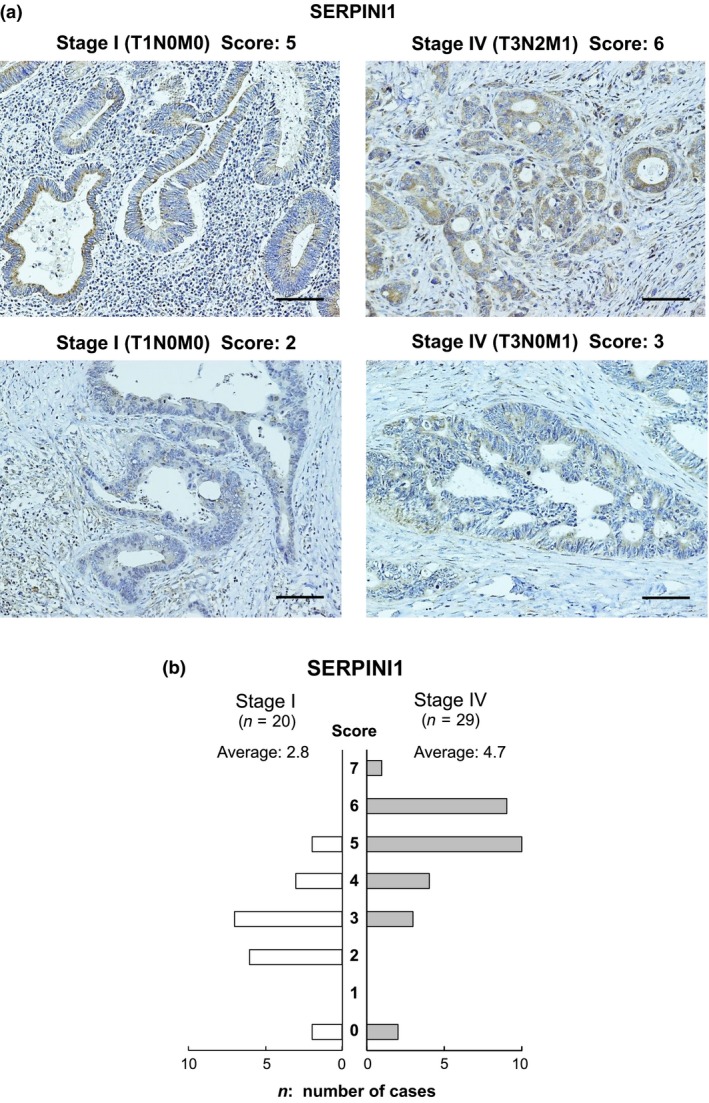
Immunostaining for SERPINI1 in surgically resected colon cancer tissues. (a) Representative images of the immunostaining for SERPINI1 are shown. (b) A summary of the SERPINI1 immunostaining scores in 49 colon cancer cases. Staining intensity was scored as 0 (negative), 1 (weak), 2 (medium), or 3 (strong). The extent of staining was scored as 0 (0%), 1 (1–25%), 2 (26–50%), 3 (51–75%), or 4 (76–100%) according to the proportion of positively stained areas in relation to the area of the whole tumor. The sum of the intensity and extent scores was used as the final staining score (0–7) for each specimen.15
Secreted SERPINI1 in culture supernatants
As SERPINI1 is a secreted protein, the levels of SERPINI1 protein in CSs from 15 types of cells were quantified with Western blotting (Fig. 8a), which revealed that the levels of the SERPINI1 protein were positively correlated with those at mRNA levels in the cells. In particular, the cells in the mesenchymal phenotype and the EMT phenotype showed SERPINI1 expression in CSs; of these cells, SW620 and COLO320 showed particularly high expressions (Fig. 8a). Next, we examined the effect of secreted SERPINI1 protein on the expression of E‐cadherin in SW620 cells (Fig. 8b). Following downregulation of intracellular SERPINI1 using siRNA (si SERPINI1) (Fig. 8b, lanes 2–5), CSs of the SW620 cells were replaced with either the CSs from si SERPINI1‐treated SW620 cells (Fig. 8b, lane 3) or the CSs from si Control‐treated cells (Fig. 8b, lanes 4 and 5 as duplicated experiments) to examine the effect of the secreted SERPINI1 protein in the CSs. The expression level of intracellular E‐cadherin did not change with the treatment of the CSs from the si SERPINI1‐treated SW620 cells (Fig. 8b, lane 3), in which supernatants secreted SERPINI1 protein was suppressed; however, the expression of E‐cadherin was downregulated when the SW620 cells were treated with the CSs from si Control‐treated cells (Fig. 8b, lanes 4 and 5), in which the levels of secreted SERPINI1 protein was kept.
Figure 8.
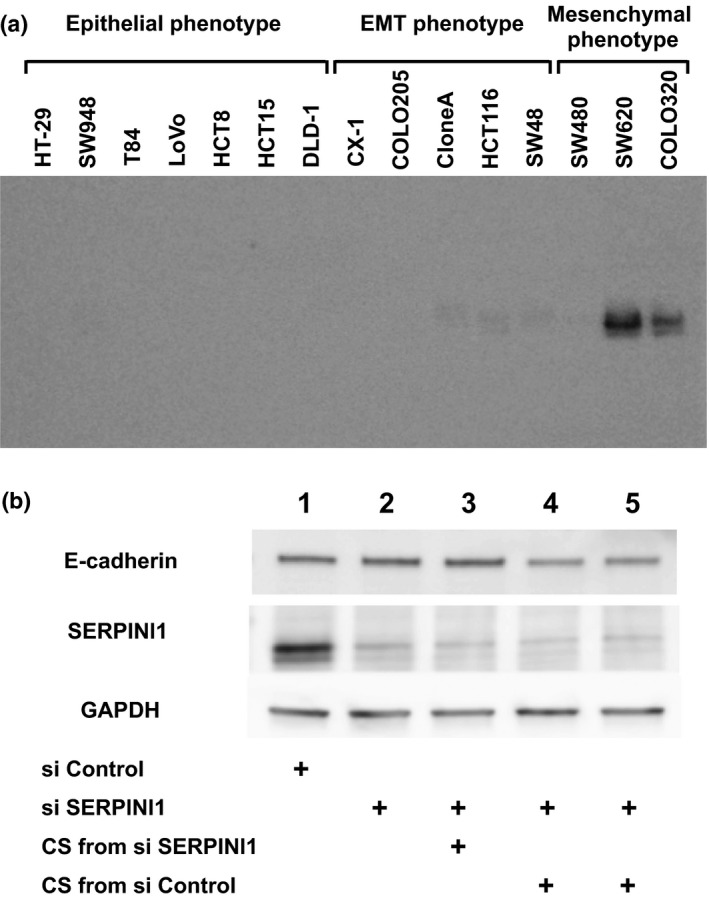
Effects of secreted SERPINI1 protein in culture supernatants (CSs) of colorectal cancer cells. (a) With Western blotting the protein levels of secreted SERPINI1 in the CSs from 15 cell lines were positively correlated with the mRNA expression levels among those cells. (b) The expression level of E‐cadherin in SW620 cells did not change with the treatment of CSs from si SERPINI1‐treated cells (lane 3 vs lane 2); however, the expression of E‐cadherin was downregulated when the cells were treated with CSs from si Control‐treated cells (lane 4 and lane 5 as duplicated experiments). EMT, epithelial–mesenchymal transition.
Discussion
During the process of cancer invasion and metastasis, malignant epithelial cells lose their characteristics of cell polarity and cell–cell adhesion, which causes their transition to the mesenchymal phenotype. In this process, the expression of EMT‐associated genes, including E‐cadherin, vimentin, β‐catenin, Snail, Slug, TWIST, and ZEB1, are diversely altered. Among these genes, the suppression of E‐cadherin is thought to be one of the most crucial changes that occurs during EMT,18, 19 and Snail plays an important role in both the expression of E‐cadherin and the induction of EMT and cell proliferation.20, 21
In our study, in order to confirm the phenotypic and molecular changes of CRC cells in the EMT, we used an orthotopically implanted tumor model in mice, rather than an ectopic tumor model. In this study, we observed several important findings regarding the EMT in CRC cells. First, using 16 types of CRC cells, we clarified that some of the cells showed an epithelial phenotype with a high expression of the epithelial marker E‐cadherin and a negative expression of vimentin, whereas other cells showed the opposite pattern, that is, a high expression of vimentin (Fig. 2). Another significant finding was that five of the cell lines (CX‐1, COLO205, CloneA, HCT116, and SW48) showed a focal expression of vimentin only following orthotopic implantation of the cells into nude mice. Such information has not been previously reported and should be very beneficial in future studies as the platform to analyze the EMT in CRC cells. Second, we identified candidate genes important for EMT processes and selected five genes, including SERPINI1, that we considered to be the most important. We believe that this information will help to elucidate the molecular background of EMT. Furthermore, we downregulated the expressions of the SERPINI1 and CHST11 genes to confirm their effects on SW620 cells and SW48 cells, the results of which supported the notion that our strategies are reasonable. Next, immunohistochemical analyses of the SERPINI1 and CHST11 proteins in orthotopic tumors and surgically resected colon cancer tissues showed that the intracellular SERPINI1 protein should be important for EMT (Figs 5, 6, 7,S2), but it was difficult to score the immunostaining of CHST11. For this reason, we further focused on SERPINI1. As SERPINI1 has been reported to be a secreted protease,22 we examined the effects of secreted SERPINI1 protein on the expression of E‐cadherin in SW620 cells (Fig. 8), which supported the importance of both intracellular and secreted SERPINI1 proteins on the regulation of E‐cadherin and the EMT. With those findings, we believe that SERPINI1 is important for further analyzing the molecular mechanisms of the EMT in CRC cells and may be key targets for developing novel therapeutic strategies for treating CRC through the pathways of EMT.
Serpin peptidase inhibitor, clade I, member 1 is a secreted protease that inhibits tissue‐type plasminogen activator and plasmin.22 Although information remains limited, the SERPINI1 gene has been reported to be related to malignancies. For example, serum SERPINI1 levels have been reported to be elevated in patients with hepatocellular carcinoma and CRC.23 In addition, Barderas et al.24 reported that three proteins, SERPINI1, growth differentiation factor 15, and S100 calcium binding proteins A8/A9, show potential as candidate biomarkers for CRC diagnosis.
In investigating the EMT, it is important to clarify correlations between the phenotypes of EMT and the original cell properties, such as cellular morphology, degrees of cellular atypia, and differentiation. In the present study, the immunostaining of SERPINI1 revealed two important points: in surgically resected stage IV tumors, the histological features were less differentiated and the immunostaining of SERPINI1 was stronger (Fig. 7); and the cancer cells at invasive fronts, which were less differentiated than the cells in the central tumor regions, showed stronger SERPINI1 immunostaining in several cell lines (Fig. 6). These results support the hypothesis that SERPINI1 plays important roles in EMT.
Snail recruits the polycomb repressive complex 2, which contains enhancer of zeste 2 polycomb repressive complex 2 subunit (EZH2), suppressor of variegation 3‐9 homolog 1 (SUV39H1), and other factors for the transcriptional regulation of SNAIL during the EMT.25 In addition to those transcription factors, multiple signaling pathways activate the expression of Snail, including the TGF‐β–SMAD pathway, the Wnt–β‐catenin pathway, the Notch pathway, and growth factors that act through receptor tyrosine kinases. However, glycogen synthase kinase‐3β‐mediated Snail phosphorylation inactivates the transcriptional activity of Snail. To elucidate the regulatory mechanisms of Snail with SERPINI1, the above‐described pathways and factors must be functionally analyzed in a future study. In a secretome study, Barderas et al.24 identified a large amount of secreted SERPINI1 in supernatants from KM12SM and KM12C colon cancer cells. In their study, the SERPINI1 protein was also precipitated and functionally analyzed. Some secreted proteases, which include the ADAMTS family and secreted forms of ADAM proteins, have also been reported to have important roles in the invasion of CRC.26, 27 It was therefore important to analyze secreted SERPINI1 protein with such strategies.
Considering the recently accumulated results of research on EMT, the development of therapeutic strategies targeting the EMT is promising. A series of factors regulating EMT, such as TGF‐β, Snail, E‐cadherin, vimentin, β‐catenin, Slug, TWIST, and ZEBI, are candidate targets for developing novel strategies to cure malignancies, and novel candidates, such as SERPINI1, may become targets as well. Garg28 and Li et al.29 introduced therapeutic strategies targeting EMT in their review articles. Recently, several inhibitors against TGF‐β signaling have been shown to have anti‐invasive effects. Among them, LY2109761 is a novel TGF‐β receptor type I and type II dual inhibitor with the potential to be used in therapeutic approaches designed to suppress colon and pancreatic cancer metastasis.30
In conclusion, in the present study with 16 CRC cell lines, we were able to confirm the presence of epithelial, EMT, and mesenchymal phenotypic changes in vivo. This model may provide a platform for identifying elements that are important in the process of EMT in the tumor microenvironment. Furthermore, we identified SERPINI1 to be a novel EMT‐associated gene. Our data provide insight into the molecular mechanisms underlying the induction of the EMT during CRC progression, which may be of significance for developing new therapeutic strategies for treating CRC.
Disclosure Statement
The authors have no conflict of interest.
Abbreviations
- ADAM
a disintegrin and metalloproteinase
- ADAMTS
a disintegrin and metalloproteinase with thrombospondin motifs
- AGR2
anterior gradient 2 homolog
- CHST11
carbohydrate sulfotransferase 11
- CK20
cytokeratin 20
- CRC
colorectal cancer
- CS
culture supernatant
- deltaEF1
elongation factor 1‐delta
- EMT
epithelial–mesenchymal transition
- FBP1
fructose‐1,6‐bisphosphatase 1
- FOXA1
forkhead box A1
- HPA
Human Protein Atlas
- SERPINI1
serpin peptidase inhibitor, clade I, member 1
- SIP1
smad binding protein 1
- si
knockdown with siRNA
- TGF‐β
transforming growth factor‐β
- TWIST
twist family bHLH transcription factor
- ZEB
zinc finger E‐box binding homeobox
Supporting information
Fig. S1. Immunostaining of 16 colorectal cancer cell lines.
Fig. S2. Immunostaining of 16 colorectal cancer cell lines.
Table S1. Primers for real time RT‐PCR analysis.
Table S2. Differentially expressed genes between two phenotypes (top‐ranked 50).
Table S3. Baseline characteristics of the colon cancer patients.
Acknowledgments
The authors appreciate the skillful technical assistance of Dr. Daisuke Douchi, Dr. Tomohiko Sase, Ms. Emiko Shibuya and Ms. Keiko Inabe (Tohoku University). This research was supported by a Grant‐in‐Aid for Scientific Research (KAKENHI) (Nos. 24791368 and 26461967) from the Japan Society for the Promotion of Science, and the HIROMI Medical Research Foundation (Sendai, Japan).
Cancer Sci 107 (2016) 619–628
Funding Information
Japan Society for the Promotion of Science; HIROMI Medical Research Foundation
References
- 1. Ferlay J, Soerjomataram I, Dikshit R et al Cancer incidence and mortality worldwide: sources, methods and major patterns in GLOBOCAN 2012. Int J Cancer 2015; 136: E359–86. [DOI] [PubMed] [Google Scholar]
- 2. Siegel RL, Miller KD, Jemal A. Cancer statistics, 2015. CA Cancer J Clin 2015; 65: 5–29. [DOI] [PubMed] [Google Scholar]
- 3. Brenner H, Bouvier AM, Foschi R et al Progress in colorectal cancer survival in Europe from the late 1980s to the early 21st century: the EUROCARE study. Int J Cancer 2012; 131: 1649–58. [DOI] [PubMed] [Google Scholar]
- 4. Kobayashi H, Kotake K, Sugihara K. Prognostic scoring system for stage IV colorectal cancer: is the AJCC sub‐classification of stage IV colorectal cancer appropriate? Int J Clin Oncol 2012; 18: 696–703. [DOI] [PubMed] [Google Scholar]
- 5. Greenburg G, Hay ED. Epithelia suspended in collagen gels can lose polarity and express characteristics of migrating mesenchymal cells. J Cell Biol 1982; 95: 333–9. [DOI] [PMC free article] [PubMed] [Google Scholar]
- 6. Zavadil J, Haley J, Kalluri R, Muthuswamy SK, Thompson E. Epithelial‐mesenchymal transition. Cancer Res 2008; 68: 9574–7. [DOI] [PubMed] [Google Scholar]
- 7. Zeisberg M, Neilson EG. Biomarkers for epithelial‐mesenchymal transitions. J Clin Invest 2009; 119: 1429–37. [DOI] [PMC free article] [PubMed] [Google Scholar]
- 8. Savagner P. The epithelial‐mesenchymal transition (EMT) phenomenon. Ann Oncol 2010; 21 (Suppl 7): vii89–92. [DOI] [PMC free article] [PubMed] [Google Scholar]
- 9. Iwatsuki M, Mimori K, Yokobori T et al Epithelial‐mesenchymal transition in cancer development and its clinical significance. Cancer Sci 2010; 101: 293–9. [DOI] [PMC free article] [PubMed] [Google Scholar]
- 10. De Wever O, Pauwels P, De Craene B et al Molecular and pathological signatures of epithelial‐mesenchymal transitions at the cancer invasion front. Histochem Cell Biol 2008; 130: 481–94. [DOI] [PMC free article] [PubMed] [Google Scholar]
- 11. Polyak K, Weinberg RA. Transitions between epithelial and mesenchymal states: acquisition of malignant and stem cell traits. Nat Rev Cancer 2009; 9: 265–73. [DOI] [PubMed] [Google Scholar]
- 12. Jiang J, Tang Y‐l, Liang X‐h. EMT: a new vision of hypoxia promoting cancer progression. Cancer Biol Ther 2011; 11: 714–23. [DOI] [PubMed] [Google Scholar]
- 13. Fidler IJ. Orthotopic implantation of human colon carcinomas into nude mice provides a valuable model for the biology and therapy of metastasis. Cancer Metastasis Rev 1991; 10: 229–43. [DOI] [PubMed] [Google Scholar]
- 14. Sasaki H, Miura K, Horii A et al Orthotopic implantation mouse model and cDNA microarray analysis indicates several genes potentially involved in lymph node metastasis of colorectal cancer. Cancer Sci 2008; 99: 711–9. [DOI] [PMC free article] [PubMed] [Google Scholar]
- 15. Masunaga R, Kohno H, Dhar DK et al Cyclooxygenase‐2 expression correlates with tumor neovascularization and prognosis in human colorectal carcinoma patients. Clin Cancer Res 2000; 6: 4064–8. [PubMed] [Google Scholar]
- 16. Benjamini Y, Hochberg Y. Controlling the false discovery rate: a practical and powerful approach to multiple testing. J R Stat Soc Series B Stat Methodol 1995; 57: 289–300. [Google Scholar]
- 17. The Japanese Society for Cancer of the Colon and Rectum . Japanese Classification of Colorectal Carcinoma, 2nd English edn Tokyo: Kanehara Shuppan, 2009. [Google Scholar]
- 18. Rodriguez FJ, Lewis‐Tuffin LJ, Anastasiadis PZ. E‐cadherin's dark side: possible role in tumor progression. Biochim Biophys Acta 2012; 1826: 23–31. [DOI] [PMC free article] [PubMed] [Google Scholar]
- 19. Stoops SL, Pearson AS, Weaver C et al Identification and optimization of small molecules that restore E‐cadherin expression and reduce invasion in colorectal carcinoma cells. ACS Chem Biol 2011; 6: 452–65. [DOI] [PMC free article] [PubMed] [Google Scholar]
- 20. Barrallo‐Gimeno A, Nieto MA. The Snail genes as inducers of cell movement and survival: implications in development and cancer. Development 2005; 132: 3151–61. [DOI] [PubMed] [Google Scholar]
- 21. Hoshino H, Miyoshi N, Nagai K et al Epithelial‐mesenchymal transition with expression of SNAI1‐induced chemoresistance in colorectal cancer. Biochem Biophys Res Commun 2009; 390: 1061–5. [DOI] [PubMed] [Google Scholar]
- 22. Hastings GA, Coleman TA, Haudenschild CC et al Neuroserpin, a brain‐associated inhibitor of tissue plasminogen activator is localized primarily in neurons. Implications for the regulation of motor learning and neuronal survival. J Biol Chem 1997; 272: 33062–7. [DOI] [PubMed] [Google Scholar]
- 23. Jia HL, Ye QH, Qin LX et al Gene expression profiling reveals potential biomarkers of human hepatocellular carcinoma. Clin Cancer Res 2007; 13: 1133–9. [DOI] [PubMed] [Google Scholar]
- 24. Barderas R, Mendes M, Torres S et al In‐depth characterization of the secretome of colorectal cancer metastatic cells identifies key proteins in cell adhesion, migration, and invasion. Mol Cell Proteomics 2013; 12: 1602–20. [DOI] [PMC free article] [PubMed] [Google Scholar]
- 25. Lamouille S, Xu J, Derynck R. Molecular mechanisms of epithelial‐mesenchymal transition. Nat Rev Mol Cell Biol 2014; 15: 178–96. [DOI] [PMC free article] [PubMed] [Google Scholar]
- 26. Przemyslaw L, Boguslaw HA, Elzbieta S, Malgorzata SM. ADAM and ADAMTS family proteins and their role in the colorectal cancer etiopathogenesis. BMB Rep 2013; 46: 139–50. [DOI] [PMC free article] [PubMed] [Google Scholar]
- 27. Kelwick R, Desanlis I, Wheeler GN, Edwards DR. The ADAMTS (A Disintegrin and Metalloproteinase with Thrombospondin motifs) family. Genome Biol 2015; 16: 113. [DOI] [PMC free article] [PubMed] [Google Scholar]
- 28. Garg M. Targeting microRNAs in epithelial‐to‐mesenchymal transition‐induced cancer stem cells: therapeutic approaches in cancer. Expert Opin Ther Targets 2015; 19: 285–97. [DOI] [PubMed] [Google Scholar]
- 29. Li Y, Maitah MY, Ahmad A, Kong D, Bao B, Sarkar FH. Targeting the Hedgehog signaling pathway for cancer therapy. Expert Opin Ther Targets 2012; 16: 49–66. [DOI] [PubMed] [Google Scholar]
- 30. Melisi D, Ishiyama S, Sclabas GM et al LY2109761, a novel transforming growth factor beta receptor type I and type II dual inhibitor, as a therapeutic approach to suppressing pancreatic cancer metastasis. Mol Cancer Ther 2008; 7: 829–40. [DOI] [PMC free article] [PubMed] [Google Scholar]
Associated Data
This section collects any data citations, data availability statements, or supplementary materials included in this article.
Supplementary Materials
Fig. S1. Immunostaining of 16 colorectal cancer cell lines.
Fig. S2. Immunostaining of 16 colorectal cancer cell lines.
Table S1. Primers for real time RT‐PCR analysis.
Table S2. Differentially expressed genes between two phenotypes (top‐ranked 50).
Table S3. Baseline characteristics of the colon cancer patients.


