

Abstract
Genetic mutations in TAR DNA-binding protein 43 (TDP-43) cause amyotrophic lateral sclerosis (ALS), and the increased presence of TDP-43 in the cytoplasm is a prominent histopathological feature of degenerating neurons in various neurodegenerative diseases. However, the molecular mechanisms by which TDP-43 contributes to ALS pathophysiology remain elusive. Here, we have found that TDP-43 accumulates in mitochondria in neurons of subjects with ALS or frontotemporal dementia (FTD). Disease-associated mutations increase TDP-43 mitochondrial localization. Within mitochondria, wild type (WT) and mutant TDP-43 preferentially bind mitochondria-transcribed messenger RNAs (mRNAs) encoding respiratory complex I subunit ND3 and ND6, impair their expression and specifically cause complex I disassembly. Suppression of TDP-43 mitochondrial localization abolishes WT and mutant TDP-43-induced mitochondrial dysfunction and neuronal loss, and improves phenotypes of transgenic mutant TDP-43 mice. Thus, our studies link TDP-43 toxicity directly to mitochondrial bioenergetics and propose targeting TDP-43 mitochondrial localization as a promising therapeutic approach for neurodegeneration.
Introduction
ALS is the most common motor disease characterized by progressive motor neuron degeneration in the brain stem and spinal cord1, while FTD is the second most common form of early-onset dementia caused by neuron loss in the frontal and temporal cortex2. The vast majority of ALS or FTD cases, referred to as sporadic ALS or FTD, are not genetically transmitted and their causes remain unknown. Currently, there is no effective treatment for both ALS and FTD.
TDP-43 (also named TARDBP) is a small ubiquitously expressed RNA and DNA binding protein containing two tandem RNA recognition motifs RRM1 and RRM23. Previous studies have revealed that TDP-43 primarily binds mRNA and regulates post-transcriptional RNA processing, including RNA splicing, transportation and translation4–6. Autosomal dominant mutations in TDP-43 are associated with sporadic and familial ALS7,8, and the redistribution of TDP-43 from the nucleus to cytoplasm has been recognized as a pathological hallmark for most forms of ALS and most frequent subtypes of FTD9,10. In fact, the mis-localization of TDP-43 to the cytoplasm also represents a key pathological feature of other major neurodegenerative diseases including Alzheimer’s disease11,12, Parkinson’s disease13 and Huntington’s disease14.
It still remains controversial whether loss of TDP-43 function via nuclear depletion or gain of function by adverse effect of cytoplasmic TDP-43 causes neuronal loss in ALS and FTD. Interestingly, previous studies have revealed that nuclear depletion is not required for TDP-43 neuronal toxicity15,16, and cytoplasmic TDP-43 is sufficient to cause neurodegeneration17, suggesting an important role of cytoplasmic TDP-43 in disease progress. However, both the pathogenic mechanisms of cytoplasmic TDP-43, as well as its subcellular organelle targets, remain largely unknown.
Results
TDP-43 accumulates in mitochondria in ALS and FTD
We first investigated the co-localization of TDP-43 with various neuronal organelles in human spinal cord and frontal cortex tissue samples obtained from ALS and FTD cases, respectively, compared to age-matched normal individuals. Both spinal cord motor neurons and cortical neurons in the control cases demonstrated mainly nuclear TDP-43 localization, while both ALS motor neurons and FTD cortical neurons showed characteristically high levels of cytoplasmic TDP-43 accumulation (Fig. 1a–d). Notably, cytoplasmic TDP-43 co-localized with mitochondrial markers in many ALS spinal cord motor neurons or FTD cortical neurons, but minimally overlapped with markers of Golgi, endoplasmic reticulum, lysosome, autophagosome, endosome or peroxisome (Fig. 1a–d and Supplementary Fig. 1). Despite low abundance, cytoplasmic TDP-43 in control human motor neurons and cortical neurons also significantly co-localized with mitochondria (Fig. 1a–d and Supplementary Fig. 1).
Figure 1. TDP-43 co-localizes with and accumulates in mitochondria in individuals with ALS and FTD.
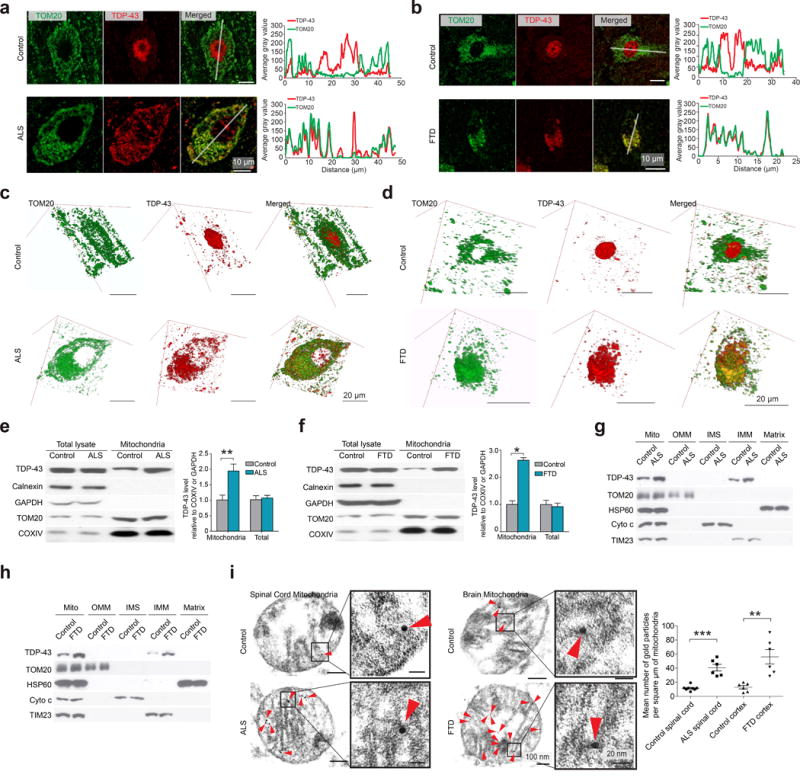
(a,b) Representative images of TOM20 and TDP-43 in human motor neurons in lumbar spinal cords of sporadic ALS (n = 6) (a), or human cortical neurons in cortices of sporadic FTD (n = 4) (b). Control neurons are from age-matched normal individuals (n = 5 for spinal cords and 3 for cortices). Right panels show line-scan analysis (by Image J RGB Profile Plot plugin) along the solid white lines depicted in the merged images to the left. (c,d) Reconstructed three-dimension (3D) images of the neurons depicted in a and b, respectively. (e, f) Representative immunoblot and quantification (n = 3) of TDP-43 levels in mitochondria isolated from age matched control (n = 6) and sporadic ALS (n = 8) spinal cords (e), or age matched control (n = 6) and sporadic FTD (n = 7) cortices (f). (g,h) Representative immunoblot (n = 3) of TDP-43 in sub-mitochondrial fractions prepared from ALS spinal cords (g) and FTD cortices (h). (i) Immuno-EM of TDP-43 in mitochondria from sporadic ALS spinal cord or sporadic FTD cortex. Red arrowheads point to immunogold labeled TDP-43. The right panel shows quantification using thin EM sections with 50 nm thickness. n = 8, 6, 6 and 6 respectively. Data are means ± s.e.m of triplicate independent experiments throughout. Statistics: one-way analysis of variance (ANOVA) followed by Tukey’s multiple comparison test. *P < 0.05, **P < 0.01 and ***P < 0.001.
We further isolated highly purified mitochondria with preserved membranes from human spinal cord and cortical tissues (Supplementary Fig. 2a,b), and found TDP-43 present in mitochondria from all samples (Fig. 1e,f). There was a markedly higher expression of TDP-43 in mitochondria from ALS or FTD than from age-matched controls. Subsequent sub-mitochondrial fractionation analysis revealed that mitochondrial TDP-43 was exclusively present in the inner mitochondrial membrane (IMM) but not in outer mitochondrial membrane (OMM), intermembrane-space (IMS) or matrix (Fig. 1g,h). Immuno-electron microscopy (immuno-EM) analysis of isolated mitochondria and biopsied human cortex confirmed the main localization of TDP-43 in IMM cristae (Fig. 1i and Supplementary Fig. 2c). Mitochondria from ALS spinal cords or FTD cortices exhibited more TDP-43 labeling than those from age-matched controls. We also isolated mitochondria from freshly collected mouse tissue samples of spinal cord and cortex, and treated them with trypsin and digitonin to permeabilize OMM but not IMM. OMM-proteins MFN2 and MFF were digested by trypsin alone, IMS facing IMM proteins TIM23 and OPA1 were digested by trypsin after OMM permeabilization, while TDP-43 or matrix facing IMM proteins COXIV and F1β (also named ATP5B) remained unchanged under all these conditions (Supplementary Fig. 2d). Like COXIV and F1β, TDP-43 could be digested by trypsin after complete membrane permeabilization via triton X-100. TDP-43 also exclusively resides in the IMM fraction of mouse mitochondria (Supplementary Fig. 2e).
ALS-mutations increase TDP-43 mitochondrial localization
We next determined whether disease-associated mutations in TDP-43 affected its mitochondrial localization. We first examined TDP-43 expression in mitochondria isolated from primary human fibroblasts derived from ALS patients bearing TDP-43 mutation G298S or A382T (G298S or A382T fibroblasts) and age-matched normal human individuals (normal human fibroblasts, NHFs). TDP-43 mutations in G298S and A382T fibroblasts were confirmed by genomic DNA sequencing (Supplementary Fig. 2f). Similar to NHFs, G298S and A382T fibroblasts exhibited the predominantly nuclear localization of TDP-43 without cytoplasmic accumulation (Supplementary Fig. 2g). Whereas all fibroblasts displayed comparable expression of total TDP-43 (Supplementary Fig. 2h), G298S and A382T fibroblasts demonstrated significantly higher levels of mitochondrial TDP-43 than NHFs (Fig 2a and Supplementary Fig. 2i). We also compared WT and mutant TDP-43 mitochondrial localization in HEK293 cells or brain and spinal cord tissue samples from transgenic mice overexpressing WT or mutant human TDP-43. Consistently, despite similar levels in total lysates, exogenously expressed human G298S, A315T or A382T TDP-43 showed greater mitochondrial expression than human WT TDP-43 (Fig. 2b,c). Exogenously expressed or endogenous human WT and mutant TDP-43 were still present in IMM fraction (Fig. 2d,e) and digestible by trypsin after IMM but not OMM permeabilization (not shown).
Figure 2. ALS-associated genetic mutations in TDP-43 increase its import into mitochondria.

(a–c) Representative immunoblot and quantification (n = 3) of TDP-43 in mitochondria from human fibroblasts (a), HEK293 cells expressing Flag tagged human WT and mutant TDP-43 (b, arrowhead indicates exogenous Flag-tagged TDP-43), or spinal cords and brains of 1–2 month old transgenic male mice expressing WT or mutant human TDP-43 (hTDP-43) (n = 6 per group) (c). (d, e) Representative immunoblot (n = 3) of TDP-43 in sub-mitochondrial fractions of human fibroblasts (d) or transgenic mice (e). (f) Representative immunoblot (n = 3) of rTDP-43 (left panel) or biotinylated F1β (right panel) in freshly isolated mitochondria from mouse brain after mitochondrial import assay. (g) Representative immunoblot and quantification (n = 3) of rTDP-43 in freshly isolated mitochondria from mouse brain after incubation with rTDP-43 at indicated times followed by trypsin and digitonin co-treatment. (h) Immuno-EM analysis of rTDP-43 in purified mouse brain mitochondria after mitochondrial import assay (no post-import treatment). Red arrowheads point to immunogold labeled TDP-43. The right panel shows quantification using thin EM sections with 50 nm thickness. n = 14 for WT and 16 for A315T. Data are means ± s.e.m of triplicate experiments. Statistics: one-way analysis of variance (ANOVA) followed by Tukey’s multiple comparison test. *P < 0.05, ***P < 0.001 and ****P < 0.0001. In panel g, *P < 0.05, compared with WT TDP-43.
We then employed a cell-free mitochondrial import assay using Flag-tagged recombinant WT/mutant human TDP-43 protein (rTDP-43) and isolated mouse brain mitochondria. All human rTDP-43 were soluble, uncleaved and unmodified post-translationally (not shown). The widely used biotin-labeled recombinant F1β precursor protein (pF1β) was included as a positive control18, while recombinant GFP was employed as a negative control (not shown). pF1β contained a cleavable signal sequence which was cleaved off after import to generate the shorter mF1β (Fig. 2f). Similar to mF1β, WT rTDP-43 survived digitonin/trypsin co-treatment after import (Fig. 2f), demonstrating the successful import to the innards of IMM. Compared with WT rTDP-43, rTDP-43 bearing G298S, A315T or A382T, demonstrated higher import efficiency (Fig. 2g). Imported WT and mutant rTDP-43 could both be completely digested by trypsin after triton X-100 permeabilization (not shown). Further immuno-EM analysis confirmed the IMM cristae localization of imported WT and mutant rTDP-43 as well as the greater import of disease-associated mutant rTDP-43 compared to WT (Fig. 2h).
TDP-43 mitochondrial localization depends on internal motifs
TDP-43 remains uncleaved after import and no cleavable pre-sequence is identified in TDP-43 by TargetP19 or Mitoprot20, suggesting TDP-43 might use internal signals21. Mitochondrial internal signals are typically composed of a stretch of continuous hydrophobic amino acids22, and six such stretches are present in TDP-43 (Fig. 3a, M1–6). The deletions of M1, M3 or M5 significantly inhibited rTDP-43 import, and reduced mitochondrial localization of exogenously expressed TDP-43 (Fig. 3b,c). Since M1 and M3 segments were conserved across species (Supplementary Fig. 3a), we synthesized two peptides PM1 (YGRKKRRQRRRAQFPGACGL) and PM3 (YGRKKRRQRRRSKGFGFVRF) in which the M1 or M3 motif was fused to a TAT peptide to enhance permeability23. PM1 and PM3, but not control peptides cPMs (mixture of YGRKKRRQRRRAAQGFGCPL and YGRKKRRQRRRGRFFKSFG, scrambled M1 and M3 fused to TAT respectively), suppressed rTDP-43 import, and reduced mitochondrial TDP-43 in HEK293 cells and primary neurons (Fig. 3d–f). The fusion of M3, M5 and especially M1 with the unrelated cytosolic protein GFP (green fluorescent protein) was sufficient to facilitate its mitochondrial targeting (Fig. 3g and Supplementary Fig. 3b).
Figure 3. TDP-43 mitochondrial import depends on TOM-TIM23 complex and internal M1, M3 and M5 motifs.
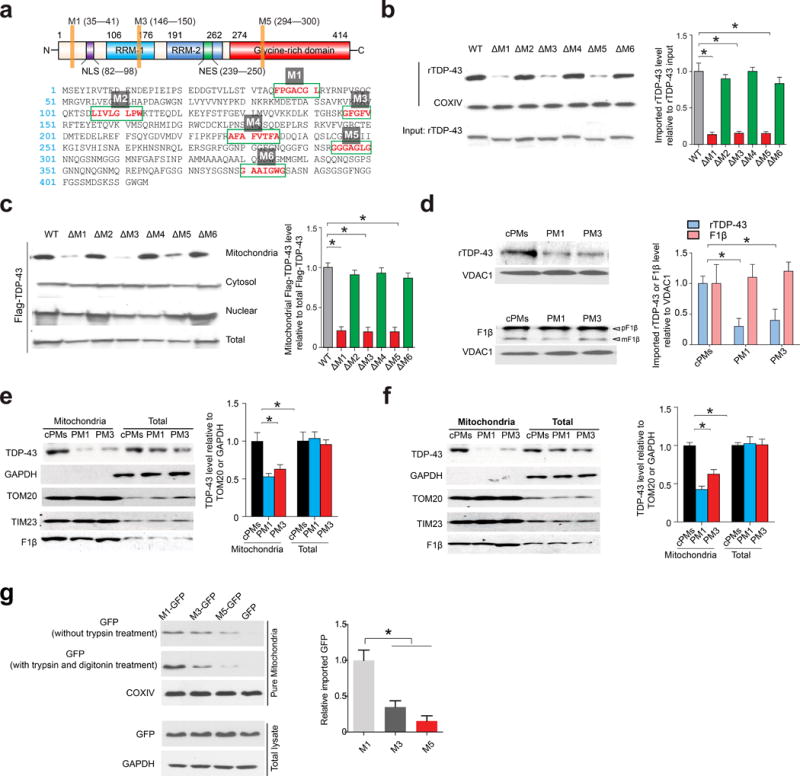
(a) The structure (top panel) and the amino acid sequence (bottom panel) of human TDP-43. RRM1 and RRM2 are RNA recognition motifs. NLS: nuclear localization sequence; NES: nuclear export sequence. (b) Representative immunoblot and quantification (n = 3) of rTDP-43 in mouse brain mitochondria after incubation with indicated rTDP-43 deletions of putative internal targeting signals (ΔM1–6) followed by trypsin and digitonin co-treatment. (c) Representative immunoblot and quantification (n = 3) of TDP-43 in mitochondria from HEK293 cells overexpressing Flag tagged TDP-43 (ΔM1–6) using anti-Flag antibody. (d) Representative immunoblot and quantification (n = 3) of Flag tagged rTDP-43 and pF1β in mitochondria that were pre- or co-treated with 5 μM control peptide (cPM), PM1 or PM3, followed by mitochondrial import assay using rTDP-43 or pF1β incubation. (e,f) Representative immunoblot and quantification (n = 3) of TDP-43 in mitochondria from HEK293 cells (e) or rat primary cortical neurons (12 days in vitro: DIV 12, f) treated with 1 μM cPM, PM1 or PM3 for 24 hours. (g) Representative immunoblot and quantification (n = 3) of GFP in isolated mitochondria from HEK293 cells expressing GFP or M1, M3 and M5-GFP (N-terminus tag). HEK293 cells were collected two days after transient transfection. Quantification is based on samples co-treated with trypsin and digitonin. Data are means ± s.e.m of triplicate experiments. Statistics: one-way analysis of variance (ANOVA) followed by Tukey’s multiple comparison test. *P < 0.05.
Mitochondrial TDP-43 inhibits translation of ND3/6 mRNAs
The IMM residence of TDP-43 prompted us to examine whether TDP-43 bound mitochondria-transcribed mRNAs (Fig. 4a). RNA immunoprecipitation (IP) with or without prior cross-linking using mouse brain mitochondria found that TDP-43, but not the RNA-binding-domain lacking negative control COXIV (not shown), significantly pulled down ND3, ND5, ND6, COXI, COXIII, CYTB and A6 mRNAs, while other mRNAs were only slightly enriched at levels comparable to 12s or 16s rRNAs (Fig. 4b). All mutant versions of TDP-43 precipitated similar mRNAs with comparable abundance as WT TDP-43 (Fig. 4c,d).
Figure 4. TDP-43 preferentially binds mitochondria-transcribed ND3 and ND6 mRNAs and inhibits their translation.
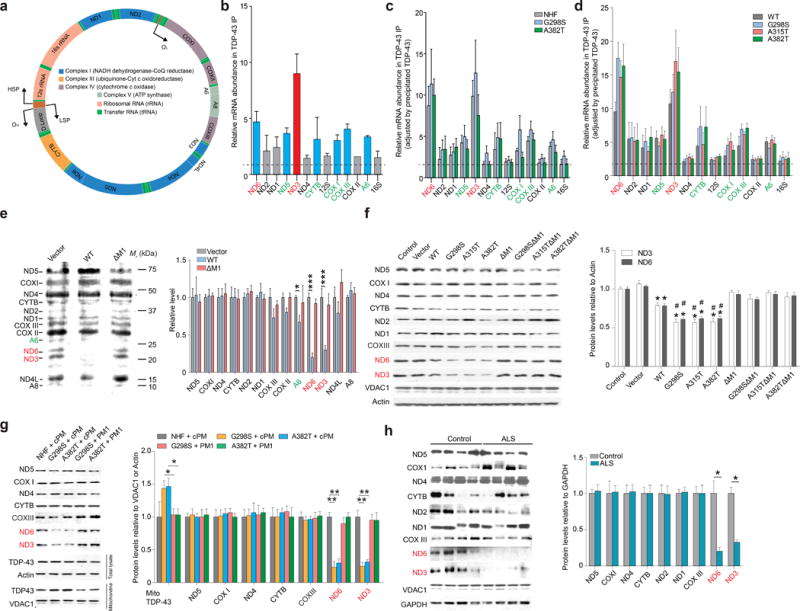
(a) Map of the human mitochondrial genome. The directions of DNA replication or transcription are indicated by arrows. Mitochondrial genome encodes 2 rRNAs, 22 tRNAs and 13 subunits essential for 4 OXPHOS complexes. (b–d) Representative reverse transcriptase-coupled quantitative real time polymerase chain reaction (qRT-PCR) analysis (n = 3) of mitochondrial encoded mRNAs precipitated by TDP-43 or Flag antibody in mitochondria from 3 month old mouse brain (b), human fibroblasts (c) or HEK293 cells overexpressing Flag tagged hTDP-43 (d). (e) Representative immunoblot and quantification (n = 3) of mitochondrial encoded protein translation in HEK293 cells expressing TDP-43 WT or ΔM1. Cells were metabolically labelled with AHA (50 μM) in the presence of emetine (0.1 mg per ml). Following mitochondrial purification, AHA labelled proteins were tagged with biotin-alkyne and finally analyzed by immunoblot using streptavidin conjugates. (f–h) Representative immunoblot and quantification (n = 3) of the expression of mitochondrial encoded proteins in HEK293 cells (f), human fibroblasts treated with 1 μM cPM (scrambled M1) or PM1 for 48 hours (g), and spinal cords from ALS (n = 8) and age-matched normal individuals (n = 6) (h). Data are means ± s.e.m of triplicate experiments. Statistics: one-way analysis of variance (ANOVA) followed by Tukey’s multiple comparison test. *P < 0.05, **P < 0.01 and ***P < 0.001. In panel f, *P < 0.05, compared with control cells and #P < 0.05, compared with cells expressing WT TDP-43.
Mitochondrial-transcribed mRNA levels are not affected by TDP-43 over-expression (Supplementary Fig. 3c). We investigated the effect of TDP-43 on mitochondrial translation in HEK293 cells by the azidohomoalanine (AHA) incorporation assay in the presence of emetine to block cytosolic translation. The synthesis of ND3/6 was significantly reduced by WT TDP-43 overexpression (Fig. 4e), consistent with the preferential binding of TDP-43 to their mRNAs. The steady state levels of ND3/6, but not most mitochondrial-encoded subunits of oxidative phosphorylation (OXPHOS) complexes, were indeed decreased by WT TDP-43 (Fig. 4f). The WT TDP-43-induced reduction in the synthesis or expression of ND3/6 could be blocked by M1 deletion. TDP-43 has no global effect on the translation of all mitochondria-encoded proteins (Fig. 4e, f). TDP-43 expression did not alter the sedimentation patterns of MRPS18B and MRPL44 (mitochondrial ribosome 28S/39S subunit marker) in sucrose gradients of isolated mitochondria, suggesting no effect on overall mitochondrial ribosome assembly (Supplementary Fig. 3d). However, further RNA distribution analysis found that, in contrast to a high degree of sedimentation with 55S ribosomal complex in control cells, additional peaks of ND3/6, but not COXI, mRNA between 28S and 55S complexes could be induced by WT TDP-43, but not ΔM1, overexpression (Supplementary Fig. 3e).
Compared with WT TDP-43, all mutant TDP-43s caused further reductions of ND3/6 expression (Fig. 4f, g). Notably, M1 deletion or treatment with PM1 increased ND3/6 expression to levels similar to control cells or NHFs. PM3 was not tested because of the localization of M3 in the TDP-43 RNA binding motif (Fig. 3a) and the mild toxic effect of PM3 on cells (not shown). Compared with aged matched control human tissues, ALS spinal cords or FTD cortices exhibited reduced expression of ND3/6 (Fig. 4h and Supplementary Fig. 3f).
Mitochondrial TDP-43 impairs OXPHOS complex I
Consistent with the specific inhibitory effect of TDP-43 on the expression of complex I subunits ND3/6, WT TDP-43 overexpression caused a significant reduction of complex I expression and function, as well as a slight disassembly of complex I-comprised supercomplexes. These effects were exacerbated by overexpression of G298S, A315T or A382T mutant TDP-43, but prevented by M1 deletion (Fig. 5a,b and Supplementary Fig. 4a,b). The disassembly and dysfunction of complex I was also observed in G298S or A382T fibroblasts, and PM1 treatment significantly restored complex I assembly and function to levels comparable to NHFs (Fig. 5c,d). Interestingly, TDP-43-induced complex I disassembly and dysfunction could also be alleviated by the simultaneous overexpression of both ND3 and ND6 but not ND3 or ND6 individually (Supplementary Fig. 4c and Fig. 5e).
Figure 5. TDP-43 specifically reduces complex I assembly and impairs mitochondrial function and morphology.
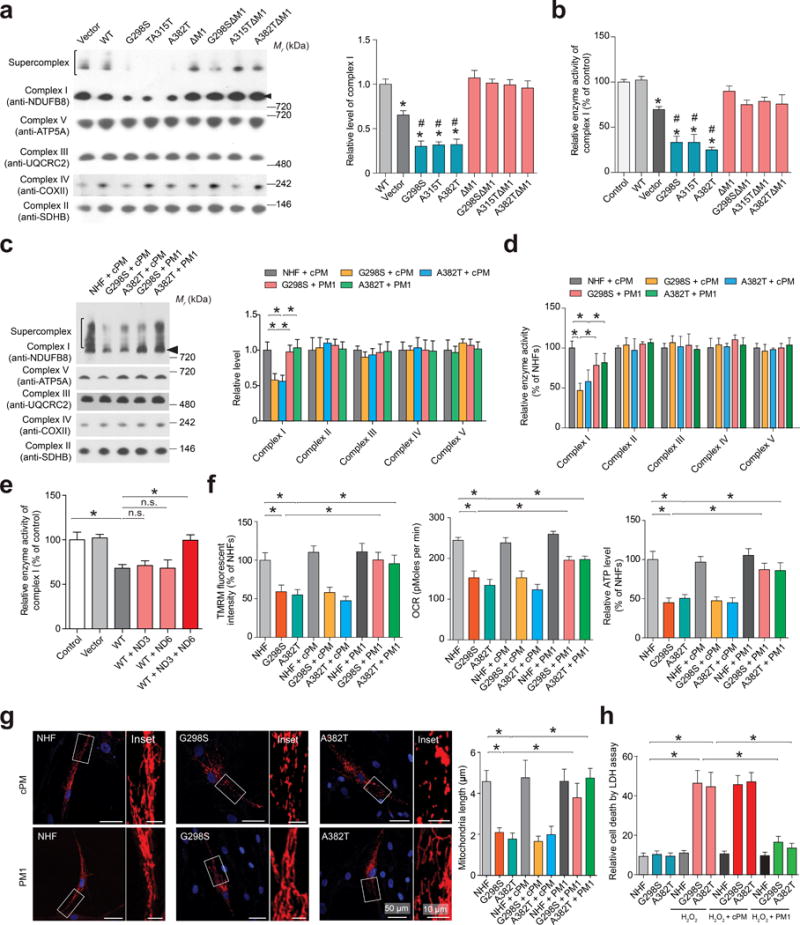
Representative images and quantification (n = 3) of complex I or I–V assembly (a,c) and activities (b,d) in HEK293 cells overexpressing Flag tagged TDP-43 (a,b), and human fibroblasts 48 hours after 1 μM cPM (scrambled M1) or PM1 treatment (c, d). Arrowheads point to complex I. (e) Measurements (n = 3) of OXPHOS complex I activity in mitochondria from HEK293 cells overexpressing Flag tagged WT TDP-43, ND3 and ND6. (f) Measurements (n = 3, normalized by total protein) of mΔψ (by TMRM), ATP production and OCR in human fibroblasts 48 hours after 1μM cPM (scrambled M1) or PM1 treatment. (g) Representative confocal images and quantification (n = 3) of mitochondrial length in human fibroblasts. Fibroblasts were transfected with mitoDsRed2 (a mitochondrial specifically localized red fluorescent protein) to label mitochondria. Nuclei were stained by DAPI. n = 50 cells per group. (f) Measurement (n = 3) of the sensitivity of human fibroblasts to H2O2. Fibroblasts were pre-treated with 1 μM cPM or PM1. 48 hours after pre-treatment, fibroblasts were treated with 50 μM H2O2 for 1 hour and LDH assay performed after 3 hours of recovery. Data are means ± s.e.m of triplicate experiments. Statistics: one-way analysis of variance (ANOVA) followed by Tukey’s multiple comparison test. *P < 0.05. In panel a and b, *P < 0.05, compared with control cells and #P < 0.05, compared with cells expressing WT TDP-43.
Significant mitochondrial dysfunction (including reduced mitochondrial membrane potential (mΔψ), oxygen consumption rate (OCR) and ATP levels) accompanied by mitochondrial fragmentation were all observed in HEK293 cells overexpressing WT or mutant TDP-43 (Supplementary Fig. 4d), and in G298S/A382T fibroblasts (Fig. 5f,g). Compared with WT TDP-43, mutant TDP-43 caused more severe mitochondrial abnormalities. WT or mutant TDP-43-induced mitochondrial dysfunction and fragmentation could be completely prevented by M1 deletion or PM1 treatment. Notably, although no basal cell death was observed, G298S/A382T fibroblasts exhibited increased vulnerability to oxidative stress compared with NHFs, which could also be abolished by PM1 treatment (Fig. 5h).
Mitochondrial localization is critical for TDP-43 toxicity
WT TDP-43 overexpression resulted in mitochondrial fragmentation and dysfunction preceding neuronal death in cultured rat primary neurons, all of which were exacerbated by G298S, A315T or A382T, but completely abolished by M1 deletion or PM1 treatment (Supplementary Fig. 5). We also reprogrammed NHFs and A382T fibroblast to induced-pluripotent stem cells (iPSCs) followed by sequentially differentiation into induced neuronal progenitor cells (iNPCs) and human neurons (control and A382T human neurons, Supplementary Fig. 6a–e). Both control and A382T human neurons were indistinguishable in TDP-43 nuclear localization, neuronal morphology and viability (Supplementary Fig. 6f,g). However, compared with control human neurons, A382T human neurons exhibited significant mitochondrial fragmentation/dysfunction and increased vulnerability to oxidative stress, which could be alleviated by PM1 treatment (Supplementary Fig. 6g–i). As expected, M1 deletion was also sufficient to abolish mitochondrial abnormalities and neuronal death induced by TDP-43 WT or A315T overexpression in control human neurons (Supplementary Fig. 6j).
Neuron-specific bicistronic lentiviruses encoding both TDP-43 and mitoDsRed2 were stereotactically injected into mouse cortices (Fig. 6a). Compared with WT TDP-43, TDP-43 A315T caused further mitochondria fragmentation and increased neuronal death (evidenced by cleaved caspase-3 staining), which could be blocked by M1 deletion (Fig. 6b,c). While neurodegeneration has been consistently reported in TDP-43 A315T hemizygous transgenic mice, but not in TDP-43 WT hemizygous transgenic mice24–28, both exhibited similar human TDP-43 expression (Fig. 2c). We treated TDP-43 A315T mice with PM1 by continuous subcutaneous infusion and confirmed that PM1 reached the central nervous system and substantially reduced mutant TDP-43 in mitochondria (Supplementary Fig. 7a–c). PM1 could be detected in all mitochondrial compartments (Supplementary Fig. 7d). Consistent with the significant protective effect against the reduction in ND3/6 expression, mΔψ/OCR and complex I assembly (Fig. 6d–f), PM1 almost completely prevented the loss of cortical and motor neuron cell bodies, axons and/or synapses (evidenced by denervated neuromuscular junction (NMJ)) in TDP-43 A315T mice (Fig. 6g,h and Supplementary Fig. 7e,f). Interestingly, mitochondrial fragmentation and neuropathologies such as phospho-TDP-43 positive inclusions and astrogliosis in TDP-43 A315T mice disappeared after PM1 infusion (Supplementary Fig. 7g–j). Remarkably, skeletal muscle atrophy and phenotypes (including gait abnormality, impaired performance on rotarod and movement defects) noted in TDP-43 A315T mice, could also be alleviated by PM1 and restored to levels comparable to non-transgenic WT mice (Fig. 6i,j, Supplementary Fig. 8 and Supplementary Movie 1–3). Of note, the deletion of M1 has no effect on TDP-43 half-life, dimerization or its binding to non-mitochondrial mRNA targets (Supplementary Fig. 9a–d).
Figure 6. Suppression of TDP-43 mitochondrial localization abolishes TDP-43 neurotoxicity.
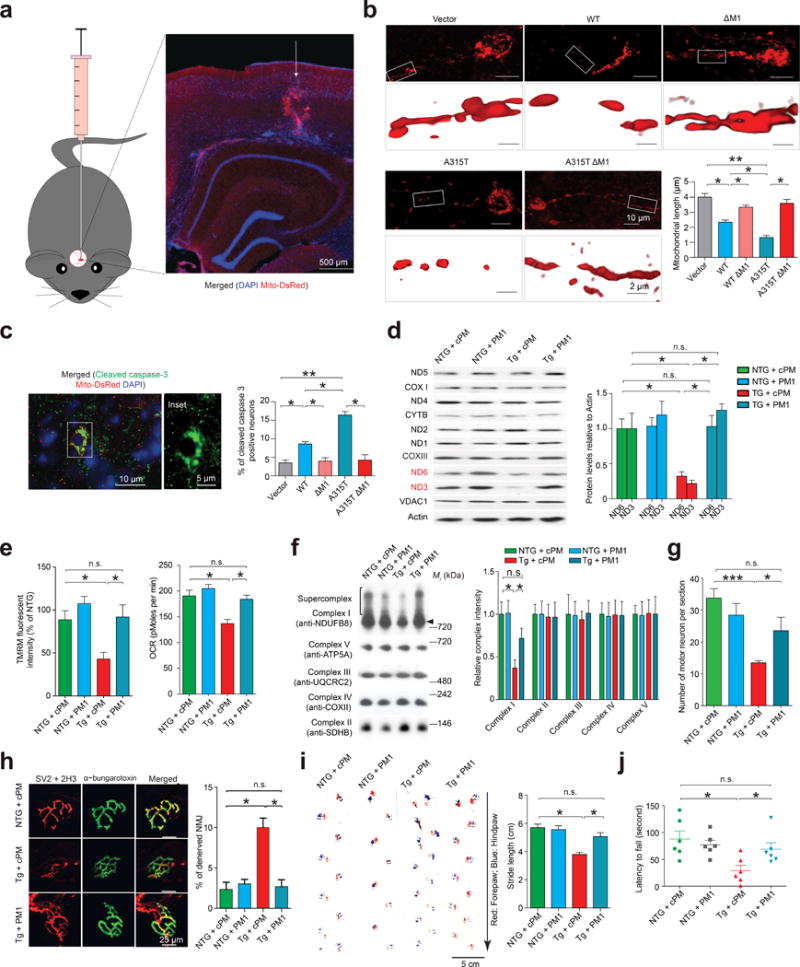
(a) Schematic and representative image showing 3 months old mice injected with bicistronic lentivirus encoding both TDP-43 and mitoDsRed2 into the motor cortex. Arrow points the injection site. (b) Representative 2D (upper) and 3D (lower, enlargements) images and quantification (n = 3) of mitochondrial length. n = 45, 50, 40, 33 and 35 neurons for vector, WT, WT ΔM1, A315T and A315T ΔM1 expressing neurons respectively from 6 mice (3-month-old, equal male and female) per group. (c) Representative immunostaining and quantification of cleaved caspase 3 positive neurons. n = 35, 37, 33, 33 and 32 neurons for vector, WT, WT ΔM1, A315T and A315T ΔM1 respectively. (d) ND3 and ND6 expression in spinal cords of 70 day old male non-transgenic (NTG) and TDP-43 A315T transgenic mice (n = 6 mice per group). (e,f) OCR and mΔψ (e) and OXPHOS complex assembly (f) in synaptic mitochondria in 70 day old male mice (n = 4 mice per group). Motor neuron counts in lumbar spinal cords (g), NMJs in gastrocnemius muscles (h, SV2: synaptic vesicle protein 2; 2H3: neurofilament), footprints (i, arrow points the walking direction) and rotarod performance (j) of 70 day old male mice (n = 6 mice per group). For d–j, treatments began from 60 day old. Data are means ± s.e.m of triplicate experiments. Statistics: one-way analysis of variance (ANOVA) followed by Tukey’s multiple comparison test. *P < 0.05, **P < 0.01 and ***P < 0.001.
Discussion
Consistent with a previous ultrastructural study29, here we show that some TDP-43 accumulates in mitochondria in ALS/FTD. TDP-43 aggregation, cleavage, ubiquitination and phosphorylation were reported in ALS/FTD9,30. Despite being highly phosphorylated, mitochondrial TDP-43 is soluble and uncleaved (Supplementary Fig. 9e–g). Phospho-TDP-43-positive inclusions highly co-localize with mitochondria, ubiquitin-positive inclusions or compact/skein-like TDP-43 inclusions partially overlap, and mitochondrial co-localized TDP-43 shows little ubiquitination (Supplementary Fig. 9h,i). Since TDP-43 pre-inclusions are reportedly highly phosphorylated but not ubiquitinated29,31, mitochondria associated TDP-43 likely represents this pre-inclusion population of pathologic TDP-43. G298S is present in the M5 motif, and compared with G298S, phosphorylation-mimicking mutant G298D causes further increase of mitochondrial localization, whereas phosphorylation-ablation mutant G298A exhibited similar mitochondrial localization as WT TDP-43 (Supplementary Fig. 9j). It is worth investigating whether other disease-associated TDP-43 mutations residing within/out of mitochondrial internal motifs also increase its mitochondrial localization through phosphorylation.
Similar to ALS/FTD neurons, cultured neurons expressing mutant TDP-43 exhibited TDP-43 mis-localization and formation of puncta in cell bodies and neurites co-localized with mitochondria (Supplementary Fig. 10a–d). Both were abolished by M1 deletion or PM1 treatment, suggesting mitochondrial TDP-43 as a possible upstream regulator of TDP-43 mislocalization. However, as TDP-43 deficiency alone is sufficient to cause neuronal loss32,33, the contribution of TDP-43 nuclear depletion to mitochondrial TDP-43 accumulation could not be ruled out. TDP-43 with inactivated nuclear localization signal significantly co-localizes with mitochondria (Supplementary Fig. 10e), indicating mitochondrial localization as an intrinsic property of cytoplasmic TDP-43. TDP-43 binds mitochondria-transcribed mRNA and regulates mitochondrial translation. Mitochondrial translation machinery resides in immediate proximity to matrix-facing IMM34. Therefore, the matrix-facing IMM localization of TDP-43 supports its functional role inside mitochondria. IMM proteins with internal sequences are imported across OMM through TOM complex via TOM70 and across IMM by TIM22 complex22. As expected, TIM22, but not TIM23, co-precipitated TDP-43, and knockdown of TIM22, but not TIM23, significantly reduced TDP-43 mitochondrial localization (Supplementary Fig. 10f,g). These results, together with the finding that both TOM20 and TOM70 co-precipitated TDP-43, indicate TDP-43 mitochondrial import depends on TOM/TIM22 complex. TDP-43 import depends on Δψ (Supplementary Fig. 10h). Considering molecular chaperones are usually needed to unfold protein before and during import22, perhaps the final localization of TDP-43 in mitochondria depends on multiple factors including but not limited to TOM/TIM22 complexes, Δψ and chaperones.
Recombinant TDP-43 could bind ND3 probe, with diminished efficiency when all G/U(s) in UG-repeats are mutated to A(s) (Supplementary Fig. 10i), suggesting previously identified UG-repeats35–38 as potential binding sites. TDP-43 mainly pulls down ND3/6 mRNAs and inhibits their translation. It can be expected that increased mitochondrial TDP-43 specifically causes complex I disassembly and dysfunction. Interestingly, mitochondrial TDP-43 impairs the mitochondrial ribosomes loading onto ND3/6 mRNAs, suggesting one possible mechanism by which TDP-43 regulates mitochondrial translation. The co-expression of both ND3/6 was sufficient to alleviate TDP-43-induced complex I disassembly and dysfunction, supporting ND3/6 as specific targets of TDP-43 in mitochondria. Indeed, mutations in ND3/6 are directly associated with neurological disorders and cause complex I deficiency39,40. Since assembly of respiratory complexes and mitochondrial dynamic are highly interrelated41,42 it is feasible that, in addition to regulating mitochondrial bioenergetics, TDP-43 could affect both mitochondrial morphology and movement43–46. TDP-43-induced mitochondrial fragmentation or trafficking deficit could be abolished by inhibiting its mitochondrial localization (Supplementary Fig. 11a–c), suggesting them as downstream effects. Mitochondrial trafficking deficit induced by TDP-43 could be alleviated by the inhibition of mitochondrial fragmentation46, indicating the impairment of mitochondrial movement possibly even downstream of mitochondrial fragmentation.
The physiological function of TDP-43 is still unclear. Either knockdown of TDP-43 or reduced mitochondrial TDP-43 by PM1 increases ND3/6 expression, but has no effect on other complex I subunits or complex I assembly (Supplementary Fig. 11d,e). Disease-associated mutations in TDP-43 do not change its IMM localization and binding efficiency to ND3/6 mRNAs. The toxicity of WT/mutant TDP-43 on mitochondria and neurons is likely due to excess mitochondrial TDP-43, which may explain why PM1 treatment, which reduced but did not completely abolish mitochondrial TDP-43, restored mitochondrial and neuronal function in A315T mice to levels comparable to NTG mice.
Mitochondrial dysfunction precedes TDP-43-induced neuronal death, and mitochondria are involved in almost all types of cell death including apoptosis and necrosis47,48. In cultured rat primary neurons overexpressing TDP-43, we found fewer cleaved caspase 3 positive neurons than SYTOX green positive neurons, suggesting possibly different types of neuronal death caused by TDP-43. Therefore, it is of further interest to investigate the potential role of mitochondrial dysfunction mediating TDP-43-induced neuronal death by apoptotic and non-apoptotic mechanisms. Unlike rat primary neurons, human neurons derived from A382T fibroblasts exhibit normal neuronal viability. Considering age or age-associated phenotypes is usually lost after fibroblast reprogramming49,50, it is possible that the level of mitochondrial TDP-43 in young iPSCs derived human neurons bearing A382T mutation is insufficient to reach the threshold to cause neuronal death, and age-dependent mitochondrial TDP-43 accumulation is required for mutant TDP-43 neuronal toxicity.
In sum, here we present a novel mechanism of TDP-43 toxicity wherein TDP-43 resides in mitochondria specifically impairing OXPHOS complex I via preferentially binding mitochondrial-transcribed ND3/6 mRNAs and inhibiting their translation to cause mitochondrial dysfunction and neurodegeneration (Supplementary Fig. 12). Notably, suppression of TDP-43 mitochondrial localization abolishes the toxicity of WT/mutant TDP-43 on mitochondria and neurons, thus providing the rationale for targeting TDP-43 mitochondrial localization as a new therapeutic approach for neurodegeneration linked to TDP-43.
Materials and Methods
Immunocytochemistry and immunofluorescence of mouse and human spinal cord
The use of all human tissue samples was approved by the University Hospitals Institutional Review Board (IRB) for human investigation at University Hospitals Case Medical Center at Cleveland. Human spinal cord tissues obtained postmortemly from University Hospitals of Cleveland were fixed and 6 μm-thick consecutive sections prepared as we described before51 (Table 1). Immunocytochemistry was performed by the peroxidase anti-peroxidase protocol51. For immunofluorescent staining, deparaffinized and re-hydrated tissue sections were washed briefly three times with distilled H2O and placed in 1X antigen decloaker (Biocare, Concord, CA). The sections were then subject to antigen retrieval under pressure using Biocare’s Decloaking Chamber by heating to125 °C for 10 sec and cooling to 90 °C for 30 sec followed by heating to 22 psi at 128 °C, and cooling to 0 psi at 94 °C. After temperature decreased to 30 °C, the sections were gradually rinsed with distilled H2O for five times. The sections were then blocked with 10% normal goat serum (NGS) for 30 min at RT, and incubated with primary antibodies in PBS containing 1% NGS overnight at 4 °C. After 3 washes with PBS, the sections were incubated in 10% NGS for 10min, and then with Alexa Fluor conjugated secondary antibody (Life Technologies, Grand Island, NY) (1:300) for 2 hours at RT in dark. Finally, the sections were rinsed three times with PBS, stained with DAPI, washed again with PBS for three times, and mounted with Fluoromount-G mounting medium (Southern Biotech, Birmingham, AL).
Table 1.
Information of fixed and frozen brain and spinal cord tissues.
| Paraffin sections for immunocytochemistry and immunofluorescence | |||||
|---|---|---|---|---|---|
| Diagnosis | Age (years) | TDP-43 pathology | Diagnosis | Age (years) | TDP-43 pathology |
| ALS | N/A | Yes | FTD | 74 | Yes |
| ALS | N/A | Yes | FTD | 78 | Yes |
| ALS | 80 | Yes | FTD | 79 | Yes |
| ALS | N/A | Yes | FTD | 88 | Yes |
| ALS | 49 | Yes | Control | 70 | None |
| ALS | N/A | Yes | Control | 74 | None |
| Control | 52 | None | Control | 81 | None |
| Control | 64 | None | |||
| Control | 63 | None | |||
| Control | 38 | None | |||
| Control | 55 | None | |||
| Frozen tissue samples for biochemical analysis | ||||||||
|---|---|---|---|---|---|---|---|---|
| UMB# | Diagnosis | Age (years) | Sex | PMI (hours) | Diagnosis | Age (years) | Sex | PMI (hours) |
| 4627 | ALS | 41 | M | 21 | FTD | 81 | M | 12 |
| 4768 | ALS | 45 | M | 19 | FTD | 62 | F | 12 |
| 4528 | ALS | 49 | M | 9 | FTD | 59 | M | 12 |
| 4762 | ALS | 59 | M | 6 | FTD | 77 | M | 4 |
| 5004 | ALS | 61 | F | 22 | FTD | 76 | F | 4 |
| 5388 | ALS | 61 | M | 8 | FTD | 98 | F | 23 |
| 4871 | ALS | 70 | M | 14 | FTD | 63 | F | 11 |
| 4872 | ALS | 71 | F | 6 | Control | 77 | M | 23 |
| 145 | Control | 48 | M | 21 | Control | 86 | F | 13 |
| 5399 | Control | 50 | M | 17 | Control | 78 | M | 5 |
| 1471 | Control | 55 | M | 24 | Control | 89 | F | 5 |
| 840 | Control | 58 | M | 18 | Control | 74 | F | 6 |
| 946 | Control | 69 | M | 12 | Control | 68 | F | 1 |
| 5572 | Control | 70 | F | 24 | ||||
Note: all ALS and FTD cases used are sporadic and no known genetic mutation in any gene is noted.
Expression vectors, recombinant proteins, peptides, antibodies and chemicals
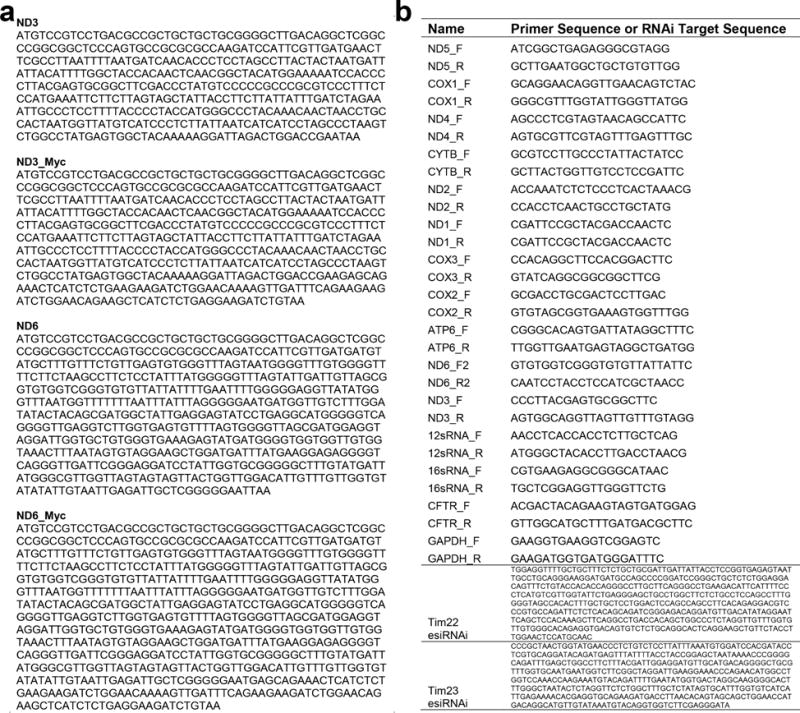
MitoDsRed2 (Clontech, Mountain View, CA) and lentiviral packing plasmids (PCMV-dR8.2 and PCMV-VSVG from Addgene, Cambridge, MA) were obtained. Flag tagged TDP-43 constructs were generated by cloning TDP-43 into PCMV-3Tag-1a (Agilent, Santa Clara, CA) or pCMVTnT (Promega, Madison, WI). GFP fused with M1/3/5 constructs were generated based on PCMV-3Tag-9a (Agilent, Santa Clara, CA). TDP-43 mutations were all generated using QuikChange Lightning Site-Directed Mutagenesis Kit (Agilent, Santa Clara, CA). MitoDsRed2/TDP-43 bicistronic lentiviral constructs were generated by cloning TDP-43 and mitoDsRed2 into pLVX-Puro (Clontech) and replacing PCMV promotor with mouse synapsin 1 promoter. ND3 or ND6 gene in nuclear format with the addition of mitochondrial targeting sequence from subunit VIII of human cytochrome c oxidase to the 5′-terminus (and the addition of myc tag to the 3′-terminus) were directly synthesized and subcloned into pcDNA3.1(+) (GenScript) (Table 2). Primers used for RT-PCR/Realtime-PCR (Life Technologies, Grand Island, NY) and RNAi oligonucleotides (Sigma St. Louis, MO; Tim22 esiRNAi: EHU160361-20UG and TIM23 esiRNAi: EHU106141-20UG) were obtained (Table 2). His tagged recombinant human TDP-43 was obtained from ATGEN (Gyeonggi-do, South Korea) and Flag tagged recombinant human TDP-43 were synthesized in rabbit reticulocyte system by coupled transcription/translation with biotin-lysyl-tRNA using pCMVTnT constructs (Promega, Madison, WI). cPM, PM1 and PM3 peptides (with/without FITC labeling) in which M1 or M3 motif or scrambled M1 or M3 motif fused to the C-terminus of the protein transduction domain (YGRKKRRQRRR) of the human immunodeficiency virus TAT protein to enhance peptide delivery/permeability as described23 were obtained from NeoBiolab (Woburn, MA) or Biomatik (Wilmington, DE). Primary antibodies used in this study are listed in Table 3. All chemicals were obtained (Sigma St. Louis, MO).
Table 2. Sequences of nuclear format ND3/6 and primers.
(a) Sequences of ND3 and ND6 in nuclear format with N-terminal mitochondrial targeting sequence and/or C-terminal myc tag. (b) Primers used for mitochondrial encodes RNAs, CFTR assay and Tim22/23 RNAi. esiRNAi: endoribonuclease-pepared siRNAs.
|
Table 3.
Antibodies used in this study.
| Antibody | Application | Host | Source | Catalogue# |
|---|---|---|---|---|
| 58K-9 | IF | Mouse monoclonal | Abcam | ab27043 |
| ATP5A | WB | Mouse monoclonal | Abcam | ab14748 |
| Calnexin | WB/IF | Rabbit monoclonal | Cell Signaling | 2679 |
| Calreticulin | IF | Rabbit monoclonal | Cell Signaling | 12238 |
| Cleaved caspase3 | WB/IF/IHC | Rabbit monoclonal | Cell Signaling | 9664 |
| COX I | WB | Mouse monoclonal | Abcam | ab14705 |
| COX II | WB | Mouse monoclonal | Abcam | ab110258 |
| COX III | WB | Rabbit polyclonal | Sigma | HPA042788 |
| COX IV | WB/IF | Mouse monoclonal | Cell Signaling | 11967 |
| COX IV | WB/IF | Rabbit monoclonal | Cell Signaling | 4850 |
| Cytochrome b | WB | Rabbit polyclonal | Santa Cruz | SC-11436 |
| Cytochrome c | WB/IF | Mouse monoclonal | BD Biosciences | 556432 |
| F1β/ATP5B | WB | Mouse monoclonal | Abcam | ab14730 |
| Flag | WB/IF/IHC | Mouse monoclonal | Sigma | F1804 |
| GAPDH | WB | Rabbit monoclonal | Cell Signaling | 2118 |
| GFAP | IHC | Rabbit polyclonal | Invitrogen | 18-0063 |
| GFP | WB | Mouse monoclonal | Santa Cruz | sc-9996 |
| HDAC1 | WB | Mouse monoclonal | Cell Signaling | 5356 |
| HSP60 | WB | Mouse monoclonal | ProteinTech | 66041-1-Ig |
| LAMP2 | IF | Rat monoclonal | Abcam | ab25339 |
| LC3 | IF | Rabbit monoclonal | Cell Signaling | 12741 |
| MFN2 | WB | Mouse monoclonal | Santa Cruz | sc-100560 |
| MFF | WB | Rabbit polyclonal | Abcam | ab81127 |
| MRPL44 | WB | Rabbit polyclonal | ProteinTech | 16394-1-AP |
| MRPS18B | WB | Rabbit polyclonal | ProteinTech | 15543-1-AP |
| Nanog | IF | Rabbit polyclonal | Abcam | ab21624 |
| ND1 | WB | Rabbit monoclonal | Abcam | ab181848 |
| ND2 | WB | Rabbit polyclonal | Proteintech | 19704-1-AP |
| ND3 | WB | Rabbit polyclonal | Abcam | ab170681 |
| ND4 | WB | Mouse polyclonal | Abnova | H00004538-A01 |
| ND4L | WB | Rabbit Polyclonal | LSBio | LS-C158368 |
| ND5 | WB | Rabbit polyclonal | Abcam | ab92624 |
| ND6 | WB | Rabbit polyclonal | Santa Cruz | SC-20667 |
| NDUFB8 | WB | Mouse monoclonal | Abcam | ab110242 |
| OPA1 | WB | Mouse monoclonal | BD Biosciences | 612606 |
| PEX19 | IF | Rabbit monoclonal | Abcam | ab137072 |
| RAB5 | IF | Rabbit monoclonal | Cell Signaling | 3547 |
| SDHB | WB | Mouse monoclonal | Abcam | ab14714 |
| SSEA3 | IF | Rat monoclonal | eBioscience | 53-8833-71 |
| SSEA4 | IF | Mouse monoclonal | BD Biosciences | 560219 |
| TRA-1-81 | IF | Mouse monoclonal | Millipore | MAB4381 |
| TAT | WB/IF/IHC | Mouse monoclonal | Abcam | ab63957 |
| TDP-43 | WB/IF/IHC | Rabbit polyclonal | ProteinTech | 10782-2-AP |
| TDP-43 | WB/IF/IHC | Rabbit polyclonal | ProteinTech | 12892-1-AP |
| TDP-43 | WB/IF/IHC | Mouse monoclonal | ProteinTech | 60019-2-Ig |
| TDP-43 | WB | Mouse monoclonal | Abnova | H00023435-M01 |
| TDP-43 p409/410 | WB/IF/IHC | Polyclonal antibody | ProteinTech | 22309-1-AP |
| TIM22 | WB | Rabbit polyclonal | ProteinTech | 14927-1-AP |
| TIM23 | WB | Mouse monoclonal | BD Biosciences | 611222 |
| TOM20 | WB/IF | Mouse monoclonal | BD Biosciences | 612278 |
| TOM70 | WB | Rabbit polyclonal | ProteinTech | 14528-1-AP |
| Ubiquitin | IF | Mouse monoclonal | Abcam | ab7254 |
| UQCRC2 | WB | Mouse monoclonal | Abcam | ab14745 |
| VDAC1 | WB/IF | Mouse monoclonal | Abcam | ab14734 |
WB: western blot; IF: Immunofluorescence; IHC: Immunohistochemistry.
Embryonic primary cortical neuron, HEK293 cells and primary human fibroblasts culture and transfection
Primary cortical neurons were isolated from E18 Sprague Dawley rats (Harlan, Indianapolis, IN) as previously described52 with modifications. Taken briefly, rat brains were dissected out in HBSS (Life Technologies, Grand Island, NY) and stored in Hibernate E (BrainBits, Springfield, IL) supplemented with 2% B27 (Life Technologies, Grand Island, NY). Under a dissecting microscope, the meninges were removed completely with fine forceps and cortices were dissected out. Cortices were then digested in 0.25% trypsin for 15 min at room temperature (RT) followed by brief incubation in Opti-MEM (Life Technologies, Grand Island, NY) supplemented with 10% FBS and 50 units per ml DNAse I (Worthington-biochem, Lakewood Township, NJ). Digested cortices were further dissociated by gentle trituration with pipette until the cell suspension was homogenous and no large pieces of tissue remain visible. Cortical neurons were finally collected and seeded on poly-L-lysine/laminin coated coverslips/chamber slides (BD, Franklin Lakes, NJ), 35 mm dishes or 24 well plates and cultured as we described before46. HEK-293T cells from American Type Culture Collection (ATCC, Manassas, VA) were grown in DMEM medium (Life Technologies, Grand Island, NY), supplemented with 10% fetal bovine serum and 1% penicillin–streptomycin, in 5% CO2 in a humid incubator at 37 °C. Primary human fibroblasts from 4 age-matched normal subjects and 2 ALS patients bearing TDP-43 mutations (only 2 lines are available) were obtained from Coriell Institute for Medical Research (NINDS collection). Primary fibroblasts were grown in minimum essential medium (Life Technologies) containing non-essential amino acids and 2 mM glutamine, supplemented with 10% or 15% (v/v) fetal bovine serum, in 5% CO2 in a humid incubator at 37 °C as we described before53. HEK293 cells and primary human fibroblasts were tested free of mycoplasma contamination. Neurons were all transfected by NeuroMag (OZ Biosciences, San Diego, CA), while HEK293T cells and primary fibroblasts were transfected with lipofectamine 2000 (Life Technologies, Grand Island, NY) according to manufacturer’s protocol. For co-transfection, a 3:1 ratio (mitoDsRed2/TDP-43:GFP) was applied.
Generation of iPSCs using human fibroblasts and differentiation of iPSCs to human neurons
For reprogramming and differentiation, two lines of NHFs and TDP-43 G298S or A382T human fibroblasts were cultured in DMEM supplemented with 10% FBS (Life Technologies) and GlutaMAX (Life Technologies). Fibroblasts were reprogrammed using CytoTune-iPS 2.0 Sendai Reprogramming Kit (Life Technologies) according to manufacturer’s instruction using irradiated MEFs (iMEF) as feeder cells. iPSCs were routinely cultured on iMEFs in hESC medium (DMEM/F12 with GlutaMAX (Life Technologies), 10% KnockOut Serum Replacement (Life Technologies), 0.1 mM 2-mercaptoethanol (Life Technologies), 1 × non-essential amino acids (Life Technologies), and 10 ng/ml bFGF (Sigma). For differentiation, iPSCs were adapted and cultured in a feeder free conditions on matrigel in TeSR1 E8 medium (Stem Cell Technologies) and differentiated into induced neuronal progenitor cells (iNPCs) using StemDiff Neural Induction Medium and AggreWell 800 (both from Stem Cell Technologies) according to instructions. iNPCs were selected using Neural Rosette Selection Medium and further expanded using neural progenitor medium (both from Stem Cell Technologies). For characterization of iPSCs and iNPCs, immunofluorescence staining was carried out as previously described54 using antibodies against TRA-1-81, Nanog, SSEA3 and SSEA4. For alkaline phosphatase (AP) staining, Alkaline Phosphatase Staining Kit II (Stemgent) was used. iNPCs were differentiated into human neurons using Axol iNPCs differentiation and maturation kits (Axol, Cambridgeshire, United Kingdom) following manufacturer’s protocol. Taken briefly, iNPCs cells were first seeded on 24 or 48 well plates or 24 well seahorse plates coated with Axol SureBondXF in Axol Plating-XF medium. 24 hours after plating, cells were transferred into neuronal differentiation medium (Axol Neuronal Differentiation-XF medium). After 72 hours, half of neuronal differentiation medium was replaced with neuronal maturation medium (Axol Neuronal Maintenance-XF medium) followed by half neuronal maturation medium change every four days. iPSCs and iNPCs used in the study were tested free of mycoplasma contamination. iPSCs derived neurons were also transfected by NeuroMag (OZ Biosciences, San Diego, CA).
Cellular and mitochondrial fractionation
Mitochondria were isolated as described before46. Taken briefly, cells were homogenized in IB-1 solution (IB-1: 225 mM mannitol, 75 mM sucrose, 0.1 mM EGTA, 20 mM HEPES; pH = 7.4), while tissues were homogenized in IB-1 with 0.5% BSA. The total homogenate (H) was centrifuged at 600 g for two times at 4 °C for 5 min. Subsequently, the supernatant (S1) was collected and centrifuged at 7,000 g at 4 °C for 10 min to obtain enriched mitochondrial fraction and the supernatant (S2) was collected. The enriched mitochondrial fraction was washed in IB-2 solution (225 mM mannitol, 75 mM sucrose, 20 mM HEPES; pH = 7.4) for cell mitochondria and IB-2 containing 0.5% BSA for tissue mitochondria followed by centrifugation at 9,000g for 10 min. The pellets were suspended in MRB buffer (250 mM Mannitol, 0.5 mM EGTA, 5 mM HEPES; pH 7.4) to obtain crude mitochondrial fraction (cM). The crude mitochondrial fraction was further overlaid on top of 8 ml Percoll medium (225 mM mannitol, 25 mM HEPES, 1 mM EGTA and 30% Percoll (vol/vol); pH = 7.4) and subjected to centrifugation at 95,000 g for 30 min at 4 °C in a SW40 Ti rotor. The pellet was suspended in MRB buffer again followed by centrifugation at 6,300 g for 10 min at 4 °C to obtained purified mitochondria (pM). Nuclear fraction was isolated/purified by nuclear extraction reagents (Thermo scientific, Waltham, MA).
For sub-mitochondrial compartment fractionation, isolated pure mitochondria were suspended in isolation medium (225 mM mannitol, 75 mM sucrose, 0.1 mM EGTA, 20 mM HEPES; pH = 7.4) with digitonin at 0.12 mg digitonin/mg mitochondria and stirring gently on ice for 15 min. Then digitonin treated samples were diluted with 3 volume of isolation medium and centrifuged at 9,000 g for 10 min to get supernatant A followed by pellet resuspension in isolation buffer and sonicated for 30 seconds on ice. Then the solution was sonicated and centrifuged at 6,500 g for 10 min followed by centrifugation at 144,000 g for 60 min to sediment the inner membrane vesicles and the supernatant was collected as matrix fraction. Supernatant A was centrifuged at 144,000 g for 60 min to sediment outer membrane vesicles as pellets and the supernatant was collected as inner membrane space fraction.
Synaptosome isolation
Synaptosomes were isolated from mouse cortices or spinal cords as described55. Taken briefly, fresh cortex tissue was homogenized in ice cold ‘Sucrose Medium’ (320 mM sucrose, 1 mM EDTA, 0.25 mM dithiothreitol, pH = 7.4 followed by centrifugation at 1,000 g for 10 min at 4 °C. The supernatant was collected and carefully layered on top of a discontinuous Percoll gradient (3 ml layers of 3, 10, and 23% Percoll in sucrose medium) in a 15 mL centrifuge tube followed by centrifugation at 32,500 g for 10 min at 4 °C in a SW-40Ti rotor. The band between 10% and 23% Percoll was collected and diluted into ionic medium (20 mM HEPES, 10 mM D-glucose, 1.2 mM Na2HPO4, 1 mM MgCl2, 5 mM NaHCO3, 5 mM KCl, 140 mM NaCl, pH = 7.4) followed by centrifugation at 15,000 g for 15 min at 4 °C to remove Percoll. The pellets, i.e. synaptosome fractions, were collected and resuspended in ionic media again and seeded on polyethyleneimine coated plates by centrifugation at 3,000 g at 4 °C for 30 min. The purity of synaptosome was confirmed by immunoblot of synaptic makers or EM (data not shown).
Mitochondrial function and cell viability measurement
The mΔψ in HEK293 cells, human fibroblasts, primary neurons or synaptic mitochondria was determined by tetramethylrhodamine (TMRM) and/or rhodamine 123 (rhod123) as we described before56. Taken briefly, HEK293 cells, human fibroblasts, primary neurons cultured in in 35mm dishes or 24 well plates, or isolated synaptosomes attached to 24 well plates pre-coated with polyethyleneimine as described55 (1:15000 dilution from a 50% solution, Sigma) were incubated with 20 nM TMRM or 2 μM rhod123 in PBS (Phosphate-Buffered Saline pH 7.4, Life Technologies, Grand Island, NY; for HEK293 cells and human fibroblasts), HEPES-buffered Tyrode’s solution (119 mM NaCl, 5 mM KCl, 6 g/liter D-glucose, 2 mM CaCl2, 2 mM MgCl2, and 25 mM HEPES; pH = 7.4; for primary neurons) or ionic medium (for synaptic mitochondria) for 30 min. The TMRM/rhod123 containing solution was removed. After three times wash with PBS, Tyrode’s or ionic medium, cells/neurons/synaptosome were incubated in PBS or Tyrode’s solution at 37 °C in room air for 10 min to allow the stead of TMRM/rhod123 signal before imaging by fluorescence microscope. ATP levels were measured by the ATP Colorimetric/Fluorometric Assay Kit (Biovision, Milpitas, CA) using cell or neuronal lysate as described before56. The real-time measurement of oxygen consumption rate (OCR) in live cultured HEK293 cells, human fibroblasts and neurons with optimal seeding density as indicated or synaptic mitochondria in synaptosomes was performed using the Seahorse XF24 Analyzer (Seahorse Bioscience, North Billerica, MA) according to the user’s instruction. If needed, ATP synthase inhibitor oligomycin (1 μM), uncoupler FCCP (4 μM) and complex I inhibitors antimycin A (1 μM) and rotenone (1 μM) were injected sequentially. After measurement, cells and synaptosomes were lysed and OCR data was normalized by total protein. Cell death and viability was measured by Cytotoxicity Detection Kit (LDH; Roche, Nutley, NJ), immunofluorescent staining using a specific antibody against cleaved caspase 3 staining or SYTOX green assay (Life Technologies, Grand Island, NY). For SYTOX green dead neuron staining, neurons were incubated in PBS containing 30 nM SYTOX green for 20 minutes at room temperature followed by three times wash with PBS. Neurons with SYTOX green-positive nuclei and/or obvious fragmented nuclear/neurites were counted as non-viable neurons, whereas neurons without SYTOX green-positive nuclei and clear nuclear contour/neurites were counted as viable neurons.
Mitochondria import assay
Mitochondria were isolated from mouse brain, while mitoplasts were prepared by incubating isolated mitochondria with digitonin (0.1 mg per 1 mg of mitochondrial protein) on ice for 15 min followed by centrifugation at 11,000 g for 10 min. The import buffer used was composed of 250 mM sucrose, 10 mM MOPS-KOH, pH 7.2, 80 mM KCl, 5 mM MgCl2, 2 mM ATP, 2 mM NADH, 3% BSA. The import assays were carried out by incubating mitochondria or mitoplasts with indicated recombinant proteins at RT for 45 min. The import reactions were stopped by adding valinomycin (1 μM). Equal volume of import reactions were treated by 0.25% trypsin or 0.25% trypsin and digitonin (5 mg per 10 mg mitochondria) as needed at RT for 5 min followed by centrifugation at 11,000 g for 10 min. At last, the mitochondria or mitoplasts pellets were resuspended in cell lysis buffer (Cell signaling, Danvers, MA) supplemented with protease inhibitor cocktail (Roche, Nutley, NJ) and phenylmethylsulfonyl fluoride (PMSF, Sigma, St. Louis, MO). Mitochondrial proteins need to be unfolded during import22, suggesting the existence of chaperones in reticulocyte lysates facilitating rTDP-43 import in vitro. Although rTDP-43 import could be increased by urea-denaturation (data not shown), recombinant proteins generated in reticulocyte lysates also demonstrated efficient import in vitro. Therefore, in this study, we used recombinant proteins without denaturation.
Measurements of activities of respiratory chain complex I to V
Enzyme activity of complex I-IV was measured as described57. Taken briefly, after three cycles of freeze and thaw, isolated mitochondria were resuspended in a total volume of 200 μl reaction buffer. Complex I (NADH:ubiquinone oxidoreductase) activity was measured in reaction buffer containing 25mM potassium phosphate, 5 mM MgCl2, 2.5 mg/ml of BSA, 0.13 mM NADH, 2 μg/ml antimycin A, and 65 μM ubiquinone1 at 340 nm for 5 min before and after the addition of rotenone (2 μg/ml). Complex II (succinate: ubiquinone oxidoreductase) activity was measured in reaction buffer containing 25 mM potassium phosphate, 2.5 mg/ml of BSA, 20 mM sodium succinate, 0.05 mM DCPIP, 2 mM KCN, and 65 μM ubiquinone1 at 600 nm. The reaction was started through the addition of 65 μM ubiquinone1. Complex III (ubiquinol2:cytochrome c reductase) activity was measured in reaction buffer containing 25 mM potassium phosphate, 2.5 mg/ml of BSA, 2 mM KCN, 2 μg/ml rotenone, 0.6 mM n-dodecyl-b-D-maltoside, 15 μM cytochrome c and 35 μM ubiquinol2 at 550 nm. Complex IV (cytochrome c oxidase) activity was measured in reaction buffer containing 25 mM potassium phosphate, 0.45 mM n-dodecyl-b-D-maltoside and 15 μM cytochrome c. Complex IV activity at 550 nm. Complex V (F1-ATP synthase) activity was determined in assay buffer containing 40 mM Tris-HCO3, 10 mM EGTA pH8.0, 0.2 mM NADH, 2.5 mM PEP, 25 μg/ml antimycin A, 0.5 mg/ml LDH, 0.5 mg/ml PK and 2.5 mM ATP. Complex V activity was measured following the change in absorbance at 340 nm due to NADH oxidation.
RNA immunoprecipitation and RT-PCR/Real time PCR
Isolated mitochondria were first lysed by immunoprecipitation lysis buffer (50 mM Tris, pH 7.4, 250 mM NaCl, 5 mM EDTA, 50 mM NaF, 1 mM Na3VO4, 1% Nonidet P40 (NP40) and 0.02% NaN3) containing 1X protease inhibitor cocktail (Cell signaling, Danvers, MA) and 100U/ml Ribonuclease Inhibitor (Life Technologies, Grand Island, NY). The homogenate was then centrifuged at 18,000 g at 4 °C for 30 min. The supernatant was collected and incubated with magnetic beads bound by TDP43 antibody overnight at 4 °C. Magnetic beads were then washed with lysis buffer and RNAs were extracted by TRIzol reagent (Life Technologies, Grand Island, NY). Total RNAs from HEK-293T cells and human spinal cord tissues were also extracted by TRIzol reagent (Life Technologies, Grand Island, NY). mtDNA was removed by DNase I treatment and was verified by PCR. Reverse transcriptions were performed by High Capacity cDNA Reverse Transcription Kit with random oligomer primers (Life Technologies, Grand Island, NY). qRT-PCR analysis of all mitochondria transcripts were performed on StepOnePlus system with appropriate primer pairs using SYBR Green master mix (Life Technologies, Grand Island, NY). See table 1 for primers used (A8/ND4L have not been specifically measured and amplified due to their short sequences).
Mitochondrial nascent protein synthesis in HEK293 cells
HEK293 cells expressing Flag tagged TDP-43 were cultured in DMEM culture medium without methionine (Life Technologies, Grand Island, NY) for 1 hour followed by pretreatment with 0.1mg/ml emetine for 10 min and co-treatment with 0.1mg/ml emetine and L-Azidohomoalanine (AHA, Life Technologies, Grand Island, NY) for 4 hours. After pulse labelling, cells were harvested followed by mitochondrial fractionation. Isolated mitochondria were lysed with 1% SDS in 50 mM Tris-HCl, pH 8.0 followed by centrifugation at 10,000 g for 10 min. The supernatant was incubated with avidin- dynabeads (Life Technologies, Grand Island, NY) at RT for 30 min. After the removal of beads, the supernatant was subjected to Click-it assay (Life Technologies, Grand Island, NY). Taken briefly, 200 μg mitochondria proteins were labeled with PEG4-carboxamide-6-Azidohexanyl-biotin in a 160 μl volume system, and total proteins were precipitated and extracted by methanol and chloroform. After centrifugation at 18,000 g for 5 min, the total protein pellets were collected and dissolved by 1% SDS in 50mM Tris-HCl for western blot.
Fractionation for mitochondrial ribosomes and their loading on RNAs
Isolated mitochondria were lysed in lysis buffer (260 mM sucrose, 100 mM KCl, 20 mM MgCl2, 10 mM Tris-Cl pH 7.5, 1% Triton X-100, 5 mM β-mercaptoethanol and protease inhibitor) on ice for 20 min. Lysates were centrifuged at 9,400 g for 30 min at 4 °C. Then supernatants were loaded on 11 ml 10%–30% continuous linear sucrose gradient (50 mM Tris-Cl, 100 mM KCl, 10 mM MgCl2) and centrifuged at 20,400 rpm for 15 hours in a Beckman SW41-Ti rotor at 4 °C. After centrifugation, 13 fractions were collected from the top and used for further immunoblot and qRT-PCR analysis.
Blue native PAGE and immunoblot analysis
Blue native gel electrophoresis was performed with NativePAGE Bis-Tris Gel system (Life Technologies, Grand Island, NY). Briefly, isolated mitochondria containing 10 μg of mitochondrial proteins were resuspended in sample buffer and solubilized with 2% digitonin (Sigma) for 30 min on ice. Insolubilized pellets were removed by centrifugation for 30 min at 18,000 g. The supernatant was collected and 5% G-250 sample additive was added. Samples were loaded to 3–12% precast Bis-Tris gradient gels (Life Technologies, Grand Island, NY) followed by electrophoresis at a voltage of 40 V with light blue running buffers at 4 °C. For regular immunoblot analysis, purified mitochondria, cells or tissues were lysed with cell lysis buffer (Cell signaling, Danvers, MA) plus 1 mM PMSF and protease inhibitor cocktail (Roche, Nutley, NJ). Equal amounts of 10 μg total protein extract were resolved by SDS-PAGE and transferred to Immobilon-P (Millipore, Billerica, MA). Following blocking with 10% nonfat dry milk, primary and secondary antibodies were applied as previously described56 and the blots were developed with Immobilon Western Chemiluminescent HRP Substrate (Millipore, Billerica, MA). Frozen human thoracic spinal cord tissues from 6 age-matched normal and 8 patients with sALS were obtained from NICHD Brain and Tissue Bank (Table 1).
RNA-protein in vitro binding assay
ND3 RNA probe (5′-UCCACCCCUUACGAGUGCGGCUUCGACCCUAUAUC-3′) and mutant ND3 RNA probe (5′-UCCACCCCUUACAAAUAAAGCUUCGACCCUAUAUC-3′) were purchased from GenScript (Piscataway, NJ). RNA-protein binding was performed in 20 μl reactions containing 1μM RNA probe. The binding conditions were 10 mM Tris at pH 7.5, 10 mM HEPES at pH 7.5, 20 mM KCl, 2 mM MgCl2, 1.5 mM DTT, 5% glycerol. After incubation at RT for 30 min, samples were run at 100 V on a pre-electrophoresed 6% polyacrylamide gel containing 0.5×TBE for 1 hour in ice water bath. Gel was stained by SYBR Green solution (Life Technologies, Grand Island, NY) for 20 min at RT. Then stained gel was rinsed with water for three times and visualized by EpiChemi II Darkroom (UVP, Upland, CA)
Lentivirus production, stereotaxic injection and cryosection
Lenti-X 293T cells (Clontech, Mountain View, CA) were transfected with bicistronic lentiviral construct and two helper plasmids: PCMV-dR8.2 and PCMV-VSVG at 6 μg, 4.5 μg, and 1.5 μg of DNA per 10 cm plate using PerFectin (Genlantis, San Diego, CA). 48 h after transfection, culture medium was centrifuged at 780 g for 30 min and filtered at a 0.45μm pore size. Filtered medium was further laid on the top of 20% sucrose followed by centrifugation in Beckman SW-28 rotor at 90,000 g for 2 hours. The pellet was collected and resuspended in PBS or saline. Procedures for lentiviral injections into mice were performed according to the NIH guidelines and were approved by the Institutional Animal Care and Use Committee (IACUC) at Case Western Reserve University. For virus injection, mice were anesthetized using avertin (250 mg/kg) and placed in a stereotactic frame. A small incision was made to expose the skull surface. Holes were drilled in the skull overlying the motor cortex region (AP/Anterior-Posterior: 1 mm; ML/Medial-Lateral: 1 mm). The needle filled with virus was lowered down 0.7 mm (DV/Dorsal-Ventral) and 2 μl virus (109 viral particles/ml) was injected in 5 min. The needle was left in place 5 min before slow withdraw. Skin was sutured and mice were allowed to recover on warm pads. One week after injection, mice were deeply anesthetized with avertin and transcardially perfused with cold PBS. The brain was fixed in paraformaldehyde (4%) for 24 hours and then in 30% sucrose for 24 hours again. After cryoprotection, the brain coronal sections were cut at 20 μm thickness for immunostaining. 3 months old C57BL/6 mice, male or female, were randomly assigned to receiving different injections. The outcomes were independently assessed by an investigator without knowledge of injections.
In vivo administration of TAT-peptide
Mice surgery/procedures were performed according to the NIH guidelines and were approved by the Institutional Animal Care and Use Committee (IACUC) at Case Western Reserve University. Minimal number of mice were used (at least 3/group). C57BL/6 non-transgenic wild type mice (NTG mice), Prnp-TARDBP mice (TDP-43 WT Tg mice) and Prnp-TARDBP*A315T mice (TDP-43 A315T Tg mice) were purchased from the Jackson Laboratory (Bar Harbor, ME). 2–3 months old male or female mice were randomly assigned to receiving treatment. Mice were infused subcutaneously with mini-osmotic pumps (Alzet Model 2004, Cupertino, CA; flow rate of 0.25 μl/hour for 10 days). One day before implantation, mini-osmotic pumps were filled with 200 μl PBS containing cPM or PM1 peptides (0.5 mg/kg/day) followed by pump incubation in PBS at 37 °C overnight according to the manufacturer’s instructions. For surgery, male mice were anesthetized with avertin. A small incision was made at the back of mouse and mini-osmotic pump were implanted subcutaneously. After treatment, mice were deeply anesthetized with avertin and transcardially perfused with cold PBS and spinal cord and brain tissues were collected followed by fractionation, western blot or immunostaining. The outcomes were independently assessed by an investigator without knowledge of treatments.
Motor behavioral assessment
The Rotarod test was used to assay motor coordination and balance of mice using Panlab Rota-Rods (Harvard Apparatus, Holliston, MA) as described58. Taken briefly, mice first received training with 3 trials a day for 3 days (4–12 rpm for less than 3 minutes with at least 10 minute intervals between trials). All mice used in this study reached a stable Rotarod performance after training (data not shown). Three days after training, mice were assayed at the accelerating mode (4 – 40 rpm over 5 minutes) for three times every week. All Rotarod tests were performed with at least 5 minutes intervals for different genotypes and interspersed to avoid habituation. Footprint analyses were performed using a customized runway (50 cm long, 5 cm wide and both sides bordered). The forepaw and hindpaw of mice were first dipped into red and blue non-toxic paints. Subsequently, mice were placed on the runway covered by white paper and ran into an enclosed dark box. Footprints of sitting mice were not included in quantification. Stride length is the mean distance of forward movement between each stride, while base length is the mean distance between left and right forepaw or hindpaw.
Confocal microscopy, fluorescent microscopy and electron microscopy
All confocal images were captured at RT with a Zeiss LSM 510 inverted laser-scanning confocal fluorescence microscope (controlled through Zeiss LSM 510 confocal software, Zeiss) equipped with a C-Apochromat 40×/1.2W water objective or alpha Plan-Fluar 100×/1.45 oil objective as previously described56. Confocal images of far-red fluorescence were collected using 633 nm excitation light from a HeNe laser and a 650 nm long-pass filter; images of red fluorescence were collected using 543 nm excitation light from an argon laser and a 560 nm long-pass filter; and green fluorescence images were collected using 488 nm excitation light from an argon laser and a 500–550 nm bandpass barrier filter.
For time-lapse imaging or regular fluorescence imaging of TMRM, Rhod123 and SYTOX green, cells or neurons were seeded in 35 mm dishes or 24 well plates, and infected/transfected with mito-DsRed2 or indicated plasmids. Cells or neurons were imaged by an inverted Leica DMI6000 fluorescence microscope (Leica) (controlled through Leica LAS AF 3 software) with a 20X/0.7NA Plan Apochromat dry objective and well-equipped with environmental chamber with controlled CO2 content, humidity and temperature (37 °C). Images were captured with lowest intensity to avoid photobleaching or signal oversaturation. During time-lapse imaging, frames were captured every 10 s for at least 1 h without phototoxicity or photobleaching.
For immuno-EM, biopsied human brain tissue, cells and isolated mitochondria were fixed in 4% w/v formaldehyde containing 0.1% w/v glutaraldehyde in 0.1 M HEPES buffer (Electron Microscopy Sciences, Hatfield, PA) at RT for 45 min, then dehydrated in ethanol and embedded in LR White resin (Polysciences, Inc., Warrington, PA). Immuno-gold labeling procedure was performed according to the method described by Fujioka et al.59. Thin sections were blocked with PBS containing 1% w/v bovine serum albumin (BSA), 1% v/v normal goat serum and 0.01% v/v Tween 20 (PBGT). Grids were then incubated with antibodies (anti-Flag or anit-TDP-43) at 1:10–1:30 dilution in PBGT for 12 hours at 4 °C. Negative controls included normal rabbit serum, normal mouse serum, and PBT replaced as the primary antibody. After washing, grids were incubated for 1.5 hour in 10nm gold-conjugated goat anti-rabbit IgG or goat anti-mouse IgG (British BioCell International, Ted Pella, Inc., Redding, CA) diluted 1:20 in PBGT, rinsed with PBS, and fixed with glutaraldehyde to stabilize the gold particles59. Gold-labelled thin sections were stained first with 2% acidified uranyl acetate at 38 °C for 30 min, then with the triple lead stain of Sato as modified by Hanaichi et al60, then examined in an FEI Tecnai Spirit (T12) with a Gatan US4000 4k×4k CCD. For regular EM, samples were freshly dissected and processed for transmission electron microscopy as previously described61: Small pieces of the tissue or isolated mitochondria were fixed by immersion in triple aldehyde-DMSO. After rinsing in distilled water, they were postfixed in ferrocyanide-reduced osmium tetroxide. Another water rinse was followed by an overnight soak in acidified uranyl acetate. After again rinsing in distilled water, the tissue blocks were dehydrated in ascending concentrations of ethanol, passed through propylene oxide, and embedded in Poly/Bed resin. Thin sections were sequentially stained with acidified uranyl acetate followed by a modification of Sato’s triple lead stain and examined in an examined in an FEI Tecnai Spirit (T12) with a Gatan US4000 4kx4k CCD.
Image analysis
Image analysis was also performed with open-source image analysis programs WCIF ImageJ (developed by W. Rasband). 3D images were reconstructed using “3D Viewer” plugin and continuous images with 200 nm optical thickness. Line scan analysis were performed using “RGB Profiler Plot” plugin. Taken briefly, raw confocal images were background corrected. A straight line with “2” width was drawn in regions of interest. Then the lines were directly analyzed by choosing ImageJ plugin Graphics’s “RGB Profiler Plot” under the “Plugins” menu. In the output of “RGB Profiler”, data was exported into Microsoft Excel. The length of line was plotted on the x-axis, while the intensity was plotted on the y-axis. Kymograph and quantification of mitochondrial movement were performed using “MultipleKymograph” as described (http://www.embl.de/eamnet/html/body_kymograph.html). Mitochondria morphology in fibroblasts and HEK293 cells was quantified as we described62. Taken briefly, single plane or series of z-stacks of raw images were background corrected, linearly contrast optimized, applied with a 7 × 7 ‘top hat’ filter, subjected to a 3 × 3 median filter and then thresholded to generate binary images. Most mitochondria were well separated in binary images and large clusters of mitochondria were excluded automatically. All binary images were further analyzed by Image J. Mitochondrial morphology in neurons or EM micrographs were all directly analyzed by image J.
Data collection and statistical analysis
Our power analysis indicated that to detect 20% difference at α=0.05 and β=0.8, with < 0.05 probability of false errors using the typical variances we have in our data requires a minimum of 12 samples. No samples were excluded in this study. All the outcomes were independently assessed by investigator without knowledge of treatments. Statistical analysis was done with one-way analysis of variance (ANOVA) followed by Tukey’s multiple comparison test or student-t-test. Data are means ± s.e.m. n represents number of neurons, cells or mice per experiment. p<0.05 was considered to be statistically significant. n.s., not significant. Data were normally distributed with similar variance between the groups. All statistical analyses were performed in a blinded fashion.
Supplementary Material
Acknowledgments
This study is supported by grants from US National Institutes of Health (R03AG044680 and 1R01NS089604 to X.W.), US Alzheimer’s Association (2014-NIRG-301299 to X.W.) and University Hospitals of Cleveland, USA (2012 SPITZ Innovation Pilot Grant to X.W.). Human spinal cord frozen tissues were obtained from the Eunice Kennedy Shriver National Institute of Child Health and Human Development Brain and Tissue Bank for Developmental Disorders at the University of Maryland, USA contract HHSN275200900011C, Ref. No. N01-HD-9-0011. We also thank G. Perry and X. Zhu for providing paraffin-embedded human spinal cord tissues.
Footnotes
Author contributions
X.W. conceived and directed the project, interpreted results and wrote the manuscript. W.W., L.W., J.L., S.L.S, J.L., S.J., X.M., Z.J., M.S., H.C. and X.W. contributed to experiments, data analysis and manuscript preparation. H.F. contributed to electron microscopy study. E.L.daR. and H.L contributed to RNA-seq study. P.H.L. contributed to the reprogramming of human fibroblasts into human neurons.
COMPETING FINANCIAL INTERESTS
The authors declare no competing financial interests
References
- 1.Swinnen B, Robberecht W. The phenotypic variability of amyotrophic lateral sclerosis. Nature reviews. Neurology. 2014;10:661–670. doi: 10.1038/nrneurol.2014.184. [DOI] [PubMed] [Google Scholar]
- 2.Rademakers R, Neumann M, Mackenzie IR. Advances in understanding the molecular basis of frontotemporal dementia. Nature reviews. Neurology. 2012;8:423–434. doi: 10.1038/nrneurol.2012.117. [DOI] [PMC free article] [PubMed] [Google Scholar]
- 3.Clery A, Blatter M, Allain FH. RNA recognition motifs: boring? Not quite. Current opinion in structural biology. 2008;18:290–298. doi: 10.1016/j.sbi.2008.04.002. [DOI] [PubMed] [Google Scholar]
- 4.Buratti E, Baralle FE. Multiple roles of TDP-43 in gene expression, splicing regulation, and human disease. Frontiers in bioscience: a journal and virtual library. 2008;13:867–878. doi: 10.2741/2727. [DOI] [PubMed] [Google Scholar]
- 5.Buratti E, Baralle FE. TDP-43: gumming up neurons through protein-protein and protein-RNA interactions. Trends Biochem Sci. 2012;37:237–247. doi: 10.1016/j.tibs.2012.03.003. [DOI] [PubMed] [Google Scholar]
- 6.Lee EB, Lee VM, Trojanowski JQ. Gains or losses: molecular mechanisms of TDP43-mediated neurodegeneration. Nature reviews. Neuroscience. 2012;13:38–50. doi: 10.1038/nrn3121. [DOI] [PMC free article] [PubMed] [Google Scholar]
- 7.Kabashi E, et al. TARDBP mutations in individuals with sporadic and familial amyotrophic lateral sclerosis. Nat Genet. 2008;40:572–574. doi: 10.1038/ng.132. [DOI] [PubMed] [Google Scholar]
- 8.Sreedharan J, et al. TDP-43 mutations in familial and sporadic amyotrophic lateral sclerosis. Science. 2008;319:1668–1672. doi: 10.1126/science.1154584. [DOI] [PMC free article] [PubMed] [Google Scholar]
- 9.Neumann M, et al. Ubiquitinated TDP-43 in frontotemporal lobar degeneration and amyotrophic lateral sclerosis. Science. 2006;314:130–133. doi: 10.1126/science.1134108. [DOI] [PubMed] [Google Scholar]
- 10.Mackenzie IR, Rademakers R, Neumann M. TDP-43 and FUS in amyotrophic lateral sclerosis and frontotemporal dementia. The Lancet. Neurology. 2010;9:995–1007. doi: 10.1016/S1474-4422(10)70195-2. [DOI] [PubMed] [Google Scholar]
- 11.Amador-Ortiz C, et al. TDP-43 immunoreactivity in hippocampal sclerosis and Alzheimer’s disease. Annals of neurology. 2007;61:435–445. doi: 10.1002/ana.21154. [DOI] [PMC free article] [PubMed] [Google Scholar]
- 12.Josephs KA, et al. Staging TDP-43 pathology in Alzheimer’s disease. Acta neuropathologica. 2014;127:441–450. doi: 10.1007/s00401-013-1211-9. [DOI] [PMC free article] [PubMed] [Google Scholar]
- 13.Chanson JB, et al. TDP43-positive intraneuronal inclusions in a patient with motor neuron disease and Parkinson’s disease. Neurodegener Dis. 2010;7:260–264. doi: 10.1159/000273591. [DOI] [PubMed] [Google Scholar]
- 14.Davidson Y, et al. TDP-43 in ubiquitinated inclusions in the inferior olives in frontotemporal lobar degeneration and in other neurodegenerative diseases: a degenerative process distinct from normal ageing. Acta Neuropathol. 2009;118:359–369. doi: 10.1007/s00401-009-0526-z. [DOI] [PubMed] [Google Scholar]
- 15.Arnold ES, et al. ALS-linked TDP-43 mutations produce aberrant RNA splicing and adult-onset motor neuron disease without aggregation or loss of nuclear TDP-43. Proceedings of the National Academy of Sciences of the United States of America. 2013;110:E736–745. doi: 10.1073/pnas.1222809110. [DOI] [PMC free article] [PubMed] [Google Scholar]
- 16.Austin JA, et al. Disease causing mutants of TDP-43 nucleic acid binding domains are resistant to aggregation and have increased stability and half-life. Proceedings of the National Academy of Sciences of the United States of America. 2014;111:4309–4314. doi: 10.1073/pnas.1317317111. [DOI] [PMC free article] [PubMed] [Google Scholar]
- 17.Barmada SJ, et al. Cytoplasmic Mislocalization of TDP-43 Is Toxic to Neurons and Enhanced by a Mutation Associated with Familial Amyotrophic Lateral Sclerosis. Journal of Neuroscience. 2010;30:639–649. doi: 10.1523/JNEUROSCI.4988-09.2010. [DOI] [PMC free article] [PubMed] [Google Scholar]
- 18.Hansson Petersen CA, et al. The amyloid beta-peptide is imported into mitochondria via the TOM import machinery and localized to mitochondrial cristae. Proceedings of the National Academy of Sciences of the United States of America. 2008;105:13145–13150. doi: 10.1073/pnas.0806192105. [DOI] [PMC free article] [PubMed] [Google Scholar]
- 19.Emanuelsson O, Brunak S, von Heijne G, Nielsen H. Locating proteins in the cell using TargetP, SignalP and related tools. Nature protocols. 2007;2:953–971. doi: 10.1038/nprot.2007.131. [DOI] [PubMed] [Google Scholar]
- 20.Claros MG, Vincens P. Computational method to predict mitochondrially imported proteins and their targeting sequences. European journal of biochemistry/FEBS. 1996;241:779–786. doi: 10.1111/j.1432-1033.1996.00779.x. [DOI] [PubMed] [Google Scholar]
- 21.Bolender N, Sickmann A, Wagner R, Meisinger C, Pfanner N. Multiple pathways for sorting mitochondrial precursor proteins. EMBO reports. 2008;9:42–49. doi: 10.1038/sj.embor.7401126. [DOI] [PMC free article] [PubMed] [Google Scholar]
- 22.Schmidt O, Pfanner N, Meisinger C. Mitochondrial protein import: from proteomics to functional mechanisms. Nat Rev Mol Cell Biol. 2010;11:655–667. doi: 10.1038/nrm2959. [DOI] [PubMed] [Google Scholar]
- 23.Sillerud LO, Larson RS. Design and structure of peptide and peptidomimetic antagonists of protein-protein interaction. Current protein & peptide science. 2005;6:151–169. doi: 10.2174/1389203053545462. [DOI] [PubMed] [Google Scholar]
- 24.Herdewyn S, et al. Prevention of intestinal obstruction reveals progressive neurodegeneration in mutant TDP-43 (A315T) mice. Mol Neurodegener. 2014;9:24. doi: 10.1186/1750-1326-9-24. [DOI] [PMC free article] [PubMed] [Google Scholar]
- 25.Hatzipetros T, et al. C57BL/6J congenic Prp-TDP43A315T mice develop progressive neurodegeneration in the myenteric plexus of the colon without exhibiting key features of ALS. Brain research. 2014;1584:59–72. doi: 10.1016/j.brainres.2013.10.013. [DOI] [PubMed] [Google Scholar]
- 26.Dang TN, et al. Increased metal content in the TDP-43(A315T) transgenic mouse model of frontotemporal lobar degeneration and amyotrophic lateral sclerosis. Front Aging Neurosci. 2014;6:15. doi: 10.3389/fnagi.2014.00015. [DOI] [PMC free article] [PubMed] [Google Scholar]
- 27.Dang TN, et al. Endogenous progesterone levels and frontotemporal dementia: modulation of TDP-43 and Tau levels in vitro and treatment of the A315T TARDBP mouse model. Disease models & mechanisms. 2013;6:1198–1204. doi: 10.1242/dmm.011460. [DOI] [PMC free article] [PubMed] [Google Scholar]
- 28.Wegorzewska I, Bell S, Cairns NJ, Miller TM, Baloh RH. TDP-43 mutant transgenic mice develop features of ALS and frontotemporal lobar degeneration. Proceedings of the National Academy of Sciences of the United States of America. 2009;106:18809–18814. doi: 10.1073/pnas.0908767106. [DOI] [PMC free article] [PubMed] [Google Scholar]
- 29.Mori F, et al. Maturation process of TDP-43-positive neuronal cytoplasmic inclusions in amyotrophic lateral sclerosis with and without dementia. Acta neuropathologica. 2008;116:193–203. doi: 10.1007/s00401-008-0396-9. [DOI] [PubMed] [Google Scholar]
- 30.Hasegawa M, et al. Phosphorylated TDP-43 in frontotemporal lobar degeneration and amyotrophic lateral sclerosis. Annals of neurology. 2008;64:60–70. doi: 10.1002/ana.21425. [DOI] [PMC free article] [PubMed] [Google Scholar]
- 31.Brandmeir NJ, et al. Severe subcortical TDP-43 pathology in sporadic frontotemporal lobar degeneration with motor neuron disease. Acta neuropathologica. 2008;115:123–131. doi: 10.1007/s00401-007-0315-5. [DOI] [PubMed] [Google Scholar]
- 32.Yang C, et al. Partial loss of TDP-43 function causes phenotypes of amyotrophic lateral sclerosis. Proceedings of the National Academy of Sciences of the United States of America. 2014;111:E1121–1129. doi: 10.1073/pnas.1322641111. [DOI] [PMC free article] [PubMed] [Google Scholar]
- 33.Wu LS, Cheng WC, Shen CK. Targeted depletion of TDP-43 expression in the spinal cord motor neurons leads to the development of amyotrophic lateral sclerosis-like phenotypes in mice. The Journal of biological chemistry. 2012;287:27335–27344. doi: 10.1074/jbc.M112.359000. [DOI] [PMC free article] [PubMed] [Google Scholar]
- 34.Pfeffer S, Woellhaf MW, Herrmann JM, Forster F. Organization of the mitochondrial translation machinery studied in situ by cryoelectron tomography. Nature communications. 2015;6:6019. doi: 10.1038/ncomms7019. [DOI] [PubMed] [Google Scholar]
- 35.Polymenidou M, et al. Long pre-mRNA depletion and RNA missplicing contribute to neuronal vulnerability from loss of TDP-43. Nature neuroscience. 2011;14:459–468. doi: 10.1038/nn.2779. [DOI] [PMC free article] [PubMed] [Google Scholar]
- 36.Sephton CF, et al. Identification of neuronal RNA targets of TDP-43-containing ribonucleoprotein complexes. The Journal of biological chemistry. 2011;286:1204–1215. doi: 10.1074/jbc.M110.190884. [DOI] [PMC free article] [PubMed] [Google Scholar]
- 37.Tollervey JR, et al. Characterizing the RNA targets and position-dependent splicing regulation by TDP-43. Nature neuroscience. 2011;14:452–458. doi: 10.1038/nn.2778. [DOI] [PMC free article] [PubMed] [Google Scholar]
- 38.Narayanan RK, et al. Identification of RNA bound to the TDP-43 ribonucleoprotein complex in the adult mouse brain. Amyotrophic lateral sclerosis & frontotemporal degeneration. 2013;14:252–260. doi: 10.3109/21678421.2012.734520. [DOI] [PubMed] [Google Scholar]
- 39.McFarland R, et al. De novo mutations in the mitochondrial ND3 gene as a cause of infantile mitochondrial encephalopathy and complex I deficiency. Annals of neurology. 2004;55:58–64. doi: 10.1002/ana.10787. [DOI] [PubMed] [Google Scholar]
- 40.Chinnery PF, et al. The mitochondrial ND6 gene is a hot spot for mutations that cause Leber’s hereditary optic neuropathy. Brain: a journal of neurology. 2001;124:209–218. doi: 10.1093/brain/124.1.209. [DOI] [PubMed] [Google Scholar]
- 41.Liu W, et al. Pink1 regulates the oxidative phosphorylation machinery via mitochondrial fission. Proc Natl Acad Sci U S A. 2011;108:12920–12924. doi: 10.1073/pnas.1107332108. [DOI] [PMC free article] [PubMed] [Google Scholar]
- 42.Cogliati S, et al. Mitochondrial cristae shape determines respiratory chain supercomplexes assembly and respiratory efficiency. Cell. 2013;155:160–171. doi: 10.1016/j.cell.2013.08.032. [DOI] [PMC free article] [PubMed] [Google Scholar]
- 43.Xu YF, et al. Wild-type human TDP-43 expression causes TDP-43 phosphorylation, mitochondrial aggregation, motor deficits, and early mortality in transgenic mice. J Neurosci. 2010;30:10851–10859. doi: 10.1523/JNEUROSCI.1630-10.2010. [DOI] [PMC free article] [PubMed] [Google Scholar]
- 44.Xu YF, et al. Expression of mutant TDP-43 induces neuronal dysfunction in transgenic mice. Mol Neurodegener. 2011;6:73. doi: 10.1186/1750-1326-6-73. [DOI] [PMC free article] [PubMed] [Google Scholar]
- 45.Magrane J, Cortez C, Gan WB, Manfredi G. Abnormal mitochondrial transport and morphology are common pathological denominators in SOD1 and TDP43 ALS mouse models. Human molecular genetics. 2013 doi: 10.1093/hmg/ddt528. [DOI] [PMC free article] [PubMed] [Google Scholar]
- 46.Wang W, et al. The ALS disease-associated mutant TDP-43 impairs mitochondrial dynamics and function in motor neurons. Human molecular genetics. 2013;22:4706–4719. doi: 10.1093/hmg/ddt319. [DOI] [PMC free article] [PubMed] [Google Scholar]
- 47.Kroemer G, Dallaporta B, Resche-Rigon M. The mitochondrial death/life regulator in apoptosis and necrosis. Annu Rev Physiol. 1998;60:619–642. doi: 10.1146/annurev.physiol.60.1.619. [DOI] [PubMed] [Google Scholar]
- 48.Galluzzi L, Kroemer G. Necroptosis: A Specialized Pathway of Programmed Necrosis. Cell. 2008;135:1161–1163. doi: 10.1016/j.cell.2008.12.004. [DOI] [PubMed] [Google Scholar]
- 49.Dolmetsch R, Geschwind DH. The Human Brain in a Dish: The Promise of iPSC-Derived Neurons. Cell. 2011;145:831–834. doi: 10.1016/j.cell.2011.05.034. [DOI] [PMC free article] [PubMed] [Google Scholar]
- 50.Miller JD, et al. Human iPSC-Based Modeling of Late-Onset Disease via Progerin-Induced Aging. Cell stem cell. 2013;13:691–705. doi: 10.1016/j.stem.2013.11.006. [DOI] [PMC free article] [PubMed] [Google Scholar]
- 51.Zhu XW, et al. Activation of p38 kinase links tau phosphorylation, oxidative stress, and cell cycle-related events in Alzheimer disease. Journal of neuropathology and experimental neurology. 2000;59:880–888. doi: 10.1093/jnen/59.10.880. [DOI] [PubMed] [Google Scholar]
- 52.Kaech S, Banker G. Culturing hippocampal neurons. Nat Protoc. 2006;1:2406–2415. doi: 10.1038/nprot.2006.356. [DOI] [PubMed] [Google Scholar]
- 53.Wang X, Su B, Fujioka H, Zhu X. Dynamin-like protein 1 reduction underlies mitochondrial morphology and distribution abnormalities in fibroblasts from sporadic Alzheimer’s disease patients. The American journal of pathology. 2008;173:470–482. doi: 10.2353/ajpath.2008.071208. [DOI] [PMC free article] [PubMed] [Google Scholar]
- 54.Lu JJ, et al. The Distribution of Genomic Variations in Human iPSCs Is Related to Replication-Timing Reorganization during Reprogramming. Cell Rep. 2014;7:70–78. doi: 10.1016/j.celrep.2014.03.007. [DOI] [PMC free article] [PubMed] [Google Scholar]
- 55.Choi SW, Gerencser AA, Nicholls DG. Bioenergetic analysis of isolated cerebrocortical nerve terminals on a microgram scale: spare respiratory capacity and stochastic mitochondrial failure. Journal of neurochemistry. 2009;109:1179–1191. doi: 10.1111/j.1471-4159.2009.06055.x. [DOI] [PMC free article] [PubMed] [Google Scholar]
- 56.Wang X, et al. Impaired balance of mitochondrial fission and fusion in Alzheimer’s disease. J Neurosci. 2009;29:9090–9103. doi: 10.1523/JNEUROSCI.1357-09.2009. [DOI] [PMC free article] [PubMed] [Google Scholar]
- 57.Kirby DM, Thorburn DR, Turnbull DM, Taylor RW. Biochemical assays of respiratory chain complex activity. Methods in cell biology. 2007;80:93–119. doi: 10.1016/S0091-679X(06)80004-X. [DOI] [PubMed] [Google Scholar]
- 58.Jones BJ, Roberts DJ. A rotarod suitable for quantitative measurements of motor incoordination in naive mice. Naunyn-Schmiedebergs Archiv fur experimentelle Pathologie und Pharmakologie. 1968;259:211. doi: 10.1007/BF00537801. [DOI] [PubMed] [Google Scholar]
- 59.Fujioka H, et al. Decreased cytochrome c oxidase subunit VIIa in aged rat heart mitochondria: immunocytochemistry. Anatomical record. 2011;294:1825–1833. doi: 10.1002/ar.21486. [DOI] [PMC free article] [PubMed] [Google Scholar]
- 60.Hanaichi T, et al. A stable lead by modification of Sato’s method. Journal of electron microscopy. 1986;35:304–306. [PubMed] [Google Scholar]
- 61.Fujioka H, Tandler B, Hoppel CL. Mitochondrial division in rat cardiomyocytes: an electron microscope study. Anatomical record. 2012;295:1455–1461. doi: 10.1002/ar.22523. [DOI] [PMC free article] [PubMed] [Google Scholar]
- 62.Wang X, et al. Amyloid-beta overproduction causes abnormal mitochondrial dynamics via differential modulation of mitochondrial fission/fusion proteins. Proceedings of the National Academy of Sciences of the United States of America. 2008;105:19318–19323. doi: 10.1073/pnas.0804871105. [DOI] [PMC free article] [PubMed] [Google Scholar]
Associated Data
This section collects any data citations, data availability statements, or supplementary materials included in this article.