Abstract
We recently developed a mathematical model for predicting reactive oxygen species (ROS) concentration and macromolecules oxidation in vivo. We constructed such a model using Escherichia coli as a model organism and a set of ordinary differential equations. In order to evaluate the major defences relative roles against hydrogen peroxide (H2 O2), we investigated the relative contributions of the various reactions to the dynamic system and searched for approximate analytical solutions for the explicit expression of changes in H2 O2 internal or external concentrations. Although the key actors in cell defence are enzymes and membrane, a detailed analysis shows that their involvement depends on the H2 O2 concentration level. Actually, the impact of the membrane upon the H2 O2 stress felt by the cell is greater when micromolar H2 O2 is present (9-fold less H2 O2 in the cell than out of the cell) than when millimolar H2 O2 is present (about 2-fold less H2 O2 in the cell than out of the cell). The ratio between maximal external H2 O2 and internal H2 O2 concentration also changes, reducing from 8 to 2 while external H2 O2 concentration increases from micromolar to millimolar. This non-linear behaviour mainly occurs because of the switch in the predominant scavenger from Ahp (Alkyl Hydroperoxide Reductase) to Cat (catalase). The phenomenon changes the internal H2 O2 maximal concentration, which surprisingly does not depend on cell density. The external H2 O2 half-life and the cumulative internal H2 O2 exposure do depend upon cell density. Based on these analyses and in order to introduce a concept of dose response relationship for H2 O2-induced cell death, we developed the concepts of “maximal internal H2 O2 concentration” and “cumulative internal H2 O2 concentration” (e.g. the total amount of H2 O2). We predict that cumulative internal H2 O2 concentration is responsible for the H2 O2-mediated death of bacterial cells.
Introduction
Oxygen is indisputably essential for life, but it can also impair cell ability to function normally or it can participate in its destruction ([1] and [2]) because of the generation of reactive oxygen species (ROS) like hydrogen peroxide (H2 O2), superoxide () or hydroxyl radical (HO•).
In order to better understand ROS dynamic within cells, we recently developed a mathematical model ([3]) for predicting reactive oxygen species (ROS) concentration and macromolecules oxidation invivo. This first study principally focuses on HO• dynamic and its consequence on DNA whereas the current study will mainly focus on H2 O2 dynamic.
Escherichia coli was used as a model organism. In order to build our mathematical model we used data from a large number of articles dealing with enzymes or molecule concentrations (in E. coli, kinetic properties and chemical reaction rate constants). We were then able to propose a mathematical model based on a set of ordinary differential equations relating to fundamental principles of mass balance and reaction kinetics. It offers the possibility to simulate properly the experimental results obtained by biologists and therefore to understand the biological parameters involved in the observed phenomena.
The purpose of this study is to use our mathematical model in order to better understand H2 O2 mode of action on E. coli as a model organism.
In aerobic organisms, oxygen oxidizes redox enzymes, generating a flux of H2 O2 that can potentially damage the cell. For instance, Escherichia coli generates about 14 μM H2 O2 per second when it grows aerobically on glucose ([4]). In order to cope with H2 O2 stress, microbes typically contain multiple catalases and/or peroxidases. E. coli contains one Alkyl hydroperoxide reductase (Ahp) and two different catalases (Cat). Alkyl hydroperoxide reductase is the primary scavenger for endogenous H2 O2 in E. coli ([5]). Catalase contributes little when H2 O2 levels are low, but it becomes the most effective scavenger when H2 O2 levels are high ([5]). Moreover, membrane permeability is part of the global defence process against H2 O2 ([4]). However, to our knowledge, the question of their relative involvement remains unsolved especially with regard to the exogenous H2 O2 concentration.
Mechanisms involved in H2 O2 induced cell death were studied by Imlay and Linn ([6] and [7]) who showed that the exposure of E. coli to H2 O2 led to two different modes of killing. The first was observed at low H2 O2 concentration (1–3 mM H2 O2) and resulted from the DNA damage caused by HO• ([7]). The second resulted from damage to unknown macromolecules, inflicted more directly, through H2 O2-mediated oxidation. However, and to our knowledge, the question of the relative involvement of the cumulative or the maximal H2 O2 dose involvement in this phenomenon remains unsolved. Dose response is a question often raised about radiative hazards. For instance Harrison et al. ([8]) indicated median survival times in rats following intravenous injection of polonium-210. The total alpha-particles-emitted numbers show that the cumulative dose and not the maximal dose is principally responsible for death.
Using our mathematical model, we first investigated the relative role of the different ways (principally Ahp, Cat and membrane) for cells to decrease and fight H2 O2 oxidative stress. Here we predict that their involvement depends on the H2 O2 stress level. Moreover and as observed for radiative hazards, we predict that cumulative internal H2 O2 concentration is responsible for the H2 O2-mediated death of bacterial cells.
Materials and Methods
The model assumes that all molecule concentrations are homogeneous in cells. We therefore describe the problem with a dynamic system of ordinary differential equations (ODE) instead of using a complex algorithm such as the Next-Sub-Volume Method. Indeed, one algorithm generally used to study the compartmentalization of molecules in microorganisms (for instance E. coli) is the Next-Sub-volume Method. It is a Gillespie-like ([9] and [10]) method approaching the spatial effects of diffusive phenomena and chemical reaction. According to the Next Sub-volume Method, the side length ℓ of the square sub-volumes has to satisfy the two inequalities
The first inequality indicates that dissociation events can be properly defined within sub-volumes. The second criterion specifies that the time for any molecule to leave a sub-volume is much smaller than the shortest reaction time τmin among the molecular species, so that all molecules are homogeneously distributed within the sub-volumes. For example, the 3D simulations are typically performed with ℓ = 0, 1 μm and the depth h = ℓ of the sub-volumes, which is many times larger than the average radius of a substrat even protein. Considering the H2 O2 molecule maximal number, the reaction initially follows a pseudo-first order kinetic with rate constant k′ = k[H2 O2] and the characteristic time of reaction is therefore τ = 1/k′. This time has to be compared to the characteristic time of diffusion of H2 O2: s (with H2 O2 diffusion constant D = 2 10−9 m2.s−1). This comparison gives τ = 1/k′ = 1/k[H2 O2] ≫ 10−6 or [H2 O2] ≪ 106/k. Even with very high rate constant such as 106 M−1s−1, the inequality imposes [H2 O2] ≪ 1 M. In conclusion, while [H2 O2] ≪ 1 M, the diffusion within the cell is faster than the reaction rate and we do not need to consider compartmentalization.
and H2 O2 are involved in many reactions. Of course we do not take all possible reactions into account, for instance, we do not consider the Haber-Weiss reaction, because our simulations showed no change with or without its consideration and moreover because the relevance of this reaction in vivo is questionable ([11] and [12]); actually adding the Haber-Weiss reaction, numerical simulations show that it is negligible whether H2 O2 concentration is under 0.1 mol⋅L−1. Using published rate constants, we propose here some simplifications and approximations of the system achieved by neglecting the kinetically non-significant reaction. HO• was studied in a previous article ([3]).
Superoxide kinetics
is mainly involved in the following kinetically significant reactions:
Its production:
Its dismutation by SOD (superoxide dismutase)
These two reactions lead to the following ordinary differential equation (ODE) coming from the balance between production and dismutation by SOD:
Internal hydrogen peroxide kinetics
H2 O2 appears significantly in the following reactions: Its productions:
Its dismutation by catalase (Cat) or Alkylhydroperoxidase (Ahp)
Its diffusion across cell membrane
kdiff has been calculated using the membrane permeability coefficient (P = 1.6 × 10⁻³ cm/s), the membrane surface area (A = 1.41 × 10⁻⁷ cm2) and cell volume (V = 3.2 × 10⁻¹⁵ L) given by Seaver and Imlay ([4]), therefore .
The ODE becomes:
where H2 O2out corresponds to H2 O2 in the external habitat of the cell.
KM ( for catalase and for alkylhydroperoxidase) is the Michaelis constant. kcat ( for catalase and for alkylhydroperoxidase) is the turnover number, it represents the maximum number of molecules (here H2 O2) that an enzyme is able to convert into products per second.
External hydrogen peroxide
The cell density is given by n. Vin represents the cell internal volume and Vout corresponds to the total volume. Of course, as microorganisms cannot take up more space than their medium, we have the inequality Vout−nVin ≫ 0.
Cell density
For under 10 minutes experimental time (consistent with most of our simulation), cell density could be considered as a constant but for long time simulation we propose the logistic equation for cell growing function. The logistic equation (also called the Verhulst model) is a model of population growth first published by Pierre Verhulst ([13] and [14]). The continuous version of the Verhulst model is described by the following differential equation:
where r is the Malthusian parameter (rate of population growth) and nmax the maximum sustainable population. This differential equation gives an analytical solution:
where n0 is the initial density. This value depends on the experiment. We choose carrying capacity nmax = 5 × 10⁹ cell/mL. The maximal rate of growth usually shows that a growing bacterial population doubles at regular intervals near a characteristic time τd ≈ 20 minutes. Therefore n(t) expression also gives:
where r = ln(2)/τd.
Nevertheless this characteristic time depends on cell history and stress. For example, even 0.2 mM of H2 O2 when added to a logarithmically growing E. coli population is enough to generate an immediate decrease in the number of viable cells. This phenomenon is transient and the original number of viable cells is recovered only about 40 minutes after the occurrence of the sub-lethal stress ([15]). This transient phenomenon is mirrored at the population level by a lag phase in which optical density remains almost constant for about 40 minutes. A fraction dies, and then the remaining bacteria resume growth so that the number of viable cells reaches the original number. For instance Chang et al. ([16]) also report a lag phase of about 40 minutes after an addition of 1.5 mM of H2 O2. In order to take into account this phenomenon we consider that τd → ∞ if t < 40 minutes so that n(t < 40 min) = constant after H2 O2 oxidative stress.
We were not concerned with stationary phase because no experiment carried out in this work reached the maximum sustainable population.
Kinetic constants
The kinetic constants used in this work are gathered in Table 1 according to Imlay and Fridovich ([17]) and Seaver and Imlay ([5] and [4]).
Table 1. Kinetic constants used to describe H2 O2 evolution.
| Kinetic constants | |
|---|---|
| k1 | 5.7 × 10⁻⁶ mol⋅L−1⋅s−1 |
| k2[SOD] | 2.8 × 10⁴ s−1 |
| k2 | 1.5 × 10⁹ mol−1⋅L⋅s−1 |
| Vin | 3.2 × 10⁻¹⁵ L |
| 12 × 10−6 mol⋅L−1⋅s−1 | |
| 6.6 × 10⁻⁴ mol⋅L−1⋅s−1 | |
| 1.2 × 10⁻⁶ mol⋅L−1 | |
| 4.9 × 10⁻¹ mol⋅L−1⋅s−1 | |
| 5.9 × 10⁻³ mol⋅L−1 | |
| kdiff | 70 s−1 |
Numerical simulations
All numerical simulations were carried out using the MATLAB ODE solver ode15s for stiff differential equations. The multistep solver ode15s is a variable order solver based on the numerical differentiation formulas.
Results and Discussion
This section presents the analytical study of the dynamic system. This analysis will provide us with insight into the kinetic parameters significantly important for the dynamics of ROS.
Internal hydrogen peroxide
Without exogenous stress
In the wild-type strain, equilibrium is rapidly reached. Indeed the characteristic time of evolution is 1/k2[SOD] ≈ 35 μs. Therefore we can consider as a constant and we can assume that (S1 File supporting information data for demonstration).
So in terms of changes to internal H2 O2 concentration, we approach
because Let us call .
That is a first point, dismutation by SOD involved nearly an increase of 25% in the endogenous H2 O2 production.
Moreover, in the absence of exogenous H2 O2, we can consider that:
so the differential equation system can be simplified to a linear system:
with:
Let us call , then the differential equation system can be written with a matrix structure:
The matrix eigenvalues are λ1 > λ2:
According to the value of the reaction rate constant, we can make the following approximation: and λ2 ≈ −(kenz + kdiff).
The full matrix V with columns corresponding to the eigenvectors is:
The system becomes
The resolution shows a bi-exponential expression:
| (1) |
| (2) |
with
| (3) |
| (4) |
In this first approach, [H2 O2]0 = 0 and [H2 O2]out0 = 0: initial concentrations are taken to be zero.
From the very beginning, as eλ1t ≈ 1 because |λ1| ≈ 0.
Therefore and
In conclusion:
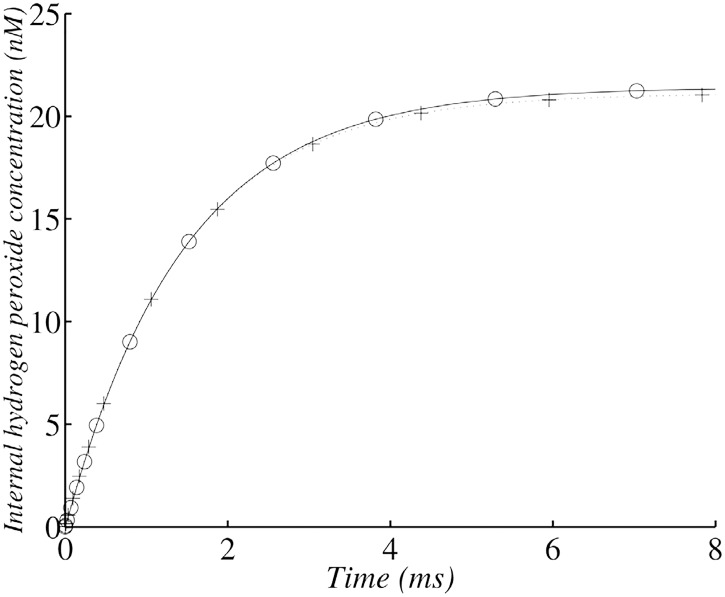
The first plateau (in Fig 1) corresponds to the compromise between production and consumption, but consumption now also depends on diffusion across cell membrane. Indeed, the value of this first plateau is approximately .
Fig 1. Changes in internal H2 O2 concentration in the wild-type strain with 107 cells ml−1.
(+) corresponds to the analytical solution of internal H2 O2 evolution according to the simplified system and (∘)) corresponds to the whole model solved with numerical methods.
The numerical values are ([4]):
These values indicate that diffusion across the cell membrane accounts for approximately 10% of the H2 O2 eliminated, a level of activity close to that of Cat activity (≈12%). As previously reported ([5]), Ahp was identified as the principal scavenger (≈78%).
The first plateau concentration for H2 O2 is therefore nM.
For instance, in an Ahp(-) mutant without Cat induction, this concentration would be nM.
After this transition step, we had eλ2t ≈ 0. The change in H2 O2 concentration therefore follows this equation:
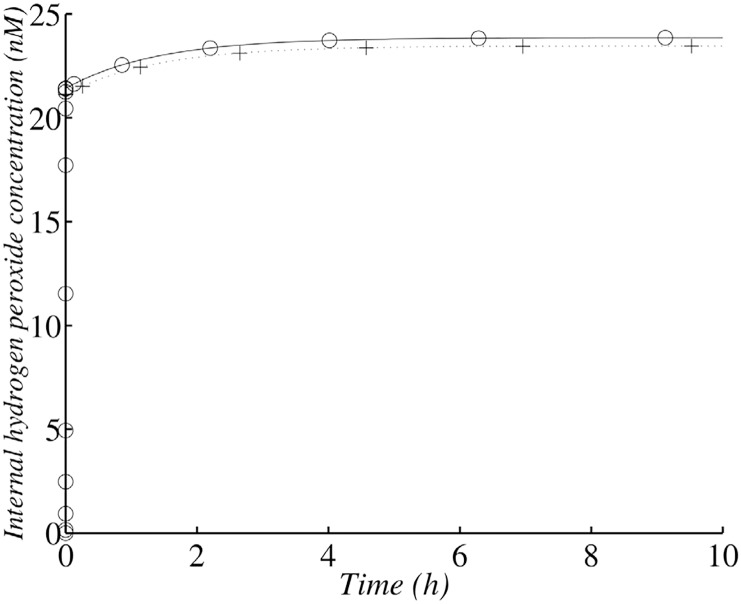
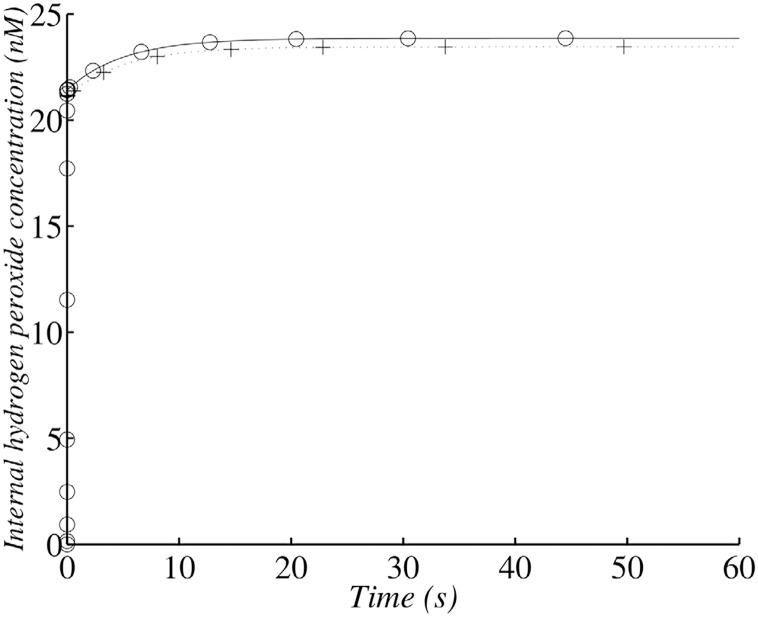
This second step is slower and depends on the number of cells, with the final steady-state concentration of H2 O2 reached more rapidly for denser cell populations (Figs 2 and 3).
Fig 2. Changes in internal H2 O2 concentration in the wild-type strain with 106 cells ml−1.
(+) corresponds to the analytical solution according to the simplified system and (∘)) corresponds to the whole model and a numerical solution.
Fig 3. Changes in H2 O2 concentration in the wild-type strain with 109 cells ml−1.
(+) corresponds to the analytical solution according to the simplified system and (∘)) corresponds to the whole model and a numerical solution.
The final steady-state value is nM and is not dependent on cell number. This value is close to that obtained by numerical simulation (23.9 nM) and to that proposed by Imlay (20 nM) ([4]).
For instance, in an Ahp(-) mutant without Cat induction, this value would be nM (identical to the numerical simulation value and close to the value of 100 nM proposed by Seaver and Imlay ([4]).
This second step in the change in H2 O2 concentration depends on , which depends on cell concentration via the .
The results are summarized in Table 2.
Table 2. H2 O2 steady-state concentration.
| [H2 O2] (nmol L−1) | In this work | Seaver, Imlay [4] |
|---|---|---|
| Wild type | 24 | 21 |
| HPI+ HPII+ Ahp- (AhpCF(a)) | 179 | 100 |
| HPI- HPII- Ahp+ (KatEKatG) | 28 | 23 |
At steady state, the internal concentration is shown for cells in LB at 37°C.
(a) without induced HPI levels.
With exogenous stress
We propose linear approximations of Michaelis-Menten kinetics. Internal H2 O2 concentration approximately follows the law outlined below. Let us consider an experiment involving the addition of exogenous H2 O2. The initial ROS concentrations in the cell are taken to be the steady-state values obtained without exogenous H2 O2. The system requires modification as follows:
As the system is nonlinear there is no analytical solution so with a view to solving the system, we had to compare the value obtained for the internal concentration of H2 O2 with the KM values of Ahp and Cat to simplify the Michaelis-Menten expression. Moreover, cell behavior (and thus the dynamic system) depends on the comparison of internal H2 O2 concentration with the KM values of Ahp and Cat. This comparison is essential to simplify the system into a linear one, which will then be solvable. This kind of study is frequently carried out and provides useful insight into the workings of systems. For example, Polynikis et al. ([18]) compared different modeling approaches (complete nonlinear model, simplified piecewise linear model etc.) for gene regulatory networks using Hill functions, a general form of the Michaelis-Menten equation.
To approximate the Michaelis-Menten hyperbole into a piecewise linear function, let us first examine the contribution of the two enzymes.
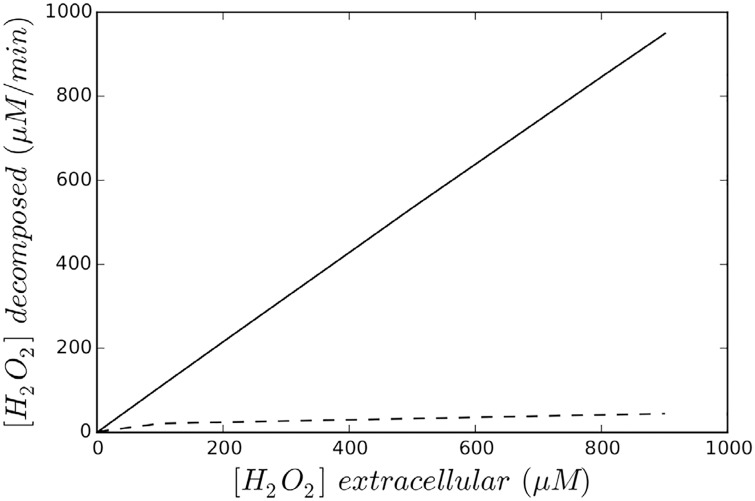
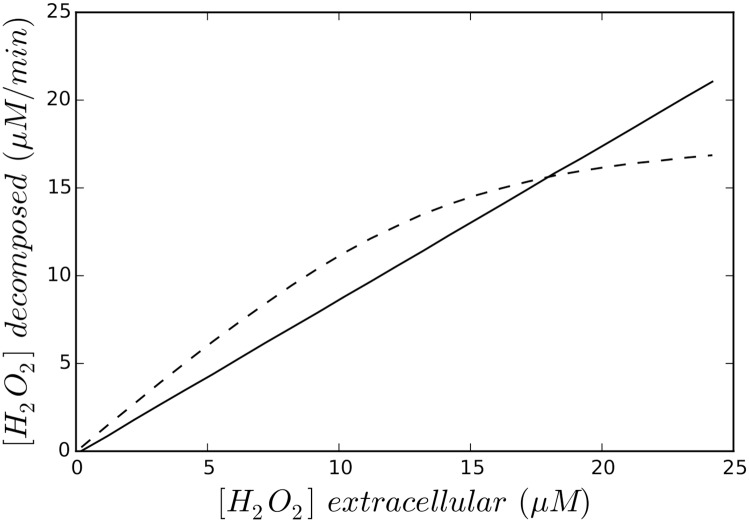
The rate (see Fig 4) followed the same pattern of change as that presented by Seaver and Imlay ([5]). Ahp was the leading scavenger in conditions of 17 μM exogenous H2 O2 (see intersection point in Fig 5).
Fig 4. Kinetics of exogenous H2 O2 decomposition for 1.5 × 10⁸ E. coli cells ml−1.
The dotted line corresponds to the Cat(-) mutant and solid line corresponds to the Ahp (-) mutant.
Fig 5. Kinetics of exogenous H2 O2 decomposition for 1.5 × 10⁸ E. coli cells ml−1.
The dotted line corresponds to the Cat(-) mutant and solid line corresponds to the Ahp (-) mutant (higher magnification for Fig 4).
We can consider that, in the presence of less than 10 μM H2 O2, Ahp activity is linear (Fig 5) and that Cat activity is linear at concentrations below 10 mM (due to its KM value). At H2 O2 concentrations of more than 30 μM, Ahp activity is saturated.
According to the Michaelis-Menten equation, we should consider Ahp activity to be linear when μM, but linearity was observed when [H2 O2]out < 10 μM. It is unclear why there is a difference of one order of magnitude between exogenous [H2 O2]out and internal [H2 O2] at the limit of linearity.
Such a difference was reported in another experiment presented by Seaver and Imlay ([4]) while studying H2 O2 fluxes.
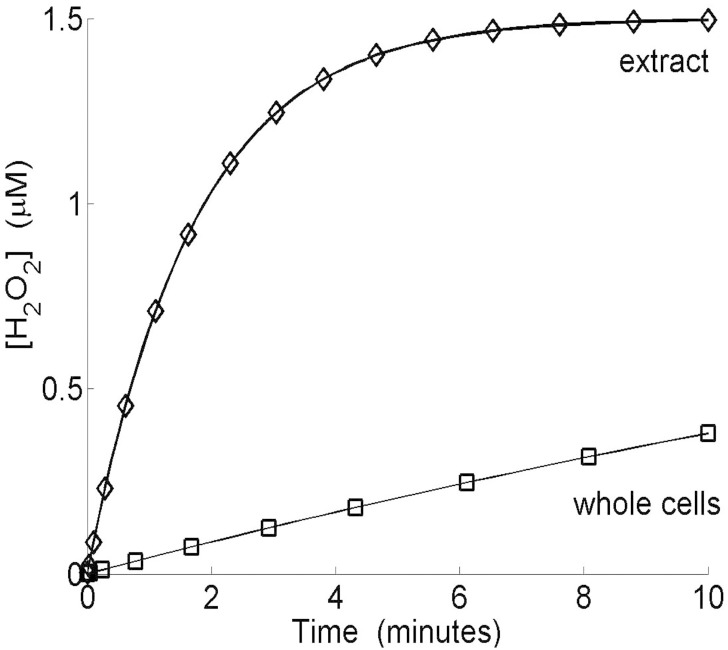
In this experiment, whole cells seemed to scavenge H2 O2 less efficiently than cell extracts. The cell membrane slows the entry of H2 O2, resulting in lower rates of decomposition. It also protects cells against high H2 O2 concentrations, by decreasing the maximum value of H2 O2 concentration. This phenomenon is described in more detail below. The simulation (Fig 6) for extract was modeled by eliminating membrane diffusion and the metabolism associated with ROS production. There is a perfect match between numerical simulation and the experimental results of Seaver and Imlay.
Fig 6. In silico, breakdown of exogenous H2 O2 by whole cells (Ahp(-) mutant) or cell extract. Simulation runs with 4 × 10⁶ cells ml−1.
Moreover, Seaver and Imlay ([5]) observed that an Ahp(-) mutant contained seven times as much total Cat as wild-type cells. We therefore used the same ratio.
Two situations can be distinguished based on these previous observations.
In the first case, corresponds to [H2 O2]out < 10 μM and to . The system approaches Michaelis-Menten terms as follows:
In the second case, if , corresponding to [H2 O2]out > 30 μM and to , then the system approaches Michaelis-Menten terms as follows:
where .
Then we examine Ahp activity with a micromolar exogenous H2 O2 concentration. In the first case ( and ), the differential equation system appears to be the same as that without exogenous H2 O2, but [H2 O2]out ≠ 0. As , the constants A and B can be simplified as follows:
and
Moreover as and λ2 ≈ −(kenz + kdiff) with |λ1| < <|λ2| and |k′diff| < <|λ2|
therefore:
This bi-exponential function shows that changes in internal H2 O2 concentration follow two phases. There is a first phase, with a large rate constant −λ2 ≈ kenz + kdiff corresponding to the scavenging process, followed by a much slower second phase, with a low rate constant −λ1 > 0 corresponding to the diffusion from the external H2 O2 into the cell. This second phase is faster for larger numbers of cells because is highly dependent on cell concentration.
and as kenz ≫ kdiff we can approach .
This function therefore reaches a maximum as for:
This time is weakly dependent on cell numbers. For example, tmax ≈ 18 ms with 107 cells ml−1 and 11 ms with 109 cells ml−1.
The maximum internal H2 O2 concentration is approximately:
and as which can be approached by:
therefore
The balance between the elimination processes in the value of the maximal internal H2 O2 concentration is due to:
and
The maximal value of internal H2 O2 concentration is almost one tenth the initial exogenous H2 O2 concentration. This phenomenon reflects the role of the cell membrane in limiting diffusion. The need to diffuse across the cell membrane limits the influx of exogenous H2 O2 and this process is highly effective at low exogenous H2 O2 concentrations. The difference of one order of magnitude between exogenous [H2 O2]out and internal [H2 O2] arises because the membrane creates a rate-limiting step.
To illustrate this, we will investigate cell behaviour in the presence of 1.5 μM exogenous H2 O2.
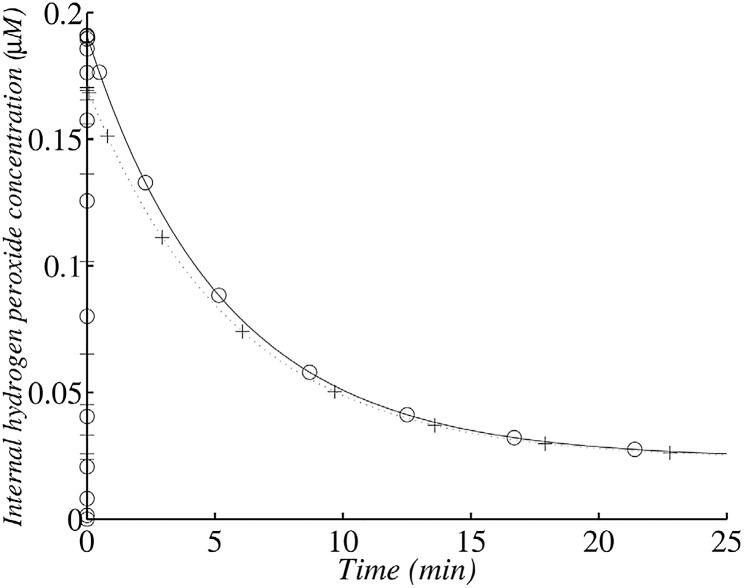
After its peak value (Fig 7), internal H2 O2 concentration decreases because of scavenging, but diffusion across cell membrane is the process which limits the rate of H2 O2 disappearance, therefore H2 O2 decrease is slow. The membrane creates a rate-limiting step.
Fig 7. Changes in internal H2 O2 concentration in the wild type after the addition of 1.5 μM exogenous H2 O2 with 1.45 × 10⁷ cells ml−1.
(+) corresponds to the analytical solution according to the simplified system and (∘) corresponds to the numerical solution of the whole model. The simulation was run with 1.45 × 10⁷ cells ml−1 (corresponding to an OD600 value of 0.1).
The maximal value is the approximate value of the first plateau proposed by Gonzalez-Flecha and Demple ([19]). It corresponds to the ratio of the rate of H2 O2 influx by diffusion to levels of scavenging and elimination by diffusion.
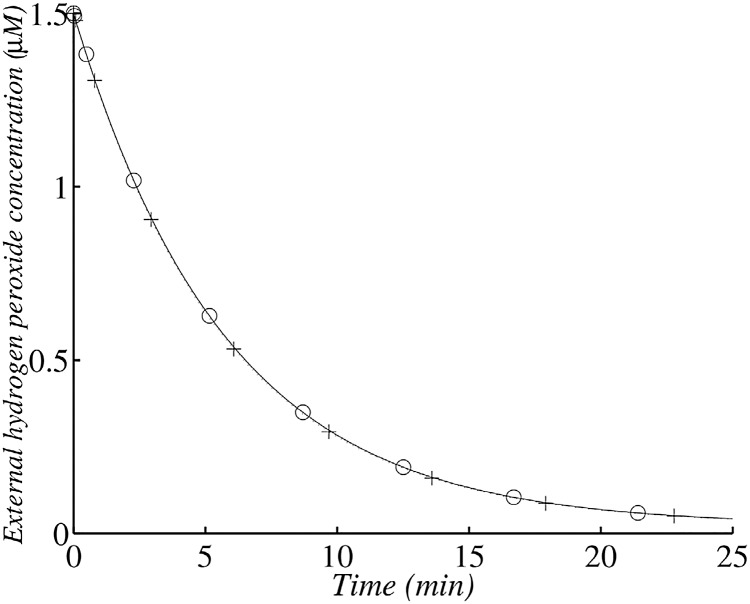
The experiments of Seaver and Imlay ([5]) showed that even non-induced cells scavenged micromolar concentrations of exogenous H2 O2 very quickly. For example, in a culture corresponding to 0.1 OD680 unit (corresponding to around 1.5 × 10⁷ cells ml−1), they found that the half time of H2 O2 in the medium was only 3.5 minutes, and that in a culture of 1.0 OD unit it was 20 s.
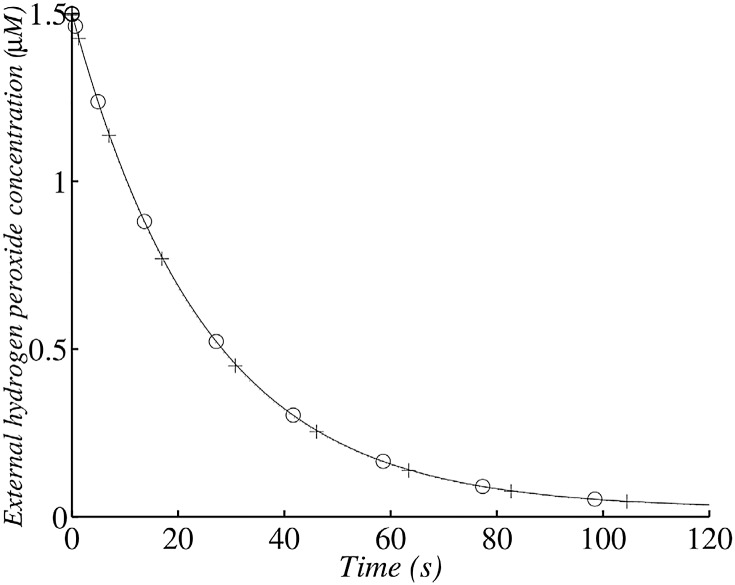
The exogenous H2 O2 concentration approximately follows the law outlined below:
where
Its exponential decrease depends on the rate constant, which is strongly dependent on cell numbers. The half-life of H2 O2 in the medium is approximately and is a decreasing function of cell number. So, with an OD680 of 0.1 (Fig 8) we find that t1/2 ≈ 210 s (3.5 min) and with an OD680 of 1 we find that t1/2 ≈ 21 s (Fig 9). A comparison of the experimental data and the analytical results indicates that our model describes the change in H2 O2 correctly.
Fig 8. Changes in external H2 O2 concentration in the wild type after the addition of 1.5 μM exogenous H2 O2 with 1.45 × 10⁷ cells ml−1.
(+) corresponds to the analytical solution according to the simplified system and (∘)) corresponds to the numerical solution of the whole model. The simulation was run with 1.45 × 10⁷ cells ml−1 (corresponding to an OD680 value of 0.1).
Fig 9. Changes in external H2 O2 concentration in the wild type after the addition of 1.5 μM exogenous H2 O2 with 2 × 10⁸ cells ml−1.
(+) corresponds to the analytical solution according to the simplified system and (∘)) corresponds to the numerical solution of the whole model. The simulation was run with 2 × 10⁸ cells ml−1 (corresponding to an OD680 value of 0.1).
Finally we examine Ahp activitys, with a high H2 O2 concentration. In the second case, when , corresponding to [H2 O2]out > 30 μM, the differential equation system can be written with a matrix structure:
where is the usual production reduced by Ahp activity on saturation; and (only Cat follows linear kinetics)
The study is similar to the previous one and internal H2 O2 concentration can be expressed as follows:
with the eigenvalue and λ2 ≈ −(k′enz + kdiff)
The maximum will be . With large concentrations of exogenous H2 O2, . This corresponds to the ratio of the rate of H2 O2 influx by diffusion to its elimination by Cat or by diffusion only.
This expression shows that the ratio between the initial exogenous H2 O2 concentration and the maximal internal H2 O2 concentration in the cell is:
The contribution of each elimination process to the value of the maximal internal H2 O2 concentration is:
We notice that: is equal to the ratio of elimination by diffusion across the membrane to the sum diffusion and scavenging. Of course, without membrane this ratio will equal 1, so thanks to membrane, enzymes have to face less H2 O2. Moreover, at high exogenous H2 O2 concentrations, this ratio is quite different from the one (i.e. 1/9) obtained at low concentration.
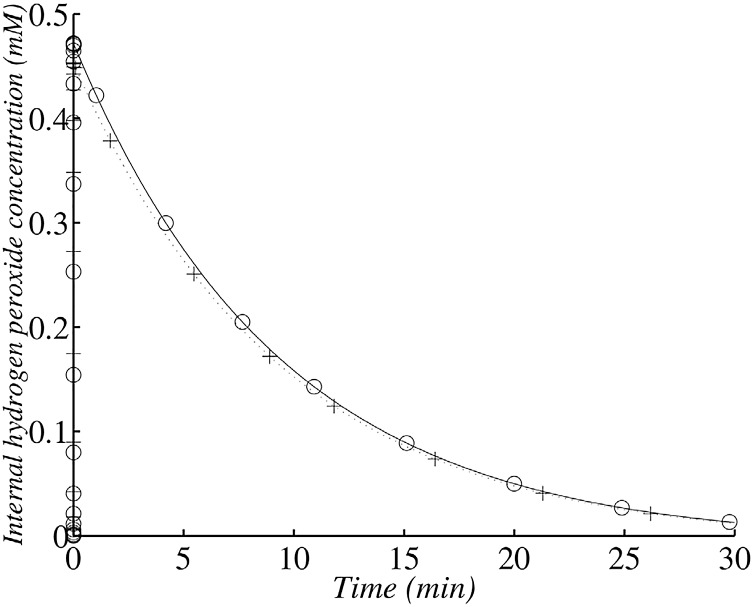
For instance, with an initial H2 O2 exogenous concentration [H2 O2]out0 = 1 mM, we obtain [H2 O2]max ≈ 0.45 mM (Fig 10). The maximal value is lower than the exogenous concentration because of diffusion and Cat activity, in this case Ahp is saturated and therefore plays a less important role.
Fig 10. Changes in internal H2 O2 concentration in the wild type after the addition of 1 mM exogenous H2 O2 with 1.45 × 10⁷ cells ml−1.
(+) corresponds to the analytical solution according to the simplified system and (∘)) corresponds to the numerical solution of the whole model.
The exogenous H2 O2 concentration approximately follows the law outlined below:
where
This exponential decrease depends on , which is a cell density function. The decrease rate of H2 O2 can be characterized by the half-time t1/2. This time is approximately the same for internal and external concentration, as internal and external H2 O2 decrease are strongly linked. For instance, with an addition of 1 mM of exogenous H2 O2 and with a cell density of 1.45 × 10⁷ cells ml−1, the half-live is approximately minutes, this results is consistent with Fig 10.
Moreover, as the exponential decrease in rate is dependent on , it ranges from zero when there is no scavenger (in a cat- mutant) to when scavengers have a non-limiting rate constant (much higher than kdiff). Thus, a 10-fold induction of Cat (experimentally observed in an Ahp(-) mutant) should increase the rate of medium detoxification of high H2 O2 concentrations only with a ratio of:
This result is consistent with the experimental data of Seaver and Imlay ([5]), who examined a doubling in efficiency when comparing the wild type and an Ahp(-) mutant.
It should also be noted that, in a Cat(-) mutant [H2 O2]max ≈ [H2 O2]out0 ≈ [H2 O2]0 (according to equation *). The maximum internal H2 O2 concentration rapidly increases the exogenous H2 O2 concentration and, as there is no Cat, this value remains constant, resulting in the rapid death of the surviving bacteria. The only way to protect Cat(-) mutant cells against high exogenous H2 O2 concentrations is to add the wild type to the medium. This experiment has been reported by Ma and Eaton ([20]). This point will be examined in the following subsection.
Consequence of defence switch in the primary scavenger
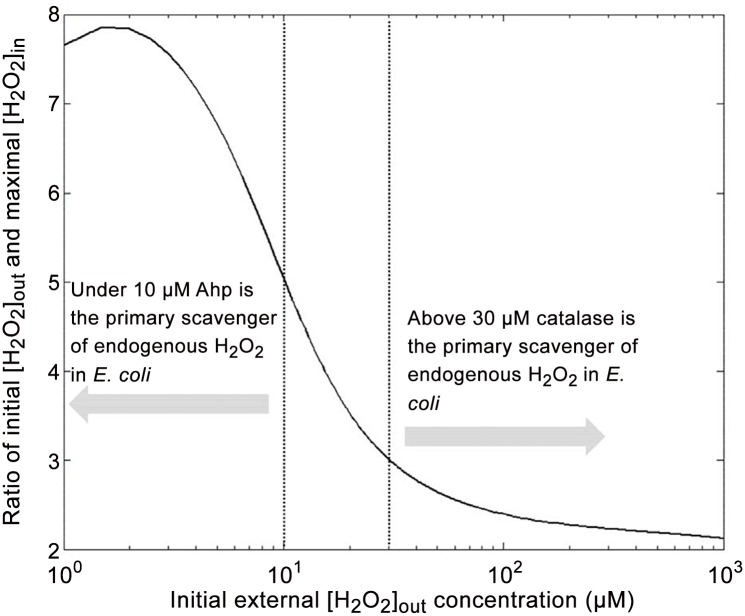
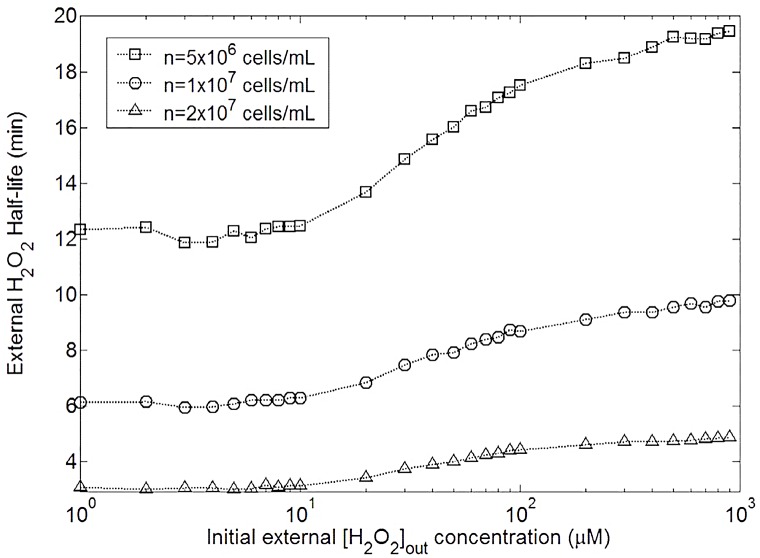
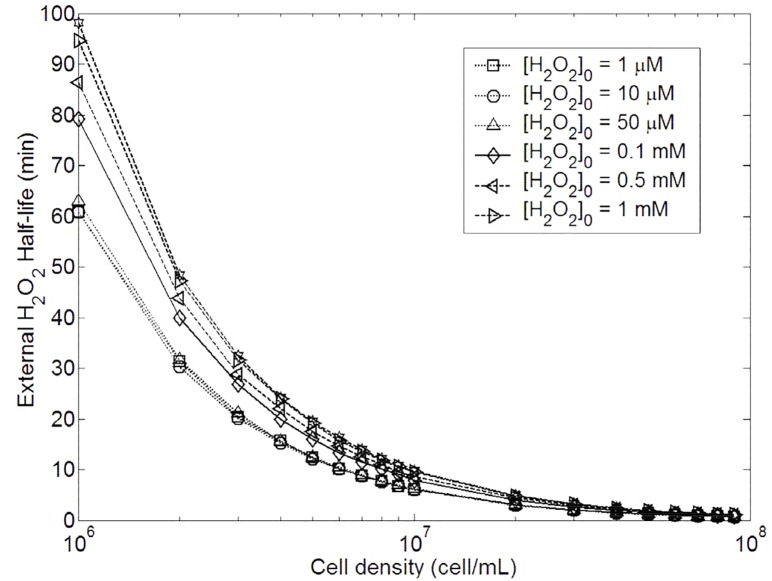
Fig 11 shows that increasing exogenous H2 O2 concentration involves the switch between the two primary scavengers. This switch has already been reported by Seaver and Imlay ([5]), but we show here another consequence. Actually this switch also triggers a change in the maximal internal H2 O2 concentration viewed by cell. We also find that this maximal internal concentration does not depend on the cell density. Nevertheless the temporal internal or external H2 O2 decrease strongly depends on cell density (as previously reported in Figs 7 and 8 or in the previous subsection). The switch between the two scavengers also occurs in Fig 12, actually it shows that H2 O2 half-life increases when shifting from Ahp to Cat while exogenous H2 O2 increases.
Fig 11. Changes in the ration between external initial H2 O2 concentration and internal maximal H2 O2 concentration in E. coli wild type.
The numerical solution presented in this graph was running according to the whole model without approximation.
Fig 12. Changes in external H2 O2 half-life with different initial external H2 O2 concentrations and 3 different cell densities in E. coli wild type.
The numerical solution presented in this graph was running according to the whole model without approximation.
This switch involves non-linear behaviour in half-life external H2 O2 dependence. Once again, Ahp seems to be more efficient but it only concerns external H2 O2 concentration under 10 μM. Above 30 μM, Cat plays the major role. Unlike maximal internal H2 O2, half-life depends on cell density, and the more concentrated cells are, the faster medium detoxification occurs. Nevertheless, as reported in Fig 13, under 10 μM (Ahp is the primary scavenger) the half-life does almost not depend on the initial exogenous H2 O2 concentration. Above 50 μM, Cat is the primary scavenger and the half-life depends on the initial exogenous H2 O2 concentration.
Fig 13. Changes in external H2 O2 half-life with cell densities and with 7 different initial external H2 O2 concentrations in E. coli wild type.
The numerical solution presented in this graph was running according to the whole model without approximation.
Cumulative internal H2 O2 concentration, rather than maximum internal H2 O2 concentration, is involved in the H2 O2-mediated death of bacterial cells
We investigated whether the decrease in E. coli survival with increasing exogenous H2 O2 concentration was linked to theoretical maximum internal H2 O2 concentration or to the rate of decrease in internal H2 O2 concentration. Indeed, a steep decrease indicates the perception of a low mean internal H2 O2 concentration by the cell. We investigated this aspect by carrying out experiments in which only one of these two parameters was affected at any one time. We therefore reproduced in silico the experiments of Ma and Eaton on H2 O2-mediated killing by E. coli wild-type (Cat(+)) or Cat(-) strains alone or by cultures of E. coli containing similar numbers of Cat(+) and Cat(-) bacteria. Cat(-) cells from cultures of Cat(-) cells alone or from equal numbers of Cat(-) and Cat(+) cells had similar peak H2 O2 concentrations but different rates of decrease in internal H2 O2 concentration. This result led us to evaluate the involvement of these two parameters. Moreover, as these experiments were performed with diluted and concentrated cell cultures, giving similar peak H2 O2 concentrations but different rates of decrease in internal H2 O2 concentration, we also assessed the effect of these two parameters on cell death.
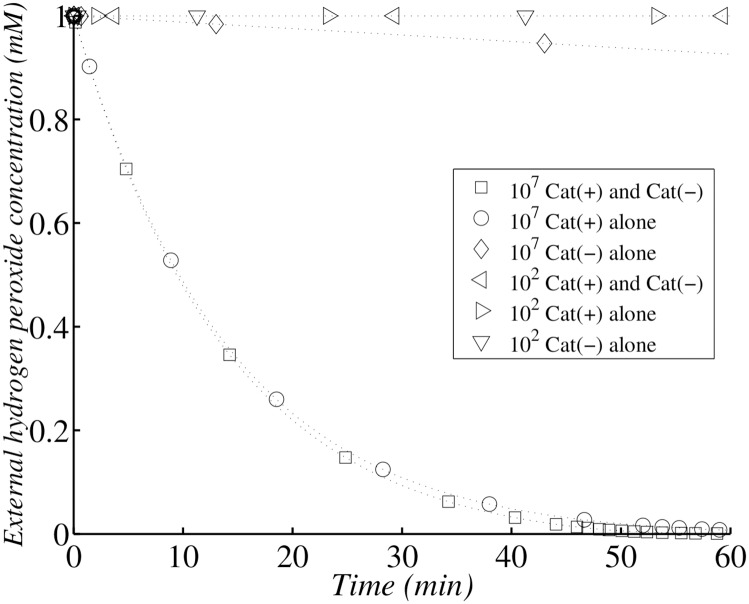
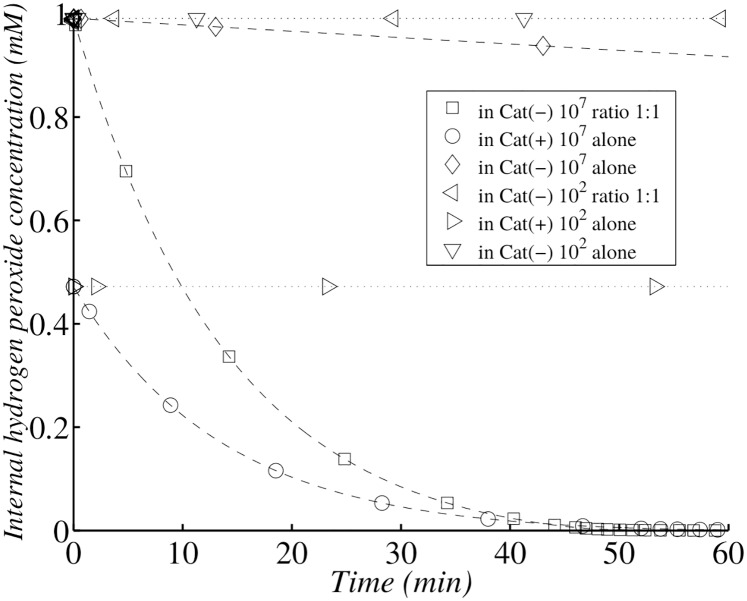
Simulations were performed with a dilute cell suspension (5 × 10² cells ml−1, Figs 14 and 15) and a higher density of cells (107 cells ml−1). Dilute populations of Cat(-) cells were unable to decrease exogenous H2 O2 concentration. Dilute populations of Cat(+) cells were also unable to detoxify the medium (Fig 14), whereas the dense population of Cat(+) cells halved exogenous H2 O2 concentration within 10 minutes (Fig 14). In a Cat(-) mutant, the maximum internal concentration of H2 O2 was only 2.5 times higher than that in Cat(+) cells, but survival rates were similar for dilute populations of both Cat(-) and Cat(+) cells ([20]). As a conclusion, the maximum internal concentration of H2 O2 is not a biological significant factor determining survival rate. Each single cell of the separate Cat(-) and Cat(+) populations had a maximum internal H2 O2 concentration of about the same magnitude, but only cells from the high-density populations survived in the Eaton experiments. Survival rate was always high when medium detoxification was activated rapidly by a dense Cat(+) cell population. Thus, even Cat(-) E. coli can survive if they are mixed with Cat(+) cells able to detoxify the medium. We conclude that H2 O2 scavengers do not protect individual cells against bulk-phase H2 O2, because the maximum internal concentration of H2 O2 did not differ significantly between Cat(-) and Cat(+) cells. The major difference between these two types of cells concerned the rate of decrease in exogenous H2 O2 concentration and, consequently, the rate of decrease in internal H2 O2 concentration (Fig 15). We conclude that mean internal H2 O2 concentration has a significant impact on bacterial survival, whereas maximum internal H2 O2 concentration does not. So H2 O2 action can be compared to that of the radiative exposure. This means of action is the opposite of the one generally observed for drugs. For instance, the maximum amount of paracetamol for adults is 4 grams per day with a regular intake of 0.5 gram over 3 days, but a single intake of 10 grams can lead to liver failure ([21]).
Fig 14. Simulation of Ma and Eaton experiment following external hydrogen peroxide concentration.
Simulation of H2 O2 external concentration change with dilute (102 cells per ml) Cat(-) E. coli alone () or Cat(+) E. coli alone (⊳) or admixed with an equal number of Cat(+), Cat(-) E. coli (⊲); and with concentrated (107 cells per ml) Cat(-) E. coli alone (◇) or Cat(+) E. coli alone (∘) or admixed with an equal number of Cat(+), Cat(-) E. coli (▫). At zero time, H2 O2 was added to a final concentration of 1.0 mM, and the bacterial suspension was then incubated at 37°C.
Fig 15. Simulation of Ma and Eaton experiment following internal hydrogen peroxide concentration.
Simulation of H2 O2 internal concentration change with dilute (102 cells per ml) Cat(-) E. coli alone () or Cat(+) E. coli alone (⊳) or admixed with equal numbers of Cat(+), Cat(-) E. coli (⊲); and with concentrated (107 cells per ml) Cat(-) E. coli alone (◇) or Cat(+) E. coli alone (∘) or admixed with equal numbers of Cat(+), Cat(-) E. coli (▫). At zero time, H2 O2 was added to a final concentration of 1.0 mM, and the bacterial suspension was then incubated at 37°C.
Conclusions
In the absence of exogenous stress
An analysis of the most significant kinetic reactions confirmed that steady-state internal concentration H2 O2 results from the balance between its production and a combination of Ahp degradation (78%), Cat degradation (12%) and membrane permeability (10%)
With exogenous H2 O2 stress
Prediction of H2 O2 levels
Under conditions of exogenous H2 O2 stress, H2 O2 elimination is dependent on cell density. However, nothing is currently known about internal H2 O2 concentration during H2 O2 exposure. Under these conditions, internal H2 O2 concentration results mostly from influx due to diffusion across the cell membrane, because endogenous production is negligible. Moreover, the rate of diffusion into the cell is governed by membrane permeability. The internal concentration of H2 O2 must therefore be lower than the exogenous H2 O2 concentration. Consequently, exogenous H2 O2 stress leads to an increase in internal H2 O2 concentration until a maximum is reached. This peak is followed by a decrease in H2 O2 concentration, due to elimination by the cells. We aimed to identify the most significant parameters (kinetic constants and cell concentrations) accounting for the maximum internal H2 O2 concentration value reached and for the characteristic time points (time required to reach half the nearest steady–state concentration) during increases and decreases in internal H2 O2 concentration.
Surprisingly, based on our model, the maximal internal H2 O2 concentrations reached in individual cells was not dependent on cell density, suggesting that there is no population protection effect. This maximum, which is reached in a few milliseconds, and its characteristic timing, are dependent solely on exogenous H2 O2 concentration and the three routes of elimination of this radical (membrane permeability, Ahp and Cat scavenging).
For estimation of the maximal internal H2 O2 concentration, we needed to distinguish internal H2 O2 concentrations for which Ahp activity predominated from those for which Cat activity predominated. For initial exogenous H2 O2 concentrations below 10 μM, the maximal internal H2 O2 concentration was defined by the balance between the exogenous H2 O2 diffusion rate and the three routes of elimination. In these conditions, Ahp was responsible for about 78% of all the H2 O2 eliminated. The peak internal H2 O2 concentration was almost one tenth the concomitant exogenous H2 O2 concentration. At initial exogenous H2 O2 concentrations of more than 30 μM, the peak internal H2 O2 concentration was defined by the balance between the exogenous H2 O2 diffusion rate and the possible elimination routes (Ahp activity being negligible due to saturation). Thus, peak H2 O2 concentrations are determined not only by Cat activity (55%), but also by membrane permeability (45%). Surprisingly, at the peak internal H2 O2 concentration sensed by each cell, limited membrane permeability served as a passive defence against H2 O2, to a similar extent to Cat. In these conditions, internal H2 O2 concentration was only half the concomitant exogenous H2 O2 concentration.
We then showed that the rate of decrease in internal H2 O2 concentration and its characteristic timing were dependent principally on cell density and membrane permeability. This decrease was mediated not only by enzyme activity, but also by H2 O2 transport from the extracellular to the intracellular medium. The global kinetics of the decrease in internal H2 O2 concentration was determined by the slowest step in the process, diffusion across the membrane, which was limited by cell membrane permeability. Finally, similar conclusions were reported for exogenous H2 O2 concentration. The Imlay group has shown that the elimination rate for exogenous H2 O2 is much lower in intact cells than in cell extracts, indicating that diffusion across the cell membrane is the limiting process. This observation is consistent with what is known about the most significant kinetic parameters, including the major role played by the cell membrane. Indeed, diffusion across the cell membrane involves the bridging of a gap between internal and extracellular concentrations. This gap provides protection against the oxidizing extracellular medium, but it also decreases the efficiency with which E. coli can decrease the H2 O2 concentration of the extracellular medium (Fig 9). The kinetics of extracellular decomposition is almost exclusively diffusion-dependent and, therefore, very slow. As expected, the rate of H2 O2 disappearance (intra or extracellular) was greater at higher cell densities.
Instead of conducting real-world experiments, using simulations is generally cheaper, safer and sometimes more ethical. Simulations can also be conducted faster than experiments in real time. For instance, at the University of Pittsburgh School of Pharmacy, high-fidelity patient simulators are used in addition to therapeutics ([22]). Of course simulations have to be confronted with real experiments to test their robustness and to be improved. Our model is one step in a global modelling of the E. coli ROS dynamic.
“Remember that all models are wrong; the practical question is how wrong do they have to be to not be useful.”
— Box and Draper, Empirical Model-Building, p. 74
Supporting Information
(PDF)
Acknowledgments
Our thanks go to A. Dumont, E. Fugier, P. Caillet and K. Wilson-Costa for carefully proof the manuscript.
Data Availability
All relevant data are within the paper and its Supporting Information files.
Funding Statement
This work was supported by ANR (Agence National de la Recherchegrant) (ANR-12-BS07-0022 ROSAS). The funders had no role in study design, data collection and analysis, decision to publish, or preparation of the manuscript.
References
- 1. Barry Halliwell, John M C Gutteridge. Free radicals in biology and medicine. Clarendon Press; 1989. [Google Scholar]
- 2. Kehrer JP. Free radicals as mediators of tissue injury and disease. Crit Rev Toxicol. 1993;23(1):21–48. 10.3109/10408449309104073 [DOI] [PubMed] [Google Scholar]
- 3. Uhl L, Gerstel A, Chabalier M, Dukan S. Hydrogen peroxide induced cell death: One or two modes of action? Heliyon. 2015;1(4):Article e00049 10.1016/j.heliyon.2015.e00049 [DOI] [PMC free article] [PubMed] [Google Scholar]
- 4. Seaver LC, Imlay JA. Hydrogen peroxide fluxes and compartmentalization inside growing Escherichia coli. J Bacteriol. 2001. December;183(24):7182–7189. 10.1128/JB.183.24.7182-7189.2001 [DOI] [PMC free article] [PubMed] [Google Scholar]
- 5. Seaver LC, Imlay JA. Alkyl hydroperoxide reductase is the primary scavenger of endogenous hydrogen peroxide in Escherichia coli. J Bacteriol. 2001. December;183(24):7173–7181. 10.1128/JB.183.24.7173-7181.2001 [DOI] [PMC free article] [PubMed] [Google Scholar]
- 6. Imlay JA, Linn S. Bimodal pattern of killing of DNA-repair-defective or anoxically grown Escherichia coli by hydrogen peroxide. J Bacteriol. 1986. May;166(2):519–527. [DOI] [PMC free article] [PubMed] [Google Scholar]
- 7. Imlay JA, Linn S. DNA damage and oxygen radical toxicity. Science. 1988. June;240(4857):1302–1309. 10.1126/science.3287616 [DOI] [PubMed] [Google Scholar]
- 8. Harrison J, Leggett R, Lloyd D, Phipps A, Scott B. Polonium-210 as a poison. J Radiol Prot. 2007. March;27(1):17–40. 10.1088/0952-4746/27/1/001 [DOI] [PubMed] [Google Scholar]
- 9. Gillespie DT. A general method for numerically simulating the stochastic time evolution of coupled chemical reactions. Journal of Computational Physics. 1976;22(4):403–434. 10.1016/0021-9991(76)90041-3 [DOI] [Google Scholar]
- 10. Gillespie DT. Exact stochastic simulation of coupled chemical reactions. J Phys Chem. 1977;81(22):2340–2361. 10.1021/j100540a008 [DOI] [Google Scholar]
- 11. Koppenol WH. The Haber-Weiss cycle–70 years later. Redox Rep. 2001;6(4):229–234. 10.1179/135100001101536373 [DOI] [PubMed] [Google Scholar]
- 12. Liochev SI, Fridovich I. The Haber-Weiss cycle–70 years later: an alternative view. Redox Rep. 2002;7(1):55–57. 10.1179/135100002125000190 [DOI] [PubMed] [Google Scholar]
- 13. Verhulst PF. Recherches mathématiques sur la loi d’accroissement de la population. Nouv mém de l’Academie Royale des Sci et Belles-Lettres de Bruxelles. 1845;18:1–41. [Google Scholar]
- 14. Verhulst PF. Deuxième mémoire sur la loi d’accroissement de la population. Mém de l’Académie Royale des Sci, des Lettres et des Beaux-Arts de Belgique. 1847;20:1–32. [Google Scholar]
- 15. Demple B, Halbrook J. Inducible repair of oxidative DNA damage in Escherichia coli. Nature. 1983;304(5925):466–468. 10.1038/304466a0 [DOI] [PubMed] [Google Scholar]
- 16. Chang DE, Smalley DJ, Conway T. Gene expression profiling of Escherichia coli growth transitions: an expanded stringent response model. Mol Microbiol. 2002. July;45(2):289–306. 10.1046/j.1365-2958.2002.03001.x [DOI] [PubMed] [Google Scholar]
- 17. Imlay JA, Fridovich I. Assay of metabolic superoxide production in Escherichia coli. J Biol Chem. 1991. April;266(11):6957–6965. [PubMed] [Google Scholar]
- 18. Polynikis A, Hogan SJ, di Bernardo M. Comparing different ODE modelling approaches for gene regulatory networks. J Theor Biol. 2009. December;261(4):511–530. 10.1016/j.jtbi.2009.07.040 [DOI] [PubMed] [Google Scholar]
- 19. Gonzalez-Flecha B, Demple B. Metabolic sources of hydrogen peroxide in aerobically growing Escherichia coli. J Biol Chem. 1995. June;270(23):13681–13687. 10.1074/jbc.270.23.13681 [DOI] [PubMed] [Google Scholar]
- 20. Ma M, Eaton JW. Multicellular oxidant defense in unicellular organisms. Proc Natl Acad Sci USA. 1992. September;89(17):7924–7928. 10.1073/pnas.89.17.7924 [DOI] [PMC free article] [PubMed] [Google Scholar]
- 21. Dart RC, Erdman AR, Olson KR, Christianson G, Manoguerra AS, Chyka PA, et al. Acetaminophen poisoning: an evidence-based consensus guideline for out-of-hospital management. Clin Toxicol (Phila). 2006;44(1):1–18. 10.1080/15563650500394571 [DOI] [PubMed] [Google Scholar]
- 22. Lin K, Travlos DV, Wadelin JW, Vlasses PH. Simulation and introductory pharmacy practice experiences. Am J Pharm Educ. 2011. December;75(10):209 10.5688/ajpe7510209 [DOI] [PMC free article] [PubMed] [Google Scholar]
Associated Data
This section collects any data citations, data availability statements, or supplementary materials included in this article.
Supplementary Materials
(PDF)
Data Availability Statement
All relevant data are within the paper and its Supporting Information files.


