

Collection of metabolic response data in a standardized fashion will greatly aid future pooling of study data and meta-analyses to allow the best determination of the predictive and prognostic value of the PET Response Criteria in Solid Tumors (PERCIST 1.0) in a variety of clinical settings and with a variety of treatments.
Abstract
Positron Emission Tomography (PET) Response Criteria in Solid Tumors (PERCIST 1.0) describes in detail methods for controlling the quality of fluorine 18 fluorodeoxyglucose PET imaging conditions to ensure the comparability of PET images from different time points to allow quantitative expression of the changes in PET measurements and assessment of overall treatment response in PET studies. The steps for actual application of PERCIST are summarized. Several issues from PERCIST 1.0 that appear to require clarification, such as measurement of size and definition of unequivocal progression, also are addressed.
© RSNA, 2016
Introduction
Positron Emission Tomography (PET) Response Criteria in Solid Tumors (PERCIST 1.0) were introduced in 2009 as guidelines for systematic and structured assessment of response to therapy with fluorine 18 fluorodeoxyglucose (FDG) PET in patients with cancer, with suggested application in clinical trials and, potentially, in the clinical practice of PET reporting (1). PERCIST 1.0 describes in detail methods for controlling the quality of FDG PET imaging conditions to ensure the comparability of PET images from different time points and to allow quantitative expression of the changes in PET measurements and assessment of the overall response according to PET results. PERCIST has been referenced widely, and authors of several articles (2–6) have reported that the metrics described in PERCIST 1.0 are associated with clinical outcomes after therapy in patients with several different types of cancer, including small-cell lung cancer, colorectal cancer, non-Hodgkin lymphoma, esophageal cancer, and the Ewing sarcoma family of tumors. However, many investigators have questions about the implementation of PERCIST 1.0, given that the proposed criteria were embedded in a lengthy manuscript. Here, we briefly summarize the steps for actual application of PERCIST 1.0. We also address several issues from PERCIST 1.0 that appear to require clarification.
Required Parameters for Baseline FDG PET Study
Measurement of the “hottest” single tumor and background area on images, usually of the liver, is required at baseline. The background data are measured to help verify that a PET study was performed properly from a technical standpoint and to establish the appropriate threshold for the standardized uptake value corrected for lean body mass (SUL) evaluation of the lesion at baseline. With the use of PERCIST 1.0, a single target lesion at each time point is selected as the primary parameter on the basis of the concept that the most metabolically active tumor focus corresponds to the most aggressive portion of the tumor, which is the most clinically important area. These criteria are similar to the Response Evaluation Criteria in Solid Tumors 1.1 (7), for which only a few tumor foci are measured in a manner that accurately reflects tumor biology. With PERCIST, a larger region of interest, the peak standardized uptake value corrected for lean body mass (SULpeak), is chosen instead of the widely used single-pixel maximum standardized uptake value, because the size of a single voxel varies considerably among PET systems and results in various noise levels in the metric, depending on the filtering. The maximum standardized uptake also is subject to upward bias in low-count studies in comparison with SULpeak (8).
Background Activity
For background activity, a 3-cm diameter spherical volume of interest (VOI) is placed in the right side of liver, midway between the dome and inferior margin, excluding central ducts and vessels (Fig 1). The SUL and the standard deviation of the SUL in the spherical VOI are measured (to 2 significant digits). Most commercial software computes the mean of a chosen VOI automatically by averaging the standardized uptake value for all pixels included in the VOI. FDG does not accumulate substantially in white fat when the study is performed in the fasting state, and hepatic SUL is typically more consistent from patient to patient than is total body mass standardized uptake value (9). There are different methods of computing the lean body mass. We suggest the use of the equation by James (10) for men:
where LBW is lean body weight, W is weight in kilograms, and H is height in centimeters. For women, the equation is as follows:
Figure 1a:
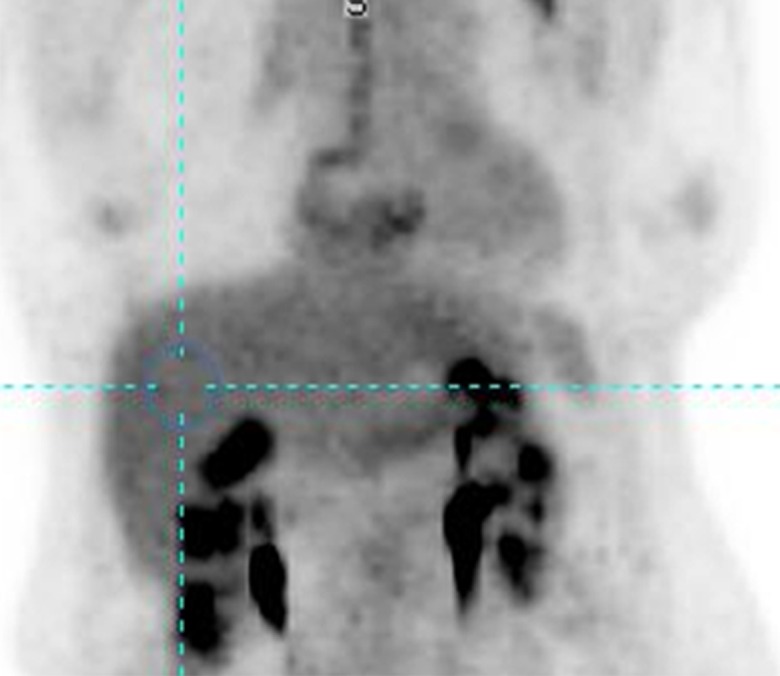
(a) Maximum intensity projection image and (b) axial PET/CT fusion image show placement of 3-cm–diameter spherical VOI in right side of liver (blue circle) to measure background.
Figure 1b:
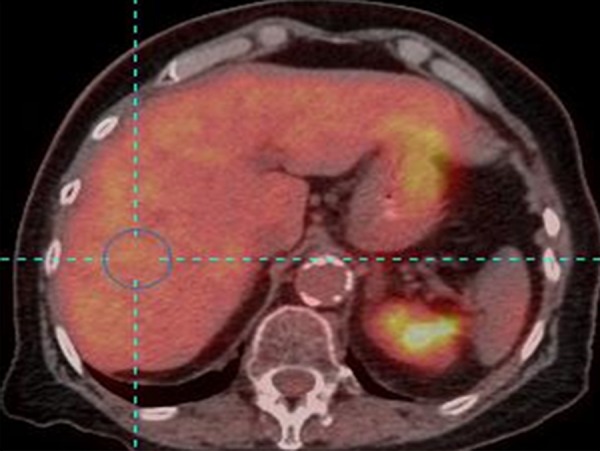
(a) Maximum intensity projection image and (b) axial PET/CT fusion image show placement of 3-cm–diameter spherical VOI in right side of liver (blue circle) to measure background.
However, in the future, it is quite likely that the imaging community will move to adopt the Janmahasatian formulations, if they are available commercially (11). This method is less subject to overcorrection due to the influence of extreme obesity (which is a challenge with the James method) and has been incorporated recently into the Uniform Protocols in Clinical Trials guidelines for PET imaging with FDG (12). Measurement of background liver activity is compromised if a patient has metastatic disease such that a 3-cm–diameter spherical VOI cannot be drawn without including obvious metastatic tumor.
Diseased liver does not mean fatty liver or liver cirrhosis for the purpose of measurement of the background with PERCIST. If the liver is diseased, the mean background SUL and standard deviation can be measured in a cylindrical VOI with a diameter of 1 cm and a long axis (parallel to the descending aorta) of 2 cm in the center of the descending thoracic aorta, excluding the aortic wall, because the wall may be FDG avid due to inflammatory atherosclerosis (13).
Target Lesion at Baseline
The SULpeak is measured in the single hottest tumor. A 1-mL spherical VOI is placed at the focus of the hottest tumor. The 1-mL sphere with the highest mean SUL value can be computed automatically with software or manually. A visual inspection of the PET images typically is required to help identify FDG-avid foci that are most consistent with tracer uptake in malignant lesions. Normal FDG-containing structures such as the renal pelvis should not be quantified. The SULpeak can be identified manually by moving a fixed 1-mL spherical VOI iteratively over tumor foci with visually increased FDG uptake and finding the focus that gives the highest mean SUL value. The SULpeak 1-mL VOI is often, but not always, centered on the voxel with the highest maximum SUL, and the SULpeak VOI sometimes does not even contain the pixel with the maximum SUL (Fig 2). We recommend that the imaging plane and coordinates of the lesion be recorded and that an image of the lesion with the VOI placed be saved to help identify the lesion for subsequent studies.
Figure 2:
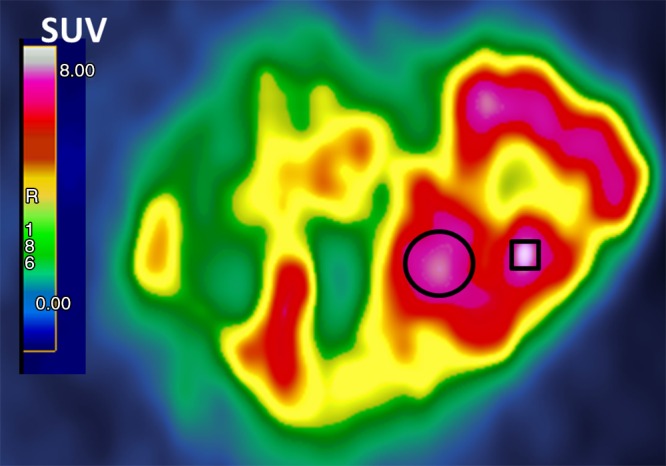
Magnified transverse FDG PET image shows a single large heterogeneous tumor. SULpeak was the mean from a three-dimensional 1-mL sphere approximately 1.2 cm in diameter in tumor area, yielding highest average SUL (represented here as circle instead of sphere). SULpeak does not necessarily contain maximum standardized uptake value (SUV, square), which is the highest single pixel value.
In principle, a 1.2-cm–diameter spherical VOI results in a volume of approximately 1 mL. However, the extent to which this can be achieved in practice depends on the image voxel size and the implementation details of the VOI computing software. The volume of the VOI also may depend slightly on its position, because the same VOI can result in slightly different volume measurements, depending on how it is positioned relative to the centers of the voxels. Software that supports voxel subsampling is recommended, although adequate approximation of the 1-mL VOI usually can be achieved with simple VOI tools.
For a tumor to be measurable at baseline, the SULpeak must be greater than or equal to one and a half times the mean SUL in the 3-cm diameter spherical VOI plus two times its standard deviation to have a minimum threshold for evaluation. A minimal level of tumor uptake at baseline is proposed to ensure that a decline in FDG uptake with therapy can be measured in the dynamic range of the imager (ie, that it remains higher than background uptake), to decrease the likelihood that a change is due to chance, and to minimize overestimation of response or progression. When the SULpeak of the tumor at baseline is lower than this threshold, the tumor is considered not measurable with PERCIST 1.0. Note that the PERCIST-proposed measurability level refers only to the baseline study. When the activity in the descending thoracic aorta is measured instead of that in the liver, the minimum threshold for evaluation is two times the mean SUL of the thoracic aorta in a tubular VOI plus two times its standard deviation. This is proposed because blood SUL is typically lower than liver SUL.
If the target lesion is not measurable at baseline, it should be noted that the measurement of the lesion is below the minimum threshold for evaluation. These results should be segregated from data that are fully measurable for analysis with PERCIST, but pooling these data for exploratory analysis should be considered. The optimal minimum threshold for reliable evaluation of the lesion is not known. Risk of low FDG uptake for quantitative analysis includes the limited ability of lesions with low FDG uptake to show a decrease in SUL of 30%, because background activity may contribute substantially to the residual signal intensity. When there is a new lesion or unequivocal progression in the follow-up study, a response of progression can be designated even if the target lesion at baseline does not meet the minimum threshold for evaluation. Note that the threshold for evaluability of the target lesion does not apply to the follow-up study, because the tumor metabolism in the follow-up study may be diminished to below the threshold for the baseline study as a result of effective therapy.
Required Parameters for Follow-up FDG PET Study
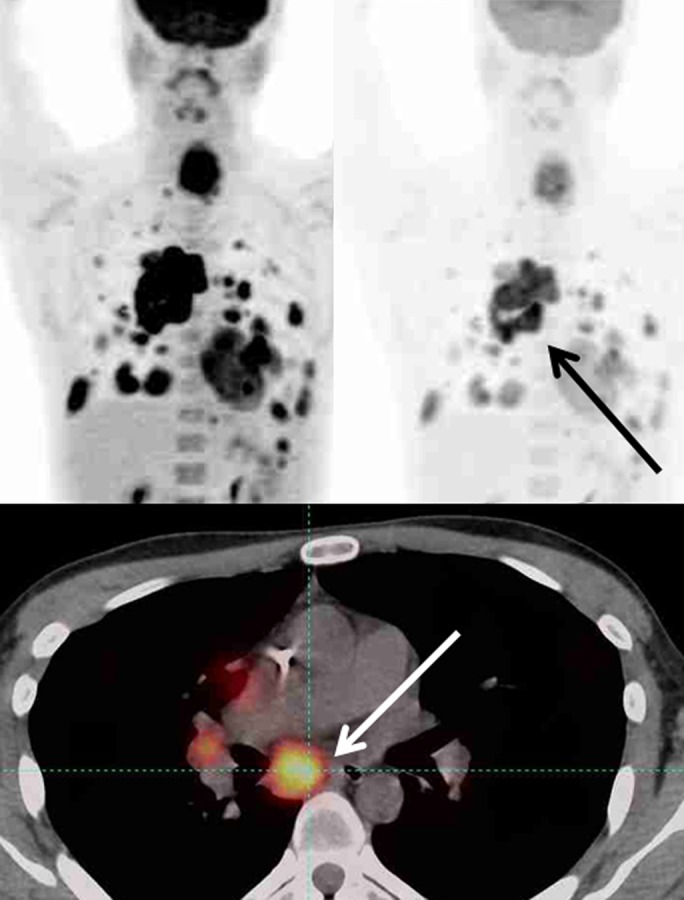
The follow-up imaging and all available clinical information should be considered fully in the selection of the target tumor lesion. Known areas of iatrogenic or benign FDG uptake should not be selected as the target lesion, even when such a focus has the highest SULpeak value. PERCIST requires the reader to select the hottest tumor at each time point, and the target lesion selected at baseline may not the hottest tumor at follow-up (Fig 3).
Figure 3a:
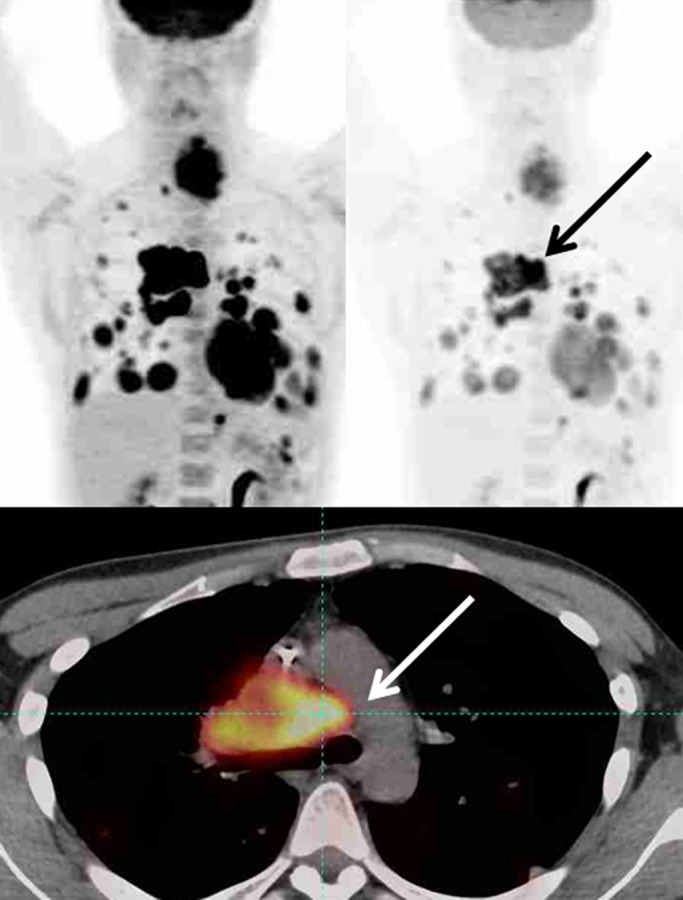
Maximum intensity projection images (top row) in two different SUL windows and axial fusion images (bottom row) in a man with sarcoma and multiple distant metastatic lesions. SULpeak was measured from the hottest tumor at each time point and can be different at baseline and follow-up. (a) Hottest tumor SULpeak focus was located in right lower paratracheal lymph node at baseline (arrows). (b) After therapy, subcarinal lymph node was hottest tumor (arrows).
Figure 3b:
Maximum intensity projection images (top row) in two different SUL windows and axial fusion images (bottom row) in a man with sarcoma and multiple distant metastatic lesions. SULpeak was measured from the hottest tumor at each time point and can be different at baseline and follow-up. (a) Hottest tumor SULpeak focus was located in right lower paratracheal lymph node at baseline (arrows). (b) After therapy, subcarinal lymph node was hottest tumor (arrows).
Assessable FDG PET Study and Measurable Target Lesion
To be assessable, mean SUL and imaging conditions of the liver must be stable. Image acquisition methods consistent with the recommendations of the National Cancer Institute and the Netherlands protocol for multicenter trials are recommended to ensure the correct performance of PET and to minimize variability (14,15). Compliance with the RSNA Quantitative Imaging Biomarkers Alliance FDG PET profile, PERCIST 1.0, and the Uniform Protocols in Clinical Trials FDG profile is suggested (12).
To be assessable, differences between baseline and follow-up SUL in the liver must be (a) less than or equal to 20% of the larger of the two liver measurements and (b) less than or equal to 0.3 SUL units. The imaging conditions that allow for comparison are as follows: (a) The difference between the injection-to-imaging time of the baseline study and to that of the follow-up study should be less than or equal to 15 minutes. (b) The injection- to-imaging start time for both baseline and follow-up imaging should be greater than or equal to 50 minutes and less than or equal to 70 minutes. The recent Uniform Protocols in Clinical Trials and RSNA Quantitative Imaging Biomarkers Alliance profiles both specify minimum uptake times of 55 minutes. (c) The same imager should be used at the same site. (d) The same acquisition protocol, reconstruction protocol, and version of software should be used. (e) The difference between the injected dose of FDG (in megabecquerels) for the baseline study and that for the follow-up study should be less than or equal to 20%. (f) Patients should fast for at least 4 hours before administration of FDG, and serum glucose levels must be less than 200 mg/dL. If these imaging conditions are not met, it should be noted in the report. Ideally, the decision on how to handle data that are not compliant with PERCIST should be made at the time of study design. Separate analysis is suggested before pooling.
Objective Response
PERCIST encourages recording of the percentage of change in tumor metabolism as a continuous variable with notation of the number of weeks since treatment was begun. The percentage of change in target lesion(s) is computed as:
where FTLSULpeak is the SULpeak of the follow-up target lesion and BTLSULpeak is the SULpeak of the baseline target lesion. This approach lends itself well to construction of waterfall plots and treatment-, disease-, and time-specific therapeutic efficacy thresholds. However, for convenience, PERCIST also proposes grouping the therapeutic responses into four categories, paralleling the Response Evaluation Criteria in Solid Tumors and the European Organization for Research and Treatment of Cancer recommendations (16). The continuous quantitative data from the measurements should be collected for future studies to determine how best to predict clinical outcomes. The PERCIST categories for response to treatment are complete metabolic response, partial metabolic response, stable metabolic response, and progressive disease.
PERCIST Categories for Response to Treatment
To be categorized as a complete metabolic response, a target lesion must show complete resolution of FDG uptake, with FDG uptake less than the mean SUL of the liver and indistinguishable from that of the surrounding background. This requires data for all other lesions to return to background levels and that no new FDG-avid lesions in a pattern typical of cancer appear. When no FDG-avid tumor is visible, the mean SULpeak of the anatomic location situated as close as possible to the site of the original tumor should be measured. A normal structure with high FDG uptake, such as a bowel loop that occupies the site of the original target lesion, should be avoided in the measurement of results of the follow-up study. A complete metabolic response according to PERCIST 1.0 does not require the SULpeak to decrease to zero.
For a partial metabolic response, a decrease of greater than or equal to 30% and of at least 0.8 SUL units must be shown between the most intense evaluable lesion at baseline and the most intense lesion at follow-up (not necessarily the same lesion). This also requires a decrease in SULpeak of greater than or equal to 0.8 SUL units in the target lesion, no new FDG-avid lesions in a pattern typical of cancer, no identifiable increase in size greater than 30% in the target lesion, and no SULpeak or identifiable increase in size greater than 30% in a nontarget lesion. For categorization as stable metabolic disease, an increase or decrease in SULpeak of less than 30% is required. For categorization as progressive metabolic disease, lesions must show an increase of greater than or equal to 30% and an increase of at least 0.8 SUL units in a target lesion or development of a new lesion or more than one new lesions. This can include new FDG-avid lesions in a pattern typical of cancer, an increase in SULpeak or an identifiable anatomic increase in size greater than or equal to 30% in target lesions, or unequivocal progression in nontarget lesions.
The response (percentage of change in SULpeak and time in weeks after treatment began) should be included. For example, for a complete metabolic response (90% decrease, 4 weeks), time in weeks is calculated with the date of the start of therapy as day 1. So, days 1–7 are considered week 1, and days 8–14 are week 2, and so forth. For progressive metabolic disease, whether new lesions are present or absent, the number of weeks into therapy and the number of new lesions should be reported (4). For progressive metabolic disease, (35% increase, 4 weeks, five new lesions), when a nontarget lesion behaves differently from the baseline target lesion, further consideration is required to decide on the response (Table 1). Duration of overall response is calculated as the date of the best response to the date when recurrent or progressive disease was first noted.
Table 1.
Scenarios for Target and Nontarget Lesions Showing Different Responses at Follow-up and Overall Response Synthesis
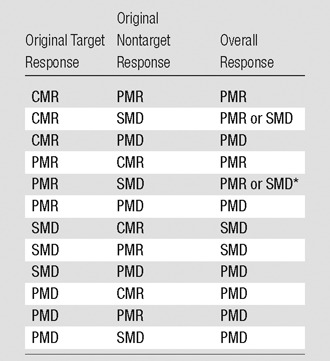
*The choice between partial metabolic response (PMR) and stable metabolic disease (SMD) depends on the difference between the percentage of change in SUL and absolute SUL. If the decrease from baseline to follow-up is sufficient, the response is PMR. If the decrease is less than 30% or 0.8 SUL units, the response is SMD. PMD = progressive metabolic disease, CMR = complete metabolic response.
Unresolved and Partly Resolved Issues
There are multiple aspects of PET response assessment that have not been addressed fully in PERCIST 1.0 because of a lack of sufficient data. Some of the issues that must be resolved are described in the sections that follow. Accumulation of an imaging-data warehouse with PERCIST-compliant data, including various tumors, therapies, and outcomes, is necessary for future validation.
Size Measurement
It is very rare, in our experience, for a tumor to show a decline in FDG uptake while the tumor size increases. Routine measurement of tumor size is not required for PERCIST, but measurement could be made when a visually noticeable increase in size accompanies a decrease in FDG uptake. This disparity between FDG uptake and tumor size can occur in cystic tumors, with a delayed interval from baseline imaging until therapy, or with intratumoral bleeding. This also can occur if there is a substantial delay between baseline PET and posttreatment PET. In such cases, the tumor may have grown before therapy and then may have been treated effectively, resulting in increased size but decreased FDG uptake from that of the baseline study. We suggest that the baseline PET examination for treatment response be obtained within 21 days of starting a study to minimize this possibility.
Nontarget Lesions
Interpretation of changes in FDG uptake in a nontarget lesion that behaves differently from the target lesion is sometimes problematic. Readers may miss change greater than 30% in SULpeak of a nontarget lesion, because only the measurement of the single hottest target lesion is required for routine PERCIST assessment. An increase of 30% in a nontarget lesion is not currently called progression in PERCIST 1.0. However, measurement of a nontarget lesion is suggested when the FDG uptake intensity or its extent is visually prominent. In some instances, the nontarget lesion from a baseline study that responds poorly or increases modestly in uptake may become the target (hottest) lesion in the follow-up study and may become measurable.
Unequivocal Progression
For assessment of overall response, nonprogressive metabolic disease in nontarget lesions does not reduce partial metabolic response in target lesions, as currently suggested in PERCIST 1.0. However, PERCIST 1.0 does not include a definition of unequivocal progression of a nontarget lesion with a set percentage or absolute requirement for unit change. Application of stricter criteria for the progression of nontarget lesions may be necessary. For example, a patient may show decreased FDG uptake in a target lesion, with SULpeak decreasing from 12 to 8. However, this patient may have an additional nontarget lesion that shows increased FDG uptake, with SULpeak rising from 2.0 to 6.0. Should the reader conclude that this patient’s response is partial metabolic response (since the target lesion improved) or consider the nontarget lesion to have progressed unequivocally and give a response of progressive metabolic disease? We suggest the latter approach is likely correct, because a change in SUL from 2.0 to 6.0 is, in our estimation, unequivocal progression. Although it is not specified in PERCIST 1.0, the criteria for unequivocal progression in a nontarget lesion must be at least as much as the target-to-target lesion changes, a 30% and 0.8 SUL units increase, and possibly higher. There remains a gap in our literature on the importance of tumor metabolic progression and outcomes.
New Lesions
Categorization of a new lesion is not always clear cut. The results of a retrospective review may show that a lesion was present but missed at baseline because of small size or low FDG uptake. Counting new lesions also could be subjective when the new lesion is coalesced with an old lesion or expands along the pleura or the surface of other organs. Clinical judgment should be used for identifying a new lesion, with best-effort estimation of the number of new lesions. We propose that a lesion be considered new when it is first visualized, even if, in retrospective review, it is deemed to have been faintly present earlier. Similarly, the timing of the appearance of the new lesion should be when it was first unequivocally identified.
Defining the Peak Value
Software from different vendors incorporates different methods to compute the peak value. There is not enough evidence currently to favor evaluation of the whole pixel or of subsegmented parts of the pixel (Fig 4). With image filtering and resolution, it is unlikely to make a major difference in results. Regarding the positioning of the 1-mL VOI, when the hottest tumor focus is in the periphery of the tumor, measuring the highest peak value may sometimes require the VOI to be positioned partly outside of the predetermined tumor boundary. Such an example can be seen in a tumor with central necrosis (Fig 5). When the tumor boundary is determined by using an anatomic image, the absolute standardized uptake value threshold, or the percentage of the maximum threshold, there is no guarantee that the pixel immediately outside of the determined tumor boundary is background and not part of the tumor. In such instances, the maximum SUL also should be recorded (it is often highly correlated with the SULpeak).
Figure 4a:

Graphs show that quantification of whole or subsegmented pixels results in different area measurements. (a) When the whole pixel is considered, each box represents a single pixel, blue line represents tumor boundary, and only shaded pixels are included for quantification. (b) When pixels are subsegmented to quadrants in this graph, the area included for quantification is different from that in a. Smaller green boxes represent newly included area, and red lines represent pixel quadrants that would be excluded from quantification.
Figure 5a:

Graphs show two-dimensional comparison of two different regions of interest. (a) Region of interest (average standardized uptake value [SUV ], 7.78) is inside tumor boundary (bold black line outside of red squares). (b) Region of interest includes one pixel outside tumor boundary, resulting in higher average value (average SUV, 8.33).
Figure 4b:

Graphs show that quantification of whole or subsegmented pixels results in different area measurements. (a) When the whole pixel is considered, each box represents a single pixel, blue line represents tumor boundary, and only shaded pixels are included for quantification. (b) When pixels are subsegmented to quadrants in this graph, the area included for quantification is different from that in a. Smaller green boxes represent newly included area, and red lines represent pixel quadrants that would be excluded from quantification.
Figure 5b:

Graphs show two-dimensional comparison of two different regions of interest. (a) Region of interest (average standardized uptake value [SUV ], 7.78) is inside tumor boundary (bold black line outside of red squares). (b) Region of interest includes one pixel outside tumor boundary, resulting in higher average value (average SUV, 8.33).
Although a single target lesion is chosen for assessment of treatment response according to PERCIST, with the goal of simplicity and to reflect the characteristics of the most active tumor, the optimal number of lesions to evaluate remains uncertain. Measuring the tumor volume of the target tumor, of all tumors, and of the most metabolically active portion of the tumor seems important, and thus, total lesion volume and its metabolic activity may be explored, and multiple tumors may be measured (Table 2). Automated tools to define the total volume of the tumor in the body with PET (metabolic tumor volume) and total lesion glycolysis are being used but require additional study. Table 2 shows several more PET metrics mentioned in PERCIST 1.0 that are not essential to the current assessment of response with PERCIST but may be collected as exploratory data.
Table 2.
Recommended Exploratory Data to Consider for Collection
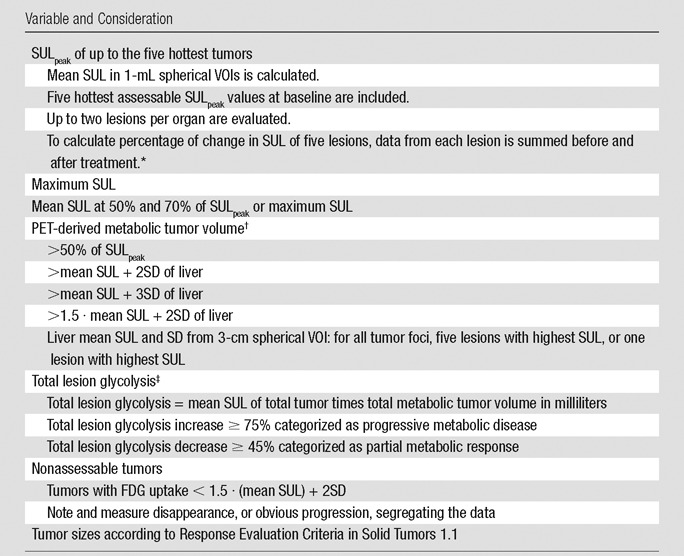
Note.—SD = standard deviation.
*Change in data required for categorization as partial metabolic response and progressive metabolic disease with more than one target lesion is yet undefined.
†FDG uptake of tumor lower than the threshold for metabolic tumor volume could be zero at follow-up, even when SULpeak does not show complete metabolic response.
‡Threshold percentage for response assessment of total lesion glycolysis is undefined.
Summary
PERCIST 1.0 has received considerable attention, and we felt that clarification of the methods was in order. In addition to the measurement of SULpeak, multiple potential exploratory analyses including those of metabolic tumor volume and total lesion glycolysis may be important as the use of PET to measure treatment response continues to grow. Collection of metabolic response data in a standardized fashion would greatly aid future pooling of study and meta-analysis data to best determine the predictive and prognostic value of PERCIST 1.0 in a variety of clinical settings and with a variety of treatments. Automated and semiautomated approaches to analysis may help to make PERCIST 1.0 easier to use in clinical trials and clinical practice.
Advance in Knowledge
■ The PET Response Criteria in Solid Tumors (PERCIST 1.0) describe methods for controlling the quality of fluorine 18 fluorodeoxyglucose PET imaging conditions to ensure the comparability of PET images acquired at different time points to allow quantitative expression of the changes in PET measurements and assessment of overall response in PET studies.
Implication for Patient Care
■ Collection of metabolic response data in a standardized fashion as described in the PERCIST 1.0 will aid greatly the future pooling of study and meta-analysis data to allow the best determination of the predictive and prognostic value of PET in a variety of clinical settings.
Acknowledgments
Acknowledgments
The authors would like to thank Heather Jacene, MD, for valuable input in preparation of the manuscript, and Judy Buchanan for scientific editing of the manuscript.
Received September 5, 2014; revision requested October 15; revision received June 25, 2015; accepted August 3, 2015; final version accepted November 24.
Current address: Department of Radiology, Seoul St. Mary’s Hospital, Seoul, Korea.
This research was supported by the National Institutes of Health (grant U01CA140204).
Disclosures of Conflicts of Interest: J.H.O. disclosed no relevant relationships. M.A.L. disclosed no relevant relationships. R.L.W. Activities related to the present article: disclosed no relevant relationships. Activities not related to the present article: personal fees for consultancy for Nihon Medi-physics, royalties and writing/editing assistance from GlaxoSmithKlein and the University of Michigan, patent issued and patent pending. Other relationships: disclosed no relevant relationships.
Abbreviations:
- FDG
- fluorine 18 fluorodeoxyglucose
- PERCIST
- Positron Emission Tomography Response Criteria In Solid Tumors
- SUL
- standardized uptake value corrected for lean body mass
- SULpeak
- peak SUL in a spherical 1-cm3 VOI
- VOI
- volume of interest
References
- 1.Wahl RL, Jacene H, Kasamon Y, Lodge MA. From RECIST to PERCIST: Evolving Considerations for PET response criteria in solid tumors. J Nucl Med 2009;50(Suppl 1):122S–150S. [DOI] [PMC free article] [PubMed] [Google Scholar]
- 2.Ziai D, Wagner T, El Badaoui A, et al. Therapy response evaluation with FDG-PET/CT in small cell lung cancer: a prognostic and comparison study of the PERCIST and EORTC criteria. Cancer Imaging 2013;13:73–80. [DOI] [PMC free article] [PubMed] [Google Scholar]
- 3.Manohar K, Mittal BR, Bhattacharya A, Malhotra P, Varma S. Prognostic value of quantitative parameters derived on initial staging 18F-fluorodeoxyglucose positron emission tomography/computed tomography in patients with high-grade non-Hodgkin’s lymphoma. Nucl Med Commun 2012;33(9):974–981. [DOI] [PubMed] [Google Scholar]
- 4.Yanagawa M, Tatsumi M, Miyata H, et al. Evaluation of response to neoadjuvant chemotherapy for esophageal cancer: PET response criteria in solid tumors versus response evaluation criteria in solid tumors. J Nucl Med 2012;53(6):872–880. [DOI] [PubMed] [Google Scholar]
- 5.Oo JH, Leal J, Tahari A, Baker L, Wahl R. Early treatment response by FDG PET in patients with the Ewing sarcoma family of tumors predicts survival [abstr]. J Nucl Med 2013;54(Suppl 2):600. [Google Scholar]
- 6.Skougaard K, Nielsen D, Jensen BV, Hendel HW. Comparison of EORTC criteria and PERCIST for PET/CT response evaluation of patients with metastatic colorectal cancer treated with irinotecan and cetuximab. J Nucl Med 2013;54(7):1026–1031. [DOI] [PubMed] [Google Scholar]
- 7.Eisenhauer EA, Therasse P, Bogaerts J, et al. New response evaluation criteria in solid tumours: revised RECIST guideline (version 1.1). Eur J Cancer 2009;45(2):228–247. [DOI] [PubMed] [Google Scholar]
- 8.Lodge MA, Chaudhry MA, Wahl RL. Noise considerations for PET quantification using maximum and peak standardized uptake value. J Nucl Med 2012;53(7):1041–1047. [DOI] [PMC free article] [PubMed] [Google Scholar]
- 9.Sugawara Y, Zasadny KR, Neuhoff AW, Wahl RL. Reevaluation of the standardized uptake value for FDG: variations with body weight and methods for correction. Radiology 1999;213(2):521–525. [DOI] [PubMed] [Google Scholar]
- 10.James WP. Research on obesity. Nutr Bull 1977;4(3):187–190. [Google Scholar]
- 11.Tahari AK, Chien D, Azadi JR, Wahl RL. Optimum lean body formulation for correction of standardized uptake value in PET imaging. J Nucl Med 2014;55(9):1481–1484. [DOI] [PMC free article] [PubMed] [Google Scholar]
- 12.Graham MM, Wahl RL, Hoffman JM, et al. Summary of the UPICT Protocol for 18F-FDG PET/CT Imaging in Oncology Clinical Trials. J Nucl Med 2015;56(6):955–961. [DOI] [PMC free article] [PubMed] [Google Scholar]
- 13.Tatsumi M, Cohade C, Nakamoto Y, Wahl RL. Fluorodeoxyglucose uptake in the aortic wall at PET/CT: possible finding for active atherosclerosis. Radiology 2003;229(3):831–837. [DOI] [PubMed] [Google Scholar]
- 14.Boellaard R, Oyen WJ, Hoekstra CJ, et al. The Netherlands protocol for standardisation and quantification of FDG whole body PET studies in multi-centre trials. Eur J Nucl Med Mol Imaging 2008;35(12):2320–2333. [DOI] [PubMed] [Google Scholar]
- 15.Shankar LK, Hoffman JM, Bacharach S, et al. Consensus recommendations for the use of 18F-FDG PET as an indicator of therapeutic response in patients in National Cancer Institute Trials. J Nucl Med 2006;47(6):1059–1066. [PubMed] [Google Scholar]
- 16.Young H, Baum R, Cremerius U, et al. Measurement of clinical and subclinical tumour response using [18F]-fluorodeoxyglucose and positron emission tomography: review and 1999 EORTC recommendations. European Organization for Research and Treatment of Cancer (EORTC) PET Study Group. Eur J Cancer 1999;35(13):1773–1782. [DOI] [PubMed] [Google Scholar]