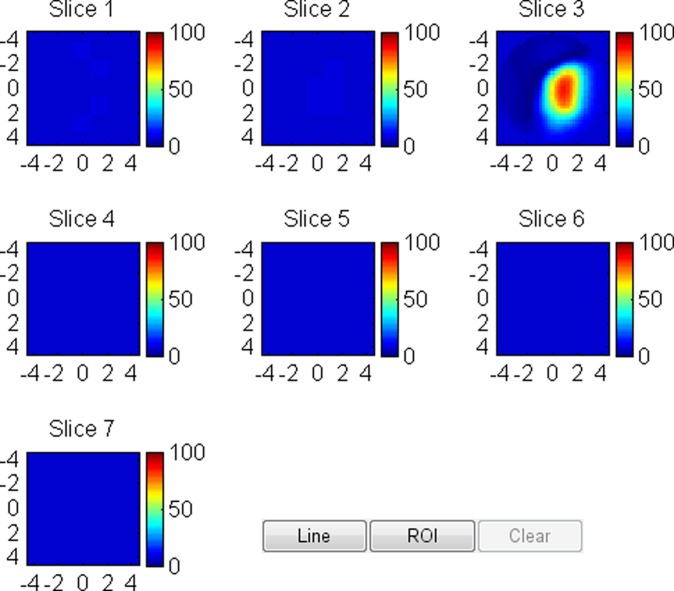
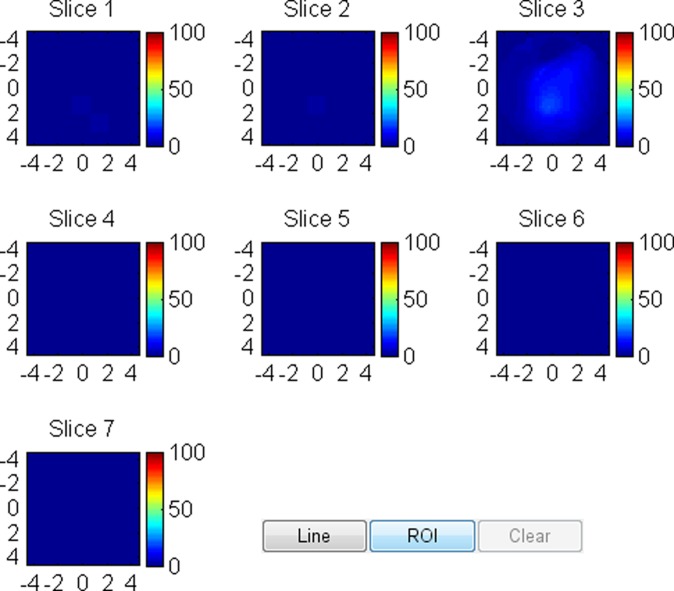
Because total and oxygenated hemoglobin levels correlate with breast cancer pathologic grade, and deoxygenated hemoglobin can assist US to characterize malignant from certain types of benign lesions, hemoglobin contrast enhancement can thus be used in conjunction with US to improve breast cancer diagnosis.
Abstract
Purpose
To investigate ultrasonography (US)-guided diffuse optical tomography to distinguish the functional differences of hemoglobin concentrations in a wide range of malignant and benign breast lesions and to improve breast cancer diagnosis in conjunction with conventional US.
Materials and Methods
The study protocol was approved by the institutional review boards and was HIPAA compliant. Written informed consent was obtained from all patients. Patients (288 women; mean age, 50 years; range, 17–94 years) who underwent US-guided biopsy were imaged with a handheld US and optical probe. The US-imaged lesion was used to guide reconstruction of light absorption maps at four wavelengths, and total hemoglobin (tHb), oxygenated hemoglobin (oxyHb), and deoxygenated hemoglobin (deoxyHb) were computed from the absorption maps. A threshold (80 μmol/L) was chosen on the basis of this study population. Two radiologists retrospectively evaluated US images on the basis of the US Breast Imaging Reporting and Data System lexicon, and a lesion was considered malignant when a score of 4C or 5 was given or a lesion had tHb greater than 80 μmol/L. A two-sample t test was used to calculate significance between groups, and Spearman ρ was computed between hemoglobin parameters and tumor pathologic grades.
Results
Three tumors were Tis, 37 were T1, 19 were T2–T4 carcinomas, and 233 were benign lesions. The mean maximum tHb, oxyHb, and deoxyHb of Tis–T1 and T2–T4 groups were 89.3 μmol/L ± 20.2 (standard deviation), 65.0 μmol/L ± 20.8, and 33.5 μmol/L ± 11.3, respectively, and 84.7 μmol/L ± 32.8, 57.1 μmol/L ± 19.8, and 34.7 μmol/L ± 18.9, respectively. The corresponding values of benign lesions were 54.1 μmol/L ± 23.5, 38.0 μmol/L ± 17.4, and 25.2 μmol/L ± 13.8, respectively. The mean maximum tHb, oxyHb, and deoxyHb were significantly higher in the malignant groups than the benign group (P <.001, <.001, and .041, respectively). For malignant lesions, the mean maximum tHb moderately correlated with tumor histologic grade and nuclear grade (ρ = 0.283 and 0.315, respectively). The mean maximum oxyHb moderately correlated with tumor nuclear grade (ρ = 0.267). When radiologists’ US diagnosis and the tHb were used together, the sensitivity, specificity, positive predictive value, and negative predictive value were 96.6%–100%, 77.3%–83.3%, 52.7%–59.4%, and 99.0%–100%, respectively, for the combined malignant group.
Conclusion
The tHb and oxyHb correlate with breast cancer pathologic grade and can be used as an adjunct to US to improve sensitivity and negative predictive value in breast cancer diagnosis.
© RSNA, 2016
Introduction
Breast cancer is a heterogeneous disease with different histologic subtypes that are composed of different grades, growth rates, and metabolic activity that result in a wide range of functional differences (1). Additionally, benign breast disease encompasses a heterogeneous group of lesions that range in vascular content, proliferative indexes, and metabolic activity that may be associated with future risk of breast cancer (2). Although characteristics of malignant and benign breast lesions by conventional imaging techniques are established (3–6), the overlapping appearances of malignant and benign lesions result in approximately 1 000 000 image-guided breast biopsies per year in the United States, and the majority of the lesions yield benign results (7). An optical tomography system that detects subtle functional differences in the breast lesions could add valuable complementary information to conventional imaging modalities to further rule out malignancy and reduce unnecessary biopsies.
Diffuse optical tomography and spectroscopy have been explored for diagnosis of breast cancers and to predict and monitor neoadjuvant chemotherapy responses of advanced breast cancers (8–25). The use of diffuse optical tomography or diffuse optical spectroscopy alone to help diagnose breast cancer was reported in many studies that use different systems and optical wavelengths in the near-infrared spectrum (8–15). However, because of intensive light scattering in tissue, lesion localization and light quantification accuracy may not be fully demonstrated (13,14). New approaches taken by researchers in the field include ultrasonography (US)-guided diffuse optical tomography (16–20), magnetic resonance (MR) imaging–guided diffuse optical tomography or diffuse optical spectroscopy (21–23), and radiography-guided diffuse optical tomography (24,25). These approaches use a conventional imaging modality to guide the diffuse optical tomography or diffuse optical spectroscopy for lesion localization and image reconstruction to improve the light quantification accuracy for more accurate diagnosis of malignant versus benign breast lesions. The additional advantage is the dual-modality characterization of the lesion, which in general provides complementary information to improve breast cancer diagnosis.
US-guided diffuse optical tomography demonstrated its potential role by helping to differentiate malignant and benign lesions (16,17,20). The data were obtained from two optical wavelengths (780 and 830 nm) and the contrast enhancement was on the basis of total hemoglobin content, which is directly related to tumor angiogenesis, a key factor required for tumor growth and metastases. To robustly explore additional lesion contrast enhancement of oxygenated hemoglobin (oxyHb) and deoxygenated hemoglobin (deoxyHb) concentrations that are related to lesion proliferation and metabolism, we modified the diffuse optical tomography system by adding two more wavelengths of 740 nm and 808 nm. The purpose of this study was to investigate US-guided diffuse optical tomography to distinguish the functional differences of hemoglobin concentrations in a wide range of malignant and benign breast lesions and to improve breast cancer diagnosis in conjunction with conventional US.
Materials and Methods
Patients
The study was performed at the Radiology Department of the University of Connecticut Health and the Radiology Department of Hartford Hospital from October 2008 to November 2011. The study protocol was approved by the institutional review boards of both hospitals and was Health Insurance Portability and Accountability Act–compliant. Written informed consent was obtained from all patients. Patients were initially referred for biopsy after a diagnostic work-up in which the suspicious lesion was thought to be most appropriately biopsied under US guidance. Patients whose biopsy schedules fit with the available schedules for US or near-infrared measurements were contacted, and those who consented to the study were enrolled. Of the 315 women enrolled in the study, 15 were excluded from analysis and 12 individuals with no US-identifiable lesions at the time of US-guided diffuse optical tomography study were used as control cases. Of the 15 patients excluded, six had small dense breasts with the chest wall about 1 cm deep from the skin surface. The poor probe-tissue contact and the chest wall caused substantial image artifacts. Two patients had skin lesions. Three patients had one breast each or additional lesions on the contralateral side, and reference data from the contralateral breast were therefore not available. Four patients did not have biopsy results, and 6-month follow-up was recommended. For the 12 patients used as control patients, data were acquired at a different quadrant away from the questionable areas. The final patient group with US-visible lesions consisted of 288 patients with 297 lesions (mean age, 50 years; range, 17–94 years). Nine patients had two lesions: four patients had two different types of lesions as discussed in the Pathologic Assessment, and these lesions were considered to be independent lesions; five patients had same type of lesions, and one lesion of higher hemoglobin level per patient was used for analysis. Therefore, the results of 288 patients with 292 lesions were analyzed.
US and Near-Infrared Data Acquisition
US examinations were performed with a linear transducer (L12 Phillips IU22; Philips Medical Systems, Bothell, Wash) at University of Connecticut Health and a linear transducer (ML6–15 GE Logiq/E9; GE Healthcare, Milwaukee, Wis) at Hartford Hospital. Patients with lesions who underwent US and were referred for core biopsy were evaluated by attending radiologists from the participating hospitals. Two prototype near-infrared systems with identical designs were used. Authors (Q.Z., with 16 years of experience, and B.T. and Y.X., each with 4–5 years of experience with technology development and clinical study) performed simultaneous US and near-infrared measurements. The probe consisted of a commercial US transducer located in the middle of the probe, and optical source and detector fibers distributed at the periphery (16,17). Details can be found in the Appendix E1 (online).
US Image Grading
For each lesion, a sequence of US images obtained before biopsy was retrospectively reviewed by two radiologists (M.K., with 15 years of experience, and A.M., with 4 years of experience), who were blinded to patient diagnosis and optical imaging results. The lesions were graded by using Breast Imaging Reporting and Data System (BI-RADS) lexicon for US (4). Details are given in the Appendix E1 (online). A binary decision of low and moderate suspicion (stages 4A and 4B) and high suspicion (stages 4C and 5) was used to compute sensitivity, specificity, and positive and negative predictive values for each reader. Note that all lesions included in the study were biopsied and the subcategories were retrospectively established to estimate the level of suspicion of each lesion.
Near-Infrared Imaging
Details of the US-guided optical-imaging reconstruction algorithm were described elsewhere (26,27) (Appendix E1 [online]). Optical absorption distribution at each wavelength was reconstructed and total hemoglobin (tHb), oxyHb, and deoxyHb distributions were computed from absorption maps of the four wavelengths. The maximum and average tHb, oxyHb, and deoxyHb concentrations were measured and the average was computed within the volumetric zone exceeding 50% of the maximum value. Five to 10 quality near-infrared images at each lesion location were used to compute the mean maximum and mean average tHb, oxyHb, and deoxyHb values, which were used to characterize each lesion and are referred as maximum and average tHb, oxyHb, and deoxyHb in the rest of the article. One author (Q.Z.) performed the optical imaging analysis and two authors (B.T. and Y.X.) assisted with the data analysis.
Because these quantitative measurements do not account for hemoglobin pattern distribution differences because they are observed in large malignant lesions, we used three qualitative features previously described (17) to evaluate the large cancer hemoglobin distribution as heterogeneous peripheral enhancement, posterior shadow, and uniform patterns.
Pathologic Assessment
One of two breast pathologists (A.R., with 32 years of experience, and P.H., with 15 years of experience) retrospectively reviewed all of the pathologic reports for primary tumor size (gross and/or microscopic measurements), tumor histologic type, and tumor histologic grade (according to the Elston-Ellis modification of the Scarff-Bloom-Richardson system, also known as the Nottingham system) for cases from their corresponding hospital. Four patients who had initial core biopsy results but did not undergo surgery at either participating hospital had tumor size assessments of 0.6–1.3 cm by using US imaging and were grouped in the Tis–T1 group. For patients who underwent neoadjuvant chemotherapy (n = 8), the initial diagnostic core biopsy reports and the pretreatment clinical staging on the basis of imaging results were used to obtain tumor information. These patients were grouped in the T2–T4 group. Estrogen receptor, progesterone receptor, and human epidermal growth factor receptor 2/Neu (cerbB-2) immunohistochemistry was performed on formalin-fixed, paraffin-embedded core biopsy tissue by using both modified San Antonio and American Society of Clinical Oncology–College of American Physicians scoring guidelines (28,29).
The two pathologists also classified benign lesions into the following groups: proliferative lesions, fibrocystic changes (nonproliferative), fibroadenoma, fat necrosis and/or other inflammatory or reactive changes, complex cyst, lymph node, and other benign breast tissue including one lipoma (Appendix E1 [online]).
After US-guided diffuse optical tomography data analysis, the hematoxylin and eosin–stained slides of malignant cases with tHb levels below the threshold and benign cases with tHb levels above the threshold were retrospectively reviewed by one pathologist (A.R.).
Statistical Analysis
A threshold of 80 μmol/L was used to compute sensitivity, specificity, positive predictive value, and negative predictive value from maximum tHb concentration. A two-sample t test was used to calculate significance between groups and 95% confidence intervals. A P value of .05 was used to indicate statistical significance. Spearman rank correlation coefficient or Spearman ρ was computed between maximum tHb, oxyHb, and deoxyHb concentrations and tumor nuclear and tumor histologic grade. Software (Minitab 17; Minitab, State College, Pa) was used for statistical calculations.
For combined diagnosis of tHb and radiologist impression, positive diagnosis was considered as either tHb concentration greater than or equal to 80 μmol/L or radiologist’s score of stage 4C or 5.
Results
The lesions evaluated are characterized in Tables E1 and E2 (online). The Spearman ρ between the measured maximum and average tHb of malignant lesions showed significant correlation with the tumor nuclear grade (ρ = 0.315, P = .015; and ρ = 0.301, P = .021, respectively) and tumor histologic grade (ρ = 0.283, P = .034; and ρ = 0.266, P = .048, respectively) (Table 1), whereas maximum and average oxyHb showed significant correlation with the tumor nuclear grade (ρ = 0.267, P = .041; and ρ = 0.258, P = .048, respectively).
Table 1.
Spearman ρ between Maximum and Average Hemoglobin Parameters and Tumor Histologic Grade and Nuclear Grade of Tis–T1 and T2–T4 Tumors
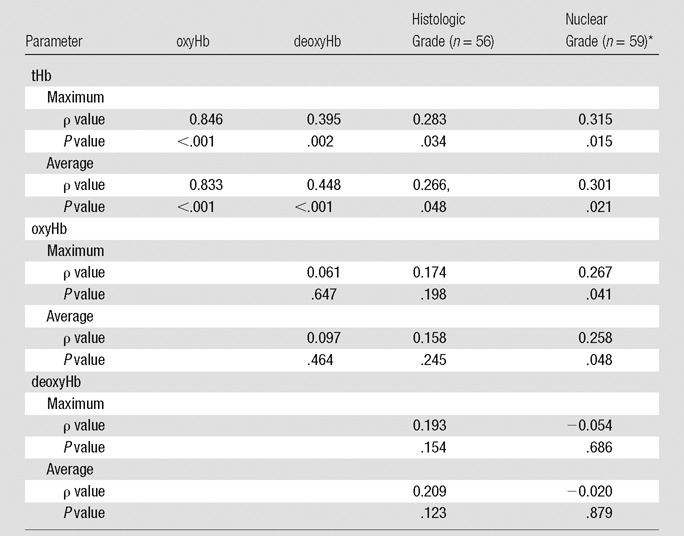
*Nuclear grade of ductal carcinoma in situ was included in the Spearman ρ calculation.
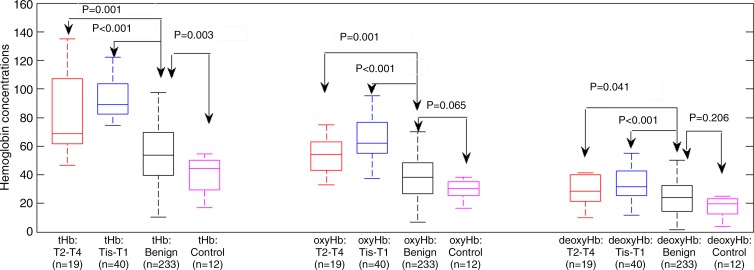
The mean maximum tHb, oxyHb, and deoxyHb of Tis–T1 group was 89.3 μmol/L ± 20.2 (standard deviation), 65.0 μmol/L ± 20.8, and 33.5 μmol/L ± 11.3, respectively; and for the T2–T4 group they were 84.7 μmol/L ± 32.8, 57.1 μmol/L ± 19.8, and 34.7 μmol/L ± 18.9, respectively. The corresponding values of benign lesions were 54.1 μmol/L ± 23.6, 38.0 μmol/L ± 17.4, and 25.2 μmol/L ± 13.8, and in the control group the values were 40.2 μmol/L ± 12.6, 31.3 μmol/L ± 11.1, and 20.0 μmol/L ± 12.6, respectively. The mean maximum tHb, oxyHb, and deoxyHb were significantly higher in the malignant groups than the benign group (P < .001, <.001, and <.041, respectively) and the control group (P < .001, <.001, and <.015, respectively) (Fig 1; Table E2 [online]). The maximum tHb of the benign group was also significantly higher than that of the control group (P = .003); however, no significance was found between the two groups on oxyHb and deoxyHb.
Figure 1:
Box-and-whisker plot of maximum tHb, oxyHb, and deoxyHb of Tis–T1, T2-T2, benign lesions, and control cases. tHb, oxyHb, and deoxyHb levels of Tis–T1 group are significantly higher than in benign lesions and the differences were 35.1 μmol/L (95% confidence interval: 28.1, 42.2 μmol/L), 27.1 μmol/L (95% confidence interval: 20.1, 34.1μmol/L), and 8.5 μmol/L (95% confidence interval: 4.59, 12.50 μmol/L), respectively.
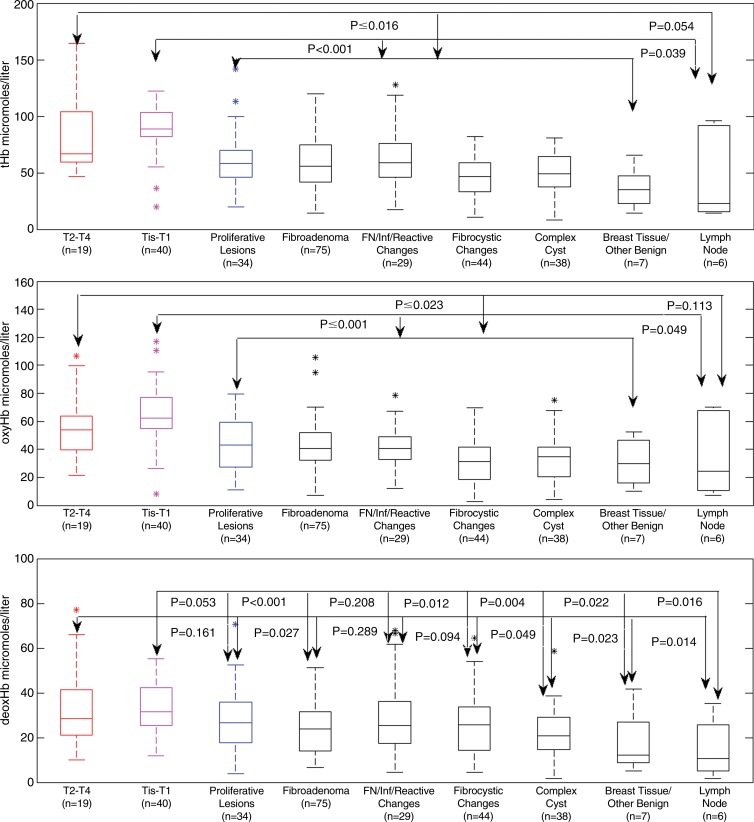
Maximum tHb levels of Tis–T1 versus seven benign categories were significantly different, but results of T2–T4 versus six benign groups showed the significance with the lymph node group approached significance (P = .054) (Fig 2a; Table E3 [online]). Among the benign groups, proliferative lesions, fibroadenoma, and fat necrosis and/or inflammatory and reactive changes had similar differences in mean values from the two malignant groups, and fibrocystic and complex cyst groups showed similar differences in mean values from the malignant groups. The breast tissue and other benign group showed the lowest mean values compared with the malignant groups and other benign groups.
Figure 2:
Box-and-whisker plots of reconstructed maximum tHb, oxyHb, and deoxyHb in micromoles per liter in nine patient groups. P values from the two-sample t test are given between groups. FN = fat necrosis, Inf = inflammatory.
By comparing oxyHb, there were significant differences between Tis–T1 group and seven benign groups and between the T2–T4 group and six benign groups except lymph node (Fig 2b; Table E3 [online]). By comparing deoxyHb, there were significant differences between the Tis–T1 group and five benign groups except proliferative and fat necrosis and/or inflammatory change category. The results of the T2–T4 group were significant compared with fibroadenoma, complex cyst, breast tissue, and other benign lymph nodes (Fig 2c; Table E3 [online]). No significant difference was found between this malignant group and proliferative, fat necrosis, and/or inflammatory change and fibrocystic change categories.
For both readers, the sensitivity was lower for the Tis–T1 group than for the combined malignant group (Table 2). For maximum tHb level, by using the threshold of 80 μmol/L, the sensitivity, specificity, and positive and negative predictive values for Tis–T1 group were 84.6%, 90.0%, 57.9%, and 97.3%, respectively; the corresponding values for combined malignant group were 72.9%, 90.0%, 64.2%, and 93.1%, respectively. On the basis of the BI-RADS scores of the two radiologists, the sensitivity, specificity, and positive and negative predictive values for combined malignant group were 78.0%–81.4%, 83.7%–90.1%, 55.8%–66.7%, and 94.2–94.7%, respectively. When radiologists’ diagnosis on the basis of US images was used together with tHb levels, the sensitivity of the combined malignant group improved to 96.6%–100%, while specificity slightly reduced to 77.3%–83.3%. The positive predictive value decreased to 52.7%–59.4% and negative predictive value improved to 99.0%–100% (Table 2). The tHb improved the radiologists’ diagnosis mainly on indeterminate BI-RADS stage 4B breast lesions (Appendix E1 [online]).
Table 2.
Sensitivity, Specificity, Positive Predictive Value, and Negative Predictive Value of Two Readers, tHb, and Combined tHb and Readers
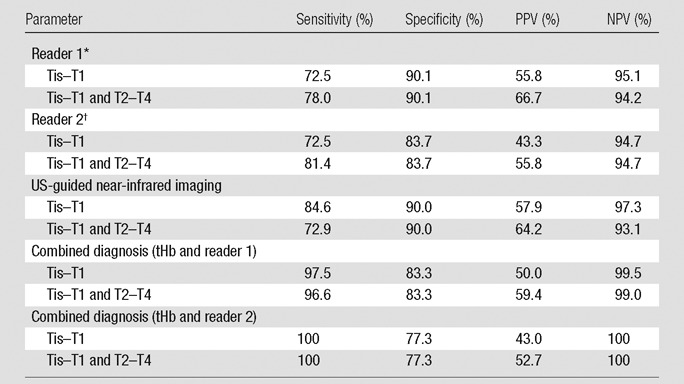
Note.— NPV = negative predictive value, PPV = positive predictive value.
*Category 4A,16%; 4B, 60%; and 4C and 5, 24%.
†Category 4A, 13%;4B, 58%; and 4C and 5, 29%.
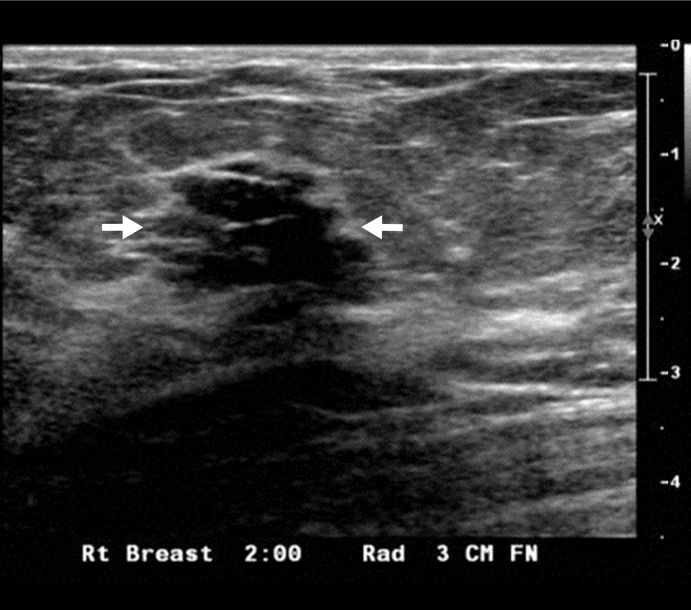
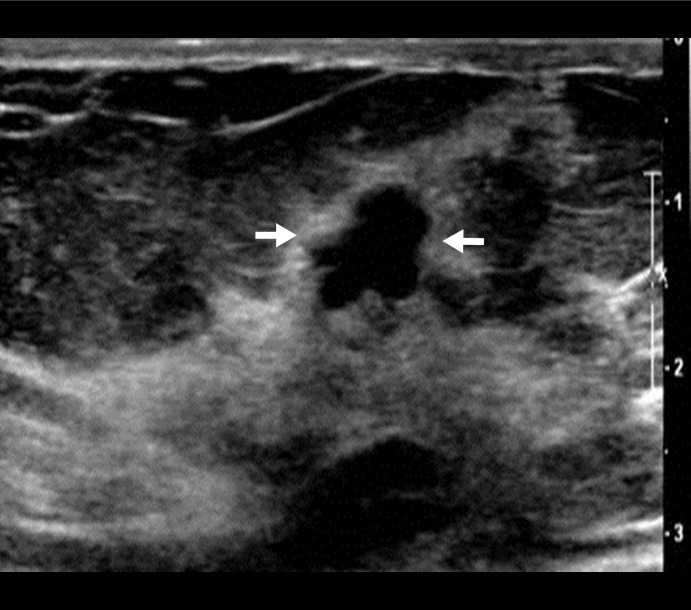
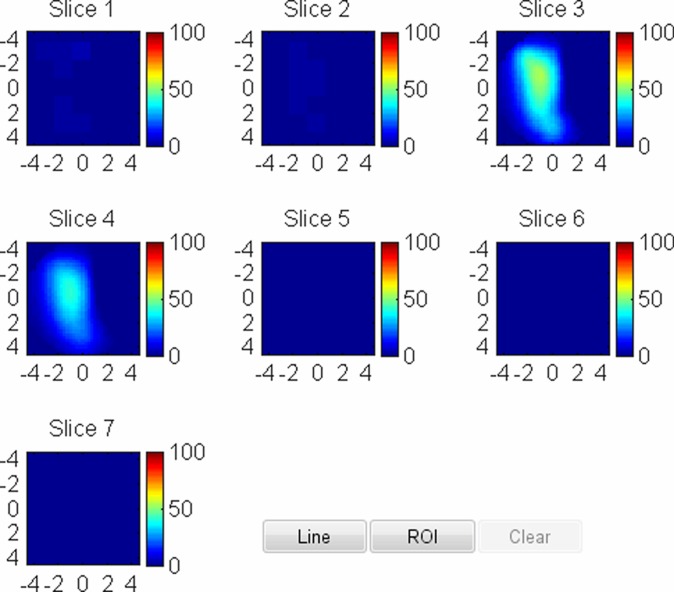
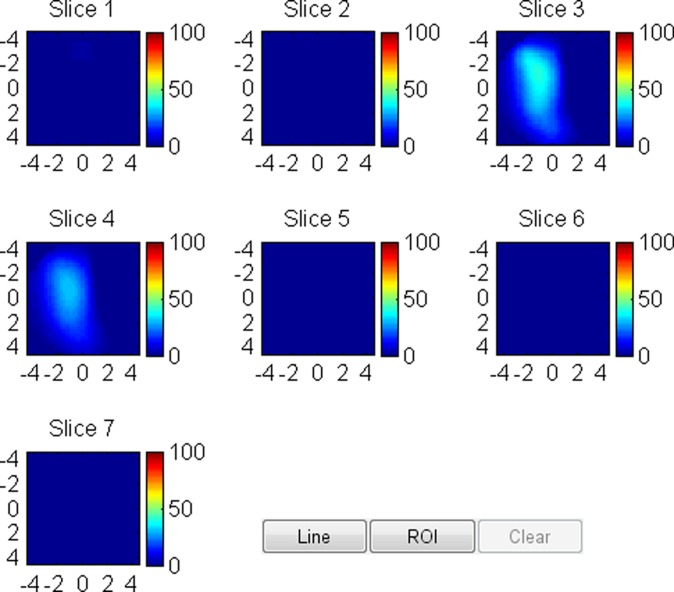
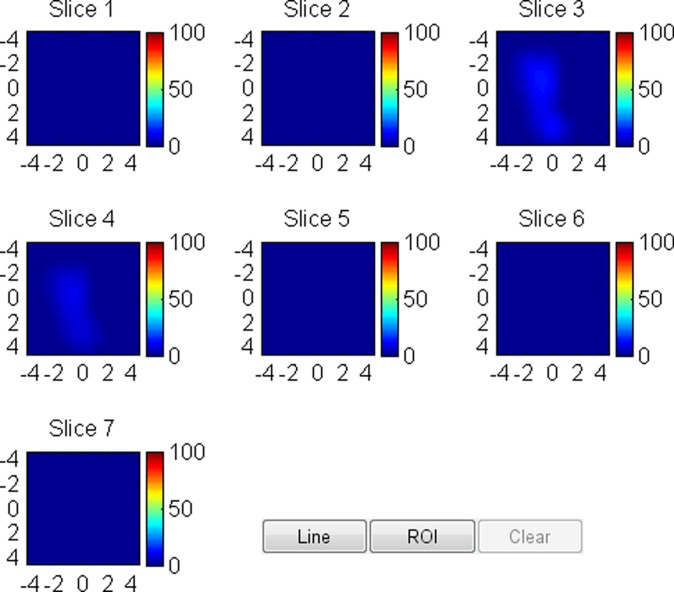
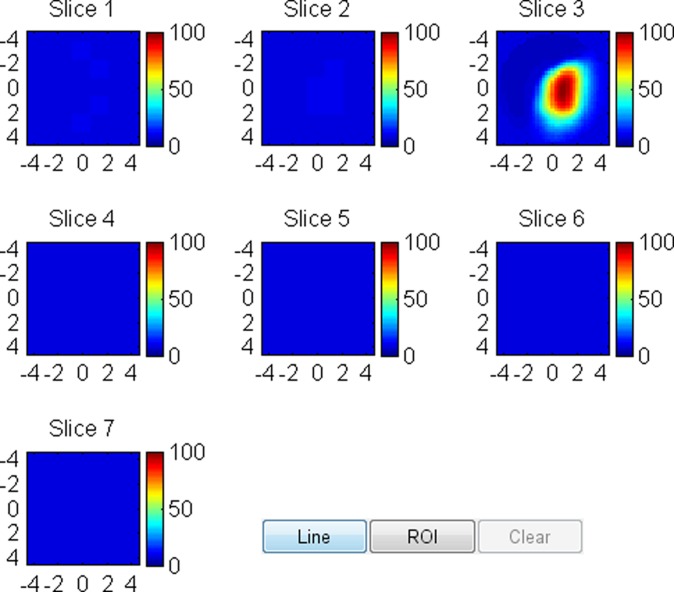
Typical examples of a benign lesion and Tis–T1 and T2–T4 malignant lesions are provided in Figures 3 and 4 and Figures E1 and E2 (online).
Figure 3a:
US image and associated maps. (a) US image of a hypoechoic lobulated mass (arrows) with internal echoes and septations located at the 2 o’clock position in the right breast of a 40-year-old woman. Grading from the two readers was 4b and 4c. (b) tHb map shows a diffused mass of maximum 52.5 μmol/L. (c) oxyHb map of maximum 39.8 μmol/L and (d) deoxyHb map of 12.8 μmol/L. Core biopsy revealed hylinized fibroadenoma with mild-to-moderate epithelial hyperplasia without atypia.
Figure 4a:
US image and associated maps. (a) US image of a hypoechoic lobulated mass (arrows) located at 9 o’clock position in the right breast of a 72-year-old woman. Grading from the two readers were 4b and 4c. (b) tHb map shows an isolated and distinct mass of maximum 106.2 μmol/L. (c) oxyHb map of maximum 69.7 μmol/L and (d) deoxyHb map of 37.2 μmol/L. OxyHb map is similar to tHb map and the deoxyHb distribution is quite diffused. Core biopsy revealed ductal carcinoma in situ, nuclear grade 2, cribriform patterns without necrosis. Pathologic analysis at surgery revealed 0.6 × 0.6 cm ductal carcinoma in situ with other findings of intraductal papilloma with atypia and microcalcification.
Figure 3b:
US image and associated maps. (a) US image of a hypoechoic lobulated mass (arrows) with internal echoes and septations located at the 2 o’clock position in the right breast of a 40-year-old woman. Grading from the two readers was 4b and 4c. (b) tHb map shows a diffused mass of maximum 52.5 μmol/L. (c) oxyHb map of maximum 39.8 μmol/L and (d) deoxyHb map of 12.8 μmol/L. Core biopsy revealed hylinized fibroadenoma with mild-to-moderate epithelial hyperplasia without atypia.
Figure 3c:
US image and associated maps. (a) US image of a hypoechoic lobulated mass (arrows) with internal echoes and septations located at the 2 o’clock position in the right breast of a 40-year-old woman. Grading from the two readers was 4b and 4c. (b) tHb map shows a diffused mass of maximum 52.5 μmol/L. (c) oxyHb map of maximum 39.8 μmol/L and (d) deoxyHb map of 12.8 μmol/L. Core biopsy revealed hylinized fibroadenoma with mild-to-moderate epithelial hyperplasia without atypia.
Figure 3d:
US image and associated maps. (a) US image of a hypoechoic lobulated mass (arrows) with internal echoes and septations located at the 2 o’clock position in the right breast of a 40-year-old woman. Grading from the two readers was 4b and 4c. (b) tHb map shows a diffused mass of maximum 52.5 μmol/L. (c) oxyHb map of maximum 39.8 μmol/L and (d) deoxyHb map of 12.8 μmol/L. Core biopsy revealed hylinized fibroadenoma with mild-to-moderate epithelial hyperplasia without atypia.
Figure 4b:
US image and associated maps. (a) US image of a hypoechoic lobulated mass (arrows) located at 9 o’clock position in the right breast of a 72-year-old woman. Grading from the two readers were 4b and 4c. (b) tHb map shows an isolated and distinct mass of maximum 106.2 μmol/L. (c) oxyHb map of maximum 69.7 μmol/L and (d) deoxyHb map of 37.2 μmol/L. OxyHb map is similar to tHb map and the deoxyHb distribution is quite diffused. Core biopsy revealed ductal carcinoma in situ, nuclear grade 2, cribriform patterns without necrosis. Pathologic analysis at surgery revealed 0.6 × 0.6 cm ductal carcinoma in situ with other findings of intraductal papilloma with atypia and microcalcification.
Figure 4c:
US image and associated maps. (a) US image of a hypoechoic lobulated mass (arrows) located at 9 o’clock position in the right breast of a 72-year-old woman. Grading from the two readers were 4b and 4c. (b) tHb map shows an isolated and distinct mass of maximum 106.2 μmol/L. (c) oxyHb map of maximum 69.7 μmol/L and (d) deoxyHb map of 37.2 μmol/L. OxyHb map is similar to tHb map and the deoxyHb distribution is quite diffused. Core biopsy revealed ductal carcinoma in situ, nuclear grade 2, cribriform patterns without necrosis. Pathologic analysis at surgery revealed 0.6 × 0.6 cm ductal carcinoma in situ with other findings of intraductal papilloma with atypia and microcalcification.
Figure 4d:
US image and associated maps. (a) US image of a hypoechoic lobulated mass (arrows) located at 9 o’clock position in the right breast of a 72-year-old woman. Grading from the two readers were 4b and 4c. (b) tHb map shows an isolated and distinct mass of maximum 106.2 μmol/L. (c) oxyHb map of maximum 69.7 μmol/L and (d) deoxyHb map of 37.2 μmol/L. OxyHb map is similar to tHb map and the deoxyHb distribution is quite diffused. Core biopsy revealed ductal carcinoma in situ, nuclear grade 2, cribriform patterns without necrosis. Pathologic analysis at surgery revealed 0.6 × 0.6 cm ductal carcinoma in situ with other findings of intraductal papilloma with atypia and microcalcification.
Six lesions with tHb levels less than the threshold in the Tis–T1 group occurred in three histologic grade 1 tumors and three grade 2 tumors (Table E4 [online]). One histologic grade 1 tumor had a high deoxyHb component. The hemoglobin distributions of T2-T4 tumors were complicated and could not be characterized by a single threshold (Appendix E1 [online]).
The false-positive findings with tHb greater than the threshold value of 80 μmol/L were found in the proliferative group (six of 34 lesions), fibroadenoma group (10 of 75 lesions), fat necrosis and/or inflammatory and reactive changes group (four of 29 lesions), fibrocystic changes group (one of 44 lesions), complex cyst group (one of 38 lesions), and lymph node group (two of six lesions) (Table E5 [online]; Appendix E1 [online]). The fibroadenoma group had the highest number of lesions that exceeded the tHb threshold. Hematoxylin and eosin–stained samples and reviews of the core biopsy samples showed that six specimens were myxoid fibroadenomas and four specimens were fibrosclerotic fibroadenomas.
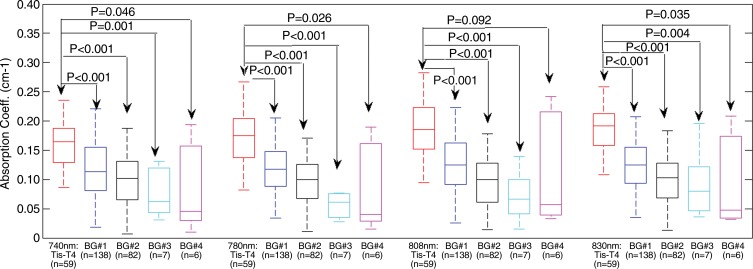
The spectroscopic contrast of malignant and benign groups is evaluated at the four optical wavelengths (Fig 5). On average, the malignant group had 1.4, 1.5, 1.5, and 1.5 times higher contrast enhancement at 740, 780, 808, and 830 nm, respectively, than the combined proliferative lesions, fibroadenomas, and fat necrosis and/or inflammatory and reactive changes group; 1.6, 1.9, 2.0, and 1.8 times higher contrast enhancement than the fibrocystic changes, complex cyst, and breast tissue groups, respectively, and 2.0, 2.2, 1.8, and 2.1 times higher contrast enhancement than the lymph node group, respectively. On average, the contrast between malignant and benign lesions is higher at 780, 808, and 830 nm wavelengths for malignant lesions than for benign lesions at 740 nm.
Figure 5:
Box plots of reconstructed absorption coefficients of malignant and benign groups (BGs) obtained at the four optical wavelengths. Both Tis–T1 and T2-T2 malignant groups have similar mean values and are combined into one malignant group. Benign group 1: Proliferative lesions, fibroadenomas and fat necrosis and/or inflammatory and reactive changes groups have similar mean values and are combined into one group. Benign group 2: Fibrocystic changes and complex cysts have similar mean values and are combined into one group. Benign group 3: Breast tissue and other benign findings. Benign group 4: Lymph node.
Discussion
Within the near-infrared optical window of 700–1200 nm, water absorption is low, and light can penetrate several centimeters of breast tissue (30). The selected shorter wavelength (740 nm) is more sensitive to tumor deoxyHb changes, while the longer wavelengths (780, 808, and 830 nm) are more suitable to probe tumor blood volume and oxyHb changes. Both tumor blood-oxygen consumption, which is directly related to tumor proliferation and metabolism (31), and tumor angiogenesis (32) can be robustly explored by this set of wavelengths. Our study of 59 malignant lesions demonstrated that the measured maximum tHb and oxyHb levels moderately correlate with tumor nuclear grade, and the maximum tHb moderately correlates with tumor histologic grade. Tumor nuclear grade usually correlates with the tumor histologic grade (33). Tumor histologic grade, in turn, is an important morphologic-determined prognostic factor, which correlates highly with disease-free and overall survival (34). Therefore, our results suggest that these two hemoglobin parameters help to measure tumor neovascularization, which correlates with tumor progression.
On average, the contrast of maximum tHb, oxyHb, and deoxyHb of Tis–T1 cancers was, respectively, 1.6, 1.7, and 1.3 times higher than for benign lesions, and the contrast of T2–T4 cancers was, respectively, 1.6, 1.5, and 1.4 times higher than for benign lesions. Compared with our previous study with 37 Tis–T1 early-stage cancers, 24 T2–T4 cancers, and 114 benign lesions, which showed tHb contrast of 1.9 and 1.8 times that of the two malignant groups over benign lesions (17), the tHb contrast reported in this study was slightly lower. The earlier study used two optical wavelengths of 780 and 830 nm and the current study used four wavelengths. The malignant to benign lesion contrast, measured at 740 nm, was lower than other wavelengths. The advantage of including 740 nm is to robustly measure deoxyHb, which may help to distinguish malignant lesions from fibroadenomas, complex cysts, and lymph nodes (Appendix E1 [online]).
In benign disease, the fibroadenoma group had the highest number of lesions (10 of 75), which exceeded the tHb threshold. Another US-guided near-infrared study reported by Zhi et al (35) found 18 of 28 benign lesions above their selected tHb threshold were fibroadenomas. Fibroadenoma is the most common benign tumor of the breast composed of both epithelial and stromal components. The primary growth of a fibroadenoma is driven by proliferation of the stromal component. The stroma of a fibroadenoma shows a broad range of morphologic structure and differentiation. Myxoid fibroadenoma typically demonstrates strong and continuous intravenous contrast enhancement on MR images with early enhancement values that occasionally mimic malignant tumors (36). A myxoid fibroadenoma can transition to a fibrotic fibroadenoma over many years.
Our study had limitations. Our characterization of BI-RADS categories was performed retrospectively by using captured US images alone, which may reduce the diagnostic accuracy. Radiologists would normally integrate mammography, real-time US, and patient information to improve accuracy. The limitations of this technology include the use of the contralateral normal breast in the same quadrant as the reference, which requires the use of coregistered US to position the probe to match the chest-wall depths at both lesion and reference sites. This effort minimized the difference in chest-wall positions at both sites and produced the best imaging results (37). This technology is not suitable to image lesions close to the skin or at the skin because diffuse optical tomography technique requires light to propagate diffusively inside tissue before it is detected. This technology is also not suitable to image lesions near a darkly pigmented nipple-areolar complex. Another potential problem is the poor probe-tissue contact when small dense breasts were examined. The tHb threshold level of 80 μmol/L used in this study was similar to 82 μmol/L used in our early studies (17). The slightly lower threshold used in this study was adjusted on the basis of the lower malignant and benign contrast enhancement measured at 740 nm. This is a study limitation: we used our results to set the threshold for analysis. This can therefore overestimate performance. Another limitation of our study is that we did not follow the benign lesions to ensure no change over time.
Because tHb and oxyHb levels correlate with breast cancer pathologic grade and deoxyHb can assist US to characterize malignant from certain types of benign lesions, hemoglobin contrast can thus be used in conjunction with US to improve clinical breast cancer diagnosis and management, including identification of potential candidates for whom surgical excision might be avoided.
Advances in Knowledge
■ The maximum total hemoglobin (tHb) concentration of malignant lesions moderately correlates with tumor histologic grade and nuclear grade (ρ = 0.283 and ρ = 0.315); the maximum oxygenated hemoglobin concentration moderately correlates with tumor nuclear grade (ρ = 0.267).
■ The deoxygenated hemoglobin concentration of malignant lesions is significantly higher compared with fibroadenoma (P ≤ .022), complex cyst (P ≤ .046), breast tissue, and other benign tissue and lymph nodes (P ≤ .023).
■ With our own population to set a threshold for comparison, when tHb concentration is used in conjunction with conventional US features, sensitivity of 96.6%–100%, specificity of 77.3%–83.3%, positive predictive value of 52.7%–59.4%, and negative predictive value of 99.0%–100% was achieved in a wide spectrum of malignant and benign breast lesions.
Implication for Patient Care
■ The near-infrared technique with US localization of breast tumors could potentially be used to improve the current practice for diagnosis of malignant and benign breast lesions and therefore reduce unnecessary benign biopsies.
APPENDIX
SUPPLEMENTAL FIGURES
Acknowledgments
Acknowledgments
Sandra Trifiro, Coordinator of Clinical Research Office of Hartford Hospital, is specifically acknowledged for consenting and scheduling patients recruited at the Hartford Hospital. Kimberly Sokol, Coordinator of Radiology Department of University of Connecticut Health Center, is thanked for helping with patient schedules at University of Connecticut Health Center. The attending radiologists and US technologists of the Radiology Departments of the University of Connecticut Health Center and Hartford Hospital were extremely helpful in assisting with US data acquisition and patient imaging.
Received May 14, 2015; revision requested July 8; revision received August 12; accepted September 11; final version accepted December 16.
This research was supported by the National Institutes of Health (grant R01EB002136).
Disclosures of Conflicts of Interest: Q.Z. Activities related to the present article: holds patents related to the US-guided near-infrared technology and other patents owned by University of Connecticut. Activities not related to the present article: disclosed no relevant relationships. Other relationships: disclosed no relevant relationships. A.R. disclosed no relevant relationships. P.H. disclosed no relevant relationships. M.K. disclosed no relevant relationships. E.C. disclosed no relevant relationships. A.M. disclosed no relevant relationships. Y.X. disclosed no relevant relationships. B.T. disclosed no relevant relationships. S.T. disclosed no relevant relationships.
Abbreviations:
- BI-RADS
- Breast Imaging Reporting and Data System
- deoxyHb
- deoxygenated hemoglobin
- oxyHb
- oxygenated hemoglobin
- tHb
- total hemoglobin
References
- 1.Polyak K. Heterogeneity in breast cancer. J Clin Invest 2011;121(10):3786–3788. [DOI] [PMC free article] [PubMed] [Google Scholar]
- 2.Guray M, Sahin AA. Benign breast diseases: classification, diagnosis, and management. Oncologist 2006;11(5):435–449. [DOI] [PubMed] [Google Scholar]
- 3.Hooley RJ, Scoutt LM, Philpotts LE. Breast ultrasonography: state of the art. Radiology 2013;268(3):642–659. [DOI] [PubMed] [Google Scholar]
- 4.American College of Radiology . ACR BI-RADS® Atlas Fifth Edition Quick Reference: Ultrasound, Mammography, Magnetic Resonance Imaging, BI-RADS® Assessment Categories. http://www.acr.org/∼/media/ACR/Documents/PDF/QualitySafety/Resources/BIRADS/Posters/BIRADS%20Reference%20Card_web_F.pdf. Accessed January 2016.
- 5.Stavros AT, Thickman D, Rapp CL, Dennis MA, Parker SH, Sisney GA. Solid breast nodules: use of sonography to distinguish between benign and malignant lesions. Radiology 1995;196(1):123–134. [DOI] [PubMed] [Google Scholar]
- 6.Neal L, Tortorelli CL, and Nassar A. Clinician’s guide to imaging and pathologic findings in benign breast disease. Mayo Clin Proc 2010;85(3):274–279. [DOI] [PMC free article] [PubMed] [Google Scholar]
- 7.Office of the Assistant Secretary for Planning and Evaluation , U.S. Department of Health & Human Services . The ASPE Technical Expert Panel on Improving Cancer Policy Research through Information Technology. The Importance of Radiology and Pathology Communication in the Diagnosis and Staging of Cancer: Mammography as a Case Study. http://aspe.hhs.gov/sp/reports/2010/PathRad/index.shtml. Published November 2010. Accessed January 2016.
- 8.Tromberg BJ, Cerussi A, Shah N, et al. Imaging in breast cancer: diffuse optics in breast cancer: detecting tumors in pre-menopausal women and monitoring neoadjuvant chemotherapy. Breast Cancer Res 2005;7(6):279–285. [DOI] [PMC free article] [PubMed] [Google Scholar]
- 9.Choe R, Konecky SD, Corlu A, et al. Differentiation of benign and malignant breast tumors by in-vivo three-dimensional parallel-plate diffuse optical tomography. J Biomed Opt 2009;14(2):024020. [DOI] [PMC free article] [PubMed] [Google Scholar]
- 10.Poplack SP, Tosteson TD, Wells WA, et al. Electromagnetic breast imaging: results of a pilot study in women with abnormal mammograms. Radiology 2007;243(2):350–359. [DOI] [PubMed] [Google Scholar]
- 11.Intes X. Time-domain optical mammography SoftScan: initial results. Acad Radiol 2005;12(8):934–947. [DOI] [PubMed] [Google Scholar]
- 12.Spinelli L, Torricelli A, Pifferi A, Taroni P, Danesini G, Cubeddu R. Characterization of female breast lesions from multi-wavelength time-resolved optical mammography. Phys Med Biol 2005;50(11):2489–2502. [DOI] [PubMed] [Google Scholar]
- 13.Collettini F, Martin JC, Diekmann F, et al. Diagnostic performance of a Near-Infrared Breast Imaging system as adjunct to mammography versus X-ray mammography alone. Eur Radiol 2012;22(2):350–357. [DOI] [PubMed] [Google Scholar]
- 14.Athanasiou A, Vanel D, Balleyguier C, et al. Dynamic optical breast imaging: a new technique to visualise breast vessels: comparison with breast MRI and preliminary results. Eur J Radiol 2005;54(1):72–79. [DOI] [PubMed] [Google Scholar]
- 15.van de Ven S, Elias S, Wiethoff A, et al. Diffuse optical tomography of the breast: initial validation in benign cysts. Mol Imaging Biol 2009;11(2):64–70. [DOI] [PMC free article] [PubMed] [Google Scholar]
- 16.Zhu Q, Cronin EB, Currier AA, et al. Benign versus malignant breast masses: optical differentiation with US-guided optical imaging reconstruction. Radiology 2005;237(1):57–66. [DOI] [PMC free article] [PubMed] [Google Scholar]
- 17.Zhu Q, Hegde PU, Ricci A, Jr, et al. Early-stage invasive breast cancers: potential role of optical tomography with US localization in assisting diagnosis. Radiology 2010;256(2):367–378. [DOI] [PMC free article] [PubMed] [Google Scholar]
- 18.Zhu Q, DeFusco PA, Ricci A, Jr, et al. Breast cancer: assessing response to neoadjuvant chemotherapy by using US-guided near-infrared tomography. Radiology 2013;266(2):433–442. [DOI] [PMC free article] [PubMed] [Google Scholar]
- 19.Ueda S, Nakamiya N, Matsuura K, et al. Optical imaging of tumor vascularity associated with proliferation and glucose metabolism in early breast cancer: clinical application of total hemoglobin measurements in the breast. BMC Cancer 2013;13:514. [DOI] [PMC free article] [PubMed] [Google Scholar]
- 20.Choi JS, Kim MJ, Youk JH, Moon HJ, Suh HJ, Kim EK. US-guided optical tomography: correlation with clinicopathologic variables in breast cancer. Ultrasound Med Biol 2013;39(2):233–240. [DOI] [PubMed] [Google Scholar]
- 21.Brooksby B, Pogue BW, Jiang S, et al. Imaging breast adipose and fibroglandular tissue molecular signatures by using hybrid MRI-guided near-infrared spectral tomography. Proc Natl Acad Sci U S A 2006;103(23):8828–8833. [DOI] [PMC free article] [PubMed] [Google Scholar]
- 22.Ntziachristos V, Yodh AG, Schnall MD, Chance B. MRI-guided diffuse optical spectroscopy of malignant and benign breast lesions. Neoplasia 2002;4(4):347–354. [DOI] [PMC free article] [PubMed] [Google Scholar]
- 23.Mastanduno MA, Xu J, El-Ghussein F, et al. Sensitivity of MRI-guided near-infrared spectroscopy clinical breast exam data and its impact on diagnostic performance. Biomed Opt Express 2014;5(9):3103–3115. [DOI] [PMC free article] [PubMed] [Google Scholar]
- 24.Fang Q, Selb J, Carp SA, et al. Combined optical and X-ray tomosynthesis breast imaging. Radiology 2011;258(1):89–97. [DOI] [PMC free article] [PubMed] [Google Scholar]
- 25.Krishnaswamy V, Michaelsen KE, Pogue BW, et al. A digital x-ray tomosynthesis coupled near infrared spectral tomography system for dual-modality breast imaging. Opt Express 2012;20(17):19125–19136. [DOI] [PMC free article] [PubMed] [Google Scholar]
- 26.Zhu Q, Chen N, Kurtzman SH. Imaging tumor angiogenesis by use of combined near-infrared diffusive light and ultrasound. Opt Lett 2003;28(5):337–339. [DOI] [PMC free article] [PubMed] [Google Scholar]
- 27.Zhu Q, Xu C, Guo P, et al. Optimal probing of optical contrast of breast lesions of different size located at different depths by US localization. Technol Cancer Res Treat 2006;5(4):365–380. [DOI] [PMC free article] [PubMed] [Google Scholar]
- 28.Allred DC, Harvey JM, Berardo M, Clark GM. Prognostic and predictive factors in breast cancer by immunohistochemical analysis. Mod Pathol 1998;11(2):155–168. [PubMed] [Google Scholar]
- 29.Hammond ME, Hayes DF, Dowsett M, et al. American Society of Clinical Oncology/College Of American Pathologists guideline recommendations for immunohistochemical testing of estrogen and progesterone receptors in breast cancer. J Clin Oncol 2010;28(16):2784–2795. [DOI] [PMC free article] [PubMed] [Google Scholar]
- 30.Wikipedia . Near-infrared window in biological tissue. http://en.wikipedia.org/wiki/Near-infrared_window_in_biological_tissue.
- 31.Vaupel P, Mayer A, Briest S, Höckel M. Hypoxia in breast cancer: role of blood flow, oxygen diffusion distances, and anemia in the development of oxygen depletion. Adv Exp Med Biol 2005;566:333–342. [DOI] [PubMed] [Google Scholar]
- 32.Folkman J. Angiogenesis: an organizing principle for drug discovery? Nat Rev Drug Discov 2007;6(4):273–286. [DOI] [PubMed] [Google Scholar]
- 33.Yang Q, Mori I, Sakurai T, et al. Correlation between nuclear grade and biological prognostic variables in invasive breast cancer. Breast Cancer 2001;8(2):105–110. [DOI] [PubMed] [Google Scholar]
- 34.Rakha EA, Reis-Filho JS, Baehner F, et al. Breast cancer prognostic classification in the molecular era: the role of histological grade. Breast Cancer Res 2010;12(4):207. [DOI] [PMC free article] [PubMed] [Google Scholar]
- 35.Zhi W, Gu X, Qin J, et al. Solid breast lesions: clinical experience with US-guided diffuse optical tomography combined with conventional US. Radiology 2012;265(2):371–378. [DOI] [PubMed] [Google Scholar]
- 36.Brinck U, Fischer U, Korabiowska M, Jutrowski M, Schauer A, Grabbe E. The variability of fibroadenoma in contrast-enhanced dynamic MR mammography. AJR Am J Roentgenol 1997;168(5):1331–1334. [DOI] [PubMed] [Google Scholar]
- 37.Ardeshirpour Y, Huang M, Zhu Q. Effect of the chest wall on breast lesion reconstruction. J Biomed Opt 2009;14(4):044005. [DOI] [PMC free article] [PubMed] [Google Scholar]
Associated Data
This section collects any data citations, data availability statements, or supplementary materials included in this article.


