Abstract
It has been widely accepted that 5-methylcytosine is the only form of DNA methylation in mammalian genomes. Here we identify N6-methyladenine as another form of DNA modification in mouse embryonic stem cells. Alkbh1 encodes a demethylase for N6-methyladenine. An increase of N6-methyladenine levels in Alkbh1-deficient cells leads to transcriptional silencing. N6-methyladenine deposition is inversely correlated with the evolutionary age of LINE-1 transposons; its deposition is strongly enriched at young (<1.5 million years old) but not old (>6 million years old) L1 elements. The deposition of N6-methyladenine correlates with epigenetic silencing of such LINE-1 transposons, together with their neighbouring enhancers and genes, thereby resisting the gene activation signals during embryonic stem cell differentiation. As young full-length LINE-1 transposons are strongly enriched on the X chromosome, genes located on the X chromosome are also silenced. Thus, N6-methyladenine developed a new role in epigenetic silencing in mammalian evolution distinct from its role in gene activation in other organisms. Our results demonstrate that N6-methyladenine constitutes a crucial component of the epigenetic regulation repertoire in mammalian genomes.
DNA methylation is a crucial component of epigenetic regulation that controls many important aspects of mammalian biology, such as imprinting, X chromosome inactivation and tumorigenesis1,2. The prevailing dogma states that DNA methylation exclusively occurs on the fifth position of cytosine (5mC) in mammals, whereas the other modifications are absent, such as N6-methyladenine (N6-mA) which is predominantly present in prokaryotes and a limited number of eukaryotes3. Several reports have very recently expanded the list of organisms with N6-mA to three additional eukaryotes: insects (Drosophila melanogaster)4, nematodes (Caenorhabiditis elegans)5 and green algae (Chlamydomonas reinhardtii)6; and intriguingly, these studies implicated N6-mA in gene activation4–6, instead of repression, as is the case for 5mC repression. Despite this progress, the central issue regarding additional DNA modifications in mammals remained unresolved. A single report in the 1980s showed indirect evidence of N6-mA in mammalian genomes7; subsequent studies, however, were unable to confirm the presence of N6-mA in mammalian genomes8. A major function of 5mC in mammals is to control retrotransposons, for example, the long interspersed element 1 (LINE-1 or L1), a non-LTR family retrotransposon9,10. Although the majority of the LINE-1 transposons, which have lost the 5′ UTR and other regions proximal to the 5′ end, are transcriptionally inactive10, several thousands of full-length (6–7 kb), young LINE-1 transposons (that emerged in the mouse genome less than 1.5 million years ago11,12), which contain their own promoters at the 5′ UTR, can be autonomously transcribed.
Incorporation of histone variant proteins, which carry significantly different primary sequences from the major histone isoforms, is another important aspect of epigenetic regulation13. These variants, which usually account for a very small fraction of the total histone pool, are deposited in critical genomic regions and play important roles in cell fate decisions and development13. It has been shown that the local structure of histone variant-containing nucleosomes may be different from the canonical ones, consistent with the significant differences in protein (histone) primary sequences14. By the same token, it is conceivable that the altered nucleosome structures may be employed in accommodating variations in DNA structures, such as chemical modifications. In this work, we developed a single molecular real-time sequencing of chromatin immunoprecipitation-enriched DNA (SMRT-ChIP) approach to interrogate DNA modifications enriched at histone variant H2 A.X deposition regions in mouse embryonic stem cells, leading to the identification of N6-mA in mouse embryonic stem cells and the associated demethylase, as well as revealing a novel evolved function of gene repression.
Identification of N6-mA in mouse embryonic stem cells
As SMRT sequencing usually requires high sequencing coverage to identify modified DNA bases15,16, it is difficult to interrogate large mammalian genomes (2.8 Gb of Mus musculus, for example) with this approach16. Therefore we developed a SMRT-ChIP approach to interrogate specific genomic regions of interest (Fig. 1a). As H2A.X deposition is strongly associated with cell fate transitions in mammals17, we focused on H2A.X deposition regions in embryonic stem (ES) cells in the current study. DNA molecules residing in H2A.X deposition regions in mouse ES cells were subject to SMRT sequencing directly without PCR amplification (Methods). In total, 90% of SMRT-ChIP reads overlapped with H2A.X deposition regions identified by traditional ChIP-seq in a previous work17 (Extended Data Fig. 1a).
Figure 1. A SMRT-ChIP approach identified N6-mA in mammalian genomes.
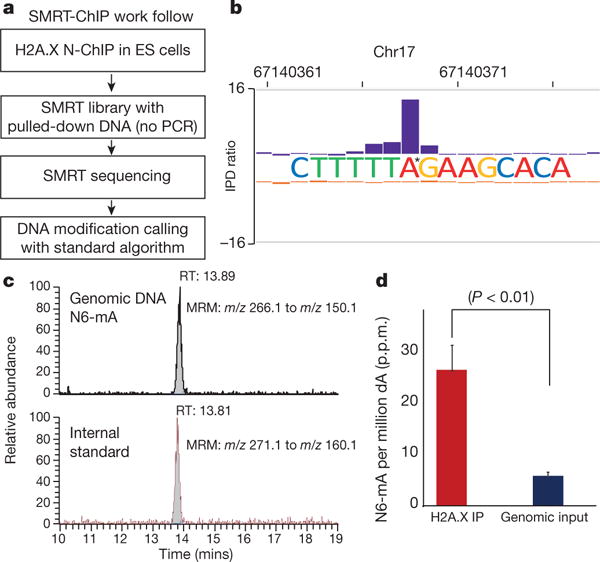
a, Schematic of SMRT-ChIP. b, Sequencing tracks of N6-mA in ES cells. IPD ratio, inter-pulse distance ratio. c, Top: LC-mass spectrometry analysis of N6-mA (m/z = 266.1 to m/z = 150.1). Bottom: stable isotope labelled N6-mA (m/z = 271.1 to m/z = 155.1), internal standard. MRM, multiple reaction monitoring. d, Quantification of the LC-MS/MS results. P < 0.01, t-test; error bars, ± s.e.m. of three biological replicates.
This approach identified N6-mA sites in H2A.X deposition regions with high confidence (398 sites at sequence coverage >30 ×, QV score ≥ 30 to 1,108 sites at sequence coverage >25×, QV score ≥ 20; see Extended Data Fig. 1b). A representative N6-mA site is shown in Fig. 1b. Several specific DNA motifs, which are different from H2A.X deposition motifs (Extended Data Fig. 1c), were significantly associated with these putative N6-mA sites, indicating that its distribution in the genome is controlled by yet unknown factors or pathways (Extended Data Fig. 1c). These N6-mA sites are enriched at intergenic, but not gene-rich regions (P < 2.2 × 10⁻¹⁶, Extended Data Fig. 1d).
We next confirmed the presence of N6-mA with mass spectrometry (MS). DNA molecules from the whole genome or H2A.X-deposition regions were subjected to an established and highly sensitive (LOQ: 1.6 fmol) mass spectrometry (liquid chromatography–mass spectrometry (LC-MS/MS)) approach18, which leverages stable isotope-labelled [15N5] N6-mA as an internal standard for sample enrichment and quantification (Fig. 1c, d and Extended Data Fig. 2a). This approach identified N6-mA in embryonic stem cells (Fig. 1c); and resulted in an estimate of a frequency of 25–30 p.p.m. of deoxyadenine (dA) in the H2A.X deposition regions for the N6-mA modification (Fig. 1d), a fourfold enrichment over the whole genomic input DNA samples (6–7 p.p.m.). We also investigated and found very low levels of N6-mA in other differentiated mouse cells and adult tissues (Extended Data Fig. 2b).
Importantly, none of the other known alkylation adducts, such as 1-methyladenine (N1mA), 3-methyladenine (N3mA) or 3-methylcytosine (N3mC)19, were detected from the H2A.X deposition region or whole genomic DNA samples (Extended Data Fig. 2c). Although it was reported that N1mA shares similar kinetic profiles to N6-mA in SMRT sequencing20, our mass spectrometry approach which can distinguish N6-mA from N1mA, which ruled out this possible explanation of the SMRT-ChIP data (Extended Data Fig. 2d, e).
Alkbh1 encodes a demethylase for N6-mA in ES cells
We next focused on identifying the N6-mA demethylase. The mammalian Alkbh family genes, which contain the conserved Fe2+ ion and 2-oxo-glutarate-dependent, dioxygenase domain, were promising candidates21. Among these genes, the proteins encoded by Alkbh2 and Alkbh3 can efficiently remove 1mA or 3mC from DNA or RNA, but not N6-mA (see refs 19 and 21). Alkbh1 is arguably the most intriguing member in this gene family: it shares the strongest similarity to bacteria demethylase Alkb, and yet only has negligible demethylation activities on 3mC in comparison to Alkh2 and Alkbh3 (see refs 19, 21). Additionally, an Alkbh1 deficiency in mice results in 80% reduction of the litter size due to embryonic lethality among other phenotypes, indicating that Alkbh1 plays a critical role in early development22,23.
We generated Alkbh 1 homozygous knockout embryonic stem cell lines (referred to as Alkbh1 knockout embryonic stem cells hereafter) via CRISPR/Cas9 technology (Extended Data Fig. 3a). Mass spectrometry analysis demonstrated that N6-mA levels in whole genomic input DNA or H2A.X deposition regions were both significantly increased (threefold to fourfold) in multiple Alkbh1 knockout embryonic stem cell clones (Fig. 2a). Similar elevated N6-mA levels in Alkbh1 knockout embryonic stem cells were confirmed by immunoblotting experiments with specific antibodies against N6-mA (Fig. 2b and Extended Data Fig. 3b–d). Previous work suggested that Alkbh1 may regulate histone H2A K118 or K119 methylation in embryonic stem cells24. We investigated and ruled out the possibility of Alkbh1 being a histone demethylase, as H2AK118/119 is predominately non-methylated in wild-type or Alkbh1 knockout ES cells (Extended Data Fig. 3e).
Figure 2. Alkbh1 is a demethylase for N6-mA in ES cells.
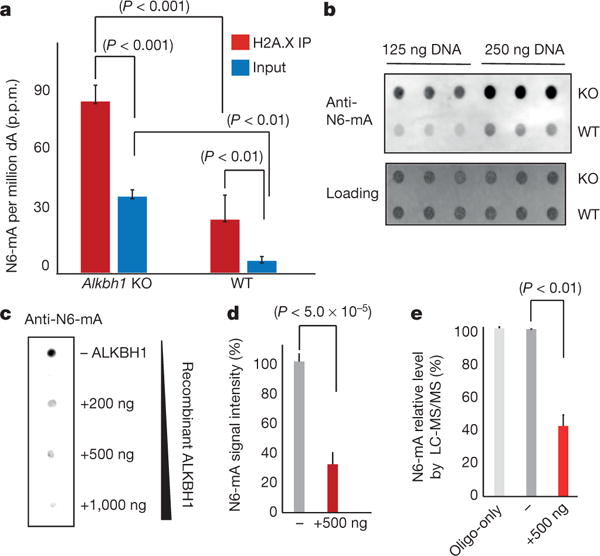
a, Mass spectrometry analysis of N6-mA in Alkbh1 knockout (KO) ES cells (P value determined by t-tests). b, Dot blotting of N6-mA in Alkbh1 knockout or wild-type (WT) ES cells (in triplicates). c, In vitro demethylation reaction with recombinant ALKBH1 proteins monitored by dot blotting (Methods). d, Quantification of demethylation activity in three independent demethylase assays in c (P value <5.0 × 10⁻⁵, t-test). e, In vitro demethylation reaction monitored by mass spectrometry (P value <0.01, t-test). Error bars, s.d. for three biological replicates.
We investigated the catalytic activities of recombinant ALKBH1 proteins with in vitro demethylation assays. The recombinant ALKBH1 proteins were generated with >95% purity (Extended Data Fig. 3f). Recombinant ALKBH1 can efficiently reduce N6-mA level from single-stranded synthetic oligonucleotide substrates (Fig. 2c–e), while its activities towards dual- or hemi-methylated double-stranded substrates are much reduced, suggesting the demethylation may be coupled with transcription and/or replication in vivo (Extended Data Fig. 3g). Furthermore, these activities are dependent on Fe2+ ion and 2-oxoglutarate, as expected for an active dioxygenase (Extended Data Fig. 3h).
The catalytic activities of ALKBH1 were further substantiated by a point mutant at a critical residue (D233A) that may coordinate the Fe2+ ion. Corroborated by the much reduced activities of the recombinant mutant proteins (D233A) (Extended Data Fig. 3i, j), the increase of N6-mA in Alkbh1 knockout mouse ES cells could be efficiently rescued by ectopic expression of wild-type but not mutant Alkbh1 (Extended Data Fig. 3k, l).
N6-mA suppresses transcription on ChrX
The identification of Alkbh1 as a N6-mA demethylase enabled us to test the functions of N6-mA in ES cells. As this modification may be an important component of epigenetic regulation of gene expression, we used a RNA-seq approach to interrogate the transcriptome of Alkbh1 knockout ES cells. Our analysis demonstrated that 550 genes were significantly downregulated (fragments per kilobase of transcript per million mapped reads (FPKM) >5, false discovery rate (FDR) <0.05, fold change >2 or <0.5, from Cuffdiff2) (Fig. 3a, and Supplementary Table 1), which can be verified by the RT-qPCR approach (Extended Data Fig. 4a). Although a small number of genes with low expression levels (70) were initially identified as upregulated by the RNA-seq analysis, they were probably false positives which cannot be verified with an RT-qPCR approach (0/5, Extended Data Fig. 4a, b), indicating that increasing the N6-mA level in ES cells leads to gene silencing. Gene ontology analysis showed that the most highly downregulated genes are enriched for developmental factors or lineage specifying genes (Extended Data Fig. 4c). On the other hand, the expressions of pluripotency genes, such as Oct4 and Nanog, were unaltered and Alkbh1 knockout ES cells maintained the undifferentiated morphology and were able to self-renew.
Figure 3. Alkbh1 deficiency silences genes on the X chromosome and young full-length L1 elements.
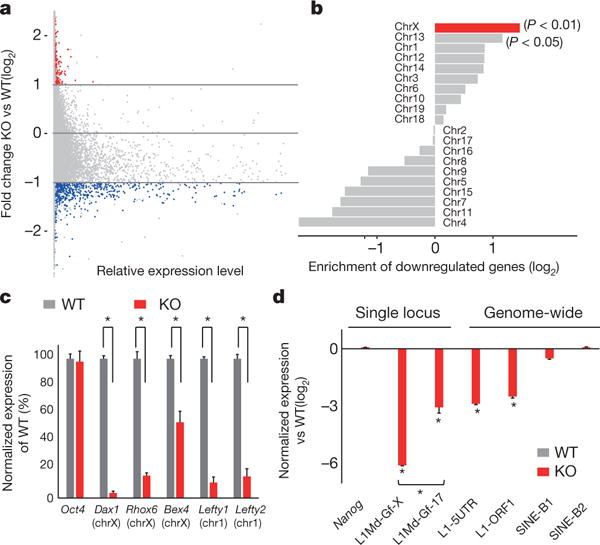
a, RNA-seq analysis of Alkbh1 knockout ES cells versus wild-type controls. Blue: most highly downregulated genes, red: upregulated genes (false positives, see main text). b, Downregulated genes were most enriched on X chromosome (P < 0.01, binomial test) and Chr13 to a lesser extent (P < 0.05, binomial test). c, qRT-PCR analysis of downregulated genes (*P < 0.05, t-test). d, RT-qPCR of transposon expression (*P < 0.01, t-test). L1Md-Gf-X: a young full-length L1 on Chr-X L1Md-Gf-17: a young full-length L1 on Chr17. Error bars, ± s.e.m. of three technical replicates.
Unexpectedly, the genomic locations of the downregulated genes have a strong chromosome bias (P < 0.01, binomial test): they are most significantly enriched on the X chromosome, whereas modestly enriched on Chr13 (P < 0.05, binomial test), but not on the other chromosomes (Fig. 3b). qRT–PCR analysis confirmed the downregulation of the X chromosome genes, together with other genes on autosomes (Fig. 3c). These results indicate that accumulation of N6-mA represses transcription on the X chromosome.
To test this hypothesis, we investigated the expression of young full-length LINE-1 transposons (L1 elements) which are specifically enriched on the X chromosome (see Fig. 4 and refs 25, 26). Owing to their unique sequences, the expression of such L1 elements can be interrogated and distinguished from other L1 subfamilies27. Our results demonstrated that a young full-length L1 (belong to the L1Md-Gf subfamily11,12) located on the X chromosome is more highly repressed (more than 60-fold) than its counterpart located on Chr17 (Fig. 3d). These results indicated that the L1 density may affect the silencing effects of N6-mA. A qRT–PCR approach targeting the 5′ UTR or open reading frame 1 (ORF1), which are usually retained in young full-length L1 elements, but not old truncated L1 elements10, also demonstrated a significant decrease of L1 expression, whereas the SINE family transposons were almost unaffected (Fig. 3d). Additionally, analyses of the transposons transcripts in the RNA-seq experiments confirmed the downregulation of the young full-length L1 subfamilies (Methods and Extended Data Fig. 4d). These results raised the intriguing possibility that genes and young full-length L1 elements on X chromosomes may be co-regulated by N6-mA.
Figure 4. N6-mA is enriched at young full-length L1 elements, which are located in the vicinity of the downregulated genes in Alkbh1 knockout ES cells.
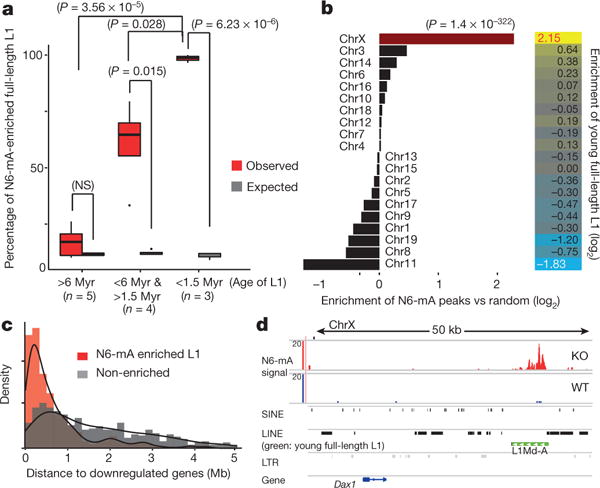
a, Enrichment of N6-mA on full-length L1 elements (P value determined by t-test). b, Left: relative enrichment of N6-mA peaks on each chromosome (P = 1.4 × 10−322, binomial test). Right: relative enrichment of young full-length L1 s on each chromosome. c, Normalized frequency of full-length L1 elements was plotted as a function of their genomic distance to downregulated genes (red, N6-mA enriched, median: 424 kb; grey, non-enriched, median: 1.6 Mb). d, The Dax1 gene locus.
N6-mA specifically targets young full-length L1 elements
The results suggest that N6-mA adopts a new function of transcriptional silencing in mammals, whereas it is implicated in gene activation in other species3–6. To further investigate N6-mA function, we sought to identify the differentially methylated regions (DMR) of N6-mA in Alkbh1 knockout ES cells.
As there is a global increase of N6-mA in Alkbh1 knockout cells as indicated by mass spectrometry analyses (Fig. 2). The SMRT-ChIP approach can only interrogate H2A.X deposition regions (Fig. 1a), so we performed a N6-mA DIP-seq (N6-mA DNA immunoprecipitation with anti-N6-methyladenine antibodies followed by next-generation sequencing) experiment (Methods). To validate this approach, we first investigated and determined its detection limit and lineage response range by a ‘spike-in experiment’ (Methods). With this approach, the detection limit is around 10–15 p.p.m. N6-mA (of adenine), while this approach cannot distinguish N6-mA from unmodified adenines at 5 p.p.m. N6-mA levels in Alkbh1 knockout cells (30–35 p.p.m.) is within the lineage range of this approach (20 to 120 p.p.m.) (Extended Data Fig. 5a).
Consistent with the genome-wide upregulation, N6-mA DIP-seq identified 37,581 N6-mA sites in Alkbh 1 knockout ES cells, in agreement with the estimate (35,000–40,000 sites) based on mass spectrometry results (30–35 p.p.m.). On the other hand, the N6-mA peaks in wild-type ES cells are under-represented as N6-mA frequency is only 6–7 p.p.m. in these cells. We also used SMRT-ChIP approach to interrogate N6-mA distribution in H2A.X deposition regions in Alkbh1 knockout ES cells (Extended Data Fig. 5b, c). Our results demonstrated that putative N6-mA sites called by SMRT-ChIP at various cutoffs (sequences coverage: 10× to 30×; QV: 20–30) significantly (P < 1.0 × 10⁻⁵; observed versus permutation) overlap with those identified by DIP-seq. In addition, the percentage of overlap increases with rising sequencing coverage and QV scores. These results further validate the SMRT-ChIP approach.
N6-mA peaks called from DIP-seq are enriched in intergenic regions, but not gene-coding regions (Extended Data Fig. 5e). Further analysis showed that N6-mA are deposited at LINE elements (Extended Data Fig. 5f), especially full-length L1 elements, but not the truncated ones (Extended Data Fig. 5g). Remarkably, N6-mA deposition at L1 elements is inversely correlated with their evolutionary age; over 99% of the young full-length L1 elements are enriched for N6-mA, whereas no such enrichment is observed on old L1 elements (Fig. 4a and Extended Data Fig. 5h). One of the major differences between the young and old L1 elements is that the former retain the 5′ UTR and ORF1 regions, whereas old L1 elements gradually lost their 5′ UTR and ORF1 during multiple rounds of remobilization in evolution and therefore became inactive10. N6-mA deposition is biased at the 5′ UTR and ORF1 regions rather than at the 3′ UTR (Extended Data Fig. 6a). This enrichment pattern was confirmed using a qPCR approach (Extended Data Fig. 6b).
Young full-length L1 elements are strongly enriched on X chromosomes over autosomes25,26, and our analysis corroborated this longstanding observation (Fig. 4b, P = 1.4 × 10−322). Consistent with this, N6-mA peaks in Alkbh1 knockout ES cells are also significantly enriched on the X chromosome over autosomes (Fig. 4b, P = 1.4 × 10−322). Therefore, these results are consistent with the downregulation of young full-length LINE-1 sequences and protein-coding genes located on X chromosomes (Fig. 3).
In classic epigenetic silencing pathways, the distance between the silencing centre and genes is a critical determinant of silencing. Consistent with notion, further analysis showed that the downregulated genes are located much closer to the N6-mA-enriched L1 elements (median: 424 kb) than to the non-enriched ones (median: 1.6 Mb) (Fig. 4c). Furthermore, the distances from downregulated genes to the N6-mA-enriched L1 elements fall within a narrow range (25–75%: 196–925 kb), while such distances to the non-enriched ones display greater variations (688 kb to 3.2 Mb, Extended Data Fig. 7a). The Nr0b1 (also known as Dax1) gene that was significantly downregulated in Alkbh1 knockout ES cells (Fig. 3) was not enriched for N6-mA; it is, however, located 30 kb from a N6-mA-enriched young full-length L1 (Fig. 4d, green). Other transposons located in this genomic region are not enriched for N6-mA (Fig. 4d).
The distances between either the ES-cell expressing genes in wild-type ES cells (FPKM >5.0 in RNA-seq) or downregulated genes in Alkbh1 knockout ES cells and young full-length L1 elements on Chr13 are significantly shorter than the other autosomes (P < 2.2 × 10⁻¹⁶, Extended Data Fig. 7b, c). However, on a few chromosomes which are devoid of the downregulated genes in Alkbh1 knockout ES cells, especially Chr11 and Chr4 (see Fig. 3), such distances are significantly longer than the other chromosomes (L1 to ES-cell-expressing genes: around 1,000 kb, P < 2.98 × 10⁻¹³; L1 to downregulated genes: around 800 kb, P ≤ 0.01 Extended Data Fig. 7b, c).
Increasing N6-mA levels leads to silencing
Our results indicated that N6-mA may have a direct effect on the transcription of L1 elements and their neighbouring genes. Thus, we investigated the impacts of N6-mA deposition on young full-length L1 elements and their neighbouring genes by interrogating the genome-wide deposition of several key epigenetic marks implicated in transcriptional regulation.
First, we focused on the effects of N6-mA on young full-length L1 elements. Our analysis demonstrated that although the genome-wide distribution and intensities of 5mC methylation sites are similar in Alkbh1 knockout and the wild-type control (Extended Data Fig. 8a), the 5mC level on the young full-length L1 elements is modestly higher in Alkbh1 knockout than wild-type control, while such differences are not observed on old L1 s elements (Fig. 5a) or SINEs (Extended Data Fig. 8b). Other epigenetic silencing marks, such as H3K9me3 (Fig. 5b), H3K27me3 and H2A.X, are deposited on young full-length L1 s elements at similar levels (Extended Data Fig. 8). Although these results are consistent with previous works showing that the young L1 elements are silenced by 5mC in human ES cells12, additional mechanisms may be also involved as the effects of 5mC seem to be modest.
Figure 5. N6-mA upregulation induced transcriptional silencing on the X chromosome, which is persistent during differentiation.
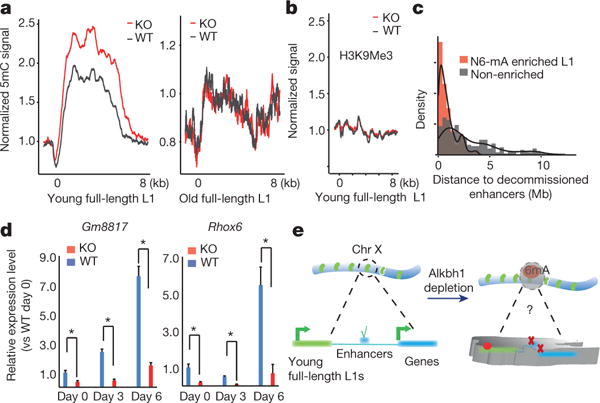
a, Aggregation of 5mC. b, Aggregation of H3K9Me3 signals. c, Normalized frequency of decommissioned enhancers was plotted as a function of their genomic distance to full-length L1 elements red, N6-mA enriched, median: 484 kb; grey, non-enriched, median: 2 Mb. d, RT-qPCR analysis of the Gm8817 and Rhox6 genes (on the X chromosome) during embryoid body differentiation. *P < 0.05, t-test; error bars, ± s.e.m. of three biological replicates. e, Schematics of Alkbh1 and N6-mA functions (see main text).
We interrogated the epigenetic status of the enhancers and the results demonstrated that 450 enhancers (Supplementary Table 3) are decommissioned, as their H3K27Ac levels are significantly decreased in Alkbh1 knockout ES cells (one locus shown in Extended Data Fig. 8c). These decommissioned enhancers are located much closer to N6-mA-enriched L1 elements (median: 485 kb) than non-enriched ones (2.03 Mb, Fig. 5c). Furthermore, such distances fall into a much narrower range (25–75%: 197–985 kb) than those to the non-enriched ones (806 kb to 3.8 Mb) (Extended Data Fig. 8d). Furthermore, the H3K4Me3 levels are reduced at the transcription start sites of the downregulated genes (but not at the unaffected ones) (Extended Data Fig. 8e). These data demonstrate that N6-mA deposition at L1 is correlated with the downregulation of nearby genes at the transcription level.
The potential effects of N6-mA deposition on X chromosome genes during differentiation was investigated. Embyroid body formation and differentiation assays were performed. Although the Alkbh1 knockout ES cells are able to differentiate, the cell fate decisions (relative gene expression levels of the three germ layer marks after differentiation) are imbalanced, as is consistent with previous reports (Extended Data Fig. 9). X chromosome genes, such as Gm8817 and Rhox6 (ref. 28), failed to be activated to the normal level in Alkbh1 knockout ES-cell-derived embryoid bodies (Fig. 5d), indicating that N6-mA modifications have long-lasting effects on activation of the genes during differentiation.
Discussion
We have developed a novel approach (SMRT-ChIP) to interrogate DNA modifications in specific genomic regions, resulting in the discovery of N6-mA in the mammalian genome and the identification of the demethylase Alkbh1. These findings challenge the prevailing paradigm that 5mC is the only form of DNA methylation in the mammalian genome.
N6-mA seems to have adopted new functions during evolution. In mammalian ES cells, N6-mA accumulation on young full-length L1 elements correlates with direct silencing of such L1 elements, as well as decommissioning of nearby enhancers and genes, which is in direct contrast to the role of N6-mA in simple eukaryotes and invertebrates4–6. In addition, the only Fe2+, 2KG-dependent dioxy genase orthologue in the Drosophila genome has been reported to demethylate N6-mA in DNA4 and oxidize 5mC in RNA29, whereas the functions of mammalian orthologues (Tet1–3 and Alkbh1–8 genes) are much divergent. N6-mA silencing of L1 transposons in Albkh1-deficient cells is inversely correlated with the evolutionary age of the transposon; the full-length, young L1 elements are specifically targeted and silenced by N6-mA. Although the precise reasons for this remains elusive, our results showed that N6-mA deposition is strong on the unique 5′ UTR and ORF1 regions of such L1 elements which harbour the promoters. These results also suggest that Alkbh1 must be targeted to these regions in wild-type ES cells and future investigation will determine molecular underpinning of this specific targeting. Furthermore, as young full-length L1 elements are strongly enriched on the X chromosome, N6-mA deposition displays a strong bias towards the X chromosome. As such, our findings herein may shed new light on the longstanding hypothesis of L1 function during X inactivation proposed by M. Lyon30. Although young full-length L1 elements are active during early embryogenesis31, constant activation may cause genomic instability as they are capable of reintegration10,11, which implies the existence of a previously unknown silencing mechanism. We favour the view that N6-mA-mediated silencing plays an important role in safeguarding active L1 elements in mammalian genomes. The levels of N6-mA are controlled precisely by Alkbh1 in ES cells such that they favour L1 transcription while preventing it from succumbing to overactivation and genomic instability, which is reminiscent of the function of a rheostat (Fig. 5e). In addition, LINE-1 s are inactive in a group of South American rodents, in which a new family of endogenous retrotransposons (mysTR) has emerged32. It will be interesting to determine the presence and functions of N6-mA in these rodents. During the review process of this manuscript, Koziol et al. reported the presence of N6-mA in adult mouse tissues33. However, N6-mA levels in these tissues seem to be lower than the detection limit of the DIP-seq approach33. Note that different statistical thresholds were applied in their bioinformatic analyses33 and discrepancies between the two studies still need to be resolved. Taken together, the discovery of N6-mA in mammalian ES cells sheds new light on epigenetic regulation during early embryogenesis and may have impacts in the fields of epigenetics, stem cells and developmental biology.
METHODS
Mouse ES cell culture
Mouse TT2 ES cells were cultured on gelatin coating plates with recombinant LIF. ES cells were grown in DMEM supplemented with 15% fetal bovine serum, 1% non-essential amino acids, 2 mM L-glutamine, 1,000 units of mLIF (EMD Millipore), 0.1 mM β-mercaptoethanol (Sigma) and antibiotics.
Generation of Alkbh1 knockout ES cell lines with CRISPR-Cas9
A doxycycline (Dox)-inducible Cas9–eGFP ES cell line was established with TT2 ESC. Guide RNA oligos (5′-accgAGTGCCTCTGGCATCCCGGG-3′, 5′-aaacCCCGGGATGCCAGAGGCACT-3′) were annealed and cloned into a pLKO.1-based construct (Addgene: 52628). Guide RNA virus was made in 293FT cells and infected inducible Cas9 ES cells. ES cells were first selected with Puromycin (1 μg ml−1) for two days, and Dox (0.5 μg ml−1) was added to induce Cas9–eGFP expression for 24 h. ES cells were then seeded at low density to obtain single-derived colonies. Then, 72 ES cell colonies were randomly picked up and screened by PCR-enzyme digestion that is illustrated in Extended Data Fig. 3a. PCR screening primers flanking guide RNA sequence were designed as following: 5′-AGGCAGATTTCTGAGTTCAAGG-3′ and 5′-TTTAGTCATGTGCTTGTCCAGG-3′.
PCR products were digested by XmaI overnight at 37 degrees and separated on 2% agarose gel. A total of 8 mutants from which PCR products show resistance to XmaI digestion were subjected to DNA sequencing. Clones that harbour deletion and coding frame shift (premature termination mutation) were expanded and used in this study.
Expression of ALKBH1 protein in 293FT cells and generation of ALKBH1 mutation proteins
Human Alkbh-Flag DNA sequence was inserted into pCW lenti-virus based vector (puromycin or hygromycin resistance). The amino acid of D233 was mutated to A by QuickChange Site-Directed Mutagenesis (QuikChange II XL Site-Directed Mutagenesis Kit, number 200521, Agilent) according to the manual. For Alkbh1 rescue experiment, wild-type and D233A mutated Alkbh1 constructs were introduced to Alkbh1 knockout ES cells, pCW-Hygromycin was chosen as control. After infections, the cells were selected with hygromycin at 200 μg ml−1 for 4 days, and then the cells were expanded to isolate genomic DNA for N6-mA dot blotting or other tests.
The 293FT cells were transfected with pCW-hAlkbh1 and pCW-hAlkbh1-D233A mutant plasmids along with package plasmids of pMD2.G and pSPAX2. Culture medium was changed 10 h after transfection. The viruses were collected and concentrated 24 and 48 h after transfecction according to manufacturer’s instructions (Lenti-X Concentrator, Clontech). To establish stable expression of hAlkbh1 and hAlkbh1-D233A cell lines, 293FT cells were infected the corresponding virus, and then select with puromycin at 1 μg ml−1 for 4 days. The stable cell lines of hAlkbh1-293FT and D233A-293FT were expanded to purify the proteins according to the previous reported method with some modifications34. Briefly, M2 Flag antibody was added to the nuclear extract and incubated overnight, and then Dynabeads M-280 (sheep anti-mouse IgG, from Life Technology) was added to the above solution and incubated for 3–4 h. Subsequently, the beads were separated from the solution and washed clean with washing buffer34. Finally, the beads were eluted with 3 × Flag peptides, followed by standard chromatography purification to 95% purity. Proteins were analysed by mass spectrometry.
ALKBH1 demethylase assays
Demethylation assays were performed in 50 μl volume, which contained 50 pmol of DNA oligos and 500 ng recombinant ALKBH1 (or D233A mutant) protein. The reaction mixture also consisted of 50 μM KCl, 1mM MgCl2, 50 μM HEPES (pH = 7.0), 2 mM ascorbic acid, 1 mM-KG, and 1 mM (NH4)2Fe(SO4)2.6H2O. Reactions were performed at 37 degrees for 1 h and then stopped with EDTA followed by heating at 95 degrees for 5 min. Then the reaction product was subjected to dot blotting. Substrate sequences are listed in Supplementary Table 2.
Dot blotting
First, DNA samples were denatured at 95 degrees for 5 min, cooled down on ice, neutralized with 10% vol of 6.6 M ammonium acetate. Samples were spotted on the membrane (Amersham Hybond-N+, GE) and air dry for 5 min, then UV-crosslink (2× auto-crosslink, 1800 UV Stratalinker, STRATAGENE). Membranes were blocked in blocking buffer (5% milk, 1% BSA, PBST) for 2 h at room temperature, incubated with 6mA antibodies (202-003, Synaptic Systems, 1:1000) overnight at 4 degrees. After 5 washes, membranes were incubated with HRP linked secondary anti-rabbit IgG antibody (1:5,000, Cell Signaling 7074S) for 30 min at room temperature. Signals were detected with ECL Plus Western Blotting Reagent Pack (GE Healthcare).
Single molecule real-time sequencing (SMRT) library construction of genomic DNA samples and PCR control
DNA samples were purified by standard N-ChIP protocol. 5 μg anti-H2A.X antibodies were used per 10 million cells. DNA (250 ng) from ChIP pull-down were converted to SMRTbell templates using the PacBio RS DNA Template Preparation Kit 1.0 (PacBio catalogue number 100-259-100) following manufacturer’s instructions. Control samples were amplified by PCR (18 cycles). In brief, samples were end-repaired and ligated to blunt adaptors. Exonuclease incubation was carried out in order to remove all unligated adapters. Samples were extracted twice (0.6 × AMPure beads) and the final ‘SMRTbells’ were eluted in 10 μl embryoid bodies. Final quantification was carried out on an Agilent 2100 Bioanalyzer with 1 μl of library. The amount of primer and polymerase required for the binding reaction was determined using the SMRTbell concentration (ng μl−1) and insert size previously determined using the manufacturer-provided calculator. Primers were annealed and polymerase was bound using the DNA/Polymerase Binding Kit P4 (PacBio catalogue number 100-236-500) and sequenced using DNA sequencing reagent 2.0 (PacBio catalogue number 100-216-400). Sequencing was performed on PacBio RS II sequencer using SMRT Cell 8Pac V3 (PacBio catalogue number 100-171-800). In all sequencing runs, a 240 min movie was captured for each SMRT Cell loaded with a single binding complex.
Detection of modified nucleotides with SMRT sequencing data
Base modification was detected using SMRT Analysis 2.3.0 (Pacific Biosciences), which uses previously published methods for identifying modified bases based on inter-pulse duration ratios in the sequencing data35. All calculations used the Mus musculus mm10 genome as a reference. For the detection of modified bases in individual samples, the RS_Modification_Detection.1 protocol was used with the default parameters. Modifications were only called if the computed modification QV was better than 20, corresponding to P < 0.01 (versus in silico model, Welch’s t-test). The in silico model considers the IPDs from the eight nucleotides 5′ through the three nucleotides 3′ of the site in question. Only the sites with a sequencing coverage higher than 25 fold were used for subsequent analyses. To assess the significance of the overlap between N6-mA sites by SMRT-ChIP and peaks from DIP-seq, intersection with DIP-seq peaks was analysed for each of the N6-mA site called by SMRT-ChIP. To assess if the overlap is higher than expected by random chance, a permutation based approach was used, in which we randomly shuffle the original mapping between “As” that meet coverage cutoff and their corresponding QV scores, and estimated the expected overlap by random chance. As preparation for PacBio RS II sequencing, these relatively short DNA fragments (200–1,000 base pairs on average) were made topologically circular, allowing each base to be read many times by a single sequencing polymerase. Thus, the coverage requirement for modification detection was achieved both by sequencing different fragments pulled down from the same genomic regions and by sequencing the same fragment with many passes. Of note, the SMRT-ChIP approach did not identify more N6-mA sites in Alkbh1 knockout cells than wild-type cells. Although the exact reason remain to be identified, our analysis showed that much fewer adenines are sequenced at a comparable coverage in Alkbh1 knockout cells than wild-type cells (Extended Data Fig. 5c and Extended Data Fig. 1b), presumably due to the difficulty of using native ChIP approach to isolate H2A.X-deposition regions from Alkbh1 knockout cells because of heterochromatinization.
N6-mA-DNA-IP sequencing and analysis
Genomic DNA from wild-type or knockout ES cells was purified with DNeasy kit (QIAGEN, 69504). For each sample, 5 μg DNA was sonicated to 200–500 bp with Bioruptor. Then, adaptors were ligated to genomic DNA fragments following the Illumina protocol. The ligated DNA fragments were denatured at 95 degree for 5 min. Then, the single-stranded DNA fragments were immunoprecipitated with 6 mA antibodies (5 μg for each reaction, 202-003, Synaptic Systems) overnight at 4 degrees. N6-Me-dA enriched DNA fragments were purified according to the Active Motif hMeDIP protocol. IP DNA and input DNA were PCR amplified with Illumina indexing primers. The same volume WT and KO DNA samples were subjected to multiplexed library construction and sequencing with Illumina HiSeq2000. After sequencing and filter, high quality raw reads were aligned to the mouse genome (UCSC, mm10) with bowtie (2.2.4, default)36. By default, bowtie searches for multiple alignments and only reports the best match; for repeat sequences, such as transposons, bowtie reports the best matched locus or random one from the best-matched loci. After alignment, N6-mA enriched regions were called with SICER (version 1.1, FDR <1.0 × 10⁻¹⁵, input DNA as control)37. Higher FDR cut-off could not further reduce N6-mA peak number. MACS2 was also used for peak calling, which generated similar results as SICER. Part of the data analysis was done by in-house customized scripts in R, Python or Perl. Genomic DNA samples from mouse fibroblast cells (where the endogenous N6-mA level is undetectable) were spiked with increasing amount of N6-mA-containing, or unmodified (control), oligonucleotides, and the N6-mA levels were determined by qPCR approach after DIP and library construction.
5mC DNA-IP sequencing
Followed manufacture’s protocol (Active Motif 5mC MeDIP kit). The 5 mC data processed with MEDIPS in Bioconductor, and in-house scripts in R, Python or Perl.
ChIP-sequencing and data analysis pipeline
Native chromatin immunoprecipitation (N-ChIP) assay was performed as previously described. 10 million ES cells were used for each ChIP and massive parallel sequencing (ChIP-seq) experiment. Cell fractionation and chromatin pellet isolation were performed as described. Chromatin pellets were briefly digested with micrococcal nuclease (New England BioLabs) and the mononucleosomes were monitored by electrophoresis. Co-purified DNA molecules were isolated and quantified (100–200 ng for sequencing). Co-purified DNA and whole cell extraction (WCE) input genomic DNA were subject to library construction, cluster generation and next-generation sequencing (Illumina HiSeq 2000).
The output sequencing reads were filtered and pre-analyzed with Illumina standard workflow. After filtration, the qualified tags (in fastq format) were aligned to the mouse genome (UCSC, mm10) with bowtie (2.2.4, default)36. Then, these aligned reads were used for peak calling with the SICER algorithm (input control was used as control in peak calling).
Bioinformatics analysis of epigenetics ChIP Sequencing data
H3K4Me1 and H3K27Ac ChIP-seq data were aligned to mouse genome (mm10) and peaks were called with SICER. H3K4Me1 and H3K27Ac enriched regions were defined as enhancers. Then, RSEG38 (mode 3) was to call the H3K27Ac differentiated regions. Decommissioned enhancers in KO cells are determined by H3K27Ac downregulation (compared to wild-type cells).
Detection of H3K4Me3 in knockout cells with ChIP-qPCR
Native ChIP-qPCR assay was used to validate H4K4Me3 at levels on gene promoters (Extended Data Fig. 8). All procedures were similar to what has been described in ChIP-seq experiments, except that the co-purified DNA molecules were diluted and subject to qPCR (histone H3K4Me3 antibodies: Abcam Ab8580). Real-time PCR was performed with SybrGreen Reagent (Qiagen, QuantiTect SYBR Green PCR Kit, Cat: 204143) and quantified by a CFX96 system (BioRAD, Inc.).
RNA-seq and confirmation by RT-qPCR approaches
RNA was extracted with miRNeasy kit (QIAGEN, 217004) and standard RNA protocol. The quality of RNA samples was measured using the Agilent Bioanalyzer. Then, RNA was prepared for sequencing using standard Illumina ‘TruSeq’ single-end stranded or ‘Pair-End’ mRNA-seq library preparation protocols. 50 bp of single-end and 100 bp of pair-end sequencing were performed on an Illumina HiSeq 2000 instrument at Yale Stem Cell Center Genomics Core. RNA-seq reads were aligned to mm9 with splicing sites library with Tophat39 (2.0.4, default parameters). The gene model and FPKM were obtained from Cufflink2. The differentially expressed genes were identified by Cuffdiff40 (2.0.0, default parameters). To make sure the normalization is appropriate, the data were also analysed with DESeq2 (default parameters), which generated similar results (Extended Data Fig. 4b). For transposons analysis, unique best alignment reads were used (alignment with bowtie (0.12.9), -m 1; or BWA) and calculated RPKM for each subfamily. For qPCR, the cDNA libraries were generated with First-strand synthesis kit (Invitrogen). Real-time PCR was performed with SybrGreen Reagent (Qiagen, QuantiTect SYBR Green PCR Kit, Cat: 204143) and quantified by a CFX96 system (BioRAD, Inc.). For Fig. 3d, the specific loci L1Md elements primers were designed and optimized based on ref. 27.
Embryoid body differentiation
For embryoid body differentiation experiment, feeder-free cultured ES cells were treated with 0.5% trypsin-EDTA free solution and resuspended with culture medium and counted. Then, cells were seeded at 200,000 cells per ml to Petri dishes with embryoid body differentiation medium (ESC medium without LIF and beta-ME). Medium was changed every 2 days.
Histone mass spectrometry
Histones were isolated in biological triplicate from wild-type and Alkbh1 knockout cells by acid-extraction and resolved/visualized by SDS–PAGE/Coomassie staining. The low molecular weight region of the gel corresponding to core histones was excised and de-stained. The excised gel region containing the histones was treated with d6-acetic anhydride to convert unmodified lysine resides to heavy acetylated lysines (45 Da mass addition) as reported in ref. 41. Following d6-acetic anhydride treatment, the gel region was subjected to in-gel trypsin digestion. Histone peptides were analysed with a Thermo Velos Orbitrap mass spectrometer coupled to a Waters nanoACQUITY LC system as detailed in ref. 42. Tandem mass spectrometric data was searched with Mascot for the following possible modifications: heavy lysine acetylation, lysine acetylation, lysine monomethylation, lysine dimethylation and lysine trimethylation. For each biological replicate, histone H2A was identified with 100% sequence coverage across K118/119 that revealed predominately no detectable lysine methylation.
LC-MS/MS method for the determination of N6-methyladenine
DNA was digested with DNA Degradase Plus (Zymo Research) by following the manufacturer’s instructions with small modification. Briefly, the digestion reaction was carried out at 37 °C for 70 min in a 25 μl final volume containing 5 units of DNA Degradase Plus and 5 fMol of internal standard. Following digestion, reaction mixture was diluted to 110 μl and the digested DNA solution was filtered with a Pall NanoSep 3kDa filter (Port Washington, NY) at 8,000 r.p.m. for 15 min. After centrifugal filtration, the digested DNA solution was injected onto an Agilent 1200 HPLC fraction collection system equipped with a diode-array detector (Agilent Technologies, Santa Clara, CA). Analytes were separated by reversed-phase liquid chromatography using an Atlantis C18 T3 (150 × 4.6 mm, 3 (μm) column. The column temperature was kept at 30 °C. For the purification of N6-mA, the mobile phases were water with 0.1% acetic acid (A) and acetonitrile with 0.1% acetic acid (B). The flow rate was 1.0 ml min−1 with a starting condition of 2% B, which was held for 5 min, followed by a linear gradient of 4% B at 20 min, 10% B at 30 min, followed by 6 min at 80% B, then re-equilibration at the starting conditions for 20 min. dA and 6-Me-dA eluted with retention times of 14.7 and 27.0 min, respectively. The amount of dA in samples was quantitated by the UV peak area (λ = 254 nm) at the corresponding retention time using a calibration curve ranging from 0.2 to 5 nMol dA on column. For the simultaneous purification of N3-Me-dC, N1-Me-dA, N3-Me-dA, N6-Me-dA and dA, the mobile phases were water with 5 mM ammonium acetate (A) and acetonitrile (B). The flow rate was 0.45 ml min−1 and the gradient elution program was set at following conditions: 0 min, 1% B; 2 min, 1% B; 40 min, 4% B; 60 min, 30% B; 65 min, 30% B; 65.5 min, 1% B, and 75 min, 1% B. N3-Me-dC, N1-Me-dA, N3-Me-dA, N6-Me-dA and dA eluted with retention times of 24.8, 25.0, 22.0, 60.2 and 54.2 min, respectively. The amount of dA in samples was quantitated by the UV peak area (λ = 254 nm) at the corresponding retention time using a calibration curve ranging from 0.9 to 7.2 nMol dA on the column. HPLC fractions containing target analyte were dried in a SpeedVac and reconstituted in 22 μl of D.I. water before LC-MS/MS analysis.
LC-MS-MS analysis of N3-Me-dC, N1-Me-dA, N3-Me-dA and N6-Me-dA was performed on Ultra Performance Liquid Chromatography system from Waters Corporation (Milford, MA) coupled to TSQ Quantum Ultra triple-stage quadrupole mass spectrometer (Thermo Scientific, San Jose, CA). 20 μl of sample was introduced into mass spectrometry through a 100 mm × 2.1 mm HSS T3 column (Waters) at flow rate of 0.15 ml/min. Mobile phases were comprised of water with 0.1% formic acid (A) or acetonitrile (B). Elution gradient condition was set as following: 0 min, 1%B; 3 min, 1%B; 15 min, 7.5%B; 15.5 min, 1%B; 20 min, 1%B. Ionization was operated in positive mode and analytes were detected in selected reaction monitoring (SRM) mode. Specifically, 6-Me-dA and its internal standard were detected by monitoring transition ions of m/z = 266.1 to m/z = 150.1 and m/z = 271.1 to m/z = 155.1, respectively. Similarly, N3-Me-dC, N1-Me-dA and N3-Me-dA was detected by monitoring transition ions of m/z = 242.1 to m/z = 126.1, m/z = 266.1 to m/z = 150.1 and m/z = 266.1 to m/z = 150.1, respectively. Mass spectrometry conditions were set as following: source voltage, 3,000 V; temperature of ion transfer tube, 280 °C; skimmer offset, 0; scan speed, 75 ms; scan width, 0.7 m/z; Q1 and Q3 peak width, 0.7 m/z; collision energy, 17 eV; collision gas (argon), 1.5 arbitrary units. For quantification of N6-Me-dA, the linear calibration curves ranging from 1.5 to 750 fMol, were obtained using the ratio of integrated peak area of the analytical standard over that of the internal standard. The linear calibration curves for analysis of N3-Me-dC, N1-Me-dA and N3-Me-dA were obtained using integrated peak area of the analytical standard. N3-Me-dA is not commercial available and was prepared from the reaction between 3-methyladenine and deoxythymidine in the presence of nucleoside deoxyribosyltransferase II. The chemical identity of purified N3-Me-dA was confirmed by using an Agilent 1200 series Diode Array Detector (DAD) HPLC system coupled with Agilent quadrupole-time-of-flight (QTOF)-MS (Agilent Technologies, Santa Clara, CA). Electrospray ionization (ESI)-MS-MS spectrum of N3-Me-dA was obtained by in source fragmentation. One product ion was observed from MS/MS spectra of the protonated precursor ion of N3-Me-dA, resulting from the loss of the deoxyribosyl group. The accurate masses for parent and fragment ion are m/z = 266.1253 and m/z = 150.0774, with mass error 0.4 p.p.m. and 3.8 p.p.m., respectively. The method sensitivity for N3-Me-dC, N1-Me-dA, N3-Me-dA and N6-Me-dA was detected at 1.0 fmol, 1.6 fmol, 1.0 fmol and 1.6 fmol, respectively. In order to confirm the chemical identity of the N6-Me-dA isolated from HLPC purification, HPLC fractions containing N6-Me-dA was analysed by HPLC-QTOF-MS/MS. The chemical identity of N6-Me-dA in HPLC fractions was characterized on an Agilent 1200 series Diode Array Detector (DAD) HPLC system coupled with Agilent quadrupole-time-of-flight (QTOF)-MS (Agilent Technologies, Santa Clara, CA). HPLC separation was carried out on a C18 reverse phase column (Waters Atlantis T3, 3 μM, 150 mm × 2.1 mm) with a flow rate at 0.15 ml min−1 and mobile phase A (0.05% acetic acid in water) and B (acetonitrile). The gradient elution program was set at following conditions: 0 min, 1% B; 2 min, 1% B; 15 min, 30% B; 15.5 min, 1% B; and 25 min, 1% B. N6-Me-dA was eluted with retention times of 12.7 min. The electrospray ion source in positive mode with the following conditions were used: gas temperature, 200 °C; drying gas flow, 12 litres per min; nebulizer, 35 psi; Vcap, 4000 V; fragmentor, 175 V; skimmer, 67 V. Electrospray ionization (ESI)-MS-MS spectrum of N6-Me-dA isolated from genomic DNA was obtained by in source fragmentation. One product ion was observed from MS/MS spectra of the protonated precursor ion of N6-Me-dA, resulting from the loss of the deoxyribosyl group. The accurate masses for parent and fragment ion are m/z = 266.1245 and m/z = 150.0775, with mass error 3.0 p.p.m. and 3.1 p.p.m., respectively. The same MS/MS fragmentation spectra was obtained from analytical standard of N6-Me-dA.
For in vitro demethylation assay, sample was treated with EDTA to remove Fe2+. The mixture was transferred to Amicon Ultra Centrifugal Filter (EMD Millipore Corporation, 10K MWCO), followed by spin at 11,000 r.p.m. and 4 °C for 14 min. The concentrated sample was wash three times by adding 500 μl DI-H2O, followed spin at 11,000 r.p.m. and 4 °C for 14 min. The washed sample was digested with DNA Degradase Plus (Zymo Research) by following manufacturer’s instruction with small modification. Briefly, the digestion reaction was carried out at 37 °C for 60 min in 60 μl final volume containing 0.17 units per μl of DNA Degradase Plus and 50 fmol of Internal Standard of N6-Me-dA. Following digestion, reaction mixture was filtered with a Pall NanoSep 3kDa filter (Port Washington, NY) at 10000g and room temperature for 10 min to remove enzyme. The LC-MS/MS conditions for the quantification of dA and N6-Me-dA were set the same as those for quantification of N6-Me-dA in in vivo samples. The linear calibration curves for quantification of dA and N6-Me-dA was obtained using the ratio of integrated peak area of the analytical standard over that of the internal standard of N6-Me-dA.
Extended Data
Extended Data Figure 1. Low N6-mA levels in adult tissues and the lack of DNA alkylation adducts in ES cells.
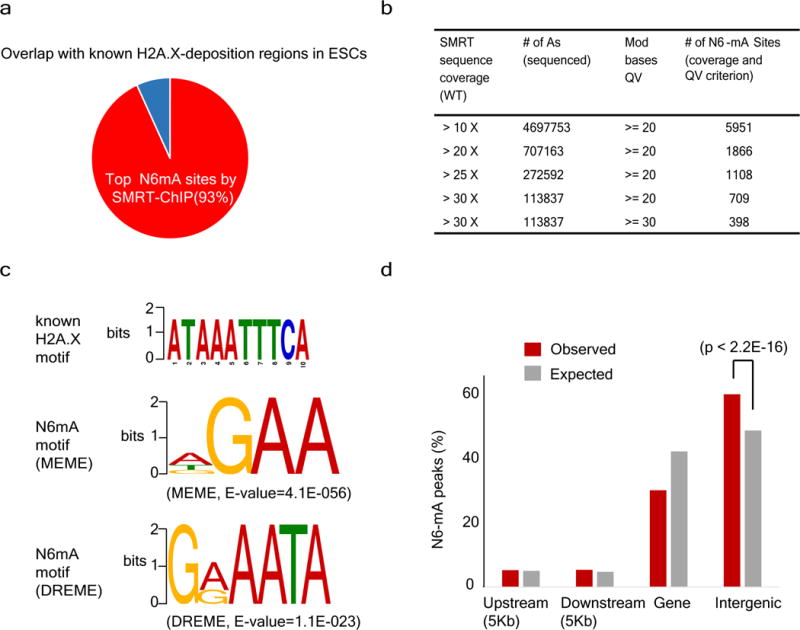
a, A majority of N6-mA peaks identified by SMRT-ChIP is located in H2A.X deposition region in ESCs determined by native ChIP. b, Number of SMRT-ChIP N6-mA sites at different coverage and QV cut-off. c, Top: A DNA motif of H2A.X deposition region determine with standard ChIP-seq. Bottom: sequence motifs for N6-mA peaks at H2A.X deposition regions determined with SMRT-ChIP. d, Distribution of N6-mA peaks at H2A.X deposition regions (P value determined by binomial test).
Extended Data Figure 2. LC-MS/MS data of N6-mA.
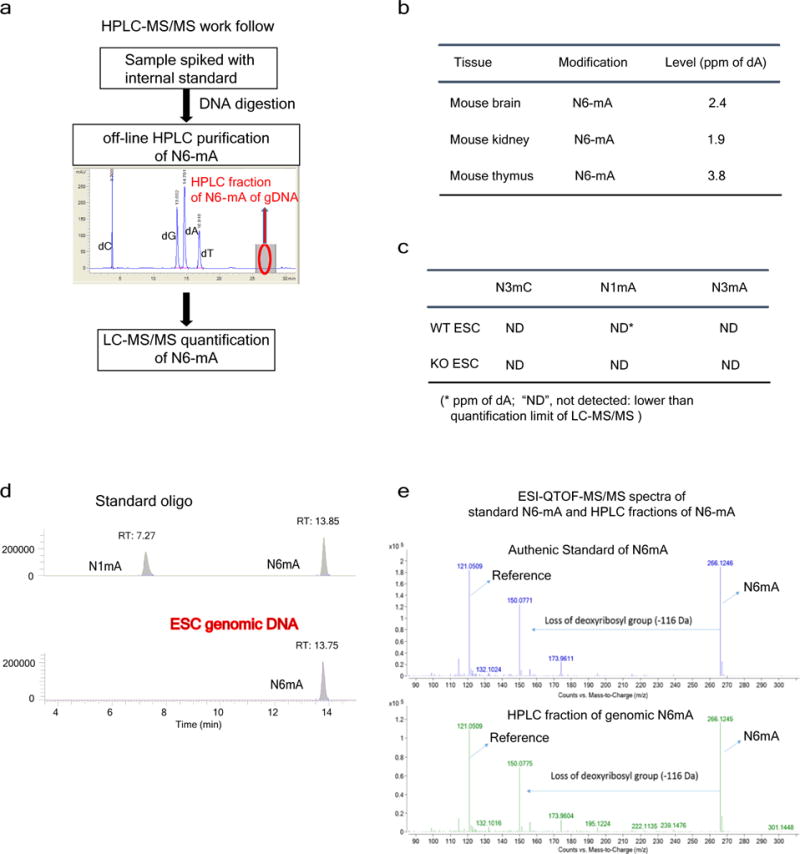
a, Experimental workflow for determining N6-mA level with LC-MS/MS. [15N5]N6-mA was used as the internal standard. b, N6-mA levels are ultralow in adult tissues. c, No detection of DNA alkylation adducts, such as N1-mA, N3-mA or N3-mC in mouse ES cells or Alkbh1 knockout cells by MS. d, LC-MS/MS analysis of N1-mA or N6-mA digested from synthetic oligonucleotides (top) and ES cell DNA samples (bottom). e, ESI-QTOF-MS/MS spectra of analytical standard of N6-mA nucleosides (top) and N6-mA containing HPLC fraction from ES cells.
Extended Data Figure 3. Alkbh1 is a specific N6-mA demethylase in vivo and in vitro.
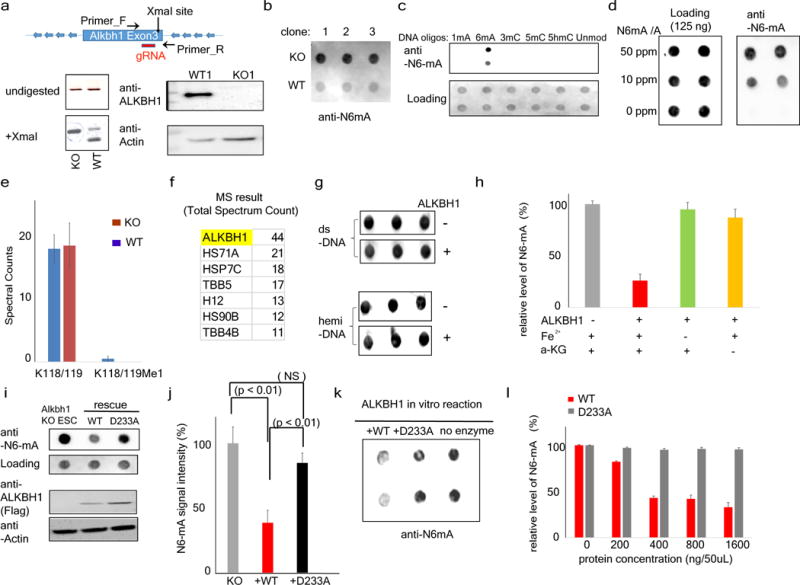
a, Top: schematic of the CRISPR–Cas9 approach. Alkbh1 KO alleles don’t contain the XmaI site at exon 3. Bottom left: PCR-DNA digestion approach indicating the homozygosity of the knockout alleles, which are resistant to Xma1 digestion. Bottom right: western blotting did not detect any ALKBH1 proteins in the KO cells. b, Three additional Alkbh1 knockout ES cell clones show similar levels of N6-mA upregulation. Shown are dot blot results. c, Validating the specificity of anti-N6-mA antibodies with synthetic oligonucleotides. d, Validating the specificity of anti-N6-mA antibodies with DNA samples of different N6-mA/dA ratio. 125 ng of genomic DNA (MEFs) which does not contain any endogenous N6-mA was spiked with N6-mA containing oligonucleotides at the indicated concentration. e, Tandem mass spectrometric analysis shows the lack of H2AK118/119 methylation in wild-type or Alkbh1 knockout ES cells. Spectral counts for H2A peptides containing K118/119 revealed that H2AK118/119 is predominately non-methylated at similar levels between wild-type and Alkbh1 knockout ES cells. Spectral counts are reported as an average with standard deviation from biological triplicate analyses. K118/119: no methylation; K118/119me1: K118/119 monomethylation. f, MS analysis showed that the co-purified factors with recombinant ALKBH1 proteins are mainly heat shock proteins. g, ALKBH1 proteins don’t have noticeable activities towards to dual- or hemi-methylated double-stranded oligonucleotide substrates. h, ALKBH1 activities are dependent on Fe2+ and α-KG. Error bars: standard deviation of triplicates. i, Ectopic expression of wild-type, but not mutant, Alkbh1 (D233A) at the catalytic motif, can rescue the aberrant increase of N6-mA level in Alkbh1 knockout ES cells. The wild-type and mutant Alkbh1 were expressed at similar levels. j, Quantification of three independent rescue experiments in i. P value as labelled, determined by t-test; error bars, s.d. for three biological replicates. k, The demethylation activity of N6-mA by recombinant D233A mutant protein is much reduced in comparison with the wild-type counterpart. l, No significant activities were detected with increasing concentrations of recombinant D233A mutant proteins in demethylation reaction. Error bars, s.d. of triplicates.
Extended Data Figure 4. RNA-seq analysis in Alkbh1 knockout ES cells.
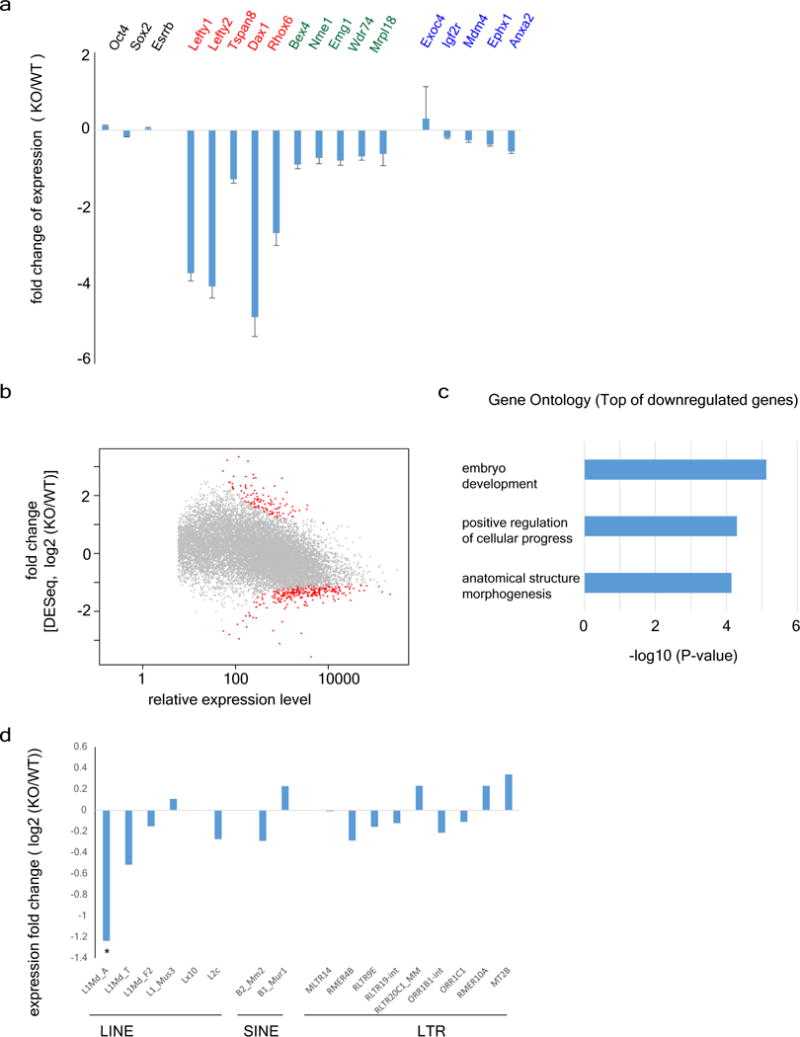
a, RT-qPCR validation of the RNA-seq analysis. Unchanged genes (gene names labelled in black) identified by RNA-seq were unaltered in RT-qPCR analysis. Highly repressed (red), or modestly repressed (green) genes identified by RNA-seq also showed expected levels of repression in RT-qPCR analyses. Of note, the genes (blue) identified as upregulated in RNA-seq; however, they don’t show differential expression (no significance) in RT-qPCR analysis, which further confirmed the suppression function of ALKBH1. Error bars, s.d. of triplicates. b, MA plot of RNA-seq analysed by DESeq2, which shows the similar pattern to that of CuffDiff2 (see Fig. 3a and Methods). c, Gene ontology analysis demonstrated that lineage specifying factors involved in embryonic development are greatly downregulated by Alkbh1 deficiency. d, RNA-seq transcripts of the representative subfamilies in three major retrotransposon superfamilies (LINE, SINE and LTR) in Alkbh1 knockout ES cells (Methods).
Extended Data Figure 5. Validation of N6-mA DIP-seq approach.
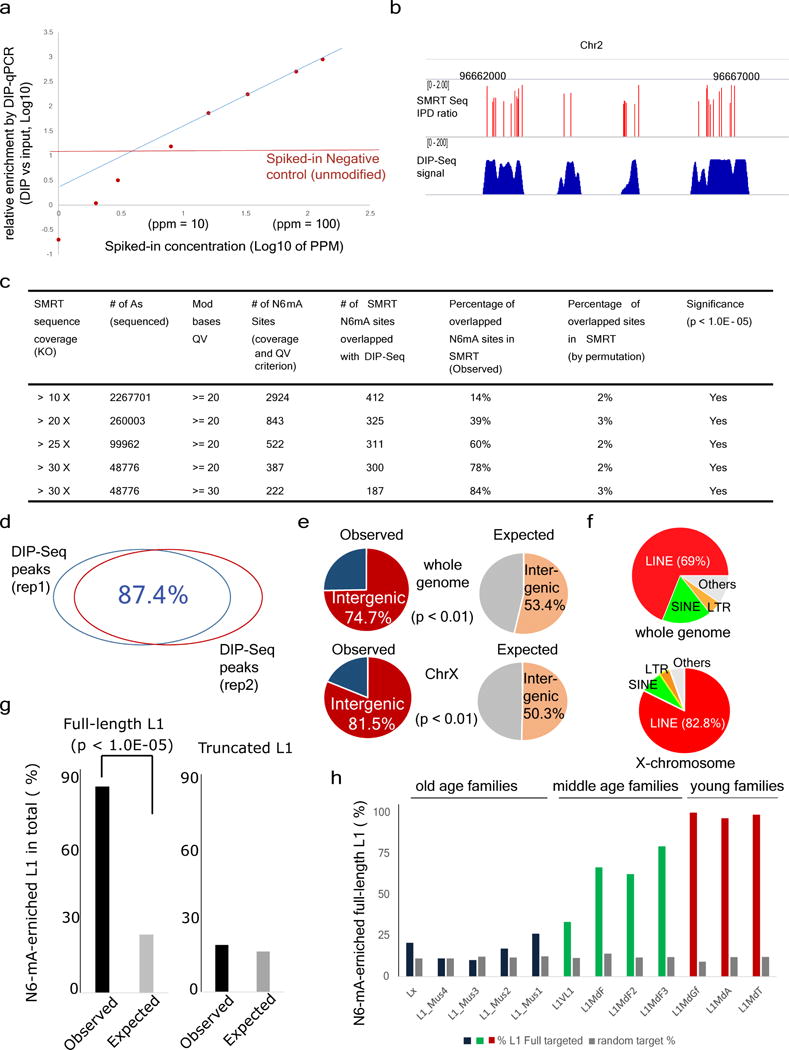
a, ‘Spike-in’ experiments for determining the threshold and linear response range of N6-mA DIP. Genomic DNAs were spiked with N6-mA containing oligonucleotides at indicated concentration (x axis). After N6-mA DIP, the relative enrichment of N6-mA over input control was determined by a RT-qPCR approach. Blue line: linear regression based on data points between 20–130 p.p.m. The threshold (the red line) is the background signals detected by RT-qPCR in which unmodified (control) oligonucleotides were spiked in. b, The track of different sequencing method showed N6-mA sites overlapped between SMRT-ChIP and DIP-Seq in Alkbh1 knockout ES cells. c, Number of SMRT-ChIP N6-mA sites in Alkbh1 knockout cells at different coverage and QV cut-off. With rising coverage and QV cut-off, overlap between SMRT-ChIP N6-mA sites and DIP-Seq N6-mA sites also increases. d, The biological replicates of Alkbh1 knockout ES cells N6-mA-DIP peaks show 87.4% overlap. e, A large majority of N6-mA peaks are in the intergenic regions at the whole-genome level or on the X chromosome. f, In Alkbh1 knockout ES cells, N6-mA peaks are mainly targeted to LINE-1 transposons on the X chromosome or genome-wide. g, N6-mA peaks are significantly enriched on full-length, but not on truncated L1 elements (P < 1.0 × 10⁻⁵, chi-squared test). h, Enrichment of N6-mA in each full length L1 subfamily. Lx, L1_Mus1-4: >6 million years; L1VL1, L1MdF1-4: 1.5–6 million years; L1MdGf, L1MdA, L1mdT: <1.5 million years.
Extended Data Figure 6. N6-mA enrichment on 5′-end of young full-length L1 elements.
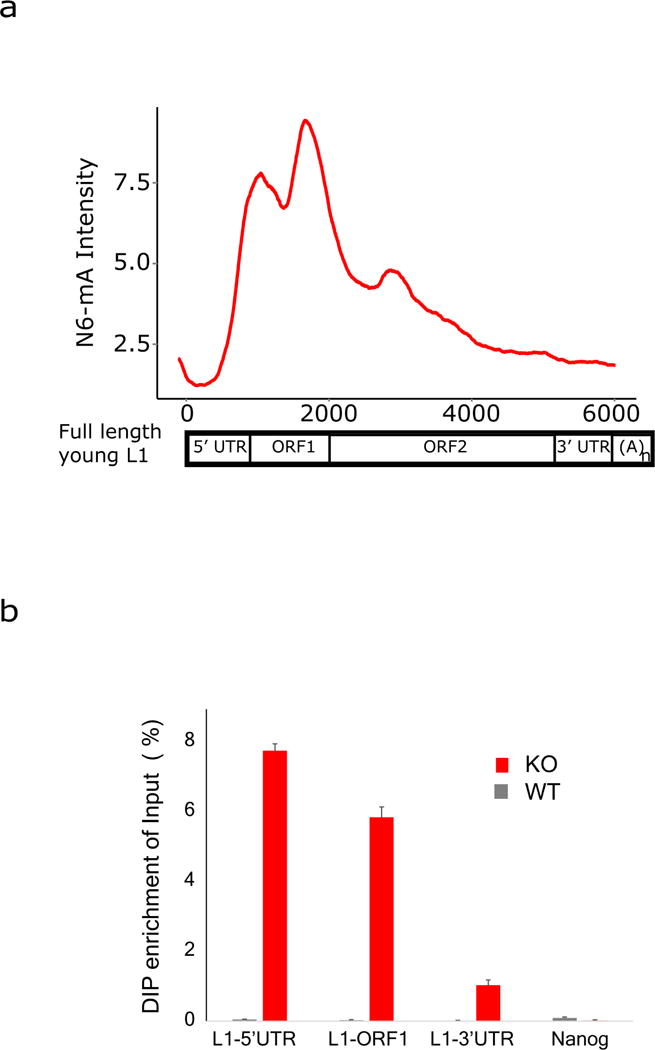
a, Aggregation plot shows that signal intensity of N6-mA at young full-length L1 is enriched at the 5′ UTR and ORF1. b, qPCR analysis of N6-mA DIP samples confirmed the enrichment at the 5′ UTR and ORF1 regions of L1 that are retained in the young full-length L1 elements, but not the 3′ UTR or Nanog promoter.
Extended Data Figure 7. The correlation between N6-mA deposition on young full-length L1 elements and epigenetic silencing.
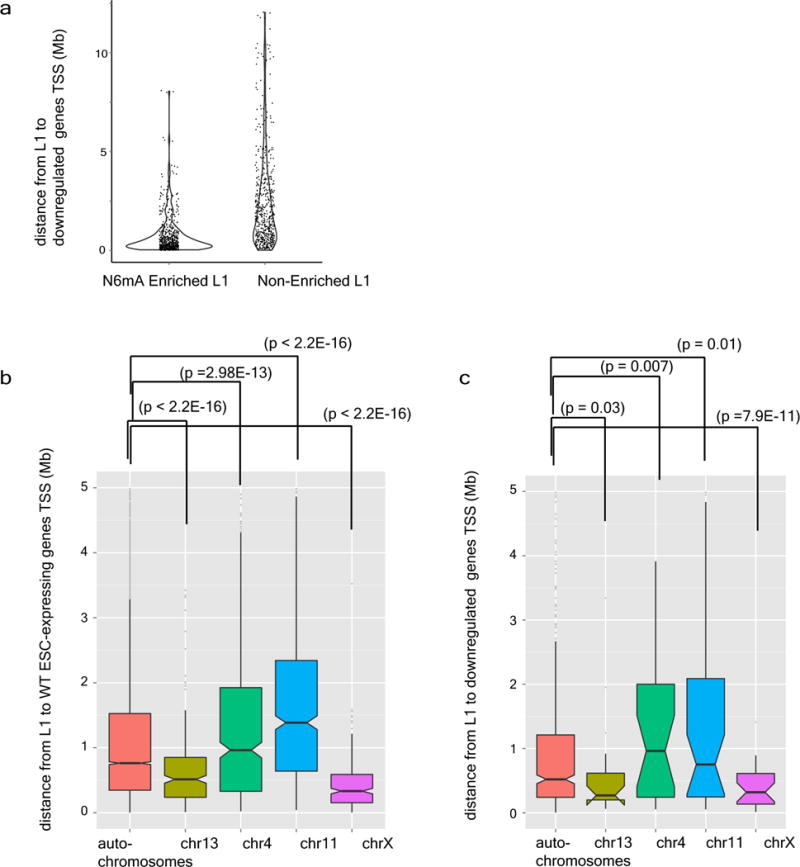
a, Violin diagram of the density distribution of the distance between L1 and downregulated genes in Alkbh1 knockout cells. b, The distances between ES cells expressing genes in Alkbh1 knockout ES cells and young full-length L1 elements were plotted for indicated chromosomes. c, The distances between downregulated genes in Alkbh1 knockout ES cells and young full-length L1 elements were plotted for indicated chromosomes.
Extended Data Figure 8. N6-mA accumulation correlates with epigenetic silencing.
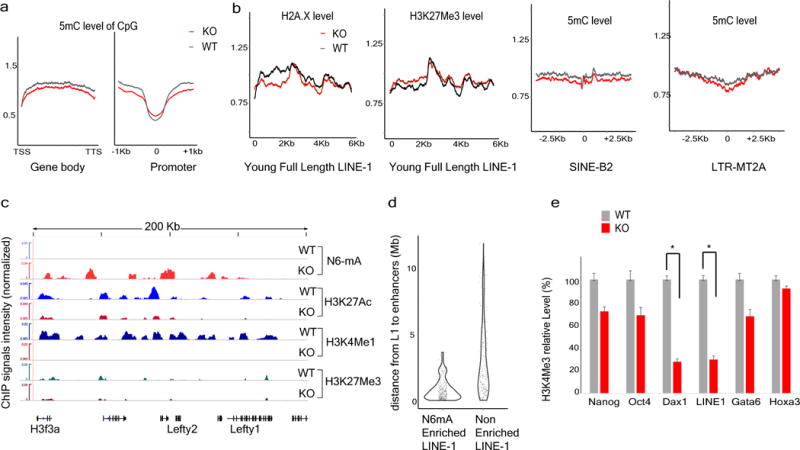
a, Normalized 5mC levels on gene bodies or promoters in wild-type or Alkbh1 knockout ES cells. b, Histone marks (H2A.X or H3K27Me3) or 5 mC levels on young full-length L1 elements, SINE or LTR transposons. c, Representative sequencing tracks of decommissioned enhancers. H3K27Ac and H3K4me1 levels at this locus are greatly downregulated in Alkbh1 knockout ES cells. See Supplementary Table 2 for all decommissioned enhancers in Alkbh1 knockout ES cells. d, Violin diagram shows the density distribution of the distance between L1 and decommissioned enhancers in Alkbh1 knockout cells. e, ChIP-qPCR approach showed that H3K4me3 levels are decreased at the transcription start sites (TSS) of LINE-1 or Dax1, an X chromosome gene, while unchanged at the control gene TSS. *P < 0.01, t-test; error bars, ± s.e.m. of three technical triplicates.
Extended Data Figure 9. N6-mA accumulation results in imbalanced cell fate decisions during ESC differentiation.
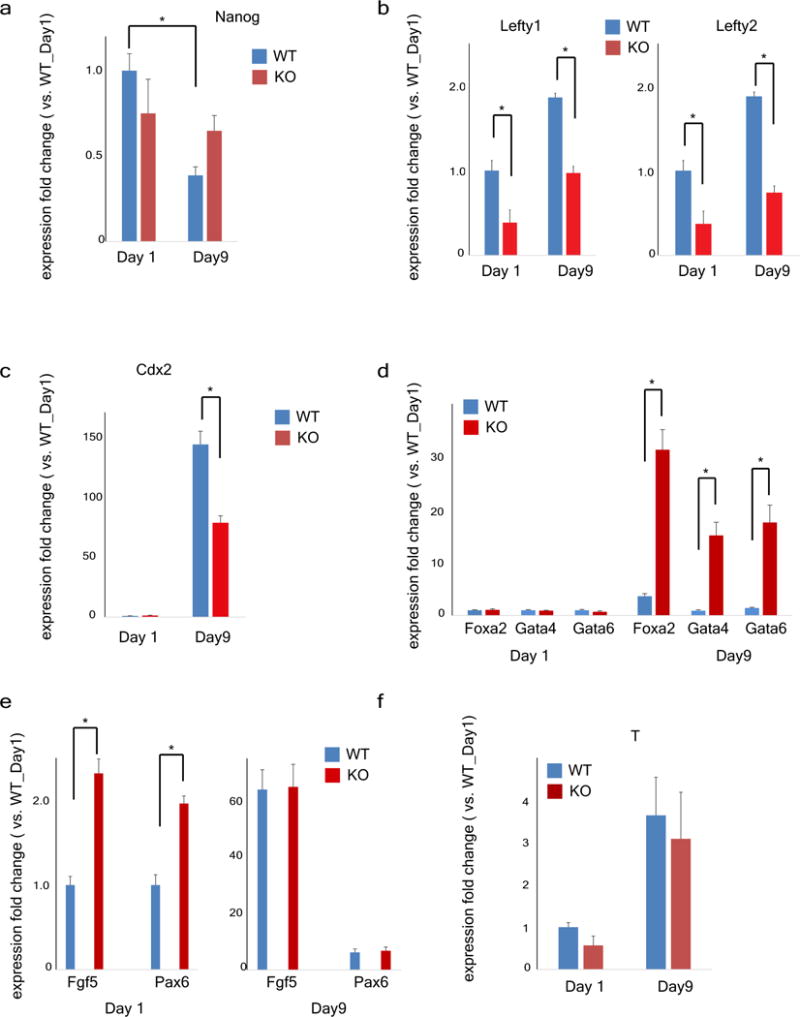
Wild-type or Alkbh1 knockout ES cells were subject to embryoid body differentiation (Methods). mRNA samples were collected at day 1 or day 9. Gene expression levels were quantified by RT–qPCR approaches. *P < 0.01, t-test; error bars, ± s.e.m. of technical triplicates. a, At day 9, Nanog expression is reduced significantly in wild-type ES-cell-derived embryoid bodies as expected, while its level in Alkbh1 knockout ES-cell-derived embryoid bodies is still high. b, Lefty-1 and Lefty-2 are repressed at day 1 or day 9 in Alkbh1 knockout ES-cell-derived embryoid bodies. c, Activation of Cdx2, is insufficient in Alkbh1 knockout ES-cell-derived embryoid bodies. d, However, expressions of other endoderm markers, Foxa2, Gata4, Gata6, are significantly higher in Alkbh1 knockout ES-cell-derived embryoid bodies than wild-type ES-cell-derived embroid bodies. e, Ectoderm markers, Fgf5 and Pax6 are transiently (day 1) overexpressed in Alkbh1 knockout ES-cell-derived embryoid bodies. f, Mesoderm marker, T/Brachyury is similarly expressed in wild-type or Alkbh1 knockout ES-cell-derived embryoid bodies during differentiation.
Supplementary Material
Acknowledgments
We thank Z. Li, K.Hwang and A. Leung for critical reading of the manuscript and the members of the Xiao laboratory for critical discussion. Thanks to L. Geng for helping Hiseq2000 sequencing. This work is funded by R01GM114205-01 (A.X.). T.P.W. is partially supported by CT Stem Cell Foundation (11SCA34). The Fang lab is partially supported by R01 GM114472-01 (G.F.). Mass spectrometry was supported by R01GM106024, S10OD018445 and P20GM103429.
Footnotes
Online Content
Methods, along with any additional Extended Data display items and Source Data, are available in the online version of the paper; references unique to these sections appear only in the online paper.
Supplementary Information is available in the online version of the paper.
Author Contributions
A.X. conceived the hypothesis, designed the study and wrote the paper, and provided support and guidance for this work; T.P.W. designed and performed the majority of the experiments, analysed the genomic data, generated figures and interpreted the results; T.W characterized the Alkbh1 mutant and performed demethylation assays; K.L. helped with bioinformatics analysis. Y.L. provided technical help. L.H., M.S., S.Z. and G.F. assisted on SMRT sequencing and data analysis. Y.L. and J.A.S. performed the mass spectrometry analysis of N6-mA. S.D.B., S.G.M. and A.J.T. performed MS analysis on histone methylation and recombinant ALKBH1 proteins.
Author Information
All sequencing data were deposited in the Gene Expression Omnibus (http://www.ncbi.nlm.nih.gov/geo) under accession number GSE71866. Readers are welcome to comment on the online version of the paper.
The authors declare no competing financial interests.
References
- 1.Smith ZD, Meissner A. DNA methylation: roles in mammalian development. Nature Rev Genet. 2013;14:204–220. doi: 10.1038/nrg3354. [DOI] [PubMed] [Google Scholar]
- 2.Schübeler D. Function and information content of DNA methylation. Nature. 2015;517:321–326. doi: 10.1038/nature14192. [DOI] [PubMed] [Google Scholar]
- 3.Heyn H, Esteller M. An adenine code for DNA: a second life for N6-methyladenine. Cell. 2015;161:710–713. doi: 10.1016/j.cell.2015.04.021. [DOI] [PubMed] [Google Scholar]
- 4.Zhang G, et al. N6-methyladenine DNA modification in Drosophila. Cell. 2015;161:893–906. doi: 10.1016/j.cell.2015.04.018. [DOI] [PubMed] [Google Scholar]
- 5.Greer EL, et al. DNA methylation on N6-adenine in C. elegans. Cell. 2015;161:868–878. doi: 10.1016/j.cell.2015.04.005. [DOI] [PMC free article] [PubMed] [Google Scholar]
- 6.Fu Y, et al. N6-methyldeoxyadenosine marks active transcription start sites in Chlamydomonas. Cell. 2015;161:879–892. doi: 10.1016/j.cell.2015.04.010. [DOI] [PMC free article] [PubMed] [Google Scholar]
- 7.Achwal CW, Iyer CA, Chandra HS. Immunochemical evidence for the presence of 5mC, 6mA and 7mG in human, Drosophila and mealybug DNA. FEBS Lett. 1983;158:353–358. doi: 10.1016/0014-5793(83)80612-7. [DOI] [PubMed] [Google Scholar]
- 8.Ratel D, et al. Undetectable levels of N6-methyl adenine in mouse DNA: Cloning and analysis of PRED28, a gene coding for a putative mammalian DNA adenine methyltransferase. FEBS Lett. 2006;580:3179–3184. doi: 10.1016/j.febslet.2006.04.074. [DOI] [PubMed] [Google Scholar]
- 9.Bourc’his D, Bestor TH. Meiotic catastrophe and retrotransposon reactivation in male germ cells lacking Dnmt3L. Nature. 2004;431:96–99. doi: 10.1038/nature02886. [DOI] [PubMed] [Google Scholar]
- 10.Goodier JL, Kazazian HH. Retrotransposons revisited: the restraint and rehabilitation of parasites. Cell. 2008;135:23–35. doi: 10.1016/j.cell.2008.09.022. [DOI] [PubMed] [Google Scholar]
- 11.Goodier JL, Ostertag EM, Du K, Kazazian HH. A novel active L1 retrotransposon subfamily in the mouse. Genome Res. 2001;11:1677–1685. doi: 10.1101/gr.198301. [DOI] [PMC free article] [PubMed] [Google Scholar]
- 12.Castro-Diaz N, et al. Evolutionally dynamic L1 regulation in embryonic stem cells. Genes Dev. 2014;28:1397–1409. doi: 10.1101/gad.241661.114. [DOI] [PMC free article] [PubMed] [Google Scholar]
- 13.Banaszynski LA, Allis CD, Lewis PW. Histone variants in metazoan development. Dev Cell. 2010;19:662–674. doi: 10.1016/j.devcel.2010.10.014. [DOI] [PMC free article] [PubMed] [Google Scholar]
- 14.Jin C, Felsenfeld G. Nucleosome stability mediated by histone variants H3.3 and H2A.Z. Genes Dev. 2007;21:1519–1529. doi: 10.1101/gad.1547707. [DOI] [PMC free article] [PubMed] [Google Scholar]
- 15.Fang G, et al. Genome-wide mapping of methylated adenine residues in pathogenic Escherichia coli using single-molecule real-time sequencing. Nature Biotechnol. 2012;30:1232–1239. doi: 10.1038/nbt.2432. [DOI] [PMC free article] [PubMed] [Google Scholar]
- 16.Davis BM, Chao MC, Waldor MK. Entering the era of bacterial epigenomics with single molecule real time DNA sequencing. Curr Opin Microbiol. 2013;16:192–198. doi: 10.1016/j.mib.2013.01.011. [DOI] [PMC free article] [PubMed] [Google Scholar]
- 17.Wu T, et al. Histone variant H2A.X deposition pattern serves as a functional epigenetic mark for distinguishing the developmental potentials of iPSCs. Cell Stem Cell. 2014;15:281–294. doi: 10.1016/j.stem.2014.06.004. [DOI] [PubMed] [Google Scholar]
- 18.Lu K, Collins LB, Ru H, Bermudez E, Swenberg JA. Distribution of DNA adducts caused by inhaled formaldehyde is consistent with induction of nasal carcinoma but not leukemia. Toxicol Sci. 2010;116:441–451. doi: 10.1093/toxsci/kfq061. [DOI] [PMC free article] [PubMed] [Google Scholar]
- 19.Sedgwick B. Repairing DNA-methylation damage. Nature Rev Mol Cell Biol. 2004;5:148–157. doi: 10.1038/nrm1312. [DOI] [PubMed] [Google Scholar]
- 20.Flusberg BA, et al. Direct detection of DNA methylation during single-molecule, real-time sequencing. Nature Methods. 2010;7:461–465. doi: 10.1038/nmeth.1459. [DOI] [PMC free article] [PubMed] [Google Scholar]
- 21.Shen L, Song CX, He C, Zhang Y. Mechanism and function of oxidative reversal of DNA and RNA methylation. Annu Rev Biochem. 2014;83:585–614. doi: 10.1146/annurev-biochem-060713-035513. [DOI] [PMC free article] [PubMed] [Google Scholar]
- 22.Müller TA, Yu K, Hausinger RP, Meek K. ALKBH1 is dispensable for abasic site cleavage during base excision repair and class switch recombination. PLoS ONE. 2013;8:e67403. doi: 10.1371/journal.pone.0067403. [DOI] [PMC free article] [PubMed] [Google Scholar]
- 23.Nordstrand LM, et al. Mice lacking Alkbh1 display sex-ratio distortion and unilateral eye defects. PLoS ONE. 2010;5:e13827. doi: 10.1371/journal.pone.0013827. [DOI] [PMC free article] [PubMed] [Google Scholar]
- 24.Ougland R, et al. ALKBH1 is a histone H2A dioxygenase involved in neural diferentiation. Stem Cells. 2012;30:2672–2682. doi: 10.1002/stem.1228. [DOI] [PMC free article] [PubMed] [Google Scholar]
- 25.Abrusán G, Giordano J, Warburton PE. Analysis of transposon interruptions suggests selection for L1 elements on the X chromosome. PLoS Genet. 2008;4:e1000172. doi: 10.1371/journal.pgen.1000172. [DOI] [PMC free article] [PubMed] [Google Scholar]
- 26.Bailey JA, Carrel L, Chakravarti A, Eichler EE. Molecular evidence for a relationship between LINE-1 elements and X chromosome inactivation: the Lyon repeat hypothesis. Proc Natl Acad Sci USA. 2000;97:6634–6639. doi: 10.1073/pnas.97.12.6634. [DOI] [PMC free article] [PubMed] [Google Scholar]
- 27.Chow JC, et al. LINE-1 activity in facultative heterochromatin formation during X chromosome inactivation. Cell. 2010;141:956–969. doi: 10.1016/j.cell.2010.04.042. [DOI] [PubMed] [Google Scholar]
- 28.Liu C, Tsai P, García AM, Logeman B, Tanaka TS. A possible role of Reproductive Homeobox 6 in primordial germ cell diferentiation. Int J Dev Biol. 2011;55:909–916. doi: 10.1387/ijdb.113342cl. [DOI] [PubMed] [Google Scholar]
- 29.Delatte B, et al. Transcriptome-wide distribution and function of RNA hydroxymethylcytosine. Science. 2016;351:282–285. doi: 10.1126/science.aac5253. [DOI] [PubMed] [Google Scholar]
- 30.Lyon MF. X-chromosome inactivation: a repeat hypothesis. Cytogenet Cell Genet. 1998;80:133–137. doi: 10.1159/000014969. [DOI] [PubMed] [Google Scholar]
- 31.Fadloun A, et al. Chromatin signatures and retrotransposon profiling in mouse embryos reveal regulation of LINE-1 by RNA. Nature Struct Mol Biol. 2013;20:332–338. doi: 10.1038/nsmb.2495. [DOI] [PubMed] [Google Scholar]
- 32.Erickson IK, Cantrell MA, Scott L, Wichman HA. Retrofitting the genome: L1 extinction follows endogenous retroviral expansion in a group of muroid rodents. J Virol. 2011;85:12315–12323. doi: 10.1128/JVI.05180-11. [DOI] [PMC free article] [PubMed] [Google Scholar]
- 33.Koziol MJ, et al. Identification of methylated deoxyadenosines in vertebrates reveals diversity in DNA modifications. Nature Struct Mol Biol. 2016;23:24–30. doi: 10.1038/nsmb.3145. [DOI] [PMC free article] [PubMed] [Google Scholar]
- 34.Tomomori-Sato C, Sato S, Conaway RC, Conaway JW. Immunoaffinity purification of protein complexes from mammalian cells. Methods Mol Biol. 2013;977:273–287. doi: 10.1007/978-1-62703-284-1_22. [DOI] [PMC free article] [PubMed] [Google Scholar]
- 35.Flusberg BA, et al. Direct detection of DNA methylation during single-molecule, real-time sequencing. Nature Methods. 2010;7:461–465. doi: 10.1038/nmeth.1459. [DOI] [PMC free article] [PubMed] [Google Scholar]
- 36.Langmead B, Trapnell C, Pop M, Salzberg SL. Ultrafast and memory-efficient alignment of short DNA sequences to the human genome. Genome Biol. 2009;10:R25. doi: 10.1186/gb-2009-10-3-r25. [DOI] [PMC free article] [PubMed] [Google Scholar]
- 37.Zang C, et al. A clustering approach for identification of enriched domains from histone modification ChIP-seq data. Bioinformatics. 2009;25:1952–1958. doi: 10.1093/bioinformatics/btp340. [DOI] [PMC free article] [PubMed] [Google Scholar]
- 38.Song Q, Smith AD. Identifying dispersed epigenomic domains from ChIP-seq data. Bioinformatics. 2011;27:870–871. doi: 10.1093/bioinformatics/btr030. [DOI] [PMC free article] [PubMed] [Google Scholar]
- 39.Trapnell C, Pachter L, Salzberg SL. TopHat: discovering splice junctions with RNA-Seq. Bioinformatics. 2009;25:1105–1111. doi: 10.1093/bioinformatics/btp120. [DOI] [PMC free article] [PubMed] [Google Scholar]
- 40.Trapnell C, et al. Differential gene and transcript expression analysis of RNA-seq experiments with TopHat and Cufinks. Nature Protocols. 2012;7:562–578. doi: 10.1038/nprot.2012.016. [DOI] [PMC free article] [PubMed] [Google Scholar]
- 41.Tackett AJ, et al. I-DIRT, a general method for distinguishing between specific and nonspecific protein interactions. J Proteome Res. 2005;4:1752–1756. doi: 10.1021/pr050225e. [DOI] [PubMed] [Google Scholar]
- 42.Byrum SD, Taverna SD, Tackett AJ. Purification of a specific native genomic locus for proteomic analysis. Nucleic Acids Res. 2013;41:e195. doi: 10.1093/nar/gkt822. [DOI] [PMC free article] [PubMed] [Google Scholar]
Associated Data
This section collects any data citations, data availability statements, or supplementary materials included in this article.


