Abstract
Cooperative phenotypes are considered central to the functioning of microbial communities in many contexts, including communication via quorum sensing, biofilm formation, antibiotic resistance, and pathogenesis1-5. The human intestine houses a dense and diverse microbial community critical to health1,2,4-9, yet we know little about cooperation within this important ecosystem. Here we experimentally test for evolved cooperation within the Bacteroidales, the dominant Gram-negative bacteria of the human intestine. We show that during growth on certain dietary polysaccharides, the model member Bacteroides thetaiotaomicron exhibits only limited cooperation. Although this organism digests these polysaccharides extracellularly, mutants lacking this ability are outcompeted. In contrast, we discovered a dedicated cross-feeding enzyme system in the prominent gut symbiont Bacteroides ovatus, which digests polysaccharide at a cost to itself but at a benefit to another species. Using in vitro systems and gnotobiotic mouse colonization models, we find that extracellular digestion of inulin increases the fitness of B.ovatus due to reciprocal benefits when it feeds other gut species such as Bacteroides vulgatus. This is a rare example of naturally-evolved cooperation between microbial species. Our study reveals both the complexity and importance of cooperative phenotypes within the mammalian intestinal microbiota.
A major challenge facing the study of host-associated microbiotas is to understand the ecological and evolutionary dynamics that shape these communities2,5,10-13. A key determinant of microbial dynamics is the balance of cooperation and competition both within and between populations2,5,14,15. Here we test for the evolution of cooperation within the mammalian microbiota by focusing on the Bacteroidales, the most abundant order of Gram-negative bacteria of the human intestine with species that co-colonize the host at high densities of 1010-1011 CFU/gram feces16,17. Members of this order breakdown polysaccharides outside of their cell using outer surface glycoside hydrolases6,18, some which are secreted on outer membrane vesicles3,19. This suggests a significant potential for one cell to cooperatively feed other cells. As extracellular digestion is considered essential for growth of Bacteroidales on polysaccharides1,6,8, we focused on this trait as a candidate for cooperative interactions within the gut microbiota and asked whether a bacterium that breaks down a polysaccharide extracellularly receives most, or all20, of the benefits of its efforts.
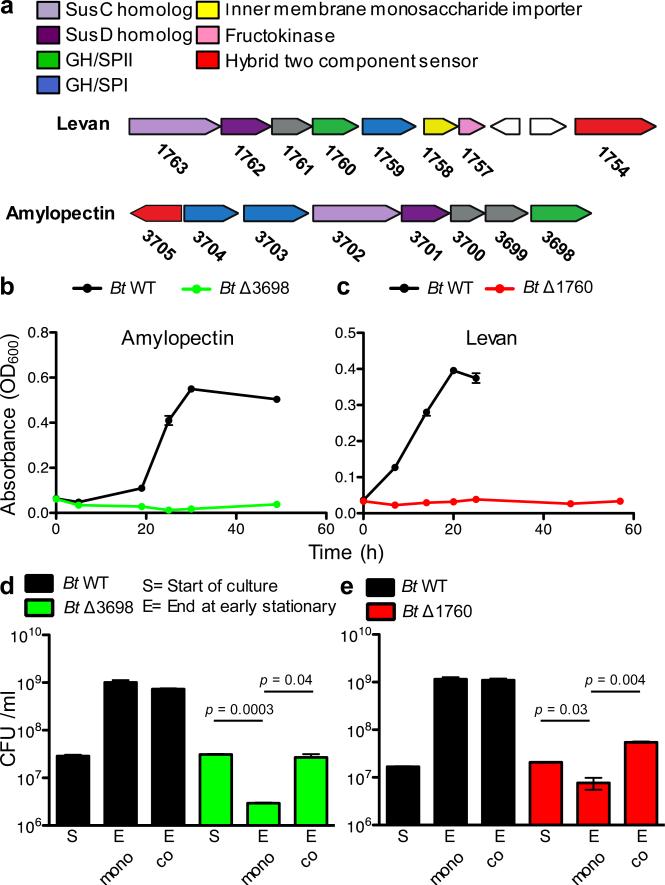
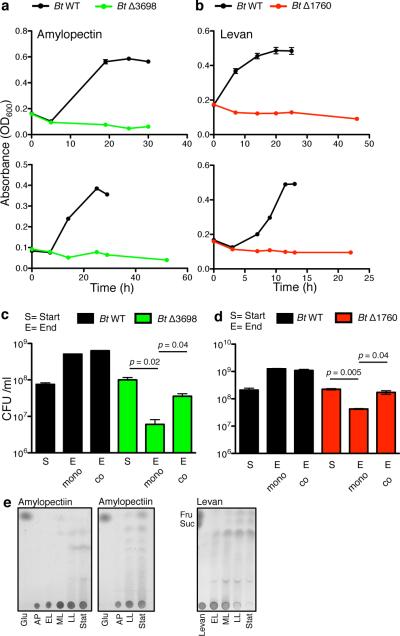
We first made isogenic mutants in genes responsible for the extracellular digestion of polysaccharides in the well-studied human gut strain, Bacteroides thetaiotaomicron (Bt) VPI-54821,8, Specifically, we deleted the genes encoding the outer surface glycoside hydrolases BT3698 of the amylopectin/starch utilization locus and BT1760 of the levan utilization locus (Fig.1a), required for growth on amylopectin and levan, respectively (Fig.1b,c, Extended Data Fig.1a,b)1,8. Consistent with previous observations1,8, neither mutant grew with the specific polysaccharide in monoculture (Fig.1b,c, Extended Data Fig.1a,b). However, co-culture of ΔBT3698 or ΔBT1760 with WT in amylopectin or levan increased the fitness of the mutants (Fig.1d,e, Extended Data Fig.1c,d). This is consistent with cooperation via public good availability of amylopectin and levan breakdown products.
Figure 1. Direct and cooperative benefits of polysaccharide digestion by surface glycoside hydrolases (GH).
a, Polysaccharide utilization loci of B. thetaiotaomicron (Bt) for amylopectin and levan with the products or properties each gene encodes listed above and color coded. SPI or SPII = signal peptidase I or II cleavage site. b, c, Growth of Bt WT and surface GH mutants in media with amylopectin (n=2, cell culture biological replicates) (b) or levan (n=2, cell culture biological replicates) (c). See Extended Data Fig.1 for additional independent experiments. d,e, Growth of Bt WT and surface GH mutants in mono- and co -culture in media with amylopectin (n=2, cell culture biological replicates) (d) or levan (n=2, cell culture biological replicates) (e). See Extended Data Fig.1 for additional independent experiments. In all panels error bars represent standard error; p values derived from two-tailed Student's t test.
One of the key questions in evolutionary biology is how cooperative systems can be evolutionarily stable4,5,14,21,22. If certain cells invest in the production of an enzyme that helps others, what prevents these cells from being outcompeted by cells that consume the breakdown products without making the enzyme? In the Bt amylopectin and levan polysaccharide utilization systems, while receiving public goods benefits provided by WT cells (Extended Data Fig.1e), mutant cells do not outcompete the WT. Cells that make the enzyme receive more benefits than non-producing neighboring cells suggesting that private23 benefits are central to the evolutionary stability of polysaccharide breakdown in these systems.
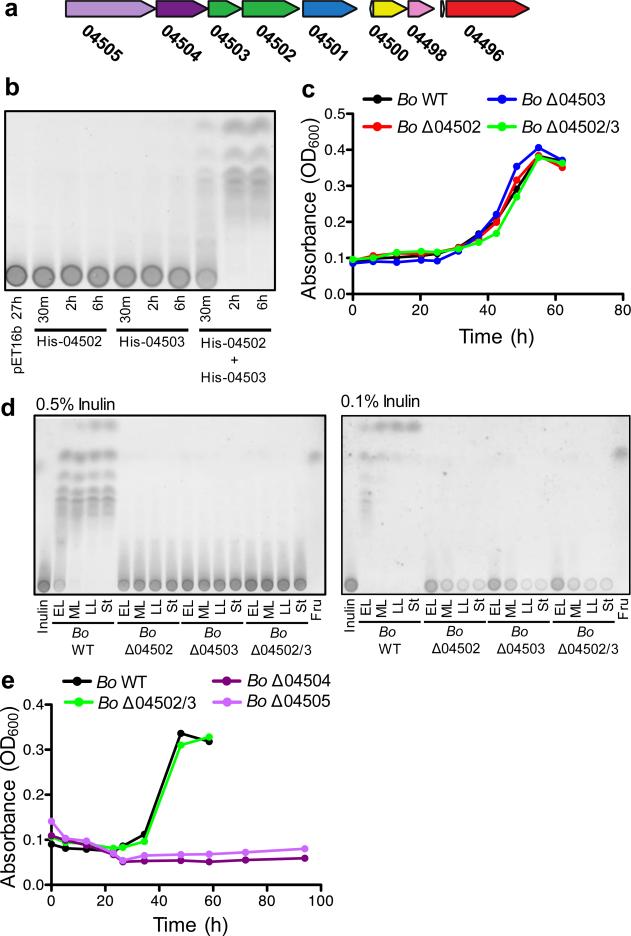
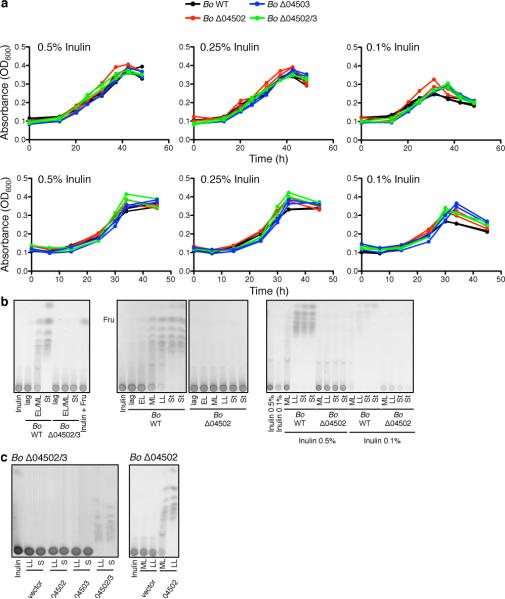
We extended our analysis to another prominent member of the human Bacteroidales known to extensively utilize polysaccharides, Bacteroides ovatus (Bo)24. During growth on inulin, a dietary fructan known for health promoting effects25, Bo extracellularly digests and liberates considerable amounts of inulin breakdown products3. The predicted inulin utilization locus of the Bo type strain ATCC 8483 encodes two similar outer surface glycoside hydrolases, BACOVA_04502 and BACOVA_04503 (Fig.2a), both of which are predicted to target the β1,2 inulin fructose polymer1,3. Both of these enzymes are required for inulin breakdown (Fig.2b). We therefore predicted that a single mutant of either BACOVA_04502 or BACOVA_04503 would be unable to grow on inulin. Surprisingly, neither of the single deletion mutants (Δ04502 or Δ04503) nor the double mutant (Δ04502/3) demonstrated impaired fitness with inulin as the sole carbohydrate source (Fig.2c, Extended Data Fig.2a), even at limiting concentrations (Extended Data Fig.2a).
Figure 2. B. ovatus does not require surface digestion for utilization of inulin.
a, Predicted inulin utilization locus of B. ovatus (Bo). Gene designations shown are preceded by BACOVA_. The color coding of gene products is as in Fig.1. b, Thin layer chromatography (TLC) analysis of inulin defined medium incubated for the indicated times with purified His-tagged 04502, 04503 or 04502 and 04503, or vector control. See SI Figure 1 for uncropped scanned images. c, Growth of Bo WT and mutants in inulin defined medium. d, TLC analysis of conditioned media during the growth of Bo WT and mutants in 0.5% and 0.1% inulin. EL = early log, ML = mid log, LL = late log, St = stationary. e, Growth of Bo WT, Δ04502/3, Δ04504 (susD ortholog) and Δ04505 (susC ortholog) mutants in inulin defined medium. For c,e, each line represents n=1 sample per condition. See Extended Data Fig.2 for additional independent experiments. In all panels error bars represent standard error; p values derived from two-tailed Student's t test.
Given the importance of extracellular polysaccharide digestion for growth of Bacteroides on numerous polysaccharides1,6,8 (Fig.1, Extended Data Fig.1), we predicted that Bo synthesizes other enzymes that breakdown inulin extracellularly, allowing the Bo mutants to grow on this polysaccharide. However, analysis of the growth media of Δ04502, Δ04503 and Δ04502/3 revealed no released inulin breakdown products demonstrating that BACOVA_04502 and BACOVA_04503 are solely responsible for extracellular digestion of inulin (Fig.2d, Extended Data Fig.2b; see Extended Data Fig.2c for complementation). Deletion of BACOVA_04504 or BACOVA_04505 encoding SusD and SusC orthologs, respectively, encoding predicted inulin binding and import machinery6,26 resulted in significant impairment of growth on inulin (Fig.2e, Extended Data Fig.3a; see Extended Data Fig.3b for complementation). Growth of Δ04502, Δ04503 and Δ04502/3 in limiting concentrations of inulin revealed depletion of inulin (Fig.2d, right panel; Extended Data Fig.2b). Together, these data demonstrate that surface enzymes 04502 and 04503 are not needed for Bo to utilize inulin, and that inulin is directly imported via 04504-04505 without prior extracellular digestion.
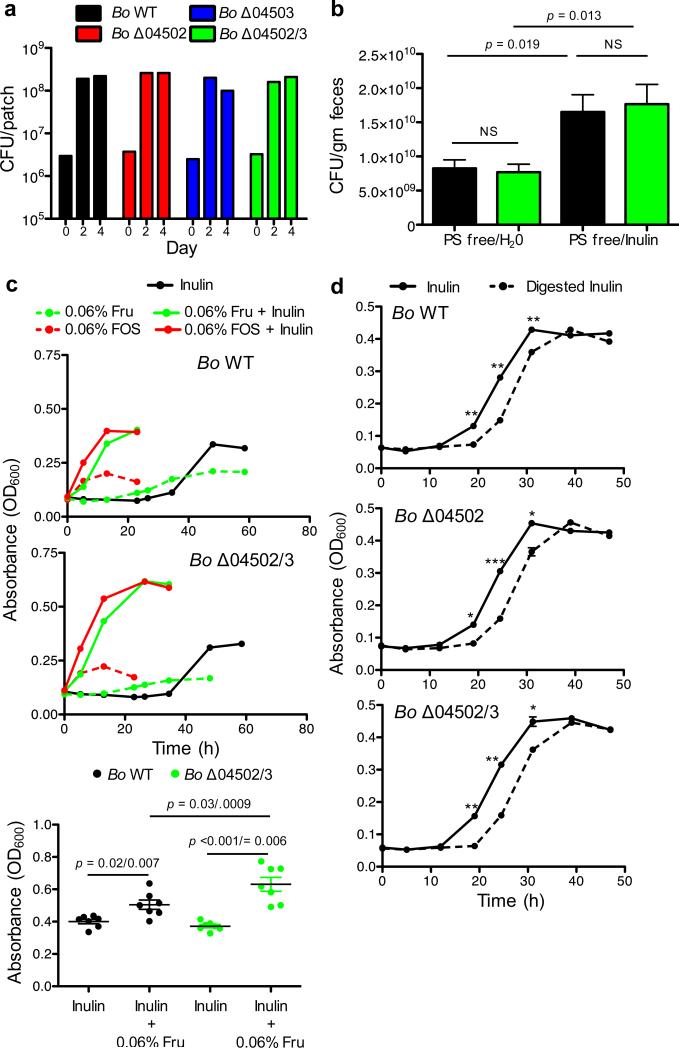
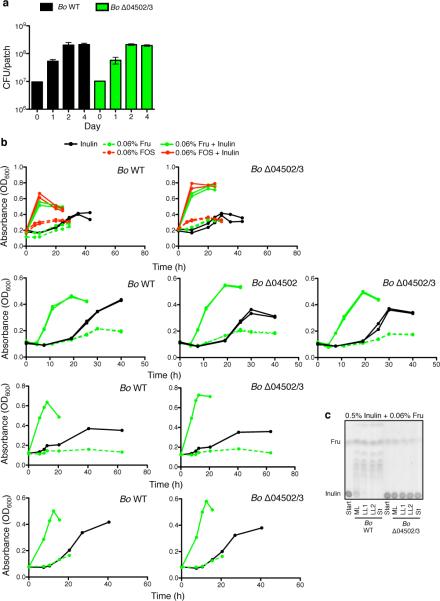
Why would Bo synthesize surface/secreted enzymes that potently digest inulin outside of the cell if not necessary for its growth on the polysaccharide? A key evolutionary explanation for the release of secreted products by microbes is that they feed clonemates in a manner that is beneficial at the level of the clonal group2,5,11,14,15. We hypothesized that the importance of extracellular digestion may be realized during spatially-structured growth on plates where not all cells are in direct contact with the polysaccharide. However, mutant bacteria showed no significant differences in growth yield compared to WT on defined inulin plates (Fig.3a; Extended Data Fig.4a). In addition, these enzymes were not required for optimal growth in vivo as WT and Δ04502/3 showed equal colonization levels in gnotobiotic mice fed a polysaccharide-free diet with inulin added as the sole dietary polysaccharide (Fig.3b). Therefore, we could find no evidence that inulin breakdown by 04502 and 04503 benefits Bo in three-dimensional growth or during monocolonization of the mammalian gut.
Figure 3. Cost of inulin digestion by surface glycoside hydrolases.
a, Growth yield of Bo WT and mutants on inulin agarose plates. Each line represents n=1 sample per condition. See Extended Data Fig. 4 for additional independent experiments. b, Bacteria per gram feces of gnotobiotic mice seven days after monocolonization with Bo WT or Δ04502/3 on a polysaccharide free diet or supplemented with inulin (n=5 biological replicate mice per condition). c, Growth curves (upper and middle panels) and maximal OD600 (bottom panel) of Bo WT or Δ04502/3 in minimal media with carbon sources as indicated. Each line represents n=1 sample per condition. See Extended Data Fig. 4 for additional independent experiments. In the bottom panel, p values are displayed as paired (matched WT and Δ04502/3 within same experiment) followed by unpaired (all experiments) two-tailed Student's t test (n=7, biological replicates). d, Growth of Bo WT or mutants in inulin or a stoichiometric equivalent amount of inulin breakdown products after digestion with purified 04502 and 04503 enzymes (n=2, cell culture biological replicates); *, p < 0.05; ** p < 0.01; ***, p < 0.001; See Extended Data Fig. 5 for additional independent experiments. In all panels error bars represent standard error; p values derived from two-tailed Student's t test.
Bacteroidales polysaccharide utilization loci can be induced by monomers or oligomers of the utilized polysaccharide1,26. This raised the possibility that 04502 and 04503 may be important for optimal growth on inulin during induction. However, while addition of trace amounts of fructose monomers or oligosaccharides led to accelerated growth on inulin (Fig.3c, Extended Data Fig.4b) this did not require 04502/3 (Fig.3c, Extended Data Fig.4b). Rather than a benefit from the presence of the enzymes, we observed a cost based on reduced yield of the WT compared to Δ04502/3 mutant during induced growth (Fig.3c, Extended Data Fig.4b) that was independent of a direct energetic cost of synthesis of 04502/3 (Fig.2c, e, Fig.3c, d, Extended Data Fig.2a, Extended Data Fig.4b, Extended Data Fig.5a, b, c). We find that Bo grows better on undigested inulin than an equal concentration of inulin breakdown products (Fig.3d, Extended Data Fig.5a,b). In addition, the yield advantage to the mutant does not occur under limiting inulin concentrations (Extended Data Fig.5d,e). Furthermore, Bo preferentially consumes longer inulin digestion products over shorter oligomers and fructose (Fig.2d, right panel, Extended Data Fig.2b, right panel). Together, these data suggest that undigested inulin is the preferred substrate of Bo, and that extracellular digestion by 04502/3 can be costly for fitness.
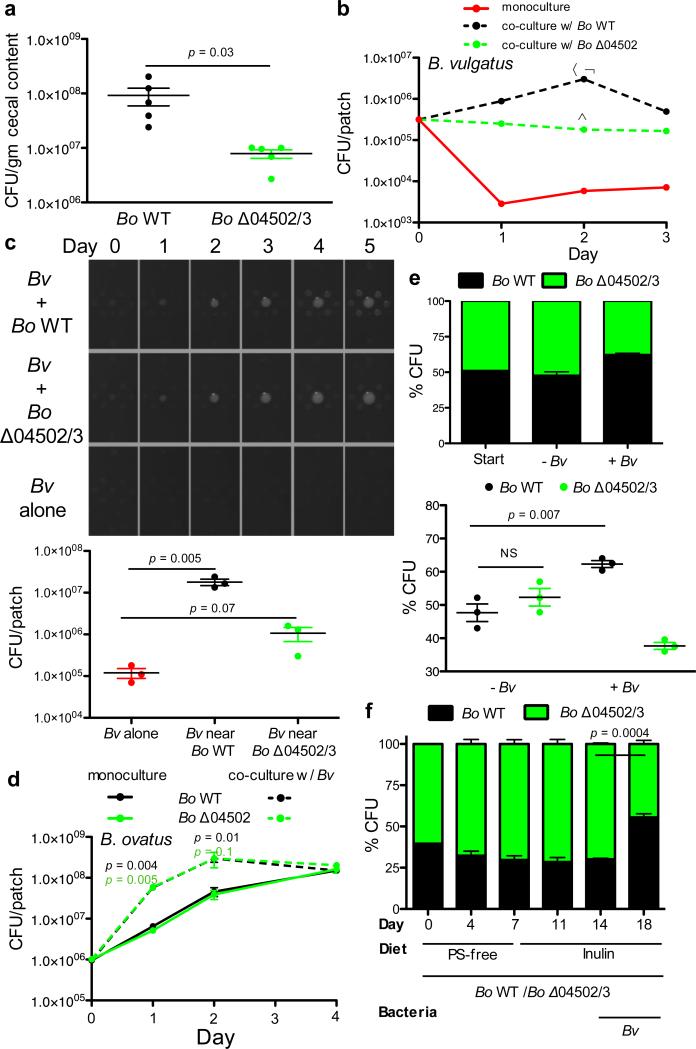
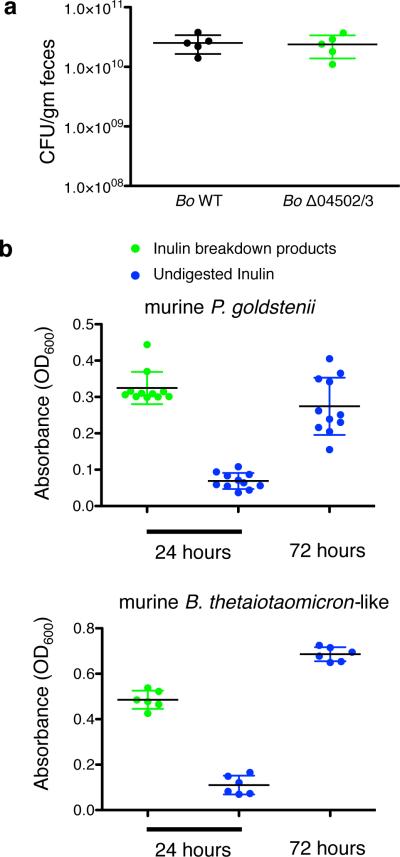
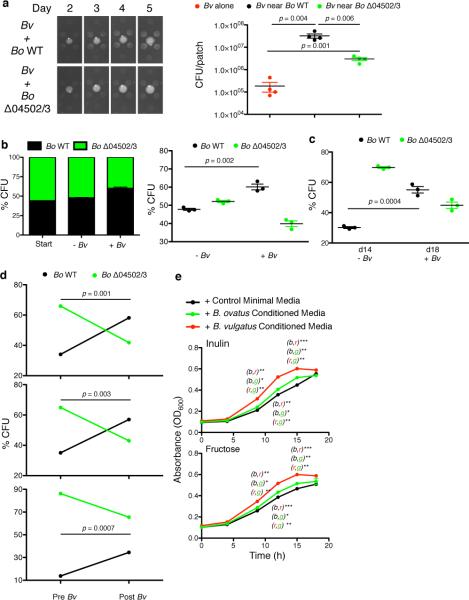
We found no evidence that extracellular digestion of inulin by Bo evolved for cooperation with clonemates. Therefore, we speculated that this trait might have evolved for cooperation with other species in the gut. We first sought evidence of cooperation in the setting of a natural gut ecosystem. Germ-free mice were fed inulin and colonized with either Bo WT or Δ04502/3 followed by the introduction of the cecal microbiota of conventionally raised mice. Bo WT and Δ04502/3 equally colonized mice before the introduction of the microbiota (Extended Data Fig.6a), but Bo WT received a significant fitness benefit compared to Δ04502/3 in the context of a complex microbiota (Fig.4a). These data suggested that while not required for Bo to utilize inulin, 04502 and 04503 provides a benefit to Bo only realized in a community setting. The conditions for the evolution of cooperation between species are much more restrictive than those within a clone. In particular, theory predicts that costly interspecies cooperation will only be stabilized if there are reciprocal feedback benefits, such as a plant providing nectar for an insect that pollinates it21,22. From this experiment, we identified two dominant mouse microbiota Bacteroidales strains that thrived on Bo derived inulin breakdown products (Extended Data Fig.6b), with delayed growth on inulin (Extended Data Fig.6b). These data suggest that cross-feeding Bacteroidales members may provide reciprocal benefits to wild type Bo in the mammalian gut.
Figure 4. Interspecies cooperation mediated by surface digestion of inulin is stabilized by reciprocal benefits.
a, Germ-free mice were monocolonized with Bo WT or Δ04502/3 and maintained on a polysaccharide free diet supplemented with inulin and housed for 2 weeks. Mice were then gavaged with the cecal contents of conventionally raised mice. At day 5 post gavage, cecal contents were plated for enumeration of Bo (n=5 biological replicate mice per group). b, Enumeration of Bv in monoculture or co-culture with Bo WT or Δ04502 on defined inulin plates. α, p = 0.001 for number of Bv in Bv/Bo WT co-culture vs. Bv alone; ψ, p = 0.001 for number of Bv in Bv/Bo WT co-culture vs. Bv/Δ04502 co-culture; α, p = 0.003 for number of Bv in Bv/Δ04502 co-culture vs. Bv alone (n=2, cell culture biological replicates). See Extended Data Figs. 7 and 9 for additional independent experiments. c, (left) Photos of patches of Bv plated at varying distances around Bo WT or Bo Δ04502/3 or alone on inulin agarose plates. (right) Enumeration of Bv after five days of culture plated at the same distance to Bo WT or Bo Δ04502/3 or alone on inulin plates. See Extended Data Fig. 9 for additional independent experiments. d, Enumeration of Bo WT or Δ04502 in monoculture or co-culture with Bv on defined inulin plates. p values correlate to color of line/genotype used for statistical analysis. p value indicates comparison of monoculture and co-culture for the given condition at the time-point indicated. The benefit Bo receives from Bv is most robust when starting with fewer Bo. Depicted are starting CFU of ~106 Bo. (n=3, cell culture biological replicates at day 1,2; n=2, biological replicates at day 4). See Extended Data Fig. 7 for additional independent experiments and Extended Data Fig.7b for starting CFU of ~107 Bo. e, Ratios of WT and Δ04502/3 at the start and day 2 of culture when co-plated with or without Bv on inulin plates (n=3, cell culture biological replicates). See Extended Data Fig. 9 for additional independent experiments. f, Ratios of WT and Δ04502/3 in the inoculum (day 0) and in feces at various time points (days 4, 7, 11, 14, 18) post co-colonization of gnotobiotic mice (n=3 cell culture biological replicates) with Bo WT and Δ04502/3. Polysaccharide free diet was supplemented with inulin at day 7. Bv was introduced at day 14. A Fisher exact test comparing the frequency of Bo WT and Δ04502/3 pre- (day 14) and post- (day 18) colonization with Bv was significant with a p value of 0.0001 for each individual mouse. Bo CFU in feces were maximal after the switch to inulin diet and addition of Bv changed the abundance of Bo WT compared to Δ04502/3 but not total CFU of Bo. See Extended Data Fig. 9 for additional independent experiments. In all panels error bars represent standard error; p values displayed are derived from two-tailed Student's t test.
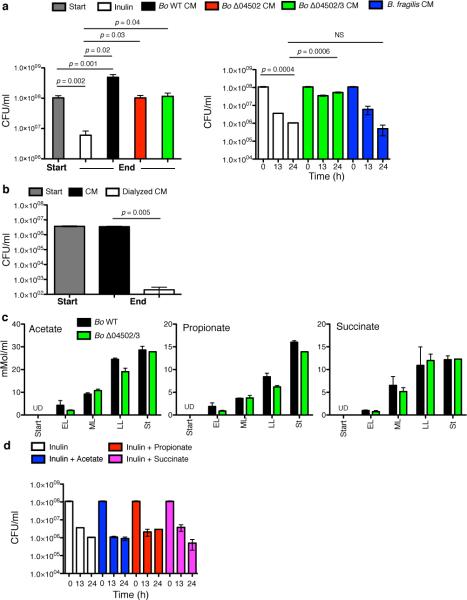
To experimentally test for reciprocity and benefits of inulin digestion between species, we used an inulin co-culture system with Bo WT or Δ04502 and Bacteroides vulgatus ATCC 8482 (Bv), which is commonly found together with Bo at high densities in humans 16,17 and thrives on inulin breakdown products3 but cannot use inulin1,3. Co-culture and proximate plating with WT Bo increased the fitness of Bv compared to that with Δ04502 (Fig.4b,c Extended Data Fig.7a,9a); however, Bv is able to persist better with Δ04502 than when alone (Fig.4b, Extended Data Fig.7a) due to a small (<2000 Da MW), secreted molecule (s) that contributes to the survival of Bv (Extended Data Fig.8a,b). This 04502/3-independent survival is not mediated by a universal factor made by Bacteroides during growth on inulin nor Bo derived short chain fatty acids (Extended Data Fig.8a,c,d). Thus, there are multiple mechanisms by which Bo helps Bv (Fig.4b, Extended Data Fig.7a), the greatest being cross-feeding mediated by 04502/3.
We next addressed the critical question of whether Bo receives reciprocal benefits from Bv. Co-culture of Bo with Bv on plates increased the fitness of Bo WT and Bo Δ04502 (Fig.4d, Extended Data Fig.7b), but did not increase the fitness of B. fragilis (Extended Data Fig.7c), If inulin breakdown can be costly, and Bo receives benefits from Bv irrespective of whether inulin is broken down and fed to Bv, natural selection is expected to favor the loss of the genes encoding the secreted inulin glycoside hydrolases22. However such pairwise partnerships would not reveal the possibility that Bo WT receives more reciprocal benefits from Bv when in direct competition with the non-cross-feeding mutant21,27. Therefore, we co- and tri-cultured these strains on plates and compared the yields of the two Bo strains (WT and Δ04502/3) with or without Bv. Addition of Bv leads to an increased proportion of WT Bo compared to the Δ04502/3 mutant (Fig.4e, Extended Data Fig.9b). We extended these studies to a gnotobiotic mouse colonization model. WT Bo had no advantage in direct competition with Δ04502/3 on a polysaccharide-free diet or when inulin is added (Fig.4f). However, introduction of Bv increased the fitness of the Bo WT relative to the mutant (Fig.4f, Extended Data Fig.9c,d). Together, these data suggest that extracellular breakdown of inulin increases the fitness of Bo via reciprocal benefits from another species. These findings are consistent with the evolution of cooperation between species within the gut microbiota.
We find evidence of distinct forms of cooperativity within the Bacteroidales of the human intestinal microbiota (Extended Data Fig.10). For Bt, amylopectin and levan digestion provide mostly private benefits and modest social benefits to other cells. By contrast, Bo releases large amounts of inulin digestion products via a pair of dedicated cross-feeding secreted enzymes unnecessary for its use of inulin. These enzymes allow for cooperation with cross-fed species, which provide benefits in return. Potential mechanisms by which Bv may provide return benefits to Bo include detoxification of inhibitory substances, or production of a depleted or growth promoting factor, the latter supported by early growth benefits to Bo via Bv secreted factors (Extended Data Fig.9e).
Understanding whether microbial communities are formally cooperative is central to predicting their evolutionary and ecological stability. While cooperative systems can be productive, they are prone to instabilities on both ecological and evolutionary timescales that can undermine them5,14,15,21,22. The ability of one species to utilize the waste product of another is prevalent, but waste production alone does not signify cooperative evolution. As opposed to waste product utilization or exploitive interactions28-30, there are few well-documented cases of evolved cooperation between microbial species14. We have found evidence of strong eco-evolutionary interactions within the microbiota that are likely to be central to both the functioning and stability of these complex communities.
Methods
Bacterial strains and media
Bacteroidales type strains used in this study are, Bo ATCC 8483, B. thetaiotaomicron VPI 5482 Bv ATCC 8482, and B. fragilis NCTC 9343. Bacteria were grown in media formulation as previously described3.
Bacterial culture
For growth in defined media, bacteria were inoculated from brain heart infusion plates containing hemin and vitamin K (BHIS) plates into basal medium (BS), cultured overnight to stationary phase, then diluted 1:10 in fresh BS and grown to mid log. At mid log, bacteria were pelleted by centrifugation and washed with sterile phosphate buffered saline (PBS) and then inoculated in defined media. Carbohydrates used to supplement defined media include fructose (F2543, Sigma), fructose oligosaccharides (FOS; OraftiP95, Beneo-Orafti group), levan (L8647, Sigma), amylopectin (10120, Sigma), and inulin (OraftiHP, Beneo-Orafti group). Levan and amylopectin were autoclaved as 1% w/v in H2O and dialyzed using 3.5kD MW membranes (Slide-A-Lyzer Dialysis Cassettes, ThermoScientific). Short chain fatty acids acetate, propionate and succinate were purchased from Sigma. Stock solutions of 2 mM were pH neutralized to pH 7.2-7.3 with 10N NaOH. All cultures were grown at 37°C under anaerobic conditions. Bacterial growth was quantified by optical density (OD600) using 200 μl of bacterial culture in 96 well flat-bottom microtiter plates using a Powerwave spectrophotometer (Biotek). Murine gut Bacteroidales from the cecal preparations used in for the colonization experiments were grown on BHIS plates. Resulting colonies were tested for growth in inulin minimal medium or inulin breakdown products from the conditioned media of Bo grown in inulin, containing inulin breakdown products as previously described3.
Creation of Bacteroides mutants
Deletion mutants were created whereby the genes encoding BT3698 or BT1760 in Bacteroides thetaiotaomicron VPI 5482, BACOVA_04502 in Bo ATCC 8483 BACOVA_04503, BACOVA_04502/3, BACOVA_04504, or BACOVA_04505 in Bo ATCC 8483 were removed. DNA segments upstream and downstream of the region to be deleted were PCR amplified using the primers outlined in Extended Data Table 1. PCR products were digested with BamHI, EcoRI and/or MluI engineered into the primers (Supplementary Information Table 1) and cloned by three way ligation into the appropriate site of pNJR631. The resulting plasmids were conjugally transferred into the Bacteroides strain as indicated using helper plasmid R751 and cointegrates were selected by erythromycin resistance. Cross outs were screened by PCR for the mutant genotype.
Cloning of PUL genes for expression in deletion mutants
BACOVA_04502, BACOVA_04503, BACOVA_04502/3, BACOVA_04504, BACOVA_04505 or BACOVA_04504/5 genes were PCR amplified using the primers listed in Extended Data Table 1. The PCR products were digested and ligated into the BamHI or KpnI site of the Bacteroides expression vector pFD340 32. Plasmids containing the correct orientation of the insert in relation to the vector-borne promoter were introduced into mutant Bacteroides strains by mobilization from E. coli using helper plasmid RK231.
Mono-, co- and tri- culture experiments
For bacterial mono and co-culture experiments in defined liquid media, bacteria were grown as indicated for monoculture prior to addition to the defined media. Sterile magnetic stir bars were added to culture tubes within a rack placed on a stir plate within the anaerobic chamber. For conditioned media experiments, Bo WT, Bo Δ04502, Bo Δ04502/3, Bv, or Bf were grown to early log in inulin defined media or 0.125% fructose defined media (for Extended Data Fig.9e), conditioned media were collected, filter sterilized, and incubated at 37°C for 72 hrs. Conditioned media was replenished with defined media without additional carbohydrate and used for cultivation of Bv. Bo Δ04502/3 conditioned media was dialyzed in defined media without carbohydrate using 2 kD MW membranes (Slide-A-Lyzer Dialysis Cassettes, ThermoScientific). For monoculture of Bo WT and mutants on solid agarose, 4 μl of the indicated concentration of bacteria were dotted onto minimal inulin agarose plates. At the indicated timepoints, the bacteria were cut out, diluted and plated onto BHIS for CFU enumeration. For co-plating experiments, 106 Bo (WT or mutant) or Bf were co-plated with 105 Bv or a control volume of PBS. Four μl were then dotted on to defined inulin agarose plates. At the indicated timepoints, the dotted patches were cut from the agarose plates and resuspended in PBS, diluted and plated to BHIS for enumeration. Quantification and differentiation of WT and isogenic glycoside hydrolase or polysaccharide lyase mutant was performed by plating dilutions of mixed liquid culture or the cut-out patch on agarose plates onto BHIS, followed by picking ~100 colonies and determining WT or mutant genotype by PCR using primers listed in Extended Figure Table 1. For genotypic screening of Bt WT and Bt Δ3698, two sets of primers were used (Extended Table 1). For Bo/Bv co-culture in Fig.4B,C and Extended Data Fig.7, Bo Δ03533 (WT) and Bo Δ03533 Δ04502 (Δ04502) arginine auxotrophic mutants were used in co-culture with Bv on minimal inulin agarose plates supplemented with 50 μg/ml of arginine (Sigma) which does not impair or limit growth as compared to WT3. Colonies on BHIS plates were replica plated onto defined glucose defined plates, which support the growth of Bv but not Bo Δ03533 or Bo Δ03533 Δ04502.
Thin-layer chromatography
Thin-layer chromatography (TLC) was employed to specifically detect carbohydrates as previously described3. Standards for TLC included glucose (G7528, Sigma), fructose (F2543, Sigma), fructose oligosaccharides (FOS; OraftiP95, Beneo-Orafti group) and inulin (OraftiHP, Beneo-Orafti group). See Supplemental Information Figure 1 for uncropped TLCs.
Gas Chromatographic Analysis of Culture Media
Chromatographic analysis was carried out using a Shimadzu GC14-A system with a flame ionization detector (FID) (Shimadzu Corp, Kyoto, Japan). A volatile acid mix containing 10 mM of acetic, propionic, isobutyric, butyric, isovaleric, valeric, isocaproic, caproic, and heptanoic acids was used (Matreya, Pleasant Gap PA). A non-volatile acid mix containing 10 mM of pyruvic and lactic and 5 mM of oxalacetic, oxalic, methy malonic, malonic, fumaric, and succinic was used (Matreya, Pleasant Gap PA).
Cloning, purification, and enzymatic analysis of BACOVA_04502-3
To obtain purified BACOVA_04502 and BACOVA_04503 protein, these genes were cloned individually into the BamHI site of pET16b (Novagen) using the primers listed in Extended Figure Table 1. The constructs were designed so that the His-tag encoded by pET16b replaced the SpII signal sequence of these proteins allowing for their solubility. The recombinant plasmids were transformed into E. coli BL21 (DE3), grown to an OD600 of 0.6 - 0.7, and expression of the recombinant gene was induced by the addition of 0.4mM IPTG for an additional 4 h. The His-tagged proteins were isolated essentially as described33 using Dynabeads TALON paramagnetic beads. For enzymatic analysis (Fig.2A) the proteins were added to inulin media in their magnetic bead-bound form. This allows for easy removal of the enzymes following digestion. As a control, the beads resulting from the same procedure performed with E. coli BL21 (DE3) containing only the vector (pET16b) were used. For Bo growth assays (Fig.3d), 50 μl of beads (25 μl containing His-04502 and 25 μl containing His-04503) or equivalent volume of Dynabead buffer (for undigested inulin) were added to inulin defined medium. After 24 h at 37°C, the beads containing the enzyme were removed with a magnet, and the media (digested or undigested inulin) was used to culture Bo WT and Δ04502.
Gnotobiotic mouse experiments
All animal experiments were approved by the Harvard Medical School IACUC. Swiss Webster germ free male mice (6-10 weeks old) were purchased from the Harvard Digestive Diseases Gnotobiotic Core facility. Littermates were randomly allocated for different gnotobiotic experimental arms. Experiments were conducted in either sterile Optima cages (Fig.3b, 4a, Extended Data Fig.9d) or gnotobiotic isolators (Fig.4f). When appropriate, animals were numbered by sterile tail markers for longitudinal analysis and were not blinded. Number of animals used for experimentation was determined by precedence for gnotobiotic studies. Longitudinal analysis in the experiment of Fig.4f of the ratios of wild type to mutant Bo under changing environmental conditions allowed for internally-controlled, within-individual comparisons. Mice were placed on polysaccharide free special chow (65% w/v glucose, protein-free, supplemented with all essential amino acids except arginine; BioServe). Arginine at 50 μg/ml was supplemented in all drinking water. As indicated, mice were given 1% inulin (w/v) in sterile drinking water. Mice were inoculated with the indicated bacteria by applying ~108 live bacteria (grown to mid log) onto mouse fur. Dilutions of feces at various time points following inoculation were plated to BHIS plates and genotyped as above (Fig.4f). Predetermined exclusion criteria for gnotobiotic experiments contamination as determined by either the presence of colonies with distinct morphology on anaerobic plates than Bo or Bv or colonies present at >102 CFU/ml (limit of detection) under aerobic conditions.
For gavage of Bo WT or Δ04502/3 monocolonized mice with the cecal content of conventionalized raised mice, two ~ 8 week old male Swiss Webster mice purchased from Taconic and housed in a specific pathogen free facility were sacrificed under sterile conditions. Intestine was excised and care was made to leave cecum intact. Within 2 minutes of excision, the ceca were transferred into an anaerobic chamber where the cecal contents were pooled and diluted with ~10 ml of pre-reduced phosphate buffered solution supplemented with 0.1% cysteine. Contents were vigorously vortexed and immediately divided equally into two conicals (one for each group of mouse) to ensure equality of suspension between both conicals. Tightly sealed conicals were transferred to the mouse facility and which point 200 μl were gavaged to each mouse housed in sterile Optima cages. Cecal contents were plated to LKV (Remel) plates for enrichment of Bacteroides. Different colony morphologies were speciated by 16S PCR as previously described17. For each group of mice, mice were housed in cages of 2 and 3 mice per cage. At time of sacrifice, cecal contents were collected and plated to defined inulin plates by which Bo was enumerated based on distinct colony morphology of Bo on inulin agarose plates that was not present in conventionally raised cecal population.
Statistical analysis
Replicate experiments are shown in Extended Data. All p values are derived from Student's t test except as indicated in Fig.4f and Extended Data Fig.9c where Fisher exact test was performed. Statistical significance of variance reported as indicated per experiment in Figure Legends All center values are mean. Error bars are standard error of the mean.
Extended Data
Extended Data Figure 1. Limited cooperation during polysaccharide utilization by B. thetaiotaomicron.
a-d, Independent experiments for Fig. 1b-e. (a,b) Upper panels n=2 biological replicates, lower panels n=1; (c,d) n=2 biological replicates. e, TLC analysis of conditioned media from Bt grown in amylopectin (left panel) or levan (right panel) minimal media. EL = early log, ML = late log, LL = late log, Stat = stationary phase. Glu = Glucose, Fru = fructose, Suc = sucrose. See SI Figure 1 for uncropped scanned images. In all panels, error bars represent standard error; p values derived from two-tailed Student's t test.
Extended Data Figure 2. Bo 04502 and 04503 mutants grow equivalently to wild type on limiting concentrations of inulin and do not require surface digestion for utilization of inulin.
a, Growth of Bo WT, Δ04502, Δ04503 and Δ04502/3 mutants in varying concentrations of inulin as indicated. Biological replicates of each condition are plotted as individual lines (n=2 cell culture biological replicates). Upper and lower panels are independent experiments. b, Independent experiments for Fig. 2d. EL = early log, ML = mid log, LL = late log, St = stationary phase. See SI Figure 1 for uncropped scanned images. c, Complementation of Bo Δ04502 and Δ04502/3 mutants with the respective genes in trans. TLC analysis of conditioned media from Bo Δ04502/3 (left panel) complemented in trans with BACOVA_04502, BACOVA_04503, BACOVA_04502/3 or vector alone (pFD340) and Bo Δ04502 (right panel) with BACOVA_04502 or vector alone grown in defined inulin media. See SI Figure 1 for uncropped scanned images. S = stationary phase.
Extended Data Figure 3. SusC and SusD homologs BACOVA_04505 and BACOVA_04505 are required for inulin utilization.
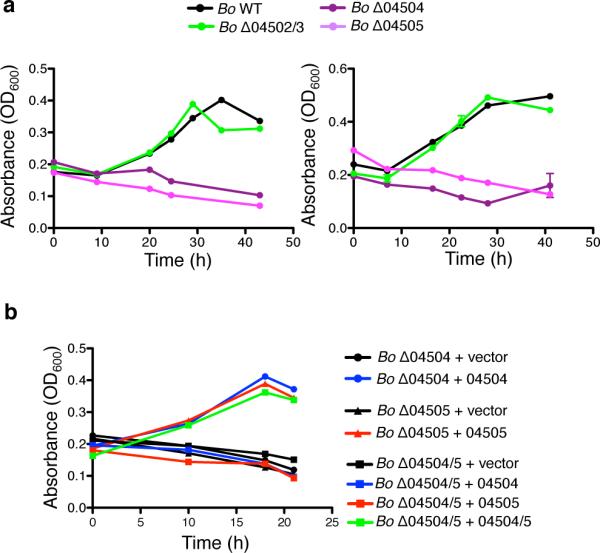
a, Independent experiments for Fig. 2e. Left panel n=2 biological replicates, right panel each line represents n=1 sample per condition. b, Complementation of Bo Δ04504, Bo Δ04505 and Δ04504/5 mutants with the genes in trans. Growth of Bo Δ04504, Bo Δ04505, Bo Δ04504/5 with BACOVA_04504, BACOVA_04505, BACOVA_04504/5 or vector alone (pFD340) in trans in defined inulin media. Each line represents n=1 sample per condition. In all panels, error bars represent standard error; p values derived from two-tailed Student's t test.
Extended Data Figure 4. Costs of extracellular inulin digestion by B. ovatus.
a,b, Independent experiments for Fig. 3a,c. n=3 biological replicates at day 1,2; n=2, biological replicates at day 4 (a). In upper and upped middle panels biological replicates of each condition are plotted as individual lines (n=2 cell culture biological replicates); in lower middle and lower panels each line represents n=1 sample per condition (b). c, TLC analysis of conditioned media from Bo WT and Bo Δ04502/3 cultured in 0.5% inulin with trace (0.06%) amounts of fructose. St = stationary phase. See SI Figure 1 for uncropped scanned images. In all panels, error bars represent standard error; p values derived from two-tailed Student's t test
Extended Data Figure 5. Preferential utilization of undigested inulin by B. ovatus and costs of inulin digestion by 04502/3.
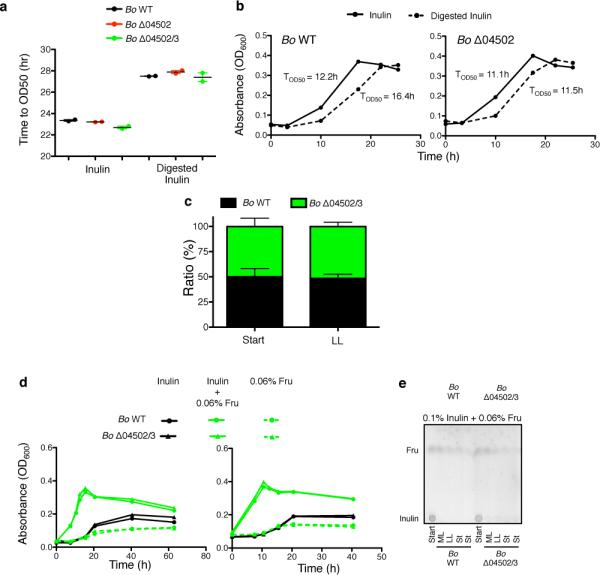
a, Time to mid-log (estimated at 50% maximal OD (OD50) by linear regression analysis) of Fig. 3d. b, Additional independent experiments for Fig. 3d. Each line represents n=1 sample per condition. c, Competition of Bo WT and Bo Δ04502/3 co-cultured in 0.5% inulin with trace (0.06%) amounts of fructose. n=2 cell culture biological replicates; d,e, Growth (d) and TLC analysis of conditioned media (e) of Bo WT and BoΔ04502/3 cultured in 0.1% inulin with trace (0.06%) amounts of fructose. See SI Figure 1 for uncropped scanned images. For d, each panel is an independent experiment. Each condition is plotted as individual lines in each panel (n=2 cell culture biological replicates). In all panels, error bars represent standard error; p values derived from two-tailed Student's t test.
Extended Data Figure 6. A complex mouse microbiota differentially affects B. ovatus WT and Δ04502/3 pre-colonized gnotobiotic mice and analysis of cross feeding of the predominant murine Bacteroidales of the murine gut microbiota.
a, Germ-free mice were monocolonized with Bo WT or Δ04502/3 and maintained on a diet supplemented with inulin as the sole polysaccharide and housed under gnotobiotic conditions for 2 weeks. Bacteria were enumerated from feces prior to gavage with intestinal microbiota of conventionally raised mice (n=5 mice, cell culture biological replicates). b, Growth of two dominant mouse microbiota Bacteroidales strains (Parabacteroides goldsteinii and a strain with 96% 16S rRNA gene identity to B. thetaiotaomicron) with inulin breakdown products derived from the conditioned media of B. ovatus grown in inulin (all inulin had been digested) or undigested inulin minimal media. Each data point is a different isolate of the indicated species from the ceca of the conventionally raised mice used for gavage (n=11 isolates for upper panel, n=6 for lower panel. In all panels, error bars represent standard error.
Extended Data Figure 7. B. ovatus, but not B. fragilis benefits from B. vulgatus in co-culture in inulin.
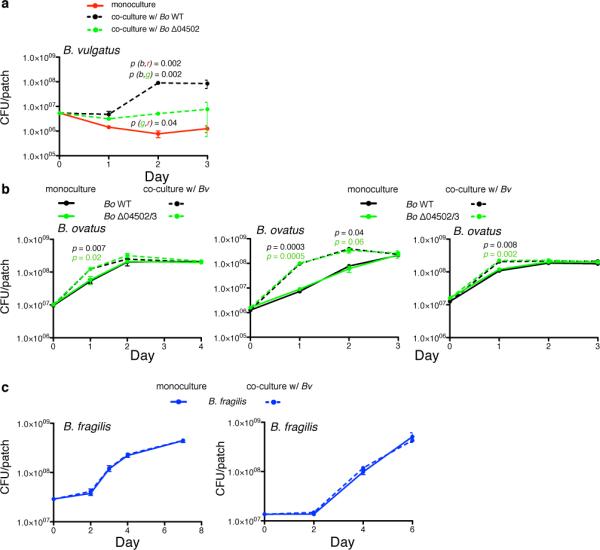
a, b, Independent experimentsfor Fig. 4b,d. The left panel corresponds to starting culture with ~107 CFU Bo corresponding to starting culture of ~106 CFU Bo in Fig. 4d. The two right panels are a duplicate pair of experiments of starting CFU of 106 and 107. In each panel n=2 biological replicates. c, Enumeration of B. fragilis (c) in monoculture or co-culture with Bv on defined inulin plates, n=3 cell culture biological replicates.. Letters in parentheses refer to values correlating to color of line used for statistical analysis. In (a), for example, p (g,r) refers to comparison of values of green (g) and red (r) values at the time-point indicated. In (b) color of p value indicates comparison of monoculture and co-culture for the given condition at the time-point indicated. For all panels, error bars represent standard error; p values derived from two-tailed Student's t test.
Extended Data Figure 8. Secreted factors from Bo and isogenic mutants, but not B. fragilis (Bf), support Bv survival.
a, Growth of Bv in conditioned media from Bo WT, Δ04502, Δ04502/3 or Bf grown in defined media with inulin as the sole carbohydrate and in inulin media. End time-point corresponded to peak growth of Bv in conditioned media derived from Bo WT. B. fragilis, which utilizes inulin1,3 but similar to Bo Δ04502/3 does not liberate inulin breakdown products3, does not support the survival of Bv during co-culture. Left and right panels are independent experiments. Left panel; start, n=4 biological replicates; end n=2 biological replicates. Right panel; t0, n=4 cell culture biological replicates; t13 and 24, n=2 biological replicates. b, Growth of Bv in dialyzed (2 kD MW membrane) or undialyzed conditioned media from Bo Δ04502/3 grown in inulin, n=2 cell culture biological replicates. c, Gas chromatographic analysis of acetate, propionate and succinate in conditioned media during growth of Bo WT and Δ04502/3 in defined media with inulin as the sole carbohydrate. Other volatile and non-volatile substances (as listed in Methods) were undetectable, n=2 cell culture biological replicates, except Δ04502/3 stationary phase, n=1. d, Growth of Bv in defined medium with inulin as the sole carbohydrate with or without addition with 15 mM of acetate, propionate or succinate, t0, n=4 biological replicates; t13 and 24, n=2 biological replicates. CM = conditioned media, UD = undetected. For all panels, error bars represent standard error; p values derived from two-tailed Student's t test
Extended Data Figure 9. Spatial aspects of mutualism between Bo and Bv via cross feeding and interspecies cooperation in vivo via 04502/3.
a, Independent experiments for Fig. 4c, n=4 biological replicates. b, Independent experiments for Fig. 4e, n=3 cell culture biological replicates. c, Scatter plot of experiment in Fig. 4f, n=3 cell culture biological replicates. d, Ratios of WT and Δ04502/3 in feces 21 days after co-colonization of three germ-free mice (n=3 mice biological replicates) on a diet of inulin as the sole dietary polysaccharide (pre-Bv) and then four days after introduction of Bv (post-Bv). Each panel shows the ratio pre- and post- Bv of an individual mouse. p values are Fisher exact test comparing the frequency of Bo WT and Δ04502/3 pre- and post- colonization with Bv for each individual mouse. At day 21, all mice were colonized with a higher ratio of the mutant (ranging to 86% in the mouse depicted in the lowest panel), with each mouse showing a statistically significant increase in the proportion of the WT after introduction of Bv. e, Growth of B. ovatus in 0.5% inulin (upper panel) or fructose (lower panel) in minimal media to which filter sterilized conditioned media from early log, OD600 matched growth of Bv or Bo in 0.125% fructose minimal media or fresh 0.125% fructose minimal media control was added at 1:1 ratio. In (e) numbers refer to p values (* <0.05, **<0.01, ***<0.001) of comparison of values of green (g), red (r) or black (b) values by unpaired, two-tailed student t test at the time-point indicated, n=2 cell culture biological replicates. For all panels, error bars represent standard error, for all panels except (d) p values derived from two-tailed Student's t test.
Extended Data Figure 10. Schematic of forms of cooperativity via polysaccharide digestion among Bacteroidales.
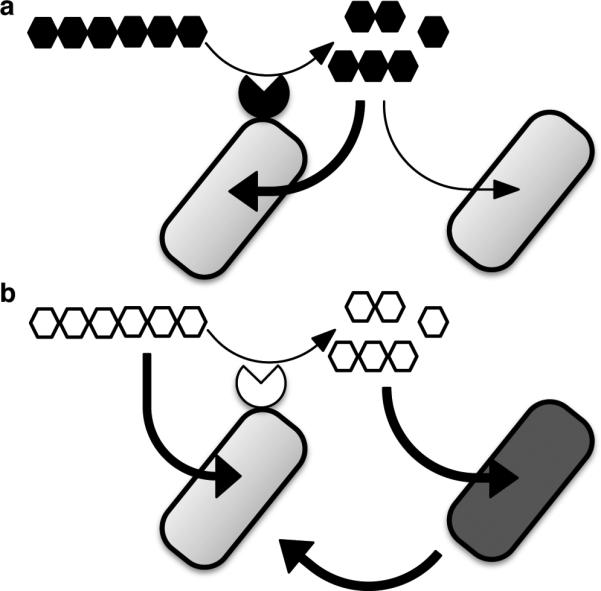
a, Limited cooperation. Privatization of extracellularly digested public goods by the individual performing the digestion leads to greater individual (dark arrow) than shared benefits (light arrow) as seen in Bt during growth on levan and amylopectin. b, Cooperation between species is seen between Bo and Bv during growth on inulin. Surface digestion of inulin by Bo creates breakdown products that it does not need to grow on inulin. Rather, inulin breakdown represents a dedicated cross-feeding system that provides benefits to Bv, with reciprocal fitness benefits to Bo.
Supplementary Material
Acknowledgments
We thank C. B. Ogbunugafor, J. Ordovas-Montanes, and M. Waldor and two anonymous reviewers for critical review of the manuscript. M. Delaney for SCFA analysis, V. Yeliseyev for assistance with gnotobiotics. Inulin and FOS were provided by Beneo-Orafti. Mice were provided by the HDDC, NIH Grant P30 DK34845. S. R-N is supported by the PIDS-St Jude Research Hospital Fellowship Program in Basic Research, a K12 Child Health Research Center grant through Boston Children's Hospital and a Pilot Feasibility Award funded by HDDC P30 DK034854. K.R.F. is supported by European Research Council Grant 242670. This work was supported by Public Health Service grant R01AI081843 (to L.E.C.) from the NIH/NIAID.
Footnotes
Author Contributions
S.R-N performed mutant construction bacterial cultures, gnotobiotic experiments, protein purification and TLC, L.E.C. assisted with mutant construction. S.R-N, and L.E.C analyzed the data. S.R-N, K.R.F and L.E.C designed the study and wrote the paper.
Supplementary Information is available online.
Author Information The authors declare no competing financial interests.
References
- 1.Sonnenburg ED, et al. Specificity of Polysaccharide Use in Intestinal Bacteroides Species Determines Diet-Induced Microbiota Alterations. Cell. 2010;141:1241–1252. doi: 10.1016/j.cell.2010.05.005. [DOI] [PMC free article] [PubMed] [Google Scholar]
- 2.West SA, Griffin AS, Gardner A, Diggle SP. Social evolution theory for microorganisms. Nat Rev Microbiol. 2006;4:597–607. doi: 10.1038/nrmicro1461. [DOI] [PubMed] [Google Scholar]
- 3.Rakoff-Nahoum S, Coyne MJ, Comstock LE. An ecological network of polysaccharide utilization among human intestinal symbionts. Curr Biol. 2014;24:40–49. doi: 10.1016/j.cub.2013.10.077. [DOI] [PMC free article] [PubMed] [Google Scholar]
- 4.Drescher K, Nadell CD, Stone HA, Wingreen NS, Bassler BL. Solutions to the public goods dilemma in bacterial biofilms. Curr Biol. 2014;24:50–55. doi: 10.1016/j.cub.2013.10.030. [DOI] [PMC free article] [PubMed] [Google Scholar]
- 5.Frank SA. A general model of the public goods dilemma. Journal of Evolutionary Biology. 2010;23:1245–1250. doi: 10.1111/j.1420-9101.2010.01986.x. [DOI] [PMC free article] [PubMed] [Google Scholar]
- 6.Koropatkin NM, Cameron EA, Martens EC. How glycan metabolism shapes the human gut microbiota. Nat Rev Microbiol. 2012;10:323–335. doi: 10.1038/nrmicro2746. [DOI] [PMC free article] [PubMed] [Google Scholar]
- 7.Subramanian S, et al. Cultivating Healthy Growth and Nutrition through the Gut Microbiota. Cell. 2015;161:36–48. doi: 10.1016/j.cell.2015.03.013. [DOI] [PMC free article] [PubMed] [Google Scholar]
- 8.Shipman JA, Cho KH, Siegel HA, Salyers AA. Physiological characterization of SusG, an outer membrane protein essential for starch utilization by Bacteroides thetaiotaomicron. J Bacteriol. 1999;181:7206–7211. doi: 10.1128/jb.181.23.7206-7211.1999. [DOI] [PMC free article] [PubMed] [Google Scholar]
- 9.Littman DR, Pamer EG. Role of the commensal microbiota in normal and pathogenic host immune responses. Cell Host Microbe. 2011;10:311–323. doi: 10.1016/j.chom.2011.10.004. [DOI] [PMC free article] [PubMed] [Google Scholar]
- 10.Waldor MK, et al. Where next for microbiome research? PLoS Biol. 2015;13:e1002050. doi: 10.1371/journal.pbio.1002050. [DOI] [PMC free article] [PubMed] [Google Scholar]
- 11.Koschwanez JH, Foster KR, Murray AW. Sucrose utilization in budding yeast as a model for the origin of undifferentiated multicellularity. PLoS Biol. 2011;9:e1001122. doi: 10.1371/journal.pbio.1001122. [DOI] [PMC free article] [PubMed] [Google Scholar]
- 12.Costello EK, Stagaman K, Dethlefsen L, Bohannan BJM, Relman DA. The application of ecological theory toward an understanding of the human microbiome. Science. 2012;336:1255–1262. doi: 10.1126/science.1224203. [DOI] [PMC free article] [PubMed] [Google Scholar]
- 13.Estrela S, Whiteley M, Brown SP. The demographic determinants of human microbiome health. Trends in Microbiology. 2015;23:134–141. doi: 10.1016/j.tim.2014.11.005. [DOI] [PMC free article] [PubMed] [Google Scholar]
- 14.Mitri S, Foster KR. The genotypic view of social interactions in microbial communities. Annu. Rev. Genet. 2013;47:247–273. doi: 10.1146/annurev-genet-111212-133307. [DOI] [PubMed] [Google Scholar]
- 15.Oliveira NM, Niehus R, Foster KR. Evolutionary limits to cooperation in microbial communities. Proceedings of the National Academy of Sciences. 2014;111:17941–17946. doi: 10.1073/pnas.1412673111. [DOI] [PMC free article] [PubMed] [Google Scholar]
- 16.Faith JJ, et al. The long-term stability of the human gut microbiota. Science. 2013;341:1237439. doi: 10.1126/science.1237439. [DOI] [PMC free article] [PubMed] [Google Scholar]
- 17.Zitomersky NL, Coyne MJ, Comstock LE. Longitudinal analysis of the prevalence, maintenance, and IgA response to species of the order Bacteroidales in the human gut. Infect Immun. 2011;79:2012–2020. doi: 10.1128/IAI.01348-10. [DOI] [PMC free article] [PubMed] [Google Scholar]
- 18.Flint HJ, Bayer EA, Rincon MT, Lamed R, White BA. Polysaccharide utilization by gut bacteria: potential for new insights from genomic analysis. Nat Rev Microbiol. 2008;6:121–131. doi: 10.1038/nrmicro1817. [DOI] [PubMed] [Google Scholar]
- 19.Elhenawy W, Debelyy MO, Feldman MF. Preferential packing of acidic glycosidases and proteases into Bacteroides outer membrane vesicles. mBio. 2014;5:e00909–14. doi: 10.1128/mBio.00909-14. [DOI] [PMC free article] [PubMed] [Google Scholar]
- 20.Cuskin F, et al. Human gut Bacteroidetes can utilize yeast mannan through a selfish mechanism. Nature. 2015;517:165–169. doi: 10.1038/nature13995. [DOI] [PMC free article] [PubMed] [Google Scholar]
- 21.Sachs JL, Mueller UG, Wilcox TP, Bull JJ. The evolution of cooperation. Q Rev Biol. 2004;79:135–160. doi: 10.1086/383541. [DOI] [PubMed] [Google Scholar]
- 22.Foster KR, Wenseleers T. A general model for the evolution of mutualisms. Journal of Evolutionary Biology. 2006;19:1283–1293. doi: 10.1111/j.1420-9101.2005.01073.x. [DOI] [PubMed] [Google Scholar]
- 23.Gore J, Youk H, van Oudenaarden A. Snowdrift game dynamics and facultative cheating in yeast. Nature. 2009;459:253–256. doi: 10.1038/nature07921. [DOI] [PMC free article] [PubMed] [Google Scholar]
- 24.Martens EC, et al. Recognition and degradation of plant cell wall polysaccharides by two human gut symbionts. PLoS Biol. 2011;9:e1001221. doi: 10.1371/journal.pbio.1001221. [DOI] [PMC free article] [PubMed] [Google Scholar]
- 25.Orel R, Kamhi Trop T. Intestinal microbiota, probiotics and prebiotics in inflammatory bowel disease. World J Gastroenterol. 2014;20:11505–11524. doi: 10.3748/wjg.v20.i33.11505. [DOI] [PMC free article] [PubMed] [Google Scholar]
- 26.Cameron EA, et al. Multifunctional nutrient-binding proteins adapt human symbiotic bacteria for glycan competition in the gut by separately promoting enhanced sensing and catalysis. mBio. 2014;5:e01441–14. doi: 10.1128/mBio.01441-14. [DOI] [PMC free article] [PubMed] [Google Scholar]
- 27.Momeni B, Waite AJ, Shou W. Spatial self-organization favors heterotypic cooperation over cheating. Elife. 2013;2:e00960. doi: 10.7554/eLife.00960. [DOI] [PMC free article] [PubMed] [Google Scholar]
- 28.Ng KM, et al. Microbiota-liberated host sugars facilitiate post-antobiotic expansion of enteric pathogens. Nature. 2013;502:96–99. doi: 10.1038/nature12503. [DOI] [PMC free article] [PubMed] [Google Scholar]
- 29.Degnan PH, Barry NA, Mok KC, Taga ME, Goodman AL. Human gut microbes use multiple transporters to distinguish vitamin B analogs and compete in the gut. Cell Host Microbe. 2014;15:47–57. doi: 10.1016/j.chom.2013.12.007. [DOI] [PMC free article] [PubMed] [Google Scholar]
- 30.Fischbach MA, Sonnenburg JL. Eating for two: how metabolism establishes interspecies interactions in the gut. Cell Host Microbe. 2011;10:336–347. doi: 10.1016/j.chom.2011.10.002. [DOI] [PMC free article] [PubMed] [Google Scholar]
- 31.Stevens AM, Shoemaker NB, Salyers AA. The region of a Bacteroides conjugal chromosomal tetracycline resistance element which is responsible for production of plasmidlike forms from unlinked chromosomal DNA might also be involved in transfer of the element. J Bacteriol. 1990;172:4271–4279. doi: 10.1128/jb.172.8.4271-4279.1990. [DOI] [PMC free article] [PubMed] [Google Scholar]
- 32.Smith CJ, Rogers MB, McKee ML. Heterologous gene expression in Bacteroides fragilis. Plasmid. 1992;27:141–154. doi: 10.1016/0147-619x(92)90014-2. [DOI] [PubMed] [Google Scholar]
- 33.Coyne MJ, Fletcher CM, Reinap B, Comstock LE. UDP-glucuronic acid decarboxylases of Bacteroides fragilis and their prevalence in bacteria. J Bacteriol. 2011;193:5252–5259. doi: 10.1128/JB.05337-11. [DOI] [PMC free article] [PubMed] [Google Scholar]
Associated Data
This section collects any data citations, data availability statements, or supplementary materials included in this article.


