Summary
Regulatory T (Treg) cells expressing the transcription factor Foxp3 have a pivotal role in maintaining immunological self-tolerance1-5; yet, excessive Treg cell activities suppress anti-tumor immune responses6-8. Compared to resting phenotype Treg (rTreg) cells in the secondary lymphoid organs, Treg cells in non-lymphoid tissues including solid tumors exhibit an activated Treg (aTreg) cell phenotype9-11. However, aTreg cell function and whether its generation can be manipulated to promote tumor immunity without evoking autoimmunity are largely unexplored. Here we show that the transcription factor Foxo1, previously demonstrated to promote Treg cell suppression of lymphoproliferative diseases12,13, has an unexpected function in inhibiting aTreg cell-mediated immune tolerance. We found that aTreg cells turned over at a slower rate than rTreg cells, but were not locally maintained in tissues. Transcriptome analysis revealed that aTreg cell differentiation was associated with repression of Foxo1-dependent gene transcription, concomitant with reduced Foxo1 expression and enhanced Foxo1 phosphorylation at sites of the Akt kinase. Treg cell-specific expression of an Akt-insensitive Foxo1 mutant prevented downregulation of lymphoid organ homing molecules, and depleted aTreg cells, causing CD8+ T cell-mediated autoimmune diseases. Compared to Treg cells from healthy tissues, tumor-infiltrating Treg cells downregulated Foxo1 target genes more substantially. Expression of the Foxo1 mutant at a lower dose was sufficient to deplete tumor-associated Treg cells, activate effector CD8+ T cells, and inhibit tumor growth without inflicting autoimmunity. Thus, Foxo1 inactivation is essential for the generation of aTreg cells that have a crucial function in suppressing CD8+ T cell responses; and the Foxo signaling pathway in Treg cells can be titrated to preferentially break tumor immune tolerance.
rTreg cells, defined by high expression of the lymph node homing molecule CD62L and low expression of the T cell activation marker CD44, were abundant in lymph nodes and spleens, whereas CD62LloCD44hi aTreg cells were present in both lymphoid organs and non-lymphoid tissues such as the liver and lamina propria (LP) of the intestine (Extended Data Fig. 1). To examine how Treg cells are maintained in these tissues, we connected congenically-marked C57BL/6 mice using parabiosis (Extended Data Fig. 2). In line with a recent study14, rTreg cells as well as naïve CD4+ T cells reached chimerism of approximate 50%, and aTreg cells, in particular LP Treg cells, were skewed towards the host at 2 weeks post-surgery (Fig. 1a). Nevertheless, in contrast to liver-resident CD49a+ NK cells, all Treg cell populations were mixed by 4 weeks (Fig. 1a), revealing that they were not locally sustained for an extended period.
Figure 1. aTreg cells have a long lifespan, but are not locally maintained in nonlymphoid tissues.
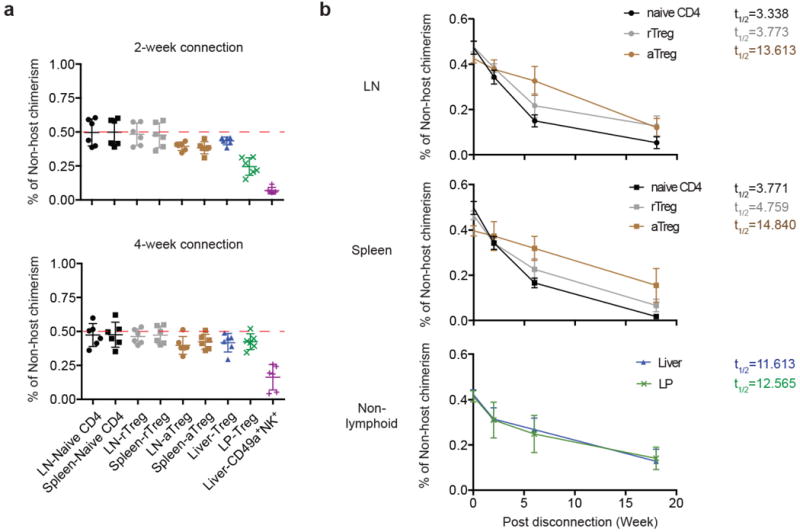
a, The frequencies of non-host derived cells in parabiotic mice 2 or 4 weeks after surgery, including naive CD4 (CD4+Foxp3-CD62LhiCD44lo), rTreg (CD4+Foxp3+CD62LhiCD44lo), aTreg (CD4+Foxp3+CD62LloCD44hi) cells in the lymph node (LN) and spleen, total Treg cells in the liver and colon lamina propria (LP), and NK1.1+CD49a+ cells in the liver. b, Parabionts were separated 4 weeks after connection, and percentage of non-host chimerism at 2, 6, 18 weeks post-separation are shown. t1/2 depicts the amount of time it took until the population decayed to half of its original size. Three to six parabionts were included in each time point.
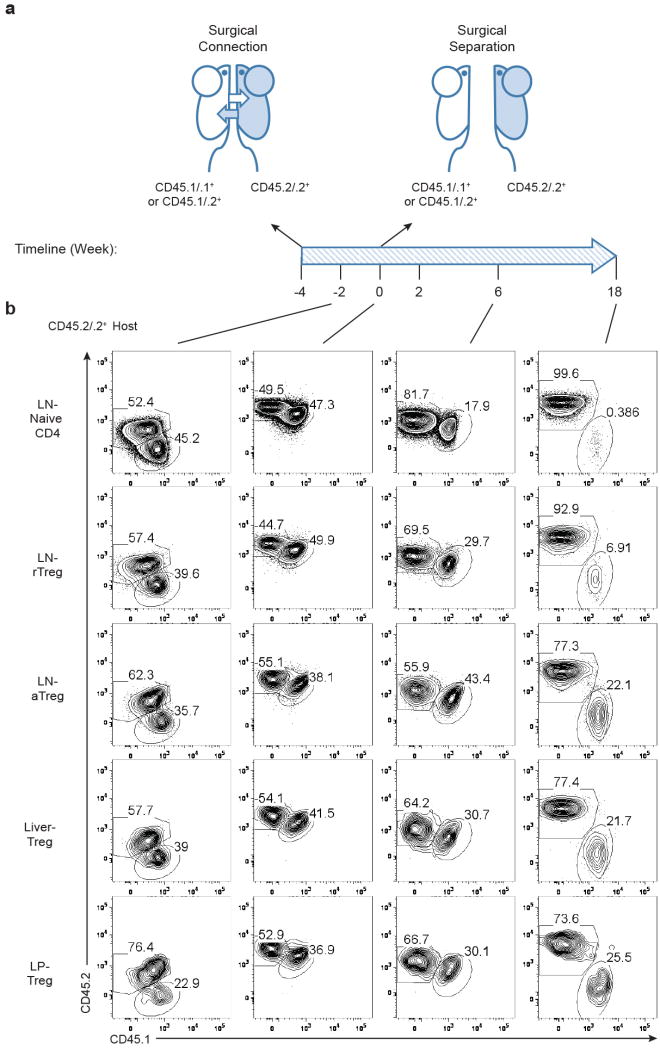
Antigen-experienced conventional T cells that recirculate around blood, lymph, and non-lymphoid tissues can be short-lived effector cells or long-lived effector memory cells15. To dissect the homeostatic properties of Treg cells, we disconnected the parabionts after 4 weeks, and assessed the turnover of rTreg and aTreg cells originated from the non-host parabiont at 2, 6 or 18 weeks post-surgery (Extended Data Fig. 2). Lymph node or splenic rTreg cells turned over at a rate close to that of naïve CD4+ T cells with a decay half time between 3 to 5 weeks (Fig. 1b). In contrast, aTreg cells from these tissues turned over at a substantially slower rate with a half time between 13 to 15 weeks (Fig. 1b). Notably, liver or LP Treg cells had a comparable decay rate around 12 weeks (Fig. 1b). Thus, compared to rTreg cells, aTreg cells from both lymphoid and non-lymphoid tissues turn over more slowly, resembling effector memory T cells.
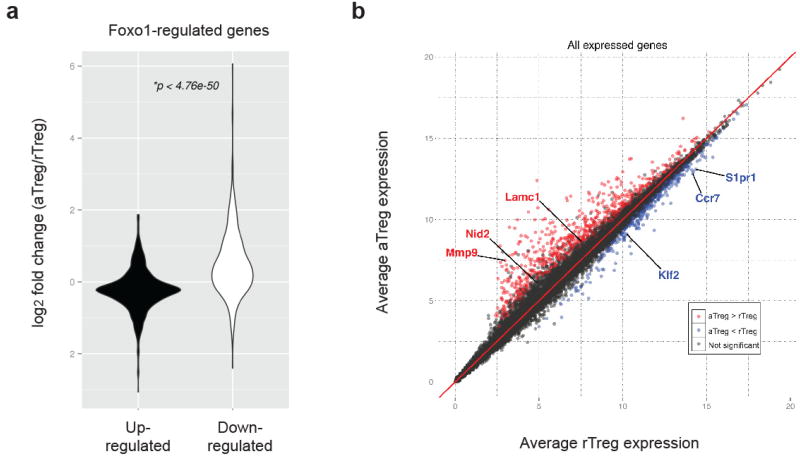
We wanted to determine how aTreg cell trafficking and homeostasis are regulated, and whether these processes can be manipulated to modulate aTreg cell function. The transcription factor Foxo1 integrates diverse environmental signals to control T cell homeostasis and differentiation16,17. Expression of Foxo1 is essential for Treg cell function12,18, but its role in aTreg and rTreg cell subsets has not been defined. To this end, we performed gene-expression profiling experiments of splenic aTreg and rTreg cells. By cross-referencing the differentially expressed genes and the Foxo1-regulated genes12, we found that aTreg or rTreg cells preferentially expressed the Foxo1-downregulated or -upregulated transcripts, respectively (Extended Data Fig. 3a and Table). Furthermore, in reference to a Foxo1 direct target gene signature12, the Foxo1-repressed or -activated transcripts were enriched in aTreg or rTreg cells, respectively (Fig. 2a and Extended Data Table). Notably, several Foxo1-activated genes that promote T cell homing to secondary lymphoid organs, including the transcription factor Klf2 and the cell trafficking receptors CCR7 and S1pr1, were highly expressed in rTreg cells, whereas the Foxo1-repressed genes potentially involved in T cell migration or retention in tissues, such as the extracellular matrix glycoprotein Lamc1, the basement protein Nid2, and the matrix metalloproteinase Mmp9, were induced in aTreg cells (Extended Data Fig. 3b and Table). In line with RNA-sequencing data, protein levels of two well-defined Foxo1-activated targets CCR7 and Bim were downregulated in aTreg cells (Fig. 2b), supporting that Foxo1-dependent gene expression is repressed in aTreg cells. Compared to rTreg cells, aTreg cells expressed lower amounts of Foxo1 (Fig. 2c). Foxo1 nuclear localization and protein stability is attenuated following phosphorylation by the Akt kinase16,17. Indeed, Akt and Foxo1 phosphorylation was elevated in aTreg cells (Fig. 2d). These findings demonstrate that aTreg cell differentiation is associated with Akt-triggered inhibition of Foxo1.
Figure 2. aTreg cell differentiation is associated with downregulation of Foxo1-dependent gene expression.
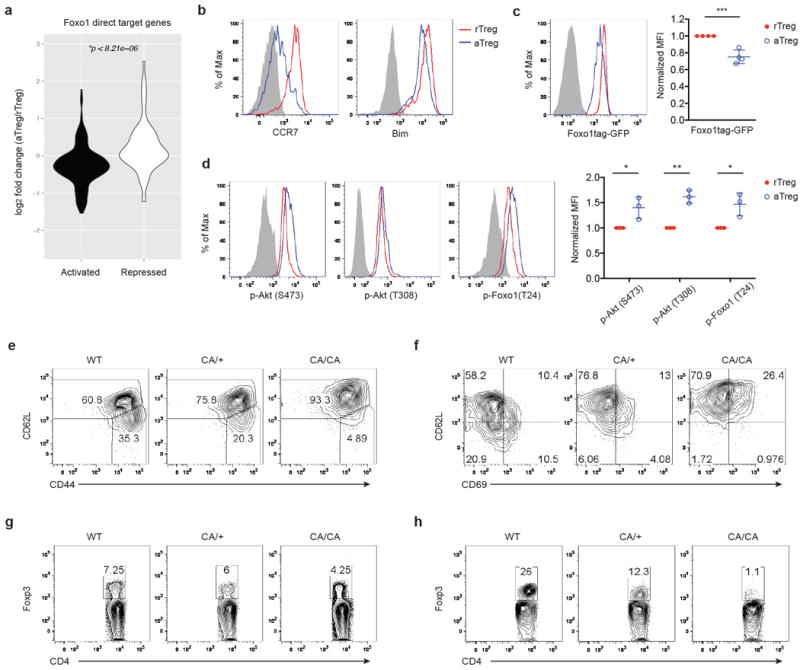
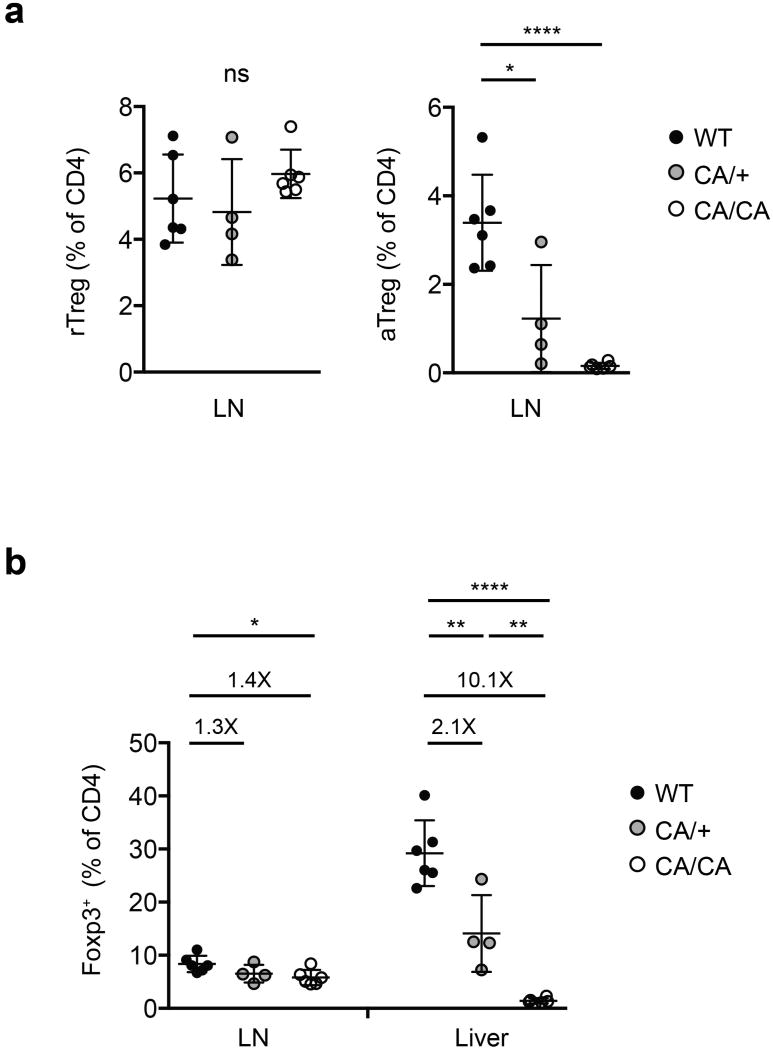
a, Gene expression comparison of Foxo1 direct target genes in splenic aTreg versus rTreg cells. Foxo1 direct target genes were defined by the following criteria: 1) differentially expressed between wild-type and Foxo1 knockout Treg cells; 2) the expression was corrected by expression of a constitutively active mutant of Foxo1 (Foxo1CA); 3) Foxo1 was recruited to the gene locus. b-d, Flow cytometric analysis of Foxo1-activated target genes CCR7 and Bim (b), Foxo1tag-GFP (c), and phosphorylated Akt and Foxo1 proteins (d) in splenic aTreg and rTreg cells. Quantifications of mean fluorescence intensity (MFI), normalized to rTreg cells are shown (n=3-4). e-f, Expression of CD44, CD62L, CD69 in lymph node Treg cells from 9 to 12-day-old wild-type (WT), Foxp3CreFoxo1CA/+ (CA/+) or Foxp3CreFoxo1CA/Foxo1CA (CA/CA) mice. g-h, Foxp3 expression in lymph node (g) or liver (h) CD4+ T cells from 9 to 12-day-old WT, CA/+ or CA/CA mice. Results represent at least three independent experiments. Unpaired t-test used (c-d). Error bars represent the mean ± SEM. *, p<0.05, **, p<0.01, ***, p<0.001.
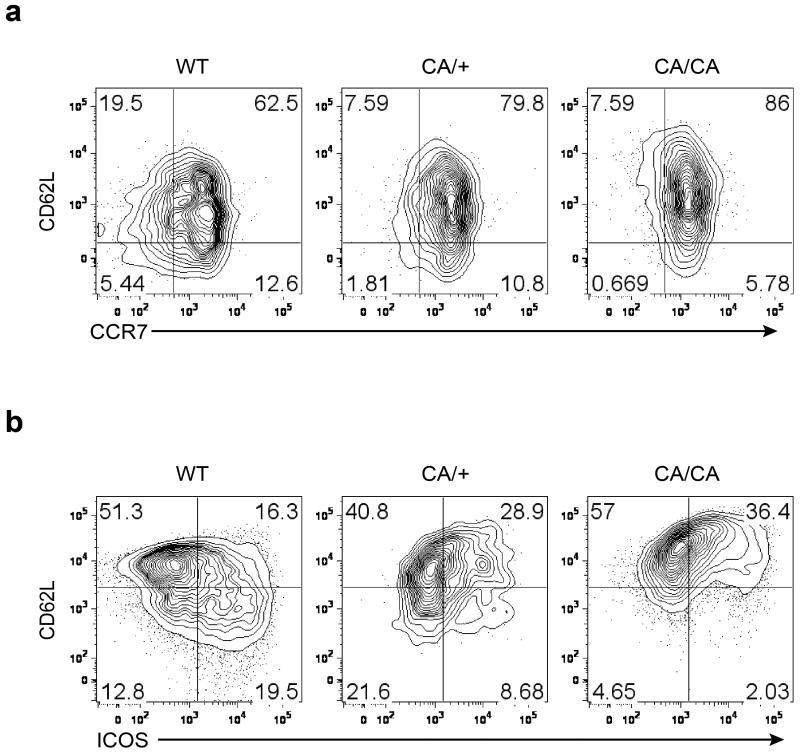
To determine the role of Foxo1 inactivation in aTreg cells, we used a mouse strain carrying a mutant allele of Foxo1 in which amino acids at the Akt phosphorylation sites are substituted with alanines, rendering the mutant protein refractory to Akt-triggered inhibition12. The mutant allele, preceded by a loxP-flanked ‘neo-STOP’ cassette, was inserted into the ROSA26 locus, and bred to the Foxp3cre background to induce Treg cell-specific expression of a constitutively active form of Foxo112, herein designated as CA. Thymic Treg cell differentiation was unperturbed in mice expressing CA from one or two alleles (data not shown). However, CD62Llo aTreg phenotype cells in lymph nodes were proportionally decreased in 9 to 12-day-old CA/+ or CA/CA mice (Fig. 2e), in line with a role for Foxo1 in inducing CD62L expression possibly via Klf219-21. CCR7 downregulation was attenuated in CA-expressing Treg cells as well (Extended Data Fig. 4a), revealing that relief of Akt-triggered Foxo1 inhibition is sufficient to maintain high expression of molecules involved in lymph node homing and intranodal T cell migration.
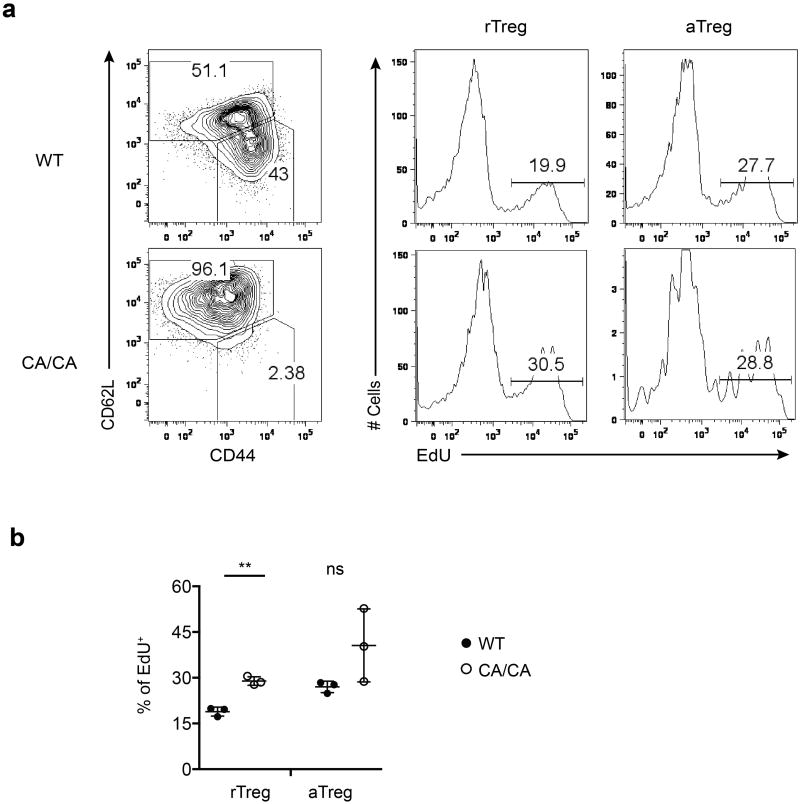
T cell activation markers CD69 and ICOS were comparably induced among Treg cells from wild-type (WT), CA/+, or CA/CA mice, with the exception that a higher fraction of CD62Lhi CA-expressing rTreg phenotype cells expressed these molecules (Fig. 2f and Extended Data Fig. 4b). Likewise, EdU labeling experiments showed that cell proliferation was comparable between Treg cells from WT and CA/CA mice except that CD62Lhi CA/CA rTreg phenotype cells had a higher proliferation rate than WT rTreg cells (Extended Data Fig. 5). rTreg and aTreg cells reside at different locations in secondary lymphoid organs, and engage discrete mechanisms of homeostatic maintenance14. Although CA-expressing rTreg phenotype cells had a higher rate of proliferation, total proportion of lymph node CD62Lhi Treg cells were similar among wild-type (WT), CA/+, and CA/CA mice (Extended Data Fig. 6a). In contrast, CD62Llo aTreg cells were depleted with increasing doses of CA expression (Extended Data Fig. 6a), resulting in reduced total lymph node Treg cells (Fig. 2g and Extended Data Fig. 6b). Thus, although Foxo1 inactivation is not essential for Treg cell activation or proliferation, it is required to control the expression of trafficking molecules that may promote aTreg cells to migrate away from the rTreg cell niche and further expand. In line with the migration defects, CA expression from one or two alleles caused approximately 2- or 10-fold reduction of liver Treg cells (Fig. 2h and Extended Data Fig. 6b).
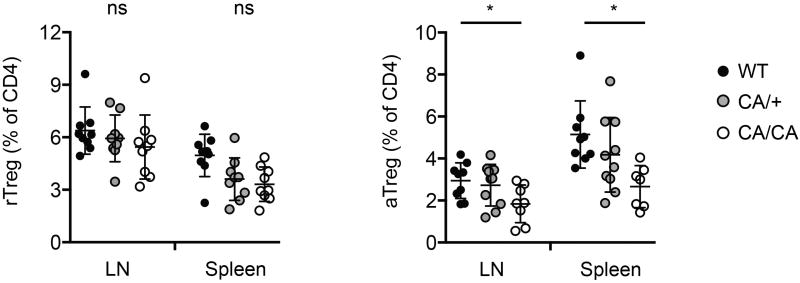
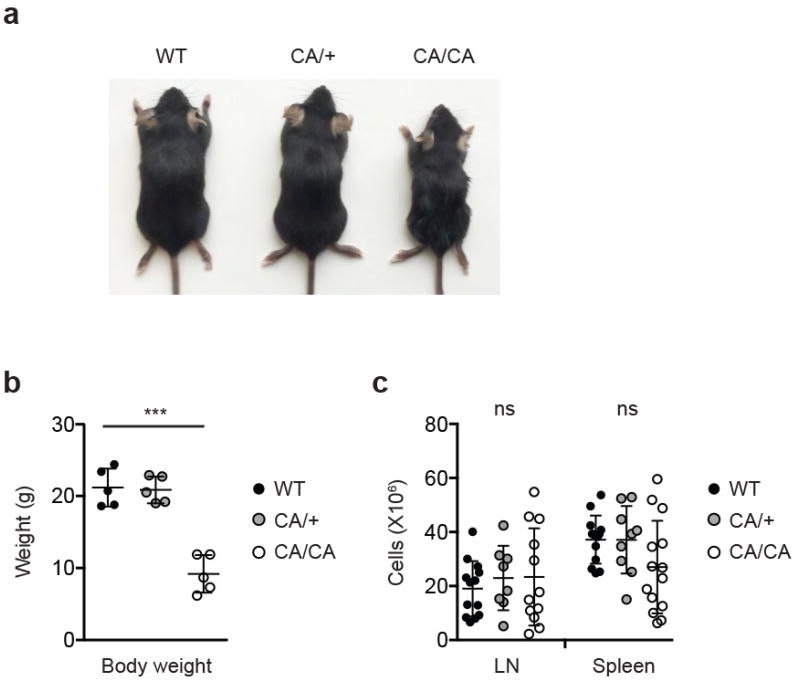
To examine whether the aTreg cell defects were sustained beyond the neonatal stage, we analyzed 4 to 6-week-old mice. Expression of CA triggered a dose-dependent reduction of aTreg cells in lymphoid organs as well as in non-lymphoid tissues including the liver and intestine (Fig. 3a and Extended Data Fig. 7). Compared to WT and CA/+ mice, all CA/CA mice succumbed to a wasting disease and death by 4 months of age (Fig. 3b and Extended Data Fig. 8a and 8b). In contrast to Treg cell-specific Foxo1-deficient mice12, CA/CA mice did not exhibit the typical inflammatory phenotype associated with the Scurfy mutation of the Foxp3 gene such as tail crusting, splenomegaly, or lymphadenopathy (Fig. 3c and Extended Data Fig. 8a and 8c). Yet, a dense infiltrate of leukocytes were observed in multiple organs including the liver and colon (Fig. 3d and data not shown). In addition, serum alanine aminotransferase (ALT) activity, a biomarker for liver injury, was elevated (Fig. 3e), revealing that the immunopathology had resulted in tissue damage.
Figure 3. Hyperactivation of Foxo1 in Treg cells causes a CD8+ T cell-dependent inflammatory disease.
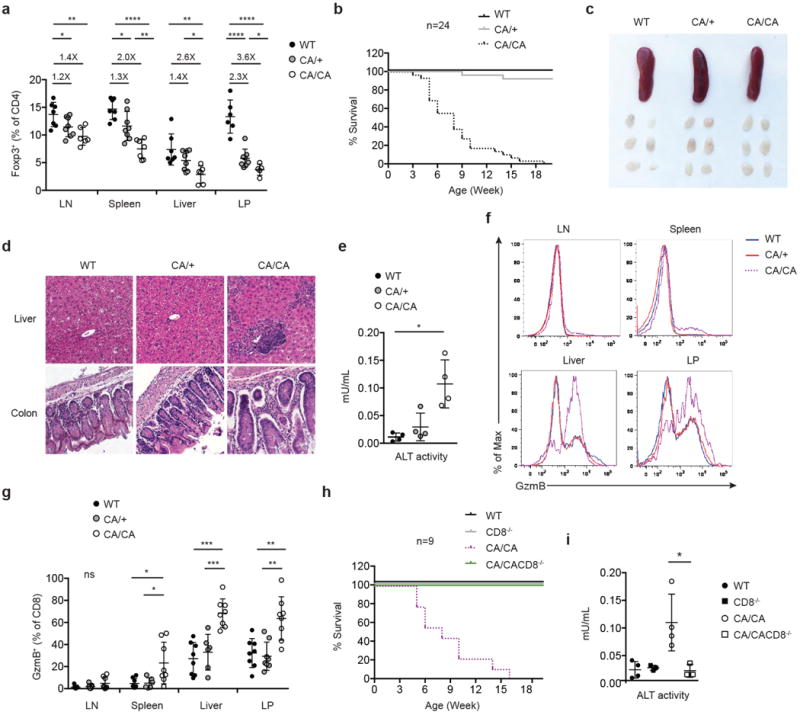
a, The frequencies of Treg cells among CD4+ T cells in lymph node (LN), spleen, liver and colon lamina propria (LP) of 4 to 6-week-old wild-type (WT), Foxp3CreFoxo1CA/+ (CA/+) or Foxp3CreFoxo1CA/Foxo1CA (CA/CA) mice (n=4-8). Numbers above plots indicate fold changes of the mean percentage in comparison to WT. b, Survival of WT, CA/+, CA/CA mice. c, A representative picture of spleens and peripheral (axillary, brachial, and inguinal) lymph nodes from 5-week-old WT, CA/+, CA/CA mice. d, Haematoxylin and eosin staining of liver and colon sections from 5-week-old WT, CA/+, CA/CA mice. e, Serum alanine aminotransferase (ALT) activity from 4 to 6-week-old WT, CA/+, CA/CA mice (n=4). f, Flow cytometric analysis of granzyme B (GzmB) expression in CD8+ cells from LN, spleen, liver and LP of 4 to 6-week-old WT, CA/+, CA/CA mice. g, The frequencies of GzmB+ among CD8+ cells from LN, spleen, liver and LP of 4 to 6-week-old WT, CA/+, CA/CA mice. h, Survival of WT, CD8-/- (CD8-/-), CA/CA and Foxp3CreFoxo1CA/Foxo1CACD8-/- (CA/CACD8-/-) mice. i, Serum alanine aminotransferase (ALT) activity from 4 to 6-week-old WT, CD8-/-, CA/CA, and CA/CA CD8-/- mice (n=4). Results represent at least three independent experiments. Unpaired t-test used (a, g, i). Error bars represent the mean ± SEM. ns=not significant, *, p<0.05, **, p<0.01, ***, p<0.001, ****, p<0.0001.
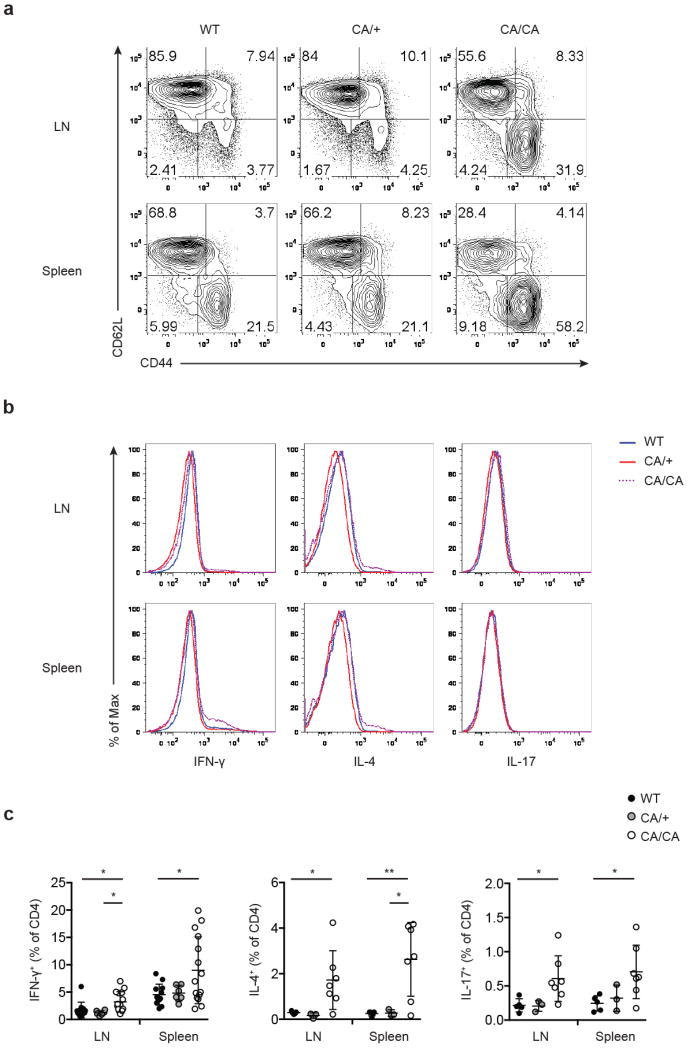
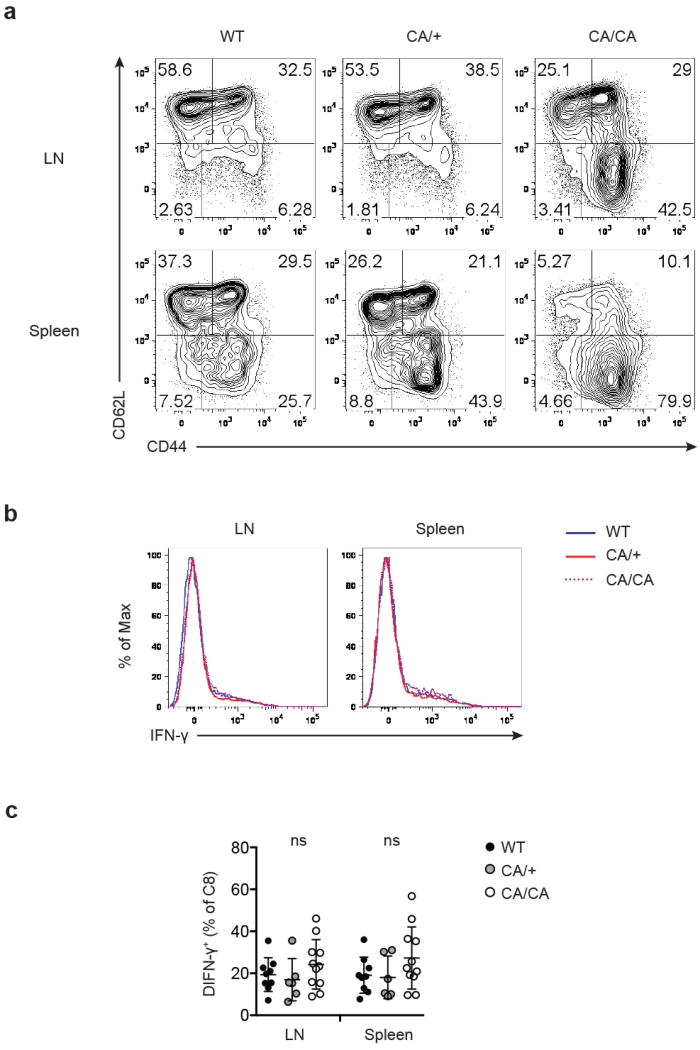
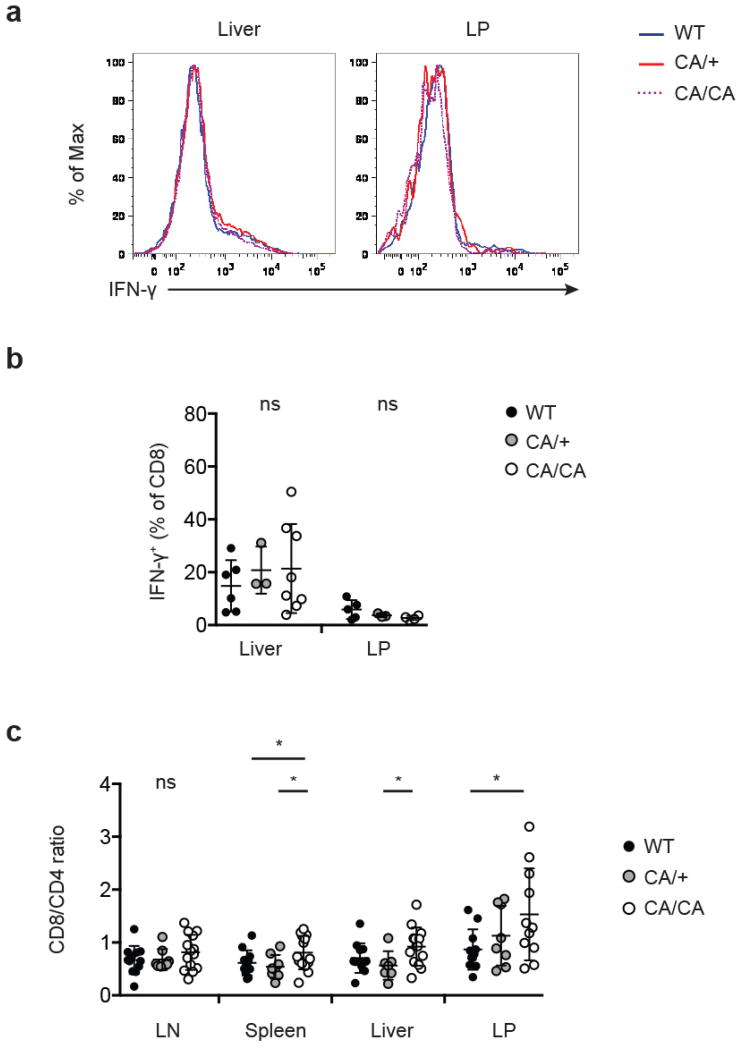
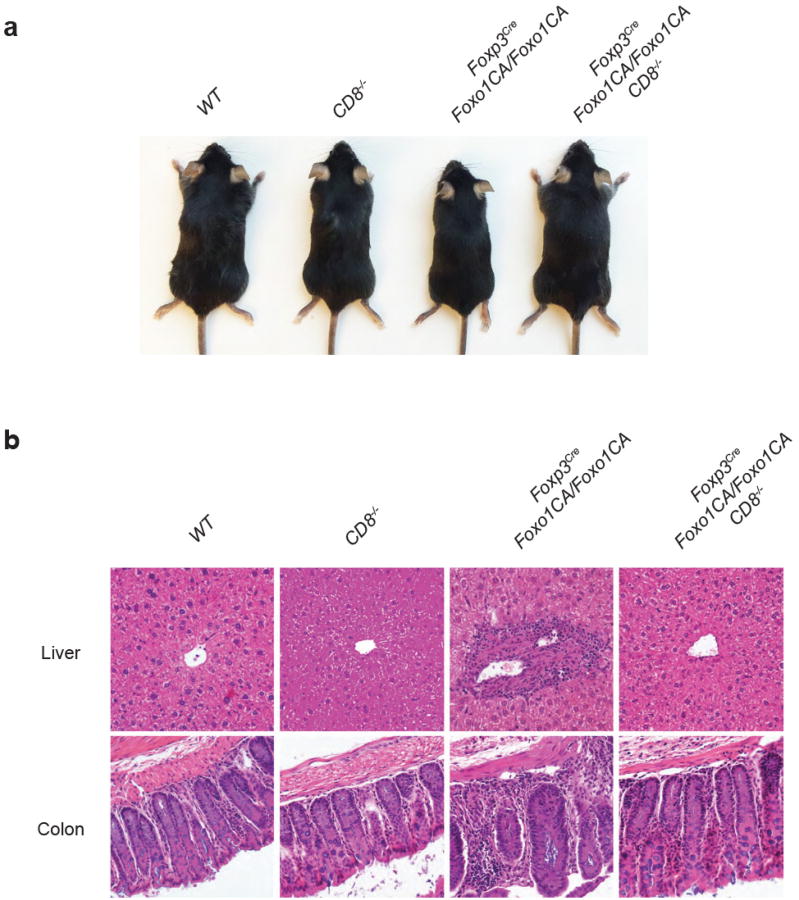
The autoimmune lethal phenotype in CA/CA mice was associated with activation of CD4+ and CD8+ T cells (Extended Data Fig. 9a and 10a), but they produced modestly higher or comparable amounts of inflammatory cytokines, compared to T cells from WT or CA/+ mice (Extended Data Fig. 9b, 9c, 10b, and 10c). Splenic CD8+ T cells, however, expressed substantially higher levels of the cytolytic molecule granzyme B (GzmB) (Fig. 3f and 3g). Enhanced expression of GzmB, but not the proinflammatory cytokine IFN-γ, was also observed in liver- and LP-infiltrating CD8+ T cells (Fig. 3f and 3g and Extended Data Fig. 11a and 11b). In addition, T cell populations were skewed towards CD8+ T cells in these tissues (Extended Data Fig. 11c), suggesting that augmented effector CD8+ T cell responses might trigger the immunopathology. To test this hypothesis, we crossed CA/CA mice to the CD8-deficient background. Depletion of CD8+ T cells completely rescued the wasting disease and lethal phenotype of CA/CA mice (Fig. 3h and Extended Data Fig. 12a). Serum ALT levels and tissue pathology were fully rectified as well (Fig. 3i and Extended Data Fig. 12b). Collectively, these findings demonstrate that aTreg cells have an essential function in suppressing CD8+ T cell-mediated tissue destruction.
Autoimmune pathology was observed in CA/CA but not CA/+ mice, in line with CA dose-dependent repression of aTreg cells (Fig. 3a and Extended Data Fig. 7). CA expression also led to varying degrees of Treg cell depletion in different tissues with the LP more affected than the liver (Fig. 3a). In fact, the magnitude of Treg cell depletion in lymphoid organs and non-lymphoid tissues was inversely correlated with Foxo1 activity, as revealed by expression of two direct Foxo1 target genes (Fig. 2b and 4a).
Figure 4. Tuned activation of Foxo1 in Treg cells results in enhanced anti-tumor immunity without inflicting autoimmunity.
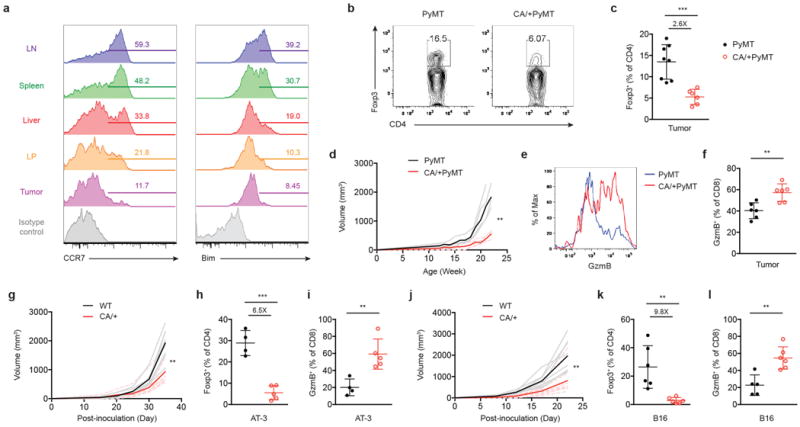
a, Flow cytometric analysis of Foxo1-activated target genes CCR7 and Bim in Treg cells from lymph node (LN), spleen, liver, colon lamina propria (LP), and tumor of 22 to 24-week-old PyMT mammary tumor-bearing mice. Numbers indicate percentage of CCR7- or Bim-positive cells shown in the gating. b, Foxp3 expression in tumor-infiltrating CD4+ T cells from 22 to 24-week-old PyMT or Foxp3CreFoxo1CA/+PyMT (CA/+PyMT) mice. c, The frequencies of Treg cells among CD4+ T cells in tumors of 22 to 24-week-old PyMT or CA/+PyMT mice (n=6-8). Number above plots indicates fold change of the mean percentage in comparison to PyMT. d, Tumor growth curve of PyMT and CA/+PyMT mice (n=4). e, Flow cytometric analysis of GzmB expression in CD8+ cells from tumors of PyMT and CA/+PyMT mice. f, The frequencies of GzmB-expressing CD8+ T cells from tumors of PyMT and CA/+PyMT mice (n=6). g-i, 8 to 10-week-old wild-type (WT) or Foxp3CreFoxo1CA/+ (CA/+) mice received orthotopic inoculation of PyMT-derived mammary tumor cells (AT-3). j-l, 8 to 10-week-old WT or CA/+ mice received subcutaneous injection of B16 melanoma cells. g, j, Tumor growth curve of WT and CA/+ mice (n=6-8). h, k, The frequencies of Treg cells among CD4+ T cells in tumors of WT and CA/+ mice (n=4-6). Numbers above plots indicate fold change of the mean percentage in comparison to WT. i, l, The frequencies of GzmB-expressing CD8+ T cells from tumors of WT and CA/+ mice (n=4-6). Results represent at least three independent experiments. Tumors of comparable sizes from different groups were used in each experiment. (c, f, h, i, k, l) unpaired t-test. Error bars represent the mean ± SEM. (d, g, j) two-way analysis of variance (ANOVA). **, p<0.01, ***, p<0.001.
High numbers of Treg cells are found in tumors6-8, which is associated with poor prognosis of cancer patients22. The role of Treg cells in tumor immunity has been investigated primarily with methods that deplete Treg cells in all tissues23,24. To determine the function of tumor-infiltrating Treg cells and whether their generation could be repressed by CA expression, we used the MMTV-PyMT (PyMT) spontaneous mammary tumor model25. Notably, compared to Treg cells from the liver and LP, Treg cells isolated from tumors expressed the lowest level of Foxo1 targets (Fig. 4a), suggesting that they might be most sensitive to Foxo1 gain-of-function. To test this hypothesis, we crossed CA/+ mice to the PyMT background. Indeed, tumor-infiltrating Treg cells were depleted by approximately 2.6-fold with CA expression from one allele (Fig. 4b and 4c), which resulted in profound inhibition of tumor growth (Fig. 4d). Although CD8+ T cells were phenotypically indistinguishable in healthy tissues from CA/+ and WT mice (Fig. 3f and 3g), tumor-infiltrating CD8+ T cells from CA/+PyMT mice expressed higher amounts of GzmB (Fig. 4e and 4f).
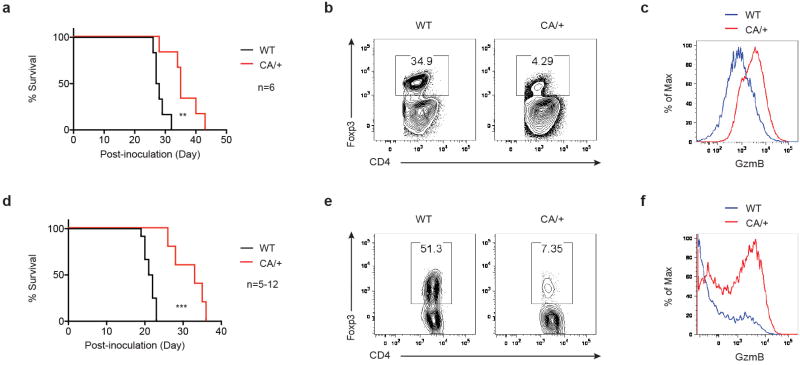
Tumor progression in PyMT mice is accompanied with loss of genome stability26, which induces time-dependent accumulation of gene mutations to foster oncogene-induced cell transformation. To determine whether CA expression in Treg cells could inhibit growth of already transformed cells, we used syngeneic AT-3 cells derived from PyMT mice. Orthotopic implantation of AT-3 to the mammary fat pad resulted in aggressive tumor growth and lethality in WT mice, both of which were attenuated in CA/+ mice (Fig. 4g and Extended Data Fig. 13a). CA expression led to a 6.5-fold reduction of tumor-infiltrating Treg cells (Fig. 4h and Extended Data Fig. 13b), which was associated with increased GzmB expression in tumor-infiltrating CD8+ T cells (Fig. 4i and Extended Data Fig. 13c). To investigate whether the CA effect was applicable to tumors of other tissue origin, we used B16 melanoma cells. Similar to AT-3, B16 growth was inhibited in CA/+ mice (Fig. 4j and Extended Data Fig. 13d), which was accompanied by an approximately 10-fold reduction of tumor-infiltrating Treg cells and increased GzmB-expressing CD8+ T cells (Fig. 4k and 4l and Extended Data Fig. 13e and 13f). These findings reveal that tumor-associated Treg cells are generally more susceptible to CA-triggered depletion.
rTreg and aTreg cell subsets are well defined in humans and mice9,10, but their individual contributions to immune tolerance have been enigmatic. Our data reveal that Foxo1 repression is a major transcriptional reprograming event associated with differentiation of aTreg cells, which supports their distinct migration pattern resembling that of effector memory T cells. Using a Foxo1 gain-of-function model that preferentially depletes aTreg cells, we could identify a prominent role for these cells in control of CD8+ T cell tolerance. Although CD4+ T cells are insufficient to induce immunopathology, aTreg cells might inhibit their helper function to suppress cytotoxic T cell responses. In addition, aTreg cells may inhibit CD8+ effector T cells by modulating antigen-presenting cells as shown in a tumor model27. Importantly, tumor-associated aTreg cells are more susceptible to Foxo1-triggered depletion, and effective tumor immunity can be induced without overt autoimmunity. aTreg cell differentiation is dependent on T cell receptor (TCR) signaling28,29 that inactivates Foxo1 via Akt. Drugs that target upstream TCR signaling molecules, as recently shown for PI3K30, may impinge on the Foxo1 pathway to selectively break Treg cell-mediated tumor immune tolerance.
Methods
Mice
The Foxo1CA (Foxo1AAA knock-in) and Foxo1tag-GFP (Foxo1tag) mouse models, as well as MMTV-PyMT on C57BL/6 background were previously described12,25. C57BL/6, CD45.1+ and CD8-/- mice were purchased from Jackson Laboratory. Mice with Treg-cell-specific expression of Foxo1CA were generated by crossing Foxo1AAA with Foxp3Cre mice31. Mice carrying the Foxo1AAA knock-in allele but no Foxp3Cre were used as controls. To mark Treg cells with red fluorescent protein (RFP) in the Foxo1tag-GFP experiment, Foxo1tag mice were bred with Foxp3-IRES-RFP mice32. In all experiments, littermate controls were used when possible. All mice were maintained under specific pathogen-free conditions, and animal experimentation was conducted in accordance with institutional guidelines.
Parabiosis
Parabiosis and separation were done as reported33 with 6 to 8-week-old cogenically-marked female C57BL/6 mice that were matched for body weight. Briefly, matching skin incisions were made from the elbow to the knee of each mouse. Forelimb and hindlimb connections were made with sutures and skin incisions were closed using woundclips. For separation, connections between parabionts were disrupted and skin incisions were closed using woundclips. Parabionts were maintained for 4 weeks before surgical separation. Separated parabiont mice were analyzed up to 18 weeks post-surgery.
Tumor models
8 to 10-week-old wild-type or Foxp3CreFoxo1CA/+ mice were injected with AT-3 mammary tumor34 (2×10⁵ cells into mammary fat pad), or B16.F10 melanoma (1.25×10⁵ cells subcutaneously). For PyMT and implanted tumor models, tumors were measured regularly with a caliper. Tumor volume was calculated using the equation (L×W2) × 0.52 where “L”=length and “W”=width. For PyMT, individual tumor volumes were added together to calculate total tumor burden. Tumor bearing mice were sacrificed at 22 to 24-week old for PyMT model, 30 to 35-day post-inoculation for AT-3 model and 20 to 24-day post-inoculation for B16 model.
Cell isolation
After whole-body perfusion with 50 ml of heparinized PBS, lymphocytes were isolated as follows. Single-cell suspensions were prepared from spleens and peripheral (axillary, brachial, and inguinal) lymph nodes by tissue disruption with glass slides. To isolate cells from the liver, tissues were finely minced and digested with 1 mg/ml Collagenase D (Worthington) for 30 min at 37 °C. For lamina propria lymphocytes isolation, colon was dissected and washed in HBSS. Intestinal pieces were stirred in 1 mM DTT in HBSS to release intraepithelial lymphocytes. The remaining intestinal tissues were finely minced and digested with RPMI plus 5% FBS and 1 mg/ml Collagenase D for 30 min at 37 °C. For tumor-infiltrating immune cell isolation, tumor tissues were prepared by mechanical disruption followed by 1 hour treatment with 280 U/ml Collagenase Type 3 (Worthington) and 4 μg/ml DNase I (Sigma) at 37 °C. After the digestion steps, cells isolated from the liver, lamina propria and tumor were filtered through 70-μM cell strainer, layered in a 44% and 66% Percoll gradient (Sigma), and centrifuged at 3000 rpm for 30 min without brake. Cells at the interface were collected and analyzed by flow cytometry.
Flow cytometry
Flurochrome-conjugated, biotinylated antibodies against CD45.1 (clone 104), CD45.2 (A20), TCR-β (H57-595), CD4 (RM4-5), CD8 (17A2), CD44 (IM7), CD62L (MEL-14), CD69 (H1.2F3), CCR7 (4B12), Foxp3 (FJK-16s), ICOS (C398.4A), IFN-γ (XMG1.2), IL-4 (11B11), NK1.1 (PK136) were purchased from eBiocience. Antibodies against CD49a (Ha31/8), IL-17a (TC11-18H10.1) were purchased from BD Biosciences. Anti-GzmB (GB11) was purchased from Invitrogen. Purified antibodies against Bim (C34C5), p-Akt (S473) (736E11), p-Akt (T308) (C31E5E), p-Foxo1(T24) were purchased from Cell Signaling. All antibodies were tested with their respective isotype controls. Cell surface staining was performed by incubating cells with specific antibodies for 30 min on ice in the presence of 2.4G2 mAb to block FcγR binding. CCR7 staining was incubated in 37 °C for 30 min prior to cell surface staining. Foxp3, Bim, GzmB, IFN-γ, IL-4, IL-17a staining was carried out using the intracellular transcription factor or cytokine staining kits from Tonbo or BD Biosciences. Phosphorylation staining was performed using BD phospho-protein kit. Secondary antibodies with flurochrome-conjugation were used for the staining of purified antibodies. To determine cytokine expression, isolated cells were stimulated with 50 ng/ml phorbol 12-myristate 13-acetate (Sigma), 1 mM ionomycin (Sigma) and GolgiStop (BD Biosciences) for 4 h prior to staining. Incorporation of EdU was measured using the Click-iT EdU flow cytometry assay kit according to the manufacturer's instructions (Invitrogen). Mice were injected i.p. with 50 μg/g body weight of EdU and sacrificed 18 hours later. All samples were acquired and analyzed with LSRII flow cytometer (Becton Dickson) and FlowJo software (TreeStar).
Gene-expression profiling
Splenic rTreg (CD4+Foxp3-YFP+CD62LhiCD44lo) and aTreg (CD4+Foxp3-YFP+CD62LloCD44hi) cells were isolated from Foxp3Cre mice by FACS sorting (BD FACS Aria). RNA was prepared with the miRNeasy Mini Kit according to the manufacturer's instructions (Qiagen). Complementary DNA (cDNA) libraries were amplified using the SMARTer RACE Amplification Kit (Clontech), and were sequenced in replicate using 50 bp paired-end. Ribosomal RNA reads were quantified and filtered using the short-read aligner, Bowtie v2.1.035. The remaining reads were aligned to the mouse genome (mm10) using the STAR v2.3.1 short-read aligner36. Additional quality control was performed using RSeQC v2.3.737. Gene abundance was quantified by featureCounts38 via the Subread analysis suite v1.4.339. Differential gene expression was estimated using the DESeq2 R package with gene annotations curated in GENCODE version 2 for mouse reference genome GRCm38 (Ensembl 74)40.
Histopathology
Liver and colon tissues were fixed in Safefix II (Protocol) and embedded in paraffin. 5-mm sections were stained with haematoxylin and eosin.
Serum ALT
Blood was collected right after mice were euthanized and was stored at room temperature for 1 hour. The samples were then centrifuged for 15 min at 3,000 rpm, and the supernatant was obtained as serum. Alanine aminotransferase (ALT) activity was determined according to manufacturer's instructions (Sigma-Aldrich), using SpectraMax M5 plate reader (Molecular Devices).
Statistical analysis
Unpaired student's t-test and ANOVA were used to calculate statistical significance for difference in a particular measurement between groups.
Extended Data
Extended Data Figure 1. Characterization of Treg cells from different organs.
Flow cytometric analysis of CD44 and CD62L in Treg cells from lymph node (LN), spleen, liver, and colon lamina propria (LP) of C57BL/6 mice. Results represent at least three independent experiments.
Extended Data Figure 2. Parabiotic connection and disconnection.
a, Graphical representation of the experiments. Congenically mismatched C57BL/6 mice were surgically connected (time point -4). Parabionts were analyzed 2 or 4 weeks post-surgery (time point -2 or 0). In separation experiments, parabiotic mice that had been connected for 4 weeks were surgically disconnected from each other (time point 0). Separated mice were analyzed 2, 6 or 18 weeks after surgery (time point 2, 6, 18). b, Representative flow cytometric plots showing chimerism of naïve CD4+ T cells or different Treg cell subsets in a CD45.2/2+ parabiont at various time points.
Extended Data Figure 3. Gene expression profiling of splenic rTreg and aTreg cells.
a, Gene expression comparison of Foxo1-regulated genes in splenic aTreg versus rTreg cells. Foxo1-regulated genes were defined by the following criteria: 1) differentially expressed between wild-type and Foxo1 knockout Treg cells; 2) the expression was corrected by expression of a constitutively active mutant of Foxo1 (Foxo1CA). b, Normalized expression of all transcripts isolated from splenic aTreg cells were plotted against transcripts from splenic rTreg cells. Some of the Foxo1 direct target genes were highlighted.
Extended Data Figure 4. CCR7 and ICOS expression in Treg cells.
Flow cytometric analysis of (a) CCR7, CD62L and (b) ICOS, CD62L expression in lymph node (LN) Treg cells from 9 to 12-day-old wild-type (WT), Foxp3CreFoxo1CA/+ (CA/+) or Foxp3CreFoxo1CA/Foxo1CA (CA/CA) mice. Results represent at least three independent experiments.
Extended Data Figure 5. Cell proliferation analysis of rTreg and aTreg cells.
EdU was administrated i.p. into 9 to 10-day-old wild-type (WT) or Foxp3CreFoxo1CA/Foxo1CA (CA/CA) mice. Mice were sacrificed and analyzed 18 hours after EdU injection. a, EdU incorporation in lymph node rTreg and aTreg cells from WT and CA/CA mice were measured by flow cytometry. b, Quantification of EdU incorporation (n=3). Unpaired t-test used. Error bars represent the mean ± SEM. ns=not significant, **, p<0.01.
Extended Data Figure 6. Foxo1 hyperactivation depletes aTreg cells.
a, The frequencies of lymph node (LN) rTreg or aTreg cells among CD4+ T cells of 9 to 12-day-old wild-type (WT), Foxp3CreFoxo1CA/+ (CA/+) or Foxp3CreFoxo1CA/Foxo1CA (CA/CA) mice (n=4-6). b, The frequencies of Treg cells among CD4+ T cells in LN and liver of 9 to 12-day-old WT, CA/+ or CA/CA mice (n=4-6). Numbers above plots indicate fold changes of the mean percentage in comparison to WT. Unpaired t-test. Error bars represent the mean ± SEM. ns=not significant, *, p<0.05, **, p<0.01, ****, p<0.0001.
Extended Data Figure 7. Foxo1 hyperactivation preferentially impairs aTreg cells.
The frequencies of lymph node (LN) and splenic rTreg or aTreg cells among CD4+ T cells of 4 to 6-week-old wild-type (WT), Foxp3CreFoxo1CA/+ (CA/+) or Foxp3CreFoxo1CA/Foxo1CA (CA/CA) mice (n=7-10). Unpaired t-test. Error bars represent the mean ± SEM. ns=not significant, *, p<0.05.
Extended Data Figure 8. Foxp3CreFoxo1CA/Foxo1CA mice develop a wasting disease.
a, A representative picture of 5-week-old wild-type (WT), Foxp3CreFoxo1CA/+ (CA/+) and Foxp3CreFoxo1CA/Foxo1CA (CA/CA) mice. b, Body weight of 4 to 6-week-old WT, CA/+, CA/CA mice (n=5). c, Total lymph node (LN) and spleen cell numbers from 4 to 6-week-old WT, CA/+, CA/CA mice (n=8-14). (b-c) Unpaired t-test. Error bars represent the mean ± SEM. ns=not significant, ***, p<0.001.
Extended Data Figure 9. Modest increase of inflammatory cytokine production by CD4+ T cells in Foxp3CreFoxo1CA/Foxo1CA mice.
a, Flow cytometric analysis of CD44 and CD62L expression in CD4+Foxp3- conventional T cells from lymph node (LN) and spleen of 4 to 6-week-old wild-type (WT), Foxp3CreFoxo1CA/+ (CA/+) or Foxp3CreFoxo1CA/Foxo1CA (CA/CA) mice. b-c, Representative histogram (b), and quantification (c) of cytokine (IFN-γ, IL-4, IL-17) expression by CD4+Foxp3- conventional T cells from LN and spleen of 4 to 6-week-old WT, CA/+, CA/CA mice. Results represent at least three independent experiments. (c) Unpaired t-test used (n=3-14). Error bars represent the mean ± SEM. *, p<0.05, **, p<0.01.
Extended Data Figure 10. CD8+ T cells in Foxp3CreFoxo1CA/Foxo1CA mice show comparable cytokine production as T cells from control mice.
a, Flow cytometric analysis of CD44 and CD62L expression in CD8+ T cells from lymph node (LN) and spleen of 4 to 6-week-old wild-type (WT), Foxp3CreFoxo1CA/+ (CA/+) or Foxp3CreFoxo1CA/Foxo1CA (CA/CA) mice. b-c, Representative histogram (b), and quantification (c) of IFN-γ expression by CD8+ T cells from LN and spleen of 4 to 6-week-old WT, CA/+, CA/CA mice. Results represent at least three independent experiments. (c) Unpaired t-test used (n=6-11). Error bars represent the mean ± SEM.
Extended Data Figure 11. Characterization of CD8+ T cells from non-lymphoid tissues.
a-b, Flow cytometric analysis (a), and quantification (b) of IFN-γ expression by CD8+ T cells from liver and colon lamina propria (LP) of 4 to 6-week-old wild-type (WT), Foxp3CreFoxo1CA/+ (CA/+) or Foxp3CreFoxo1CA/Foxo1CA (CA/CA) mice (n=3-8). c, CD8+ to CD4+ T cell ratio among lymph node (LN), spleen, liver, and LP T cells of 4 to 6-week-old WT, CA/+, CA/CA mice (n=6-13). Results represent at least three independent experiments. (b-c) Unpaired t-test used. Error bars represent the mean ± SEM. *, p<0.05.
Extended Data Figure 12. CD8+ T cell depletion rescues the lethal disease in Foxp3CreFoxo1CA/Foxo1CA mice.
a, A representative picture of 5-week-old wild-type (WT), CD8-/-, Foxp3CreFoxo1CA/Foxo1CA, and Foxp3CreFoxo1CA/Foxo1CACD8-/- mice. b, Haematoxylin and eosin staining of liver and colon sections from 5-week-old WT, CD8-/-, Foxp3CreFoxo1CA/Foxo1CA, and Foxp3CreFoxo1CA/Foxo1CACD8-/- mice.
Extended Data Figure 13. Foxp3CreFoxo1CA/+ mice show enhanced anti-tumor immune responses.
a-c, 8 to 10-week-old wild-type (WT) or Foxp3CreFoxo1CA/+ (CA/+) mice received orthotopic inoculation of PyMT-derived mammary tumor cells (AT-3). d-f, 8 to 10-week-old WT or CA/+ mice received subcutaneous injection of B16 melanoma cells. a, d, Survival of WT and CA/+ mice received tumor implantation (n=5-12). b, e, Foxp3 expression in tumor-infiltrating CD4+ T cells from Day 30-35 AT-3 tumor or Day 20-24 B16 tumor. c, f, Flow cytometric analysis of GzmB expression in CD8+ T cells from WT or CA/+ tumor-bearing mice. Results represent at least three independent experiments.
Supplementary Material
Acknowledgments
We thank A. Rudensky for the Foxp3Cre mouse strain and S. Abrams for the AT-3 cell line. We also thank A. Rudensky and the M. Li lab for their insightful discussions. This work was supported by National Institutes of Health (RO1 AI102888-01A1 to M.O.L.) and Ludwig Center for Cancer Immunology (M.O.L.).
Footnotes
Author Contributions: C.T.L., W.L. and M.O.L. designed the research and analyzed the data; C.T.L., W.L., S.D., and A.T. did the experiments; C.T.L., W.L. and M.O.L. wrote the manuscript.
Competing financial interests: The authors declare no competing financial interests.
References
- 1.Sakaguchi S, Yamaguchi T, Nomura T, Ono M. Regulatory T Cells and Immune Tolerance. Cell. 2008;133:775–787. doi: 10.1016/j.cell.2008.05.009. [DOI] [PubMed] [Google Scholar]
- 2.Shevach EM. Biological functions of regulatory T cells. Advances in immunology. 2011;112:137–176. doi: 10.1016/B978-0-12-387827-4.00004-8. [DOI] [PubMed] [Google Scholar]
- 3.Josefowicz SZ, Lu LF, Rudensky AY. Regulatory T cells: mechanisms of differentiation and function. Annual review of immunology. 2012;30:531–564. doi: 10.1146/annurev.immunol.25.022106.141623. [DOI] [PMC free article] [PubMed] [Google Scholar]
- 4.Benoist C, Mathis D. Treg cells, life history, and diversity. Cold Spring Harbor perspectives in biology. 2012;4:a007021. doi: 10.1101/cshperspect.a007021. [DOI] [PMC free article] [PubMed] [Google Scholar]
- 5.Bluestone JA, Bour-Jordan H, Cheng M, Anderson M. T cells in the control of organ-specific autoimmunity. The Journal of clinical investigation. 2015;125:2250–2260. doi: 10.1172/JCI78089. [DOI] [PMC free article] [PubMed] [Google Scholar]
- 6.Zou W. Regulatory T cells, tumour immunity and immunotherapy. Nature reviews Immunology. 2006;6:295–307. doi: 10.1038/nri1806. [DOI] [PubMed] [Google Scholar]
- 7.Nishikawa H, Sakaguchi S. Regulatory T cells in tumor immunity. International journal of cancer Journal international du cancer. 2010;127:759–767. doi: 10.1002/ijc.25429. [DOI] [PubMed] [Google Scholar]
- 8.Quezada SA, Peggs KS, Simpson TR, Allison JP. Shifting the equilibrium in cancer immunoediting: from tumor tolerance to eradication. Immunological reviews. 2011;241:104–118. doi: 10.1111/j.1600-065X.2011.01007.x. [DOI] [PMC free article] [PubMed] [Google Scholar]
- 9.Huehn J, et al. Developmental stage, phenotype, and migration distinguish naive- and effector/memory-like CD4+ regulatory T cells. The Journal of experimental medicine. 2004;199:303–313. doi: 10.1084/jem.20031562. [DOI] [PMC free article] [PubMed] [Google Scholar]
- 10.Miyara M, et al. Functional delineation and differentiation dynamics of human CD4+ T cells expressing the FoxP3 transcription factor. Immunity. 2009;30:899–911. doi: 10.1016/j.immuni.2009.03.019. [DOI] [PubMed] [Google Scholar]
- 11.Sugiyama D, et al. Anti-CCR4 mAb selectively depletes effector-type FoxP3+CD4+ regulatory T cells, evoking antitumor immune responses in humans. Proceedings of the National Academy of Sciences of the United States of America. 2013;110:17945–17950. doi: 10.1073/pnas.1316796110. [DOI] [PMC free article] [PubMed] [Google Scholar]
- 12.Ouyang W, et al. Novel Foxo1-dependent transcriptional programs control Treg cell function. Nature. 2012;491:554–559. doi: 10.1038/nature11581. [DOI] [PMC free article] [PubMed] [Google Scholar]
- 13.Kerdiles YM, et al. Foxo transcription factors control regulatory T cell development and function. Immunity. 2010;33:890–904. doi: 10.1016/j.immuni.2010.12.002. [DOI] [PMC free article] [PubMed] [Google Scholar]
- 14.Smigiel KS, et al. CCR7 provides localized access to IL-2 and defines homeostatically distinct regulatory T cell subsets. The Journal of experimental medicine. 2014;211:121–136. doi: 10.1084/jem.20131142. [DOI] [PMC free article] [PubMed] [Google Scholar]
- 15.Mueller SN, Gebhardt T, Carbone FR, Heath WR. Memory T cell subsets, migration patterns, and tissue residence. Annual review of immunology. 2013;31:137–161. doi: 10.1146/annurev-immunol-032712-095954. [DOI] [PubMed] [Google Scholar]
- 16.Hedrick SM, Hess Michelini R, Doedens AL, Goldrath AW, Stone EL. FOXO transcription factors throughout T cell biology. Nature reviews Immunology. 2012;12:649–661. doi: 10.1038/nri3278. [DOI] [PMC free article] [PubMed] [Google Scholar]
- 17.Ouyang W, Li MO. Foxo: in command of T lymphocyte homeostasis and tolerance. Trends in immunology. 2011;32:26–33. doi: 10.1016/j.it.2010.10.005. [DOI] [PMC free article] [PubMed] [Google Scholar]
- 18.Luo CT, Li MO. Transcriptional control of regulatory T cell development and function. Trends in immunology. 2013;34:531–539. doi: 10.1016/j.it.2013.08.003. [DOI] [PMC free article] [PubMed] [Google Scholar]
- 19.Fabre S, et al. FOXO1 regulates L-Selectin and a network of human T cell homing molecules downstream of phosphatidylinositol 3-kinase. Journal of immunology. 2008;181:2980–2989. doi: 10.4049/jimmunol.181.5.2980. [DOI] [PubMed] [Google Scholar]
- 20.Kerdiles YM, et al. Foxo1 links homing and survival of naive T cells by regulating L-selectin, CCR7 and interleukin 7 receptor. Nature immunology. 2009;10:176–184. doi: 10.1038/ni.1689. [DOI] [PMC free article] [PubMed] [Google Scholar]
- 21.Ouyang W, Beckett O, Flavell RA, Li MO. An essential role of the Forkhead-box transcription factor Foxo1 in control of T cell homeostasis and tolerance. Immunity. 2009;30:358–371. doi: 10.1016/j.immuni.2009.02.003. [DOI] [PMC free article] [PubMed] [Google Scholar]
- 22.Curiel TJ, et al. Specific recruitment of regulatory T cells in ovarian carcinoma fosters immune privilege and predicts reduced survival. Nature medicine. 2004;10:942–949. doi: 10.1038/nm1093. [DOI] [PubMed] [Google Scholar]
- 23.Shimizu J, Yamazaki S, Sakaguchi S. Induction of tumor immunity by removing CD25+CD4+ T cells: a common basis between tumor immunity and autoimmunity. Journal of immunology. 1999;163:5211–5218. [PubMed] [Google Scholar]
- 24.Bos PD, Plitas G, Rudra D, Lee SY, Rudensky AY. Transient regulatory T cell ablation deters oncogene-driven breast cancer and enhances radiotherapy. The Journal of experimental medicine. 2013;210:2435–2466. doi: 10.1084/jem.20130762. [DOI] [PMC free article] [PubMed] [Google Scholar]
- 25.Franklin RA, et al. The cellular and molecular origin of tumor-associated macrophages. Science. 2014;344:921–925. doi: 10.1126/science.1252510. [DOI] [PMC free article] [PubMed] [Google Scholar]
- 26.Stringer JR, et al. Modeling variation in tumors in vivo. Proceedings of the National Academy of Sciences of the United States of America. 2005;102:2408–2413. doi: 10.1073/pnas.0401340102. [DOI] [PMC free article] [PubMed] [Google Scholar]
- 27.Bauer CA, et al. Dynamic Treg interactions with intratumoral APCs promote local CTL dysfunction. The Journal of clinical investigation. 2014;124:2425–2440. doi: 10.1172/JCI66375. [DOI] [PMC free article] [PubMed] [Google Scholar]
- 28.Levine AG, Arvey A, Jin W, Rudensky AY. Continuous requirement for the TCR in regulatory T cell function. Nature immunology. 2014;15:1070–1078. doi: 10.1038/ni.3004. [DOI] [PMC free article] [PubMed] [Google Scholar]
- 29.Vahl JC, et al. Continuous T cell receptor signals maintain a functional regulatory T cell pool. Immunity. 2014;41:722–736. doi: 10.1016/j.immuni.2014.10.012. [DOI] [PubMed] [Google Scholar]
- 30.Ali K, et al. Inactivation of PI(3)K p110delta breaks regulatory T-cell-mediated immune tolerance to cancer. Nature. 2014;510:407–411. doi: 10.1038/nature13444. [DOI] [PMC free article] [PubMed] [Google Scholar]
- 31.Rubtsov YP, et al. Regulatory T cell-derived interleukin-10 limits inflammation at environmental interfaces. Immunity. 2008;28:546–558. doi: 10.1016/j.immuni.2008.02.017. [DOI] [PubMed] [Google Scholar]
- 32.Wan YY, Chi H, Xie M, Schneider MD, Flavell RA. The kinase TAK1 integrates antigen and cytokine receptor signaling for T cell development, survival and function. Nature immunology. 2006;7:851–858. doi: 10.1038/ni1355. [DOI] [PubMed] [Google Scholar]
- 33.Wright DE, Wagers AJ, Gulati AP, Johnson FL, Weissman IL. Physiological migration of hematopoietic stem and progenitor cells. Science. 2001;294:1933–1936. doi: 10.1126/science.1064081. [DOI] [PubMed] [Google Scholar]
- 34.Stewart TJ, Abrams SI. Altered immune function during long-term host-tumor interactions can be modulated to retard autochthonous neoplastic growth. Journal of immunology. 2007;179:2851–2859. doi: 10.4049/jimmunol.179.5.2851. [DOI] [PubMed] [Google Scholar]
- 35.Langmead B, Trapnell C, Pop M, Salzberg SL. Ultrafast and memory-efficient alignment of short DNA sequences to the human genome. Genome biology. 2009;10:R25. doi: 10.1186/gb-2009-10-3-r25. [DOI] [PMC free article] [PubMed] [Google Scholar]
- 36.Dobin A, et al. STAR: ultrafast universal RNA-seq aligner. Bioinformatics. 2013;29:15–21. doi: 10.1093/bioinformatics/bts635. [DOI] [PMC free article] [PubMed] [Google Scholar]
- 37.Wang L, Wang S, Li W. RSeQC: quality control of RNA-seq experiments. Bioinformatics. 2012;28:2184–2185. doi: 10.1093/bioinformatics/bts356. [DOI] [PubMed] [Google Scholar]
- 38.Liao Y, Smyth GK, Shi W. featureCounts: an efficient general purpose program for assigning sequence reads to genomic features. Bioinformatics. 2014;30:923–930. doi: 10.1093/bioinformatics/btt656. [DOI] [PubMed] [Google Scholar]
- 39.Liao Y, Smyth GK, Shi W. The Subread aligner: fast, accurate and scalable read mapping by seed-and-vote. Nucleic acids research. 2013;41:e108. doi: 10.1093/nar/gkt214. [DOI] [PMC free article] [PubMed] [Google Scholar]
- 40.Harrow J, et al. GENCODE: producing a reference annotation for ENCODE. Genome biology. 2006;7 Suppl 1:1–9. doi: 10.1186/gb-2006-7-s1-s4. S4. [DOI] [PMC free article] [PubMed] [Google Scholar]
Associated Data
This section collects any data citations, data availability statements, or supplementary materials included in this article.


