Abstract
The melting point (MP), an easily accessible physical parameter, has considerable potential for the judgment of drug‐like properties. However, to the best of our knowledge, there are no useful guidelines for understanding the relationship between the MP and drug‐like properties. To this end, we have constructed the largest MP database (experimental value) of globally approved drugs (3164 organic small‐molecule drugs) and discontinued drugs (417 organic small‐molecule drugs) and subsequently extracted six subdatabases from the whole approved database and two subdatabases from the discontinued database. The MP distribution statistics and analysis of approved drugs reveal five noteworthy observations; moreover, the MP distribution statistics and analysis of discontinued drugs further supplement these criteria. In addition, the comparison of molecular weight (MW) versus MP and Clog P versus MP distributions of different classes of approved drugs indicated that the MWs and Clog P values of most drugs in the optimal MP range were not more than 500 and 5, respectively, implying the MP distribution criterion was in accordance with Lipinski's rule of five.
Keywords: approved drugs, discontinued drugs, drug design and discovery, drug-like properties, Lipinski′s rule of five, melting point distribution
Introduction
Whether an organic molecule can eventually be developed into an approved drug is determined by many factors, such as pharmacological activities in vitro, nonclinical toxicology, clinical safety, pharmacokinetics or bioavailability, efficacy, and rationalization of the company portfolio.1, 2 The traditional drug development process often starts with the evaluation of pharmacological activities (molecular, cellular, and animal‐level studies, sequentially) of organic molecules to obtain potent compounds. Then, the other properties of these compounds are evaluated, which often leads to a high failure rate and a major economic loss. Therefore, from the beginning, designing organic compounds with good properties is vital to decrease the attrition rate in drug discovery. In parallel, the research on more clearly understanding what makes an organic compound drug‐like has attracted significant attention.
There has been an increased focus on the drug‐like properties of organic compounds for drug development since the “rule of five” was introduced by Lipinski et al. in 1997.3 These studies are usually focused on the physicochemical properties of organic compounds, such as the molecular weight (MW), lipophilicity (logarithm of octanol–water distribution coefficient, log P), water solubility, numbers of hydrogen‐bond donors and acceptors (HBD and HBA), rotatable bonds (ROT), number of rings, polar surface area (PSA), and acid/base properties.4, 5, 6, 7, 8, 9
Through the analysis of 2245 drugs after entry to Phase II clinical trials, Lipinski and co‐workers found that poor drug absorption and permeation are more likely to occur if the MW is more than 500, calculated log P (Clog P) is more than 5 (or Moriguchi log P (Mlog P) more than 4.15), hydrogen‐bond acceptors (expressed as the sum of all O and N atoms) are more than 10, and hydrogen‐bond donors (expressed as the sum of all OH and NH groups) are more than 5.3 Compared with design principles that require sophisticated in silico applications and/or esoteric molecular descriptors, Lipinski's rule is easy and fast to remember, has no cost to use, and can be consciously considered by medicinal chemists during the drug design process. Therefore, it is widely used in the discovery and development process of lead compounds and has served as the basis for many subsequent studies aimed at characterizing the drug‐like properties of candidate drugs with the hope of improving the overall success rate in the drug discovery and development pathway.10, 11
Veber and co‐workers studied the physicochemical properties that influence oral bioavailability in rats through over 1100 drug candidates at GlaxoSmithKline and discovered that the number of ROT (molecular flexibility) and hydrogen bonds, and PSA are three important determinants of oral bioavailability. The Veber rules are described as follows: compounds which meet only the two criteria of 1) not more than 10 ROTs and 2) PSA equal to or less than 140 Å2 (or 12 or fewer total hydrogen‐bond acceptors plus donors) will have a high probability of good oral bioavailability in rats.4
Other scientists have also investigated the physicochemical properties of central nervous system (CNS) drugs. The studies indicate that the values of the main parameters of the physicochemical properties for CNS drugs in general are in a smaller range compared with non‐CNS therapeutics. For example, the PSA for most CNS drugs that penetrate the brain is below 70 Å2, whereas non‐CNS drugs display much larger values up to 120 Å2.[12, 13]
These aforementioned studies all concern oral drugs, aiming at improving the oral bioavailability. In recent years, there has also been considerable focus on physicochemical analysis of drugs administered via other routes,14, 15, 16 such as ophthalmic, inhalation and transdermal, or targeting a different proteomic family, such as cytochrome P450 receptors (CYP450), G‐protein‐coupled receptors (GPCR), ion channels, kinases, phosphodiesterases (PDE), or transporters.17, 18 Otherwise, a bunch of more useful composite parameters such as ligand efficiency (LE),19 lipophilic ligand efficiency (LLE),20 ligand lipophilicity index (LLEAT),21 ligand efficiency dependent lipophilicity (LELP), size‐independent ligand efficiency (SILE), and binding efficiency index (BEI)22 are used in molecular optimizations.23
The melting point (MP), a fundamental physical property that specifies the transition temperature between solid and liquid phases, is widely applied in pharmaceutical science, organic chemistry, and biological chemistry.24, 25 For example, it is used for compound characterization as well as purity evaluation in organic chemistry and also as a descriptor for the prediction of solubility,26 a key determinant of the bioavailability and in vivo activity of a candidate drug. According to the publications by Yalkowsky et al., the solubility can be estimated by the General Solubility Equation (GSE).26
In spite of the large amount of available MP data, to the best of our knowledge, there are no useful guidelines for understanding the relationships between the MP and drug‐like properties of an organic compound, especially for approved drugs. Therefore, in this study, we concisely analyze the MP distributions of the globally approved drugs (limited to small organic molecules) and hope to summarize some simple, exclusive MP rules for specific drugs as the criteria of good drug‐like properties, which might be applicable in a prospective manner for novel active compound development and could improve the chance of success in the drug design and discovery process.
Database Construction
Database of approved drugs: source and data processing (globally approved drugs before 2007)
The 9990 approved drugs in our database were from the collection published in Nature in 2007.27 Excluding antiseptics, pharmaceutical aids, therapeutic plants or animal extracts, vaccines, insecticides, surfactants, and oligodeoxyribonucleotides, there were 8649 drug entities. In addition, combination drugs were recorded as two or more single components, and salts were recorded as free acids or bases. Removing the combination drugs (80), adding their single components (160), and subtracting the duplicated components (227), the total number of drugs was 8502. The experimental MPs of these 8502 drugs were found by searching the SciFinder database (CAS, A Division of the American Chemical Society, available at www.cas.org/products/scifinder). First, the MP was identified as the average of the highest and lowest values. If the melting range (the difference of the highest and lowest values) was greater than 20, it was identified as the median (when the middle MP or the average of the two middle MPs of a series of MPs reported on SciFinder was a value) or the average of the median range (when the middle MP or the average of the two middle MPs of a series of MPs reported on scifinder was a range). If the difference of the median range was still greater than 20, the SciFinder default value or the average of the default range, which usually was provided by the reagent company, was chosen. Finally, there were a total of 3563 approved drugs whose MPs could be obtained from the SciFinder database.
Because the purpose of this study is to analyze the MP distributions criteria of small organic molecular therapeutic drugs, the following drugs were further excluded: diagnostic aides (62), nutrients (47), vitamins (47), complexes (9), inorganics (12), metals (7), drugs with high molecular weights (greater than 1000, 18), or whose structures were not found in SciFinder (21). Thus, 3340 small organic molecular drugs were left. Subtracting drugs whose MPs were less than 25 °C (62), more than 500 °C (2), or uncertain (containing < or >) (112), the final number of our whole approved drug database for the MP distributions analysis was 3164. The data processing is schematically represented in Figure 1.
Figure 1.
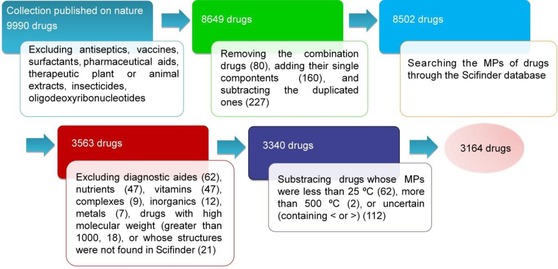
Schematic representation of the approved‐drug database source and data process.
We also collected the MWs, Clog Ps, and HBAs of 3164 approved drugs with MPs through the SciFinder database, with the purpose of finding the correlations of MP to MW and MP to log P, and the significance of mean MPs, MWs, Clog Ps, and HBAs between two different databases. The MPs (3164), MWs (3164), Clog Ps (3027), HBAs (3029), common names, indications, and CAS numbers of approved drugs are also listed in the Supporting Information.
Database of discontinued drugs: source and data processing (discontinued in the past two decades)
To fully explore the distribution criteria of MPs and their relevance to drug‐like properties, the MP distributions of discontinued drugs in the past two decades were also analyzed. First of all, the discontinued‐drug database was constructed, and the source and data processing was as follows.
The discontinued drugs in the past two decades (from January 1st, 1994 to August 28th, 2014) were drugs marked as discontinued in Thomson Reuters Cortellis database (https://cortellis.thomsonreuterslifesciences.com) and the original total number was 7533.
First, we proceeded an initial screening for the 7533 drugs according to the following principles: as the same with approved drugs, salts were recorded as free acids or bases and biopharmaceuticals were deleted; combination drugs, which were recorded as two or more single components in the approved‐drug database, were also deleted, because the discontinued combination drugs might attribute to the mismatch of two or more single components.
Then, experimental MPs of these discontinued drugs were searched through the SciFinder database and the selection criteria were the same as approved drugs. Finally, there were a total of 419 different discontinued drugs for which MPs could be obtained from the SciFinder database.
Subtracting drugs whose MPs were less than 25 °C (2), the final number of our discontinued‐drug database for MP distributions analysis was 417. It is true that the discontinued drugs should be many more than the marketed ones, but the MPs of discontinued drugs displayed in SciFinder database were much less than the marketed ones. The MPs, drugs names, indications, and CAS numbers of all 417 discontinued drugs are listed in the Supporting Information. The data processing is schematically represented in Figure 2.
Figure 2.
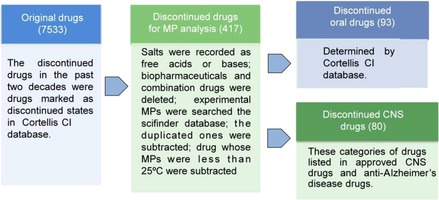
Schematic representation of the discontinued‐drug database source, data process and classification.
The approved‐drug database classification
To carefully explore the MP difference between various drug indications or routes of administration, we further divided our approved‐drug database into six subdatabases: 1) oral drugs, 2) CNS drugs, 3) non‐CNS drugs, 4) anticancer drugs, 5) anti‐infective drugs, and 6) cardiovascular drugs (Figure 3).
Figure 3.

Schematic representation of the approved‐drug database classification.
Oral drugs: Whether the drugs were administered orally was determined by the Thomson Reuters Integrity (https://integrity.thomson‐pharma.com) and Thomson Reuters Cortellis databases (https://cortellis.thomsonreuterslifesciences.com). Drugs displayed as oral in the two databases were marked as oral drugs in our database, but the administration routes of other drugs which were not displayed as oral in the two databases were uncertain. There were 683 oral drugs in our final approved‐drug database.
CNS and non‐CNS drugs: CNS drugs include anticonvulsants, antidepressants, antipsychotics, anxiolytics, anti‐Parkinson's disease drugs, antiseizure drugs, sedatives, nootropics, and antimigraine drugs. Others except anesthetics, analgesics, and unclassified drugs were identified as non‐CNS drugs. There were 511 CNS drugs and 2364 non‐CNS drugs, respectively, in our final approved‐drug database.
Anticancer drugs: Drugs were indicated as antineoplastics. There were 211 anticancer drugs in our final approved‐drug database.
Anti‐infective drugs: Anti‐infective drugs included antibiotics, antibacterials, antifungals, and antivirals. There were 428 anti‐infective drugs in our final approved‐drug database.
Cardiovascular drugs: Antianginals, antiarrhythmics, antihyperlipidemics, antihypertensives, antihypotensives, antithrombotics, cardiotonics, and vasodilators belonged to cardiovascular drugs. There were 400 cardiovascular drugs in our final approved‐drug database.
The discontinued‐drug database classification
Discontinued oral drugs: Whether the drugs are administered orally was determined by the Thomson Reuters Cortellis database. There were 93 oral drugs in our final discontinued‐drug database (Figure 2).
Discontinued CNS oral drugs: Other than the categories of drugs listed under approved CNS drugs, discontinued CNS drugs also included anti‐Alzheimer′s disease's drugs, CNS modulators, and other drugs for CNS diseases. There were 80 CNS drugs in our final discontinued‐drug database (Figure 2).
Results and Discussion
MP analysis of the approved‐drug database
MP analysis of the entire approved‐drug database
First, we analyzed the MP profiles of the drugs in our approved‐drug database by calculating the frequency of drugs in different MP ranges, which were subdivided gradually into 20 °C or 50 °C intervals starting from 25 °C, and the results are shown in Figure 4. As indicated in column diagram 4 A (the yellow columns), the MPs of almost eighty percent of whole drugs (78.9 %) were in the range of 80–240 °C. Pie chart 4 B shows that the MPs of more than half of the drugs (55.9 %) were in the range of 100–200 °C, and more than ninety percent of drugs (91.2 %) were under 250 °C. These statistical results indicate that candidate drugs with high MPs (MP>250 °C) might possess poor drug‐like properties and be unlikely to be developed into approved drugs.
Figure 4.
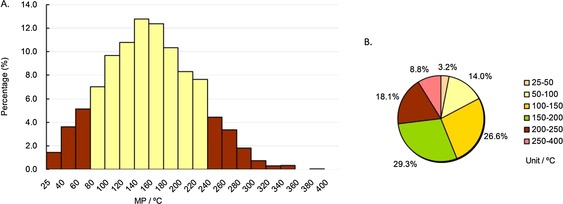
MP distributions of all drugs in our approved‐drug database. Column diagram (A), pie chart (B). Temperature ranges include the higher value but not the lower value, except for 25–40 °C and 25–50 °C, which include both (e.g., 40–60 °C contains 60 °C, but not 40 °C).
The mean, median, and minimum and maximum MPs of different percentiles (0–100th, 5–95th, 10–90th, 15–85th, 20–80th, and 25–75th) were also calculated, and the results are shown in Table 1.
Table 1.
The number, mean, median, and different middle percentile ranges of drugs in our approved and discontinued‐drug database.
| No. of | Mean MP | Mean MP | Minimum and maximum MPs [°C] (within given percentiles)[a] | |||||||
|---|---|---|---|---|---|---|---|---|---|---|
| Drug class | State | drugs | [°C] | [°C] | 0–100th | 5th–95th | 10th–90th | 15th–85th | 20th–80th | 25th–75th |
| All | approved | 3164 | 162 | 160 | 25–386 | 60–268 | 80–244 | 95–231 | 108–217 | 117–205 |
| discontinued | 417 | 171 | 169 | 25–371 | 70–265 | 96–251 | 110–238 | 119–226 | 129–214 | |
| Oral | approved | 683 | 168 | 166 | 25–350 | 74–265 | 94–244 | 108–232 | 115–219 | 126–209 |
| discontinued | 93 | 173 | 173 | 56–290 | 86–249 | 102–245 | 114–237 | 126–218 | 133–210 | |
| CNS | approved | 511 | 145 | 143 | 25–316 | 53–239 | 71–218 | 83–204 | 96–191 | 105–181 |
| discontinued | 80 | 173 | 168 | 50–310 | 102–282 | 116–239 | 120–226 | 127–214 | 131–210 | |
| Non‐CNS | approved | 2346 | 168 | 165 | 25–386 | 66–268 | 85–249 | 100–234 | 112–222 | 122–212 |
| Anticancer | approved | 211 | 179 | 181 | 32–354 | 69–283 | 96–261 | 108–234 | 118–229 | 136–219 |
| Anti‐infective | approved | 428 | 182 | 181 | 37–350 | 87–280 | 104–260 | 121–245 | 131–232 | 146–220 |
| Cardiovascular | approved | 400 | 154 | 152 | 25–345 | 54–263 | 71–243 | 85–223 | 100–212 | 110–196 |
[a] From the smallest to largest MPs of all drugs, min. and max. MPs (5–95th percentiles) represent the largest MP in the top 5 % low MPs (min.), and the smallest MP in the bottom 5 % high MPs (max.), respectively. The rest (10th–90th, 15th–85th, 20th–80th, and 25th–75th percentiles) could be deduced by analogy.
MP analysis of oral drugs
Among many different routes of administration, the oral route is generally the preferred choice because it is the easiest route and most likely to have high patient compliance. We further analyzed the MP profiles of the 683 oral drugs in our approved‐drug database.
We adopted the same method used for the whole database to analyze the MP profiles of these 683 oral drugs, and the results are shown in Figure 5. As indicated in Figure 5 A (the yellow columns), the MPs of almost eighty percent of the oral drugs (76.6 %) were in the range of 100–240 °C, and the highest peak ranges of oral drugs’ MPs was 140–160 °C (>14 %). Pie chart 5 B shows that the MPs of nearly sixty percent of the oral drugs (58.4 %) were in the range of 100–200 °C, and almost ninety percent of oral drugs (89.2 %) were in the range of 50–250 °C. Compared with the MP distributions of the whole drugs, most oral drugs had slightly higher MPs (nearly eighty percent: 100–240 °C vs. 80–240 °C). In addition, unsurprisingly, the MPs of most oral drugs (91.1 %) were lower than 250 °C.
Figure 5.
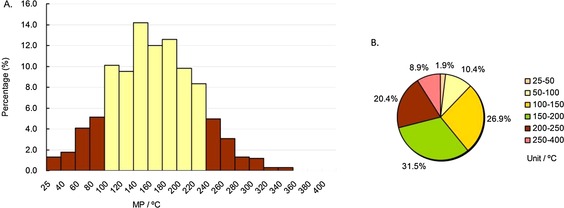
MP distributions of approved oral drugs subdatabase. Column diagram (A), pie chart (B). Temperature ranges include the higher value but not the lower value, except for 25–40 °C and 25–50 °C, which include both (e.g., 40–60 °C contains 60 °C, but not 40 °C).
MP analysis of CNS and non‐CNS drugs
The ability to penetrate the blood‐brain barrier (BBB) is an essential element for CNS drugs. A good CNS drug should avoid periphery side effects, whereas a good non‐CNS drug should avoid CNS side effects. Therefore, we investigated the MP distributions of CNS and non‐CNS drugs and attempted to find some differences.
As shown in Figure 6 A and 7 A (the yellow columns), the range of most CNS drug MPs (82.6 %) was 60–220 °C, whereas the range for non‐CNS drugs (78.7 %) was 100–240 °C. The highest peak ranges of CNS drug and non‐CNS drug MPs were 120–140 °C (>14 %) and 140–160 °C (>12 %), respectively. On the whole, most CNS drugs had lower MPs than non‐CNS drugs. Similar to the whole database and oral drug subdatabase, the MP percentages in the range of 100–200 °C of both CNS (60.7 %) and non‐CNS (54.8 %) drugs were greater than half (Figure 6 B and 7 B). The MP percentage under 200 °C of CNS drugs was 83.6 %, whereas for non‐CNS drugs it was 69.8 % (Figure 6 B and 7 B), indicating that CNS drugs had lower MPs than non‐CNS drugs. Furthermore, the MPs of CNS drugs were usually the lowest among the four main drug indications (Table 1).
Figure 6.
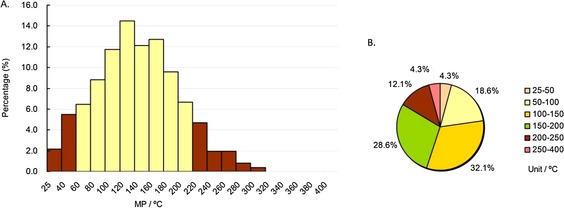
MP distributions of approved CNS drugs subdatabase. Column diagram (A), pie chart (B). Temperature ranges include the higher value but not the lower value, except for 25–40 °C and 25–50 °C, which include both (e.g., 40–60 °C contains 60 °C, but not 40 °C).
Figure 7.
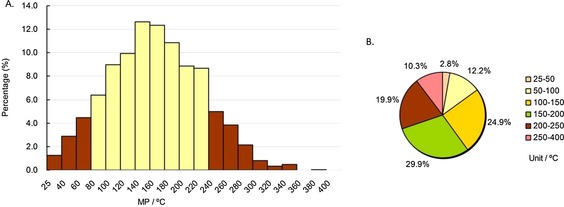
MP distributions of approved non‐CNS drugs subdatabase. Column diagram (A), pie chart (B). Temperature ranges include the higher value but not the lower value, except for 25–40 °C and 25–50 °C, which include both (e.g., 40–60 °C contains 60 °C, but not 40 °C).
MP analysis for three main drug indications
The physicochemical properties of small molecular drugs with various indications may be different. Thus, to precisely discuss the drug‐like rules of the drugs for different diseases, the MP distributions of drugs for the treatment of three main diseases were analyzed, that is, anticancer, anti‐infective, and cardiovascular drugs.
The analysis was the same as above, and the results are shown in Figures 8–8, 9, 10. For anticancer drugs, as demonstrated in column diagram 8 A, most of the MPs (74.9 %) were in the range of 100–240 °C (the yellow columns), and the highest peak range was 200–220 °C (>14 %). Other than the results of the whole drugs and the other therapeutic drugs, pie chart 8 B shows that the number proportion of MPs in the range of 200–400 °C (38.4 %) for anticancer drugs was the largest (all drugs: 26.9 %, oral drugs: 29.3 %, CNS drugs: 16.4 %, non‐CNS drugs: 30.2 %, anti‐infective drugs: 33.4 %, and cardiovascular drugs: 23.3 %), indicating that the MPs of anticancer drugs were typically higher. In addition, the MP percentage in the range of 100–200 °C of anticancer drugs was slightly more than half (50.7 %, Figure 8 B).
Figure 8.
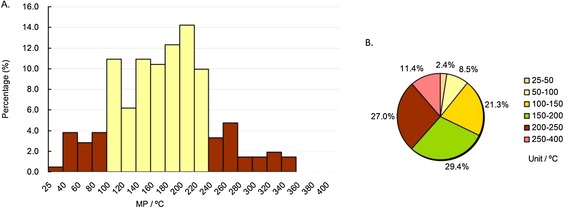
MP distributions of approved anticancer drugs subdatabase. Column diagram (A), pie chart (B). Temperature ranges include the higher value but not the lower value, except for 25–40 °C and 25–50 °C, which include both (e.g., 40–60 °C contains 60 °C, but not 40 °C).
Figure 9.
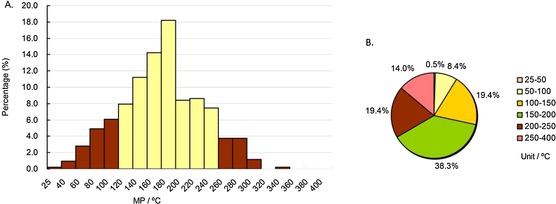
MP distributions of approved anti‐infective drugs subdatabase. Column diagram (A), pie chart (B). Temperature ranges include the higher value but not the lower value, except for 25–40 °C and 25–50 °C, which include both (e.g., 40–60 °C contains 60 °C, but not 40 °C).
Figure 10.
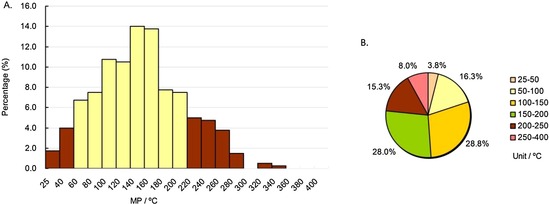
MP distributions of approved cardiovascular drugs subdatabase. Column diagram (A), pie chart (B). Temperature ranges include the higher value but not the lower value, except for 25–40 °C and 25–50 °C, which include both (e.g., 40–60 °C contains 60 °C, but not 40 °C).
For anti‐infective drugs, as demonstrated in column diagram 9 A, most MPs (82.2 %) were in the range of 100–260 °C (the yellow columns), and the highest peak range was 180–200 °C (> 18 %), showing minimal difference from the MPs of anticancer drugs. Pie chart 9 B shows that 85.5 % of anti‐infective drug’ MPs were in the range of 50–250 °C, and 57.7 % of drugs were in the range of 100–200 °C.
For cardiovascular drugs, as demonstrated in column diagram 10 A, most MPs (78.5 %, the yellow columns) were in the range of 60–220 °C, 56.8 % of MPs were in the range of 100–200 °C, and the highest peak range was 140–160 °C (>14 %), much lower than those of anti‐infective and anticancer drugs. Pie chart 10 B shows that 88.3 % of cardiovascular drug’ MPs were in the range of 50–250 °C. The MP percentage under 200 °C for cardiovascular drugs was 76.8 %, second only to CNS drugs (83.6 %), indicating cardiovascular drugs should have relatively low MPs (<200 °C).
For anticancer, anti‐infective, and cardiovascular drugs, the mean MPs were 179 °C, 182 °C, and 154 °C, while the median MPs were 181 °C, 181 °C, and 152 °C, respectively (Table 1), proving that cardiovascular drugs had lower MPs than anticancer and anti‐infective drugs.
The mean MP, MW, Clog P, and HBA comparisons of the different classes of approved drugs
T‐tests were used to determine the significance levels when comparing the mean MPs, MWs, Clog Ps, and HBAs of drugs in the entire database and subdatabases. As shown in Figures 11–11, 12, 13, 14, comparing different subdatabases with the whole database, the mean MPs and HBAs of all subdatabases (oral, CNS, anticancer, anti‐infective, and cardiovascular drugs) exhibited significant differences. The mean MWs also exhibited significant differences except for the oral drug subdatabase. For Clog Ps, there was no significant difference between all drugs and oral drugs, so did all drugs and CNS drugs. The mean Clog Ps of three main drug indications displayed significant differences with the whole drug database. As expected, the mean MPs, MWs, and HBAs of CNS and non‐CNS drugs also showed significant differences (p <0.001). The mean MP, MW, and HBA of CNS drugs were observably lower than non‐CNS drugs and other classes of drugs. But there was not much difference between the mean Clog Ps of CNS and non‐CNS drugs, implying that Clog P might play a weak role in the process of designing CNS drugs. Moreover, anticancer and anti‐infective drugs exhibited higher MP trends (mean MPs) than cardiovascular and CNS drugs; the MP trends from high to low in order were anti‐infective drugs, anticancer drugs, cardiovascular drugs, and CNS drugs.
Figure 11.
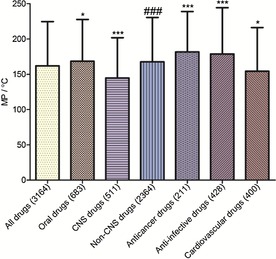
Mean MPs of different classes of drugs in our approved‐drug database; * compared with all drugs; # compared with CNS drugs. Levels of significance *** p<0.001, ** p<0.01, * p<0.05, ### p<0.001.
Figure 12.
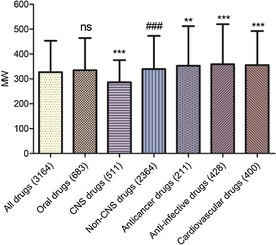
Mean MWs of different classes of drugs in our approved‐drug database; * compared with all drugs; ns, compared with all drugs; # compared with CNS drugs. Levels of significance, *** p<0.001; ** p<0.01; ### p<0.001; ns, no significance.
Figure 13.
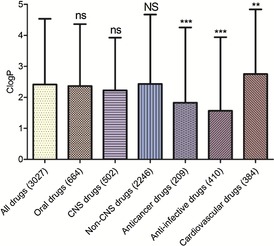
Mean Clog P values of different classes of drugs in our approved‐drug database; ns, compared with all drugs; * compared with all drugs; ns, compared with all drugs; NS compared with CNS drugs. Levels of significance, *** p<0.001; ** p<0.01; ns, no significance; NS, no significance.
Figure 14.
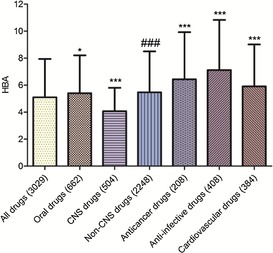
Mean HBAs of different classes of drugs in our approved‐drug database ; * compared with all drugs; # compared with CNS drugs. Levels of significance, *** p<0.001; ** p<0.01; * p<0.05; ### p<0.001.
The comparisons of MW versus MP and Clog P versus MP distributions of different classes of approved drugs
As shown in Table 2 and Figure 15, the MWs and Clog Ps of most drugs in the optimal MP range were not more than 500 and 5, respectively, which indicated that MP distribution criteria were in accordance with Lipinski's rule of five. In the optimal MP range, the percentages of CNS drugs with MW≤500 and Clog P≤5 were 99.3 % and 94.6 %, respectively. What is more interesting, 88.4 % of CNS drugs were in both the optimal MP range and MW range, and 90.4 % of CNS drugs were in both optimal MP range and Clog P range. The phenomenon gave us a revelation that when we design a small molecular compound for curing CNS diseases, its MP should be in the range of 60–200 °C, MW should be in the range of 150–400, and Clog P should be in the range of 0–5.
Table 2.
Percentage of drugs in different MP, MW and Clog P range.
| Percentage of drugs | |||||
|---|---|---|---|---|---|
| Drug class | Optimal MP range [°C] | MW≤500[a] | Clog P≤5[b] | Optimal MW range[c] | Optimal Clog P range[d] |
| All | 80–240 | 92.4 % | 90.9 % | 87.1 % (100–450) | 79.2 % (0–5) |
| Oral | 100–240 | 92.2 % | 92.4 % | 83.1 % (150–450) | 81.4 % (0–5) |
| CNS | 60–220 | 99.3 % | 96.4 % | 88.4 % (150–400) | 90.4 % (0–5) |
| Anticancer | 100–240 | 83.5 % | 88.8 % | 87.3 % (100–550) | 75.0 % (−1–5) |
| Anti‐infective | 120–240 | 84.4 % | 93.5 % | 84.9 % (150–550) | 81.9 % (−1–5) |
| Cardiovascular | 80–220 | 90.2 % | 88.6 % | 92.4 % (100–550) | 82.0 % (0–5) |
[a] Percentage of drugs with MW≤500 and MP in the optimal range. [b] Percentage of drugs with Clog P≤5 and MP in the optimal range. [c] Percentage of drugs with both MW and MP in the optimal range. Data in parentheses are optimal MW ranges. [d] Percentage of drugs with both Clog P and MP in the optimal ranges. Data in parentheses are optimal Clog P ranges.
Figure 15.
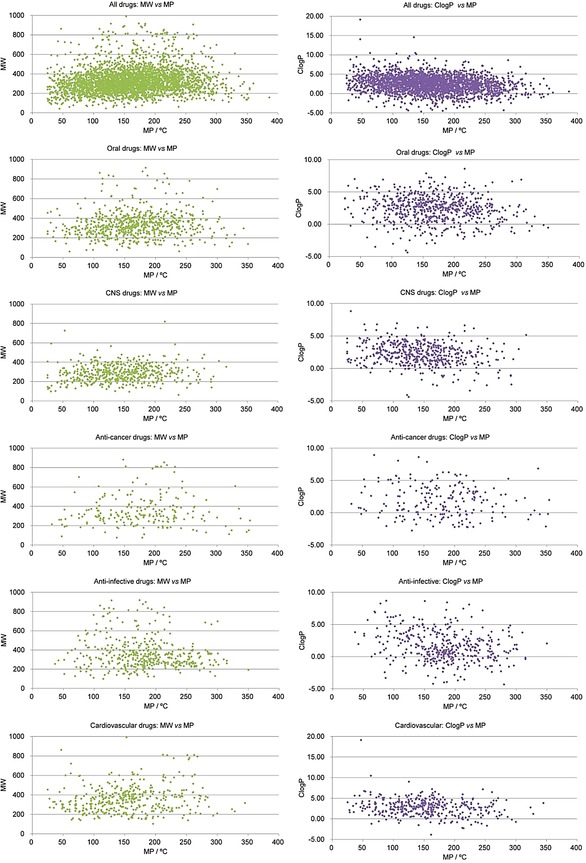
The comparisons of MW versus MP and Clog P versus MP distributions of different classes of approved drugs.
The MP comparisons of our approved and discontinued‐drug databases
To fully explore MP distribution criteria and their relevance to drug‐like properties, we compared the MP distributions of our approved and discontinued‐drug databases from three aspects—the entire drug database, the oral‐drug subdatabase, and the CNS‐drug subdatabase. Their mean MPs were also compared with T‐tests for determining the significance levels. The detailed content was as follows:
The MP distribution comparison of the two entire drug databases
We adopted the same method used for the approved‐drug database above to analyze the MP profiles of the 417 discontinued drugs, and the comparison is shown in Figure 16. The MP distribution trends of the discontinued drugs were almost the same as the approved drugs, but in the relatively higher MP ranges, the discontinued drugs had higher proportions (Figure 16), which was similar to the MW distribution trends of approved and discontinued drugs reported by Wenlock.9 Especially in the ranges of 160–180 °C and 240–260 °C, the proportions of discontinued drugs were much higher than approved drugs, and the values were 2.0 % and 3.2 %, respectively. The approved drugs′ statistical results indicate that candidate drugs with high MPs (MP>250 °C) might possess poor drug‐like properties and are unlikely to be developed into approved drugs. The discontinued drugs′ statistical results further supplement this criterion. In the good drug‐like range of MPs (all drugs: MP <250 °C), the discontinued risk of a candidate drug might be higher when the MP of candidate drug is more than 140 °C, and researchers should comprehensively consider other rules for drug‐like properties. In addition, these results in Table 1 confirmed the conclusion that discontinued drugs had relatively higher MPs than approved drugs.
Figure 16.
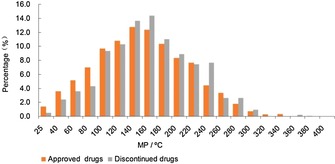
MP comparisons of discontinued and approved‐drug databases.
The MP distribution comparison of the two oral‐drug subdatabases
As shown in Figure 17, the MP distribution trends of discontinued and approved oral drugs were almost the same as that in Figure 16, and the discontinued oral drugs had higher proportions in the relatively higher MP ranges. Especially in the ranges of 160–180 °C, 200–220 °C, and 240–260 °C, the proportions of discontinued oral drugs were much higher than approved oral drugs, and the values were 5.2 %, 3.1 %, and 3.6 %, respectively. These results also indicate the same criteria as the entire drug database, that is, in good drug‐like range (MP<250 °C), the discontinued risk of a candidate drug might be higher when the MP of candidate drug is more than 160 °C, and researchers should comprehensively consider other rules for drug‐like properties.
Figure 17.
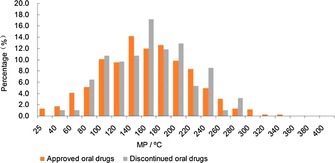
MP comparisons of discontinued and approved‐oral‐drug databases.
The MP distribution comparison of the two CNS drug subdatabases
As shown in Figure 18, in the relatively higher MP ranges, the discontinued CNS drugs had obviously higher proportions than approved CNS drugs. Especially in the ranges of 160–180 °C, 200–220 °C, and 220–240 °C, the proportions of discontinued oral drugs were much higher than approved oral drugs, and the values were 3.5 %, 3.3 %, and 4.1 %, respectively. The approved CNS drugs′ statistical results indicate that candidate drugs with MPs less than 200 °C had a higher chance to be developed into approved drugs. The discontinued drugs′ statistical results indicate that the MP percentages under 200 °C of discontinued CNS drugs was 71.3 %, much lower than approved CNS drugs (83.6 %). In a word, in this safe range (MP<200 °C), when the MPs of CNS candidate drugs are more than 120 °C (120 °C<MP<200 °C), researchers should comprehensively consider other rules for drug‐like properties.
Figure 18.
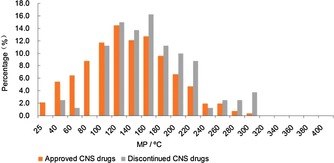
MP comparisons of discontinued and approved‐CNS‐drug databases.
The mean MP comparison of the approved and discontinued‐drug databases
Whether there was a significant difference between the MPs of approved and discontinued drugs was determined by T‐test. As shown in Figure 19, the blue column represents approved drugs and the green column represents discontinued drugs. The mean MPs of approved drugs (all drugs, oral drugs, and CNS drugs) were higher than those for discontinued drugs. Moreover, there was a significant difference between the MPs of all approved and discontinued‐drug databases (p<0.01). Comparing the CNS‐drug subdatabases of approved and discontinued drugs clearly shows that their mean MPs exhibited a significant difference (p<0.001). However, there was no significant difference between the MPs of approved and discontinued oral‐drug databases.
Figure 19.
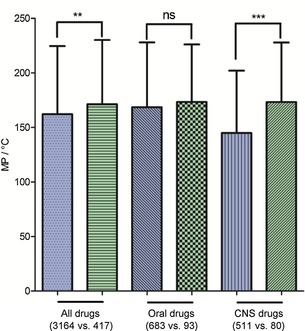
Mean MPs of different classes of drugs. Blue columns represent approved drugs and green columns represent discontinued drugs; * comparison of approved and discontinued drugs; levels of significance: *** p<0.001; ** p<0.01; ns, no significant difference.
Conclusion
The melting point (MP) is a fundamental physical property and could be obtained easily compared with other physicochemical properties (such as log P and water solubility) because there are no complicated test conditions required for its measurement. Therefore, the MP of an active compound has great potential to judge drug‐like properties. As part of our efforts to unearth the drug‐like properties of approved drugs, we undertook an MP distribution analysis of globally approved drugs (before 2007) and discontinued drugs (of the past two decades) to define a series of key criteria that could lead to the selection of novel candidate drugs with a higher probability of success.
In summary, we constructed the largest MP database (experimental value) of globally approved drugs (3164 organic small molecules) and discontinued drugs (417 organic small molecules), then extracted six subdatabases (oral, CNS, non‐CNS, anticancer, anti‐infective, and cardiovascular drugs) from the global approved‐drug database and two subdatabases (including discontinued oral drugs and discontinued CNS drugs) from the discontinued‐drug database. The MP distribution statistics and analysis of approved drugs reveal some noteworthy observations: 1) the MPs of nearly ninety percent of approved drugs were in the range of 25–250 °C (all drugs: 91.2 %, oral drugs: 91.1 %, CNS drugs: 95.7 %, non‐CNS drugs: 89.7 %, anticancer drugs: 88.6 %, anti‐infective drugs: 86.0 %, and cardiovascular drugs: 92.0 %). 2) Furthermore, the MP percentages of approved drugs in the range of 100–200 °C were more than half (all drugs: 55.9 %, oral drugs: 58.4 %, CNS drugs: 60.7 %, non‐CNS drugs: 54.8 %, anticancer drugs: 50.7 %, anti‐infective drugs: 57.7 %, and cardiovascular drugs: 56.8 %). 3) Compared with the all approved drugs, approved oral drugs had slightly higher MPs (mean MP: 168 °C vs. 162 °C; median MP: 166 °C vs. 160 °C; nearly eighty percent: 100–240 °C vs. 80–240 °C). 4) Approved CNS drugs had lower MPs than approved non‐CNS drugs (mean MP: 145 °C vs. 168 °C; median MP: 143 °C vs. 165 °C; MP<200 °C: 83.6 % vs. 69.8 %). 5) Among the six subdatabases of approved drugs, anti‐infective drugs possessed the highest MPs (the highest mean MP: 182 °C; the highest median MP: 181 °C; MP>200 °C: 33.4 %).
The comparisons of MW versus MP and Clog P versus MP distributions of different classes of approved drugs indicated that the MWs and Clog Ps of most drugs in the optimal MP range were not more than 500 and 5 respectively, implying the MP distribution criteria were in accordance with Lipinski's rule of five. Moreover, the MP distribution statistics and analysis of discontinued drugs further supplement these criteria. In the good drug‐like MP range, (all drugs: MP<250 °C; CNS drugs: MP<200 °C), the discontinued risk of a candidate drug might be higher when the MP of a candidate drug is more than 140 °C, and researchers should comprehensively consider other rules for drug‐like properties. We envision that these MP criteria and observations for the identification of novel candidate drugs might be applicable across a broad range of drug discovery research and would provide a theoretical foundation for designing new chemical entities with good drug‐like properties.
Supporting information
As a service to our authors and readers, this journal provides supporting information supplied by the authors. Such materials are peer reviewed and may be re‐organized for online delivery, but are not copy‐edited or typeset. Technical support issues arising from supporting information (other than missing files) should be addressed to the authors.
Supplementary
Supplementary
Acknowledgements
Financial support of this research was provided by the National Natural Science Foundation of China (Grants 21222211 and 91313303), the Program for New Century Excellent Talents in University (Grant NCET‐12‐0853),and the “Shu Guang” project supported by the Shanghai Municipal Education Commission and Shanghai Education Development Foundation (Grant 14SG28). The Fundamental Research Funds for the Central Universities is also gratefully acknowledged.
F. Mao, Q. Kong, W. Ni, X. Xu, D. Ling, Z. Lu, J. Li, ChemistryOpen 2016, 5, 357.
References
- 1. Cook D., Brown D., Alexander R., March R., Morgan P., Satterthwaite G., Pangalos M. N., Nat. Rev. Drug Discov. 2014, 13, 419–431. [DOI] [PubMed] [Google Scholar]
- 2. Waring M. J., Arrowsmith J., Leach A. R., Leeson P. D., Mandrell S., Owen R. M., Pairaudeau G., Pennie W. D., Pickett S. D., Wang J., Wallace O., Weir A., Nat. Rev. Drug Discov. 2015, 14, 475–486. [DOI] [PubMed] [Google Scholar]
- 3. Lipinski C. A., Lombardo F., Dominy B. W., Feeney P. J., Adv. Drug Delivery Rev. 1997, 23, 3–25. [DOI] [PubMed] [Google Scholar]
- 4. Veber D. F., Johnson S. R., Cheng H.-Y., Smith B. R., Ward K. W., Kopple K. D., J. Med. Chem. 2002, 45, 2615–2623. [DOI] [PubMed] [Google Scholar]
- 5. Leeson P. D., Davis A. M., J. Med. Chem. 2004, 47, 6338–6348. [DOI] [PubMed] [Google Scholar]
- 6. Oprea T. I., J. Comput. Aid. Mol. Des. 2000, 14, 251–64. [DOI] [PubMed] [Google Scholar]
- 7. Manallack D. T., Prankerd R. J., Yuriev E., Oprea T. I., Chalmers D. K., Chem. Soc. Rev. 2013, 42, 485–496. [DOI] [PMC free article] [PubMed] [Google Scholar]
- 8. Congreve M., Carr R., Murray C., Jhoti H., Drug Discovery Today 2003, 8, 876–877. [DOI] [PubMed] [Google Scholar]
- 9. Wenlock M. C., Austin R. P., Barton P., Davis A. M., Leeson P. D., J. Med. Chem. 2003, 46, 1250–1256. [DOI] [PubMed] [Google Scholar]
- 10. Lipinski C. A., Lombardo F., Dominy B. W., Feeney P. J., Adv. Drug Delivery Rev. 2001, 46, 3–26. [DOI] [PubMed] [Google Scholar]
- 11. Clark D. E., Pickett S. D., Drug Discovery Today Drug Discov. Today 2000, 5, 49–58. [DOI] [PubMed] [Google Scholar]
- 12. Pajouhesh H., Lenz G. R., NeuroRx 2005, 2, 541–553. [DOI] [PMC free article] [PubMed] [Google Scholar]
- 13. Kelder J., Grootenhuis P. D. J., Bayada D. M., Delbressine L. P. C., Ploemen J. P., Pharm. Res. 1999, 16, 1514–1519. [DOI] [PubMed] [Google Scholar]
- 14. Ritchie T. J., Luscombe C. N., Macdonald S. J. F., J. Chem. Inf. Model. 2009, 49, 1025–1032. [DOI] [PubMed] [Google Scholar]
- 15. Choy Y. B., Prausnitz M. R., Pharm. Res. 2011, 28, 943–948. [DOI] [PMC free article] [PubMed] [Google Scholar]
- 16. Vieth M., Siegel M. G., Higgs R. E., Watson I. A., Robertson D. H., Savin K. A., Durst G. L., Hipskind P. A., J. Med. Chem. 2004, 47, 224–232. [DOI] [PubMed] [Google Scholar]
- 17. Rask-Andersen M., Almen M. S., Schioth H. B., Nat. Rev. Drug Discovery 2011, 10, 579–590. [DOI] [PubMed] [Google Scholar]
- 18. Vieth M., Sutherland J. J., J. Med. Chem. 2006, 49, 3451–3453. [DOI] [PubMed] [Google Scholar]
- 19. Hopkins A. L., Groom C. R., Alex A., Drug Discovery Today 2004, 9, 430–431. [DOI] [PubMed] [Google Scholar]
- 20. Leeson P. D., Springthorpe B., Nat. Rev. Drug Discovery 2007, 6, 881–890. [DOI] [PubMed] [Google Scholar]
- 21. Mortenson P. N., Murray C. W., J. Comp. Aid. Mol. Des. 2011, 25, 663–667. [DOI] [PubMed] [Google Scholar]
- 22. Nissink J. W., J. Chem. Inf. Model. 2009, 49, 1617–1622. [DOI] [PubMed] [Google Scholar]
- 23. Shultz M. D., Bioorg. Med. Chem. Lett. 2013, 23, 5980–5991. [DOI] [PubMed] [Google Scholar]
- 24. Yalkowsky S. H., Valvani S. C., J. Pharm. Sci. 1980, 69, 912–22. [DOI] [PubMed] [Google Scholar]
- 25. Dearden J. C., Sci. Total Environ. 1991, 109–110, 59–68. [DOI] [PubMed] [Google Scholar]
- 26. Jain N., Yalkowsky S. H., J. Pharm. Sci. 2001, 90, 234–52. [DOI] [PubMed] [Google Scholar]
- 27. Chong C. R., Sullivan D. J., Nature 2007, 448, 645–6. [DOI] [PubMed] [Google Scholar]
Associated Data
This section collects any data citations, data availability statements, or supplementary materials included in this article.
Supplementary Materials
As a service to our authors and readers, this journal provides supporting information supplied by the authors. Such materials are peer reviewed and may be re‐organized for online delivery, but are not copy‐edited or typeset. Technical support issues arising from supporting information (other than missing files) should be addressed to the authors.
Supplementary
Supplementary


