

Abstract
Near infrared spectroscopy (NIRS) is a non-invasive technique which measures changes in brain tissue oxygenation. NIRS has been used for continuous monitoring of brain oxygenation during medical procedures carrying high risk of iatrogenic brain ischemia and also has been adopted by cognitive neuroscience for studies on executive and cognitive functions. Until now, NIRS has not been used to detect residual cognitive functions in patients with prolonged disorders of consciousness (pDOC). In this study we aimed to evaluate the brain function of patients with pDOC by using a motor imagery task while recording NIRS. We also collected data from a group of age and gender matched healthy controls while they carried out both real and imagined motor movements to command. We studied 16 pDOC patients in total, split into two groups: five had a diagnosis of Vegetative state/Unresponsive Wakefulness State, and eleven had a diagnosis of Minimally Conscious State. In the control subjects we found a greater oxy-haemoglobin (oxyHb) response during real movement compared with imagined movement. For the between group comparison, we found a main effect of hemisphere, with greater depression of oxyHb signal in the right > left hemisphere compared with rest period for all three groups. A post-hoc analysis including only the two pDOC patient groups was also significant suggesting that this effect was not just being driven by the control subjects. This study demonstrates for the first time the feasibility of using NIRS for the assessment of brain function in pDOC patients using a motor imagery task.
Abbreviations: pDOC, prolonged disorders of consciousness; VS, vegetative state; UWS, unresponsive wakefulness state; MCS, minimally conscious state; fNIRS, functional near infrared spectroscopy; MI, motor imagery; MM, motor movement; M1, primary motor cortex; SMA, supplementary motor area; SMART, Sensory Modality Assessment for Rehabilitation Technique
Keywords: (Prolonged) disorders of consciousness, Functional near infrared spectroscopy, Brain function assessment in disorders of consciousness
Highlights
-
•
We used functional near infrared spectroscopy in patients with disorders of consciousness.
-
•
Three main types of haemodynamic response were identified on motor task.
-
•
There were similar responses in a subset of patients compared to controls.
-
•
These preliminary results confirm feasibility and warrant further research.
1. Introduction
Near infrared spectroscopy (NIRS) was described by Frans Jobsis, who noticed a good transparency of biological tissues for a near infrared light and suggested its use for monitoring of tissue oxygenation (Jobsis, 1977). NIRS systems are commercially available for monitoring cerebral oxygenation of frontal lobes, for example, during a surgery carrying risk of iatrogenic brain ischemia (Murkin and Arango, 2009). NIRS has also been used on neonatal intensive care with currently ongoing phase II randomized clinical trial (SafeBoosC) evaluating cerebral hypoxia treatment controlled with NIRS responses (Pellicer et al., 2013).
Functional NIRS (fNIRS) is a methodology that has the potential to improve the assessment of patients with prolonged disorders of consciousness (pDOC)·The clinical assessment of awareness as well as assessment of any response to therapy is challenging in this group of patients. The term DOC is an umbrella term encompassing two diagnoses: Vegetative State (VS), known also as Unresponsive Wakefulness State (UWS), and Minimally Conscious State (MCS). Patients in VS/UWS are awake but lack awareness of themselves and their environment. They are able to breathe spontaneously and have a stable circulation (Jennett and Plum, 1972, Laureys et al., 2010). Unlike VS/UWS, patients in MCS are partially aware of themselves and their environment and are able to follow simple commands, albeit inconsistently. At present the description of MCS patients includes: ability to visually track a person, item or to follow a self-reflection in a mirror, ability to intentionally communicate “yes” and “no” responses, although the patients remain unable to interact functionally with their environment (Giacino et al., 2002, Vanhaudenhuyse et al., 2008, Bruno et al., 2011).
In the clinical setting distinguishing these two entities is challenging, time consuming and may lack objectivity (Andrews et al., 1996). Therefore, in addition to meticulous clinical assessment several adjunct methods are used. Responses to environmental stimuli using behavioural scales are used for assessment of consciousness (Majerus et al., 2005), although this measurement method often remains subjective. Therefore, several techniques have been employed to measure brain responses to stimuli. These included Positron Emission Tomography (PET), Transcranial magnetic stimulation (TMS) and functional Magnetic Resonance Imaging (fMRI), although none of these techniques are used routinely in clinical practice for a variety of reasons including: extra costs; expert analysis of the data and availability of the methods (Di Perri et al., 2014). In this study we wished to explore the feasibility of detecting brain-based haemodynamic changes during motor tasks using bed-side apparatus, NIRS in patients with DOC.
We hypothesized that a motor task would elicit changes in oxy and/or deoxyHb concentration indicating that a subject is able to follow specific commands, and, hence, be a useful biomarker for awareness. Two main patterns of the functional NIRS responses during a motor task have been identified: a typical NIRS signal changes when the concentrations of the oxyHb increases and of the deoxyHb decreases (Leff et al., 2011) and an inverted response when the concentration of the oxyHb decreases and the deoxyHb increases (Holper et al., 2011). Therefore, we aimed to explore the fNIRS responses from the healthy controls during both motor movement and motor imagery. Furthermore, we wanted to look for differences in the fNIRS responses from the supplementary motor area (SMA) and primary motor cortex (M1). A final aim was to investigate any differences in haemodynamic response to a motor task between patients with a diagnosis of VS/UWS and those with MCS.
2. Methodology
2.1. Subjects
We included patients from Royal Hospital for Neuro-disability in London, UK. This 26-bedded unit provides a comprehensive neuro-rehabilitation programme for patients with DOC in the post-acute phase following severe brain injury (GCS < 8).
The inclusion criteria were as follows: 1) severe acquired brain injury leading to prolonged DOC (longer than 4 weeks since brain injury) or permanent DOC. The permanent DOC was defined according to the Royal College of Physician Guidance (RCP, 2013) for traumatic aetiology if lasted longer than 12 months or anoxic aetiology if longer than 6 months; 2) conservative management of brain injury (no neurosurgery); 3) at least unilateral intact auditory brainstem evoked potentials.
Awareness of the environment was measured using a Sensory Modality Assessment for Rehabilitation Technique (SMART)(Gill-Thwaites and Munday, 2004). The SMART is a validated tool for assessment of awareness in pDOC. The assessment compromises of ten one to one (patient-assessor) sessions lasting approximately 60 min each and is composed of eight modalities as follows: sensory modality (visual, auditory, tactile, gustatory, and olfactory), motor function, communication and arousal/wakefulness.
The control group consisted of 10 healthy, right-handed volunteers (6 females, mean age 40 years SD 8). Written informed consent was obtained from all the control subjects. The patients were recruited into the study after consultation with their relatives and the treating team. The study was carried out in accordance with the latest version of the Declaration of Helsinki and the study was approved by a National Research Ethics Committee (NRES Committee London-Queen Square).
2.2. The tasks
The control subjects performed both a motor movement (MM) of the right hand (squeezing a ball) and a kinaesthetic motor imagery (MI) task (the same movement but imagined) both to command. A hand movement task has been extensively used in the fNIRS studies, for instance, this task was found as reliable in healthy and also in subjects after traumatic brain injury (Bhambhani et al., 2006), and for mapping of the motor cortex (Wilson et al., 2014, Sato et al., 2007). The experiment consisted of 20 blocks of executions of MM followed by 20 blocks of MI, separated by a 10 min long break. Patients with pDOC performed only the motor imagery task, which consisted of 20 blocks of MI.
During MI the subjects were instructed to concentrate on the muscle contraction of their right hand as if it were a real movement rather than visualisation of the movement; thus the subjects were asked to perform first person perspective kinaesthetic motor imagery (Guillot et al., 2009). The paradigm was divided into 2 blocks: 7 s of real right hand movement or imagery of ball squeezing followed by 12 s of resting state. At the beginning of the experiment the participants were familiarized with the experiment design and with the instructions. Each block began with the auditory presentation of the task for the block for instance: “start” and “stop”. The twelve second interval between the imagery task was chosen, based on previous studies showing that haemodynamic recovery to baseline occurs 9 to 10 s after cessation of stimulus (Boden et al., 2007). In the pDOC group, the MI algorithm was used, the recorded instruction was as follows “imagine you are squeezing a ball with your own right hand” “start” and “stop”.
2.3. Near infrared spectroscopy instrumentation
The fNIRS signal was recorded bilaterally over the premotor area and supplementary motor area (EEG corresponding areas FC3, FC1, FCz, FC2 and FC4) and over the primary motor cortex (EEG corresponding areas C4, C2, Cz, C1 and C3), as combinations of these areas were likely to be active in response to both motor paradigms. All NIRS measurements were performed using a NIRScount system (NIRx Medical Technologies LLC, Berlin, Germany) using a 16-channel array of optodes. The system performed dual-wavelength continuous–wave (CW) near infrared tomographic measurements at a 10.42 Hz sampling rate. The device emits light at 2 distinct wavelengths, 760 and 850 nm, for discrimination of two oxygenation states of tissue. The 4 sources and 12 detectors were placed on subject's skull in the usual primary and secondary motor areas, according to the International 10–20 system (Klem et al., 1999), with each detector receiving light originating in its neighbouring light source and scattered in the adjacent tissue. Each detector and the most closely placed light source built a channel. In total there were 16 channels containing information about deoxy and oxyHb concentration changes (Fig. 1). Changes in oxy and deoxyHb concentration were analysed separately, giving in total 32 channels. The inter-optodes distance was 2.5 cm. For the analysis of the haemoglobin concentration changes within the supplementary motor area (SMA) and primary motor cortex (M1) we used following spatial localisations: SMA: right channels :1,2,5,6 and the left channels: 3,4,7,8, respectively. For the M1 right channels: 9,10,13,14 and the left channels: 11,12,15,16 respectively. Since the NIRS channels were placed around the C3 and C4 EEG 10–20 positions, the presumption was that the SMA will occupy the anterior aspect of this area while the M1 posterior aspect of this area (Grafton, 1994, Rizzolatti and Luppino, 2001, Chouinard and Paus, 2006). The optodes were placed using the Waveguard cap (ANT Neuro, The Netherlands) and secured by using a dedicated black fabric cap (Fig. 1).
Fig. 1.

Waveguard cap and fibre arrangement. Caption: (A) Waveguard cap with an array of detectors and light sources and (B) fibre arrangement. The orange dots indicate sources position and the triangles indicate position of detectors. Each source - detector (triangle) pair forms a hypothetical channel (Ch). (For interpretation of the references to colour in this figure legend, the reader is referred to the web version of this article.)
2.4. Data processing and analysis
The raw NIRS data were converted into a readable Matlab format using Nilab2 software (NIRx Medical Technologies LLC). The data were low-pass filtered to remove the high frequency signal ~ 0.3 Hz breathing and 1 Hz heart rate. Low frequency (< 0.01 Hz) vascular or metabolic oscillations were removed by using a high frequency cut-off filter of 32 s (0.03 Hz). We then calculated changes in both oxy and deoxyHb concentration (expressed in (μmol/L) using the modified Beer-Lambert law as described by Delpy (Scholkmann et al., 2014). The data was mean corrected so that, at each time-point, the value represents the amplitude minus the average for the entire record for each channel.
Using a custom-written script in R language (Rx 64 1.1) we calculated relative differences in haemoglobin concentration changes during the resting state and during the two motor tasks. The relative difference (Δrel) refers to the median difference between the signal amplitude before (7s + to 0 s) and during the task period (0 s to 7 s), and was calculated as the ratio of the absolute difference (Δabs) to the 5th to 95th quantile range of the signal amplitude for the entire study. These values were calculated for both oxy and deoxyHb, our two main dependent measures, at each channel. After examining the global tendency of the concentration changes, we averaged over both the left (8 channels) and right (8 channels) hemispheres to check for any lateralisation of haemoglobin concentration change, including looking either for ipsilateral negative oxygenation or contralateral positive or negative oxygenation, as these patterns were described elsewhere (Holper et al., 2011, McGregor et al., 2015). Two patients, numbered 1 and 14 from the Table 1, were excluded from our analysis. Both of them were is the MCS group and had high amplitude artefacts in all channels which were clearly synchronous with involuntary movements. The presence of high amplitude artefacts throughout recording did not allow for data analysis with the Nilab2 software (NIRx Medical Technologies LLC)”. In response to a reviewer's suggestion, we tried to localise responses to M1 and SMA by averaging over a smaller number of channels: SMA = channels 1,2,5,6 (right), and 3,4,7,8, (left); primary motor cortex (M1) = channels 9,10,13,14 (right) and 11,12,5,16 (left).
Table 1.
Demographic data of the study population. VS/UWS-vegetative state/Unresponsive Wakefulness State, MCS-minimally conscious state, pDOC prolonged disorders of consciousness.
| Number | Patient's diagnosis, on SMART assessment | Gender | Age in years | Duration of pDOC in months | Aetiology |
|---|---|---|---|---|---|
| 1 | MCS | F | 18 | 4.7 | Anoxic brain injury post self-hanging |
| 2 | MCS | F | 61 | 55.1 | Right frontal lobe bleed |
| 3 | MCS | M | 55 | 9.1 | Large intracerebral bleed |
| 4 | VS/UWS | M | 45 | 5.4 | Anoxic brain injury post cardiac arrest |
| 5 | MCS | M | 68 | 4.0 | Grade V SAH due to aneurysm left ACM |
| 6 | MCS | M | 46 | 4.7 | Extensive fronto-temporal left haemorrhage |
| 7 | MCS | M | 38 | 9.1 | Left fronto-temporo-parietal contusions following assault |
| 8 | MCS | F | 30 | 80.9 | Petechial haemorrhage following road traffic accident |
| 9 | MCS | F | 37 | 1.8 | Bilateral intracerebral bleed |
| 10 | VS/UWS | M | 24 | 6.4 | Hydrocephalus following TB meningitis |
| 11 | VS/UWS | M | 20 | 13.6 | Diffuse axonal injury following road traffic accident |
| 12 | VS/UWS | M | 51 | 40.4 | Right temporo-parietal bleed |
| 13 | VS/UWS | F | 62 | 5.0 | Anoxic brain injury post cardiac arrest |
| 14 | MCS | M | 52 | 6.4 | Left parietal haemorrhage following road traffic accident |
| 15 | MCS | F | 31 | 26.0 | Anoxic brain injury following cardiac arrest |
| 16 | MCS | M | 53 | 4.4 | Anoxic brain injury following cardiac arrest |
Data were entered into ANOVAS using SPSS (version 22). For the controls this was a 2 ∗ 2 within-subject analysis (task: MM/MI; hemisphere (within-subjects' factor): L/R). For the patients it was a 3 ∗ 2 (group (between-subject factor): controls/MCS/VS-UWS; hemisphere: L/R). p-Values were set at < 0.05 as a criterion for statistical significance for all planned analyses. We first examined interactions, then main effects.
3. Results
Sixteen patients with pDOC were included in the study (six female, mean age was 46 years, SD 11), with the following aetiologies: intracerebral haemorrhage (n = 6), anoxic brain injury (n = 5), traumatic brain injury (n = 4) and tuberculosis meningitis (n = 1). The patients had been in pDOC for 17.31 months on average (Table 1).
3.1. Data averaged over each hemisphere:
The controls elicited significant different haemodynamic responses in regard to the right v. left hemisphere. During an actual right hand movement the oxyHb concentration changes were − 0.63(SD 1.20) μmol/L over the right hemisphere and were − 0.38 (SD 1.32) μmol/L over the left hemisphere (p = 0.05). Similar results were shown for the deoxyHb concentration. The changes were − 0.01(SD0.35) μmol/L over the right hemisphere and of − 0.12 (SD 0.35) μmol/L over the left hemisphere (p = 0.02). The response to a motor imagery in controls was as follows: oxyHb − 0.08 (SD 0.99) μmol/L and deoxyHb − 0.004 (SD 0.26) μmol/L over the right hemisphere and oxyHb 0.03 (SD 1.08) μmol/L and deoxyHb − 0.08 (SD0.39) μmol/L over the left hemisphere respectively. The pDOC patients showed a similar pattern of responses to the controls during MI. (Supplemental table).
The time course of changes in oxy and deoxyHb during the motor imagery task in each channel for a representative control subject is shown on the Fig. 2.
Fig. 2.


Time course of changes in oxyHb (A) and deoxyHb (B) during the motor imagery task in each channel, single subject (subject number 4). Caption: (A) oxyHb and (B) deoxyHb on activation in a single subject to motor imagery task, dashed vertical lines represent start and stop of the task. Solid black lines present the pre and post-stimulus activation median values, red (A) and blue (B) lines present the 50th quantile (solid thick line) and the 10th and 90th quantile (dashed thin lines). (For interpretation of the references to colour in this figure legend, the reader is referred to the web version of this article.)
Across the three groups and the two tasks, we found greater variability in the oxyHb than the deoxyHb fNIRS measurement (Fig. 3, data averaged across all sensors).
Fig. 3.

Distribution of concentration changes in oxy and deoxy-haemoglobin. Caption: Distribution of concentration changes in oxy and deoxy-haemoglobin across four categories: vegetative state (VS), minimally conscious state (MCS), controls – motor movement (MM) and controls – motor imagery task (MI). Each dot denotes a subject and bold vertical lines indicate means. The horizontal axis denotes concentration changes expressed as a percentage of change in relation to the pre-stimuli haemoglobin concentration.
Based on the individual subject's responses (controls n = 10 and the pDOC patients n = 14) we identified three different types of fNIRS responses to a motor imagery task in regard to the polarity of global oxy and deoxyHb changes. The typical fNIRS response (oxyHb positive and deoxyHb negative) was seen in 60% (6/10) healthy subjects and 36 percentage (5/14) of the pDOC patients. Another response was an “inverted fNIRS response”, where the oxyHb concentration change was negative in value and deoxyHb was positive, was seen in two of the 10 healthy subjects and in six of the 14 patients. Two of the ten healthy subjects and three of the 14 pDOC patients, could not be clearly classified into either of the two main response types (Table 2).
Table 2.
The identifiable types of fNIRS responses to a motor imagery task based on the polarity of the global oxy and deoxyHb concentration changes.
| Type of fNIRS response | Typical response-OxyHb positive and deoxyHb negative | Inverted response-oxyHb negative and deoxyHb positive | Unclassified response oxyHb and deoxyHb positive or oxyHb and deoxyHb negative |
|---|---|---|---|
| Healthy controls, n = 10 | 6 | 2 | 2 |
| pDOC patients, n = 14 | 5 | 6 | 3 |
The ten controls elicited greater haemodynamic response during MM then during the MI task (Fig. 4). With oxyHb as the dependent measure we did not find a task ∗ hemisphere interaction p = 0.229. We did however find a main effect of task F (1, 9) = 5.52, p = 0.043, with MM > MI (greater depression of oxyHb signal compared with rest period), but not of hemisphere p = 0.186 (Table 3).
Fig. 4.
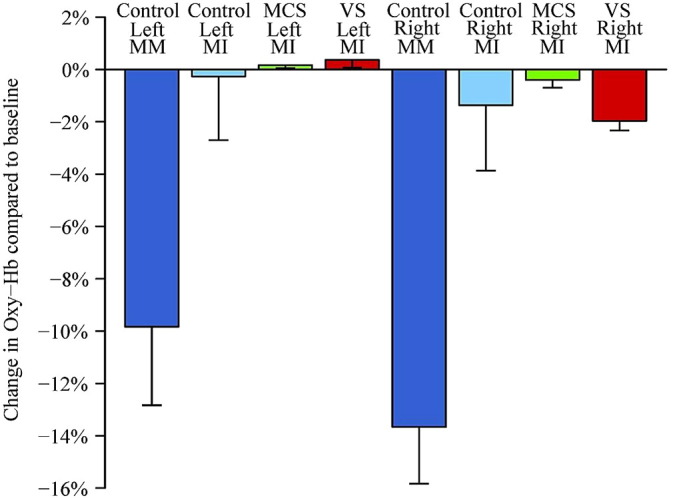
Relative changes of oxy-haemoglobin concentration. Caption: relative changes of oxy-haemoglobin concentration in healthy subjects, minimally conscious state (MCS) and vegetative state (VS) patients over the right and left hemisphere on motor imagery (MI, all three groups) and motor movement (MM, controls only) task. The bars denote mean change and whiskers are for standard error of the mean.
Table 3.
The mean (n = 10) of oxyHb concentration changes expressed as percentage of change in relation to the pre-stimuli baseline in 10 controls during motor imagery (MI) and motor movement (MM).
| Mean (within-subject SEM) expressed as percentage of change | Mean (within-subject SEM) expressed as a change in μmol/L | |
|---|---|---|
| Left_hemisphere_oxy (MI) | − 0.3(2.4) | 0.029 (0.83) |
| Right_hemisphere_oxy(MI) | − 1.3(2.5) | − 0.089(0.81) |
| Left_hemisphere_oxy(MM) | − 9.9(0.3) | − 0.38(0.81) |
| Right_hemisphere_oxy(MM) | − 13.7(2.2) | − 0.64 (0.82) |
With deoxyHb as the dependent measure there was no significant interaction or main effects (p > 0.3. data not shown).
For the patients there was only one task (MI). In this group we looked for a group (healthy controls vs. VS/UWS group vs. MCS patients) ∗ hemisphere interaction. With oxyHb as the dependent measure we found no significant interaction (p = 0.40). We did however find a main effect of hemisphere F (1, 21) = 4.89, p = 0.038, with greater depression of oxyHb signal in the right > left hemisphere, compared with rest period (Fig. 4). A post-hoc analysis including only the two patient groups was also significant F (1, 12) = 9.14, p = 0.011 suggesting that this effect was not just being driven by the control subjects.
With deoxyHb as the dependent measure there was no significant interaction or main effect of group or hemisphere (p > 0.4. Data not shown).
3.2. Sub-analysis of M1 and SMA data
3.2.1. Main effect of task (controls only)
The control subjects showed greater responses during the motor movement compared with motor imagery in both SMA and M1. In right SMA oxyHb concentration mean changes were greater during MM − 0.59 SD (0.93) μmol/L then during MI − 0.13SD (0.97) μmol/L (p = 0.03). The same pattern was seen in the left SMA, where the oxyHb concentration changes were greater during MM − 0.36 SD (1.35) then during MI − 0.20 SD (1.23) (p = 0.05).
In right M1 oxyHb concentration changes during MM were greater − 0.66SD (1.42) then during MI − 0.05 SD (0.99) μmol/L respectively (p = 0.04). In left M1 we identified the same pattern but the difference was not statistically significant: changes of oxyHb during MM = − 0.40 SD (0.89) and MI = − 0.15 SD (0.90) (p = 0.2).
The changes of the deoxyHb in supplementary motor areas and primary motor cortex in relation to the task (MM vs. MI) did not reach statistical significance.
3.2.2. Main effect of hemisphere
In the motor movement task controls had significantly greater NIRS responses in right > left hemispheres (Table 4).
Table 4.
The oxy and deoxyHb concentration changes in μmol/L in the supplementary motor cortex (SMA), channels 1,2,5,6 (right), and 3,4,7,8, (left), and primary motor cortex (M1) channels 9,10,13,14 (right) and 11,12,5,16 (left) during the motor movement and motor imagery in healthy controls and a motor imagery in PDOC patients, SD - Standard Deviation, oxyHb - oxyhaemoglobin, deoxyHb - deoxyhaemoglobin, VS/UWS Vegetative/Unresponsive Wakefulness State, MCS - Minimally Conscious State, bold front indicates significant task effects and asterisk (*) indicates significant hemisphere effects.
| Spatial localisation | Healthy subjects (n = 10) |
pDOC patients |
||
|---|---|---|---|---|
| Motor movement | Motor imagery | MCS (n = 9) | VS/UWS (n = 5) | |
| SMA right | − 0.59 (SD = 0.93)oxyHb* | 0.13 (SD = 0.97)oxyHb | − 0.05 (SD = 0.2)oxyHb | − 0.08 (SD = 0.20)oxyHb |
| − 0.05 (SD = 0.25)deoxyHb* | 0.02 (SD 0.23)deoxyHb | − 0.01 (SD = 0.04)deoxyHb | − 0.08 (SD = 0.03)deoxyHb | |
| SMA left | − 0.36 (SD = 1.35)oxyHb* (p = 0.03) | − 0.20 (SD = 1.23)oxyHb | 0.38 (SD = 2.43)oxyHb | 0.19 (SD = 1.40)oxyHb |
| − 0.19 (SD = 0.56)deoxyHb* (p = 0.02) | − 0.13 (SD = 0.52)deoxyHb* | 0.05 (SD = 0.9)deoxyHb | 0.37 (SD = 0.88)deoxyHb | |
| M1 right | − 0.66 (SD = 1.42)oxyHb | − 0.05 (SD = 0.99)oxyHb | − 0.07 (SD = 0.83)oxyHb | − 0.08 (SD = 0.82)oxyHb |
| 0.02 (SD = 0.43)deoxyHb | 0.09 (SD = 0.30)deoxyHb | 0.03 (SD = 0.75)deoxyHb | − 0.21 (SD = 0.68)deoxyHb | |
| M1 left | − 0.40 (SD = 0.89)oxyHb | − 0.15 (SD = 0.90)oxyHb | 0.001 (SD = 1.10)oxyHb | 0.41 (SD = 1.21)oxyHb |
| − 0.05 (SD = 0.19)deoxyHb | − 0.04 (SD = 0.49)deoxyHb* (p = 0.02) | 0.06 (SD = 0.74)deoxyHb | 0.21 (SD = 0.86)deoxyHb | |
The control group showed significant differences between the SMA right vs. SMA left during MM for both oxyHb (− 0.59 μmol/L SD (0.93) vs. − 0.36 μmol/L SD 1.35oxyHb (p = 0.03)) and deoxyHb (− 0.05 μmol/L SD (0.25) vs. − 0.19 μmol/L SD (0.56) (p = 0.02)). During motor imagery only changes in deoxyHb (right SMA vs. left SMA)) were statistically significant (0.02 μmol/L SD 0.23 vs − 0.13 SD 0.52 μmol/L p = 0.05).
None of these analyses, using this subset of NIRS channels were significant in the pDOC patients.
4. Discussion
This study is the first report of the use of functional near infrared spectroscopy for brain function assessment in people in Vegetative State/Unresponsive Wakefulness syndrome and Minimally Conscious State. We determined patterns of fNIRS responses from healthy controls to both the motor movement and to motor imagery, and then we used these patterns for validation of fNIRS response in pDOC patients. We identified two main types of haemodynamic response patterns present in both the healthy subjects and the patient group.
4.1. Methodological considerations
The controls in this study performed both types of tasks (imagery and motor movement) while the pDOC patients performed only the motor imagery task. The healthy controls elicited stronger fNIRS responses during actual movement when compared to motor imagery. Previous studies on motor tasks showed that NIRS cortical responses should generate a change (Δ) in oxyHb ~ 0.5μmol/L and in deoxyHb (Δ) ~ 0.2μmol/L (Hirth et al., 1996, Wolf et al., 2002). Our control subjects had similar sized responses during the MM task. With regard to the MI task, our results are comparable with others, for instance Iso et.al. (Iso et al., 2015) and Wriessnegger et al. (Wriessnegger et al., 2008) showed similar level of haemodynamic response to a imagery motor task from SMA and M1 respectively.
Both the controls and the patients elicited different type of haemodynamic responses in regard to the polarity of haemoglobin concentration changes during the unilateral motor movement.
Although the initial studies suggested that the typical fNIRS response to movement and motor imagery is characterised by an increase in the concentration of oxyHb accompanied by a less pronounced decrease in deoxyHb level concentration (Sato et al., 2007), more recent studies report different patterns of fNIRS responses depending on the optical probe localisations and task difficulty (Mihara et al., 2012). For example, Morihiro et al. (Morihiro et al., 2009) showed that oxyHb response over the left primary motor cortex decreased over time during a repetitive, right-handed tapping task, while the channels covering the supplementary motor cortex recorded an increase. We averaged fNIRS signal over a broad area covering the premotor area, supplementary motor area (EEG corresponding areas FC3, FC1, FCz, FC2 and FC4) as well as the primary motor cortex (EEG corresponding areas C4, C2, Cz, C1 and C3), which may explain why healthy subjects and the patients tended to have an inverted oxyHb response. Task is also a factor, Holper et al. (Holper et al., 2011) found an inverse oxyHb response during motor imagery, which was related to the task difficulty, while the more complex task would produce stronger negativity of the oxyHb response. These factors may explain why we found both the typical and inverted haemodynamic responses in our study groups.
4.2. Interpretation of fNIRS response
Our main finding was that of a hemispheric difference in oxyHb depression in the right hemisphere across all three groups for the motor imagery task. This effect was not driven solely by the control subjects as a sub-analysis demonstrated that this effect was present in the VS/UWS and MCS patient groups alone. Motor imagery has been shown in many studies to be associated with a greater bilateral functional imaging signal than actual motor movements, particularly in pre-motor and supplementary motor areas (Binkofski et al., 2000, Pfurtscheller et al., 2006). Ipsilateral (right-hemisphere) signal changes have been reported in several fMRI studies, that is, BOLD not fNIRS response, in anterior frontal regions (BA 9, 10 and 11) (Sharma et al., 2006, Porro et al., 2000), but also in the precentral gyrus (BA 6) during hand movement imagery (Hanakawa et al., 2005). Another possible explanation of the inverted oxyHb results in fNIRS also derives from the fMRI BOLD studies. An ipsilateral “negative” BOLD response means an “U” shaped, as opposed to the bell-shaped MR signal changes, during an unimanual task activity was reported by McGregor et al., who suggested that this phenomenon is related to an active inhibition of cortical areas (McGregor et al., 2015). Another group showed that ipsilateral negative BOLD during a unimanual task reflects normal transcallosal inhibition, while its dissipation impairs motor activity (Lenzi et al., 2007).
4.3. Supplementary motor area versus primary motor cortex during an imagery and actual movement motor task
Traditionally, the human motor cortex is classified into a primary motor area activated during a motor movement and the secondary or higher order motor systems activated in learning, planning or initiation of the voluntary movements, and these include the SMA (Drenckhahn, Koch et al. 2015). Previous studies have shown that a simple motor movement elicits a maximal response over the primary motor cortex (Leff et al., 2011), and our results in healthy subjects are consistent with this finding. Additionally, the self-paced motor task is known to elicit stronger activity in the SMA (Wilson et al., 2014), which may explain why in our study group in both SMA and M1 showed activation during motor imagery and motor movement, however, for motor movement we observed M1 > SMA and during for motor imagery (SMA > M1).
We have carried out more detailed analyses of these effects using a Dynamic Casual Modelling for fNIRS and confirmed that motor imagery negatively modulates connections from SMA to M1, resulting in the suppressive influence of SMA on M1(Tak et al., 2015).
4.4. Vegetative state/unresponsive wakefulness state vs. minimally conscious state patients
We did not find statistically significant differences in fNIRS responses between the two patient groups, which may be because we only studied a small number with heterogeneous aetiology and pathophysiology of brain damage. Another possibility is dissociation between the clinical diagnosis and actual brain function. In our study the typical haemodynamic response was seen in four MCS patients (n = 9) and only one VS/UWS patient (n = 5), while the inverted haemodynamic response was present in two VS/UWS patients and four MCS patients. The unclassified response was in two VS/UWS and one MCS respectively. There are reports of subpopulations of VS/UWS patients who remain behaviourally unresponsive, but their brain function, as measured using fMRI or EEG techniques, is more in keeping with a diagnosis of MCS (Coleman et al., 2007, Schnakers et al., 2009, Monti et al., 2010, Cruse et al., 2012). This interpretation is supported by a recent review of PET, EEG and fMRI studies by Liberati et al. who demonstrated that only half of the publications reported statistically significant differences between VS/UWS and MCS patients (Liberati et al., 2014).
The assessment of the brain function in people with pDOC is complex and complicated by multiple interacting motor, sensory and cognitive impairments. Also cognitive and emotional processes are known to affect peripheral physiology including heart rate, respiration, blood pressure and skin perspiration which can affect NIRS measurements (Minati et al., 2011). It is not possible to fully control for these factors, however, a block-design paradigm (task versus resting state) should at least partially eliminate the background noise related to the physiological factors (Amaro and Barker, 2006). Nevertheless, taking these factors into account, we have demonstrated that fNIRS can be used to detect task-induced brain activity changes in pDOC patients using a motor imagery task. Our study showed that the MCS patients have more often the “typical” fNIRS response, and their haemodynamic response is similar to the fNIRS response from the controls. Given both its relatively low-cost and that it is well tolerated by patients in a clinical ward setting, certainly compared with fMRI, fNIRS represents a translatable imaging tool that can be used to gain new insights into brain function in patients with disorders of consciousness.
The following is the supplementary data related to this article.
Oxy and deoxyHb concentration changes during brain activation to a motor task and a pre-stimuli baseline in μmol/L at each NIRS channel. The calculation was performed using the modified Beer-Lambert law as described by Delpy. The data was mean corrected so that, at each time-point, the value represents the amplitude minus the average for the entire record for each channel. The absolute difference (Δabs) refers to the median difference between the signal amplitude before (7s + to 0 s) and during the task period (0 s to 7 s). The channels were numbered as on Fig. 1. VS - Vegetative State, MCS - Minimally Conscious state.
Declaration of conflicting interests
The authors declared no potential conflicts of interest with respect to the research, authorship, and/or publication of this article.
Acknowledgements
The authors thank to the staff of the Royal Hospital for Neuro-disability for their availability and volunteering in the study. The authors also wanted to thank the relatives and the patients for their assistance in participating in this study. AMK and KY are funded be a Neuro-disability Research Trust (RHN 11/2). SFF and APL acknowledge support from the UCLH Biomedical Research Centre.
References
- Amaro E., Jr., Barker G.J. Study design in fMRI: basic principles. Brain Cogn. 2006;60(3):220–232. doi: 10.1016/j.bandc.2005.11.009. [DOI] [PubMed] [Google Scholar]
- Andrews K., Murphy L. Misdiagnosis of the vegetative state: retrospective study in a rehabilitation unit. BMJ. 1996;313(7048):13–16. doi: 10.1136/bmj.313.7048.13. [DOI] [PMC free article] [PubMed] [Google Scholar]
- Bhambhani Y., Maikala R. Reliability of near-infrared spectroscopy measures of cerebral oxygenation and blood volume during handgrip exercise in nondisabled and traumatic brain-injured subjects. J. Rehabil. Res. Dev. 2006;43(7):845–856. doi: 10.1682/jrrd.2005.09.0151. [DOI] [PubMed] [Google Scholar]
- Binkofski F., Amunts K. Broca's region subserves imagery of motion: a combined cytoarchitectonic and fMRI study. Hum. Brain Mapp. 2000;11(4):273–285. doi: 10.1002/1097-0193(200012)11:4<273::AID-HBM40>3.0.CO;2-0. [DOI] [PMC free article] [PubMed] [Google Scholar]
- Boden S., Obrig H. The oxygenation response to functional stimulation: is there a physiological meaning to the lag between parameters? NeuroImage. 2007;36(1):100–107. doi: 10.1016/j.neuroimage.2007.01.045. [DOI] [PubMed] [Google Scholar]
- Bruno M.A., Vanhaudenhuyse A. From unresponsive wakefulness to minimally conscious PLUS and functional locked-in syndromes: recent advances in our understanding of disorders of consciousness. J. Neurol. 2011;258(7):1373–1384. doi: 10.1007/s00415-011-6114-x. [DOI] [PubMed] [Google Scholar]
- Chouinard P.A., Paus T. The primary motor and premotor areas of the human cerebral cortex. Neuroscientist. 2006;12(2):143–152. doi: 10.1177/1073858405284255. [DOI] [PubMed] [Google Scholar]
- Coleman M.R., Rodd J.M. Do vegetative patients retain aspects of language comprehension? Evidence from fMRI. Brain. 2007;130(Pt 10):2494–2507. doi: 10.1093/brain/awm170. [DOI] [PubMed] [Google Scholar]
- Cruse D., Chennu S. Detecting awareness in the vegetative state: electroencephalographic evidence for attempted movements to command. PLoS One. 2012;7(11) doi: 10.1371/journal.pone.0049933. [DOI] [PMC free article] [PubMed] [Google Scholar]
- Di Perri C., Heine L. Technology-based assessment in patients with disorders of consciousness. Ann. Ist. Super. Sanita. 2014;50(3):209–220. doi: 10.4415/ANN_14_03_03. [DOI] [PubMed] [Google Scholar]
- Drenckhahn C., Koch S.P. A validation study of the use of near-infrared spectroscopy imaging in primary and secondary motor areas of the human brain. Epilepsy Behav. 2015;49:118–125. doi: 10.1016/j.yebeh.2015.04.006. [DOI] [PubMed] [Google Scholar]
- Giacino J.T., Ashwal S. The minimally conscious state: definition and diagnostic criteria. Neurology. 2002;58(3):349–353. doi: 10.1212/wnl.58.3.349. [DOI] [PubMed] [Google Scholar]
- Gill-Thwaites H., Munday R. The Sensory Modality Assessment and Rehabilitation Technique (SMART): a valid and reliable assessment for vegetative state and minimally conscious state patients. Brain Inj. 2004;18(12):1255–1269. doi: 10.1080/02699050410001719952. [DOI] [PubMed] [Google Scholar]
- Grafton S.T. Cortical control of movement. Ann. Neurol. 1994;36(1):3–4. doi: 10.1002/ana.410360103. [DOI] [PubMed] [Google Scholar]
- Guillot A., Collet C. Brain activity during visual versus kinesthetic imagery: an fMRI study. Hum. Brain Mapp. 2009;30(7):2157–2172. doi: 10.1002/hbm.20658. [DOI] [PMC free article] [PubMed] [Google Scholar]
- Hanakawa T., Parikh S. Finger and face representations in the ipsilateral precentral motor areas in humans. J. Neurophysiol. 2005;93(5):2950–2958. doi: 10.1152/jn.00784.2004. [DOI] [PMC free article] [PubMed] [Google Scholar]
- Hirth C., Obrig H. Non-invasive functional mapping of the human motor cortex using near-infrared spectroscopy. Neuroreport. 1996;7(12):1977–1981. doi: 10.1097/00001756-199608120-00024. [DOI] [PubMed] [Google Scholar]
- Holper L., Shalom D.E. Understanding inverse oxygenation responses during motor imagery: a functional near-infrared spectroscopy study. Eur. J. Neurosci. 2011;33(12):2318–2328. doi: 10.1111/j.1460-9568.2011.07720.x. [DOI] [PubMed] [Google Scholar]
- Iso N., Moriuchi T. Monitoring local regional hemodynamic signal changes during motor execution and motor imagery using near-infrared spectroscopy. Front. Physiol. 2015;6:416. doi: 10.3389/fphys.2015.00416. [DOI] [PMC free article] [PubMed] [Google Scholar]
- Jennett B., Plum F. Persistent vegetative state after brain damage. A syndrome in search of a name. Lancet. 1972;1(7753):734–737. doi: 10.1016/s0140-6736(72)90242-5. [DOI] [PubMed] [Google Scholar]
- Jobsis F.F. Noninvasive, infrared monitoring of cerebral and myocardial oxygen sufficiency and circulatory parameters. Science. 1977;198(4323):1264–1267. doi: 10.1126/science.929199. [DOI] [PubMed] [Google Scholar]
- Klem G.H., Luders H.O. The ten-twenty electrode system of the international federation. The International Federation of Clinical Neurophysiology. Electroencephalogr. Clin. Neurophysiol. Suppl. 1999;52:3–6. [PubMed] [Google Scholar]
- Laureys S., Celesia G.G. Unresponsive wakefulness syndrome: a new name for the vegetative state or apallic syndrome. BMC Med. 2010;8:68. doi: 10.1186/1741-7015-8-68. [DOI] [PMC free article] [PubMed] [Google Scholar]
- Leff D.R., Orihuela-Espina F. Assessment of the cerebral cortex during motor task behaviours in adults: a systematic review of functional near infrared spectroscopy (fNIRS) studies. NeuroImage. 2011;54(4):2922–2936. doi: 10.1016/j.neuroimage.2010.10.058. [DOI] [PubMed] [Google Scholar]
- Lenzi D., Conte A. Effect of corpus callosum damage on ipsilateral motor activation in patients with multiple sclerosis: a functional and anatomical study. Hum. Brain Mapp. 2007;28(7):636–644. doi: 10.1002/hbm.20305. [DOI] [PMC free article] [PubMed] [Google Scholar]
- Liberati G., Hunefeldt T. Questioning the dichotomy between vegetative state and minimally conscious state: a review of the statistical evidence. Front. Hum. Neurosci. 2014;8:865. doi: 10.3389/fnhum.2014.00865. [DOI] [PMC free article] [PubMed] [Google Scholar]
- Majerus S., Gill-Thwaites H. Behavioral evaluation of consciousness in severe brain damage. Prog. Brain Res. 2005;150:397–413. doi: 10.1016/S0079-6123(05)50028-1. [DOI] [PubMed] [Google Scholar]
- McGregor K.M., Sudhyadhom A. Reliability of negative BOLD in ipsilateral sensorimotor areas during unimanual task activity. Brain Imaging Behav. 2015;9(2):245–254. doi: 10.1007/s11682-014-9302-3. [DOI] [PubMed] [Google Scholar]
- Mihara M., Miyai I. Neurofeedback using real-time near-infrared spectroscopy enhances motor imagery related cortical activation. PLoS One. 2012;7(3) doi: 10.1371/journal.pone.0032234. [DOI] [PMC free article] [PubMed] [Google Scholar]
- Minati L., Kress I.U. Intra- and extra-cranial effects of transient blood pressure changes on brain near-infrared spectroscopy (NIRS) measurements. J. Neurosci. Methods. 2011;197(2):283–288. doi: 10.1016/j.jneumeth.2011.02.029. [DOI] [PMC free article] [PubMed] [Google Scholar]
- Monti M.M., Vanhaudenhuyse A. Willful modulation of brain activity in disorders of consciousness. N. Engl. J. Med. 2010;362(7):579–589. doi: 10.1056/NEJMoa0905370. [DOI] [PubMed] [Google Scholar]
- Morihiro M., Tsubone T. Relation between NIRS signal and motor capability. Conf. Proc. IEEE Eng. Med. Biol. Soc. 2009;2009:3991–3994. doi: 10.1109/IEMBS.2009.5333526. [DOI] [PubMed] [Google Scholar]
- Murkin J.M., Arango M. Near-infrared spectroscopy as an index of brain and tissue oxygenation. Br. J. Anaesth. 2009;103(Suppl. 1):i3–13. doi: 10.1093/bja/aep299. [DOI] [PubMed] [Google Scholar]
- Pellicer A., Greisen G. The SafeBoosC phase II randomised clinical trial: a treatment guideline for targeted near-infrared-derived cerebral tissue oxygenation versus standard treatment in extremely preterm infants. Neonatology. 2013;104(3):171–178. doi: 10.1159/000351346. [DOI] [PubMed] [Google Scholar]
- Pfurtscheller G., Brunner C. Mu rhythm (de)synchronization and EEG single-trial classification of different motor imagery tasks. NeuroImage. 2006;31(1):153–159. doi: 10.1016/j.neuroimage.2005.12.003. [DOI] [PubMed] [Google Scholar]
- Porro C.A., Cettolo V. Ipsilateral involvement of primary motor cortex during motor imagery. Eur. J. Neurosci. 2000;12(8):3059–3063. doi: 10.1046/j.1460-9568.2000.00182.x. [DOI] [PubMed] [Google Scholar]
- RCP . 2013. Prolonged Disorders of Consciousness National Clinical Guidelines. [Google Scholar]
- Rizzolatti G., Luppino G. The cortical motor system. Neuron. 2001;31(6):889–901. doi: 10.1016/s0896-6273(01)00423-8. [DOI] [PubMed] [Google Scholar]
- Sato T., Ito M. Time courses of brain activation and their implications for function: a multichannel near-infrared spectroscopy study during finger tapping. Neurosci. Res. 2007;58(3):297–304. doi: 10.1016/j.neures.2007.03.014. [DOI] [PubMed] [Google Scholar]
- Schnakers C., Vanhaudenhuyse A. Diagnostic accuracy of the vegetative and minimally conscious state: clinical consensus versus standardized neurobehavioral assessment. BMC Neurol. 2009;9:35. doi: 10.1186/1471-2377-9-35. [DOI] [PMC free article] [PubMed] [Google Scholar]
- Scholkmann F., Kleiser S. A review on continuous wave functional near-infrared spectroscopy and imaging instrumentation and methodology. NeuroImage. 2014;85(Pt 1):6–27. doi: 10.1016/j.neuroimage.2013.05.004. [DOI] [PubMed] [Google Scholar]
- Sharma N., Pomeroy V.M. Motor imagery: a backdoor to the motor system after stroke? Stroke. 2006;37(7):1941–1952. doi: 10.1161/01.STR.0000226902.43357.fc. [DOI] [PubMed] [Google Scholar]
- Tak S., Kempny A.M. Dynamic causal modelling for functional near-infrared spectroscopy. NeuroImage. 2015;111:338–349. doi: 10.1016/j.neuroimage.2015.02.035. [DOI] [PMC free article] [PubMed] [Google Scholar]
- Vanhaudenhuyse A., Schnakers C. Assessment of visual pursuit in post-comatose states: use a mirror. J. Neurol. Neurosurg. Psychiatry. 2008;79(2):223. doi: 10.1136/jnnp.2007.121624. [DOI] [PubMed] [Google Scholar]
- Wilson T.W., Kurz M.J. Functional specialization within the supplementary motor area: a fNIRS study of bimanual coordination. NeuroImage. 2014;85(Pt 1):445–450. doi: 10.1016/j.neuroimage.2013.04.112. [DOI] [PMC free article] [PubMed] [Google Scholar]
- Wolf M., Wolf U. Different time evolution of oxyhemoglobin and deoxyhemoglobin concentration changes in the visual and motor cortices during functional stimulation: a near-infrared spectroscopy study. NeuroImage. 2002;16(3 Pt 1):704–712. doi: 10.1006/nimg.2002.1128. [DOI] [PubMed] [Google Scholar]
- Wriessnegger S.C., Kurzmann J. Spatio-temporal differences in brain oxygenation between movement execution and imagery: a multichannel near-infrared spectroscopy study. Int. J. Psychophysiol. 2008;67(1):54–63. doi: 10.1016/j.ijpsycho.2007.10.004. [DOI] [PubMed] [Google Scholar]
Associated Data
This section collects any data citations, data availability statements, or supplementary materials included in this article.
Supplementary Materials
Oxy and deoxyHb concentration changes during brain activation to a motor task and a pre-stimuli baseline in μmol/L at each NIRS channel. The calculation was performed using the modified Beer-Lambert law as described by Delpy. The data was mean corrected so that, at each time-point, the value represents the amplitude minus the average for the entire record for each channel. The absolute difference (Δabs) refers to the median difference between the signal amplitude before (7s + to 0 s) and during the task period (0 s to 7 s). The channels were numbered as on Fig. 1. VS - Vegetative State, MCS - Minimally Conscious state.