

Abstract
Purpose
The goal of this study was to identify second-generation mithramycin analogs that better target the EWS-FLI1 transcription factor for Ewing sarcoma. We previously established mithramycin as an EWS-FLI1 inhibitor, but the compound’s toxicity prevented its use at effective concentrations in patients.
Experimental Design
We screened a panel of mithralogs to establish their ability to inhibit EWS-FLI1 in Ewing sarcoma. We compared the IC50 to the maximum tolerated dose established in mice to determine the relationship between efficacy and toxicity. We confirmed the suppression of EWS-FLI1 at the promoter, mRNA, gene signature, and protein levels. We established an improved therapeutic window by using time-lapse microscopy to model the effects on cellular proliferation in Ewing sarcoma cells relative to HepG2 control cells. Finally, we established an improved therapeutic window using a xenograft model of Ewing sarcoma.
Results
EC-8105 was found to be the most potent analog and was able to suppress EWS-FLI1 activity at concentrations nontoxic to other cell types. EC-8042 was substantially less toxic than mithramycin in multiple species but maintained suppression of EWS-FLI1 at similar concentrations. Both compounds markedly suppressed Ewing sarcoma xenograft growth and inhibited EWS-FLI1 in vivo.
Conclusions
These results provide a basis for the continued development of EC-8042 and EC-8105 as EWS-FLI1 inhibitors for the clinic.
Introduction
Ewing sarcoma is a bone and soft-tissue sarcoma with an overall survival of only 55% (1, 2). Survival is 70% for patients with localized disease treated on a compressed schedule (3), but patients with high-risk relapsed or metastatic disease have a survival rate of less than 30% (4). In addition, patients receive chemotherapy that has significant short- and long-term side effects (5). Therefore, there is a need to develop new, less toxic, and more effective therapies for this tumor type.
Ewing sarcoma has a unique dependence on the EWS-FLI1 transcription factor for cell survival (6). Since the identification of EWS-FLI1 in the early 1990s, independent studies have established that the tumor absolutely depends on the activity of EWS-FLI1 for continued proliferation (6, 7), yet the clinical realization of an EWS-FLI1 directed therapy has not been achieved.
A number of compounds have been identified as EWS-FLI1 inhibitors, including cytarabine, YK-4-279, trabectedin, mithramycin, midostaurin, low-dose actinomycin, shikonin, and HCI2509 (8–14). Most of these compounds show an effect on the EWS-FLI1 transcriptional program and reverse the expression of well-established EWS-FLI1 targets such as NR0B1 and PHLDA1 (midostaurin, shikonin) and/or reverse the gene signature of EWS-FLI1 on a genome-wide scale (cytarabine, trabectedin, mithramycin, low-dose actinomycin, and HCI2509). Unfortunately, the compounds that have made it to the clinic have failed in Phase II trials (15, 16). Furthermore, we don’t know whether these compounds achieved the exposure necessary to suppress EWS-FLI1 in these trials.
We screened more than 50,000 compounds to identify mithramycin as an inhibitor of EWS-FLI1 (11). We showed that the drug blocks the expression of critical EWS-FLI1 downstream targets at the mRNA and protein levels both in vitro and in vivo, and it reverses the expression of the EWS-FLI1 gene signature on a genome-wide scale (11). In addition, mithramycin shows an excellent (low nmol/L) IC50 in vitro and good suppression of Ewing sarcoma xenograft growth. These results reflected clinical reports from the 1960s of the activity of the drug in Ewing sarcoma patients. Therefore, we translated the compound to the clinic in a Phase I/II trial (17, 18). The compound was well tolerated, but liver toxicity limited serum concentrations of the drug to values that our preclinical models predicted would not be high enough to inhibit EWS-FLI1 (17 nmol/L vs. 50 nmol/L)(manuscript in preparation). Therefore, the trial was closed to accrual.
The goal of this study was to identify a second-generation mithramycin that can achieve serum levels high enough to block EWS-FLI1 activity in patients. The approach was to characterize either a compound with a similar toxicity profile but more potent inhibition of EWS-FLI1 or a compound that maintained suppression of EWS-FLI1 at similar concentration but was less toxic, thus allowing larger doses to be administered. In order to accomplish this, we generated a panel of more than 20 mithramycin analogs for their ability to reverse EWS-FLI1 activity. Mithramycin chemical space was expanded by genetic engineering of the MMA biosynthesis pathway and enzymatic biocatalysis to generate mithralogs showing both lower toxicity and higher biological activity (19–21). We found several mithralogs that suppressed EWS-FLI1 to a comparable or greater extent than mithramycin. In this report, we show that EC-8105 was a more potent EWS-FLI1 inhibitor than mithramycin and yet maintained a comparable toxicity profile. We also show that a different analog, EC-8042, maintained comparable suppression of EWS-FLI1 but was one order of magnitude less toxic than the parent compound. Both compounds suppressed EWS-FLI1 at the mRNA and protein levels in vitro and in vivo and showed excellent activity in Ewing sarcoma xenografts. Together, the results provide a basis for the further development of these compounds as targeted therapies for Ewing sarcoma.
Materials and Methods
Cell Lines, Cell Culture, and Reagents
TC32 and TC71 Ewing sarcoma cells were the gift of Dr. T. Triche (The Saban Research Hospital, Children’s Hospital of Los Angeles, CA). HepG2 cells were obtained from the American Type Culture Collection (ATCC, Manassas, VA). RH30, RD and U2OS cells were the gift of Lee Helman. The identity of all cells was independently authenticated by short tandem repeat genotyping. All cells were maintained in culture in RPMI 1640 (Invitrogen, Carlsbad, CA) with the exception of HepG2 which was cultured in EMEM (ATCC, Manassas, VA). Medium was supplemented with 10% fetal bovine serum (Gemini Bio-Products, West Sacramento, CA), 2mM L-Gln, 100U/mL and 100μg/mL penicillin and streptomycin respectively (ThermoFisher, Waltham, MA).
Compounds
Mithramycin and all analogs were obtained from EntreChem SL Biotechnology (Oviedo, Spain). All compounds were aliquoted, stored frozen, and thawed immediately before use.
Luciferase Assays
TC32 cells stably expressing the NR0B1 luciferase reporter were incubated in triplicate with each of the analogs of mithramycin over concentrations from 500 to 0.1 nmol/L for 12 h. Cell were lysed and the bioluminescence was quantified using Steady-Glo luciferase (Promega, Madison, WI) as previously described (11).
Quantitative RT-PCR
TC32 cells (0.3 × 10⁶) were exposed to compound and RNA was collected using the RNEasy Kit with QIAshredder (Qiagen, Valencia, CA), immediately reverse-transcribed using a High Capacity cDNA Synthesis Kit (Life Technologies, Carlsbad CA) on a Veriti thermocycler (Life Technologies) and PCR-amplified using SYBR green master mix (BioRad, Hercules, CA) and the CFX 384 Real Time System (BioRad) with the following program: 95 °C for 10 min, 95 °C for 30 s, 55 °C for 30 s, and 72 °C for 30 s for 40 cycles. The expression of target genes was determined using standard ΔΔCT methods and normalized to GAPDH control. See supplementary table S1 for the list of target genes and corresponding primers. Heat maps were created using R v 3.2.2 (R Foundation for Statistical Computing, Vienna, Austria) and comprise delta-delta Ct scores truncated between −3 and 3 to prevent very large scores from oversaturating the color gradient.
Immunoblot Analysis
TC32 and TC71 cells (1.5 × 10⁶) were incubated with drug, collected, washed with PBS, lysed and boiled in 4% LDS buffer (0.125 M Trizma hydrochloride buffer solution, pH 7.5, and 4% lithium dodecyl sulfate (Sigma-Aldrich, St. Louis, MO). Protein concentrations were determined after diluting the detergent using the bicinchoninic acid (BCA) assay kit (Pierce Protein Biology Products, Carlsbad, CA). Thirty micrograms of protein was resolved on a 4–12% NuPAGE Bis-Tris Mini gels (Invitrogen, Carlsbad, CA) in 1x 4-morpholinepropanesulfonic acid (MOPS) sodium dodecyl sulfate (SDS) buffer (Invitrogen), transferred to nitrocellulose (GE Healthcare Life Sciences, Pittsburgh, PA) and probed with the following antibodies: rabbit monoclonal anti-EZH2 (1:1,000, Cell Signaling, Danvers, MA), mouse monoclonal anti-FLI1 (1:1,000, Abcam, Cambridge, MA), mouse polyclonal anti-ACTB (1:1,000, Cell Signaling), rabbit polyclonal anti-NR0B1 (1:500, Abcam), mouse monoclonal anti-phospho-histone H2A.X (Ser139) (1:1,0000, Millipore, Billerica, MA), and rabbit monoclonal anti-ID2 (1:1,000, Cell Signaling). The protein was visualized by using horseradish peroxidase (HRP)-conjugated secondary antibody and ECL (Amersham, Buckinghamshire, UK).
Cell Proliferation Assays
IC50s were determined by non-linear regression from at least 3 independent experiments at 48 hours using Prism GraphPad (LaJolla, CA). Cytotoxicity relative to a panel of other pediatric tumors (including leukemia, lymphoma and other solid tumor cell lines) was determined by the Pediatric Preclinical Testing Program at 96 h as previously described (22).
Animal Experiments for toxicology
Healthy CD-1 mice (n=3) provided by the University of Oviedo SPF Vivarium were treated with single or repeated intravenous injections of mithralogs, using saline solution as vehicle. For repeat dose treatment, drugs were administered by intravenous injections every three days for 8 doses (q3d x 8). Body weight, deaths, changes in behavior, motility, eating and drinking habits, and any other sign of local or systemic toxicity were recorded daily. All experiments were performed in accordance with the guidelines and regulation of and approved by the Animal Care and Use Committee at University of Oviedo, Spain.
Time-Lapse Microscopy
TC32 and HepG2 cells were incubated with drug as above and imaged every 2 h on the IncuCyte Zoom (Essen Bioscience, Ann Arbor, MI). Confluence of cells in each well was measured using IncuCyte Zoom software by a proprietary algorithm that determines the percent confluence of each well continuously in real time. End point confirmation was performed by standard MTS assay and the manufacturers protocol (Promega).
Immunocytochemistry
TC32 cells and HepG2 cells were incubated with drug in Lab-Tek II 4 chamber wells (Nunc, Carlsbad, CA), fixed in 4% paraformaldehyde in PBS, washed, and permeabilized in 1% Triton X-100. Cells were blocked with 10% goat serum and expression was determined with anti-phospho-histone H2A.X (ser139) antibody (1:200, Millipore) and Alexa647–labeled anti-mouse immunoglobulin G (1:200, Life technologies) on a Zeiss 510 confocal microscope in the presence of DAPI in VectaShield mounting medium (Vector Labs, Burlingame, CA), with standard settings that were not changed among treatment groups as previously described (23).
Xenograft Experiments
Two million TC71 cells were injected intramuscularly in the left gastrocnemius of female 6-week old female homozygous nude mice (Crl; Nu-Foxn1Nu)(Charles River Laboratories, Fredrick, MD) and established to a minimum diameter of 0.5 cm. Four cohorts of 12 mice were treated with vehicle; 1 or 1.5 mg/kg of EC-8105; or 24 mg/kg of EC-8042, administered either intraperitoneally and intravenously starting on day zero and on a Monday/Wednesday/Friday (M/W/F)(IP) schedule or Q3D schedule (IV) for eight doses. Tumor volume was measured 3 times per week and determined using the equation (D x d2)/6 × 3.12 (where D is the maximum diameter and d is the minimum diameter). Tissue was collected and fixed in 10% formalin from two mice in each cohort on days 2 and 4 for immunohistochemical analysis. The remaining mice were sacrificed when the tumor diameter reached 2 cm in any dimension. All experiments were performed in accordance with the guidelines and regulation of, and approved by, the Animal Care and Use Committee at Vanderbilt University, Nashville, TN or in accordance with Animal Care and Use Committee of Southern Research Institute. Investigators were not blinded to the treatment groups.
Immunofluorescence
Paraffin embedded tissue was sectioned into 5 micrometer sections and mounted on colormark plus charged slides. Antigen retrieval was performed in Ventana CC1 and automated staining was performed using the Ventana Discovery, NR0B1 primary (1:50), Ventana Ultramap Rb (HRP; 16 min) and Ventana Discovery Cy5 amplification.
Statistical Analysis
ANOVA with Tukey-HSD post-hoc tests were used to determine if the means of multiple groups were significantly different. Normality was assumed for all tests and was verified visually. Homoscedasticity was assessed via Bartlett’s test; if this test was significant, then Welch’s t-tests with Bonferroni multiple testing corrections were used instead of ANOVA. Linear mixed-effects models with random slopes were used to determine if tumor growth rates were significantly different between treatment groups, while mice were on treatment. Lastly log-rank tests were used to determine if survival times were significantly different between multiple treatment groups. Analyses were performed in R V 3.2.2 (https://www.r-project.org/) and Graphpad V 6.0F (http://www.graphpad.com/).
Results
EC-8105 blocked EWS-FLI1 activity more potently than mithramycin
To identify mithramycin analogs that more potently target the EWS-FLI1 transcription factor, we performed a luciferase screen of 22 mithramycin analogs and evaluated the effect of treatment on the activity of EWS-FLI1 in cells expressing a stable EWS-FLI1 driven luciferase construct (Fig. 1A)(24, 25). These cells utilize the NR0B1 promoter to drive expression of luciferase. This promoter contains the GGAA microsatellite that EWS-FLI1 utilizes to drive gene expression (26). Most of the compounds suppressed EWS-FLI1 to a comparable extent as mithramycin (MMA) itself. However, EC-8105 (grey arrow) improved the suppression of EWS-FLI1 by almost 10-fold, with an IC50 of 2 nmol/L (95% CI, 2–3) as opposed to 17 nmol/L (95% CI, 15–18) for MMA (Fig. 1B). Furthermore, the analog that does not bind DNA, EC-8041, showed a virtual loss of activity (IC50 348 nmol/L, 95% CI, 316–381), more than 150 times lower than EC-8105 activity (Fig. 1B).
Figure 1. EC-8105 is a more potent EWS-FLI1 transcription factor inhibitor than mithramycin.

A, IC50 of suppression of EWS-FLI1 activity for a panel of mithramycin (MMA, black arrow) and mithramycin analogs including EC-8105 (grey arrow); graphs separated due to disparity in scale. B, Dose–response curve and corresponding IC50 of suppression of EWS-FLI1 activity as determined by nonlinear regression for EC-8105 relative to EC-8041 (non-DNA binding) and mithramycin (MMA). C, Mean (±SEM) fold change in NR0B1 expression as a function of GAPDH (2ΔΔCT) for a 12 hr treatment with solvent control (S) or compound. D, Cell viability IC50 (nmol/L) for EC-8105 and mithramycin at 48 h of treatment as determined by nonlinear regression from 3 independent experiments. E, Heat map of ΔΔCt score as a measure of induction (red) or repression (blue) of expression for EWS-FLI1-induced (top) and repressed (bottom) targets as a function of GAPDH for EC-8105 treatment at 15 nM for 18 h or 3 h, respectively. F, Western blots from TC32 and TC71 cell lines showing the effect of mithramycin or EC-8105 treatment for 18 hours at the indicated concentrations (nmol/L) on EWS/FLI1 and downstream target expression (EZH2, NR0B1, and ID2), with ACTB as a loading control. All qPCR data is the average of 3 independent experiments and all other results are representative of 3 independent experiments.
To confirm these results, we evaluated the effect of drug treatment on the mRNA expression of NR0B1 using quantitative PCR (qPCR). Treatment of TC32 Ewing sarcoma cells with 50 nmol/L EC-8105 improved the suppression of NR0B1 expression by a factor of 5, from the MMA fold change of 0.48 (95% CI, 0.37 to 0.61, P <0.0001) to the EC-8105 fold change of 0.10 (95% CI, 0.06–0.1, P <0.0001)(Fig. 1C). Again, the non-DNA binding mithramycin analog EC-8041 showed no suppression of NR0B1, with a fold change of 0.99 (95% CI, 0.94–1.0). In addition, at concentrations that should be achievable in patients (see below), there was marked suppression of EWS-FLI1 activity as measured by NR0B1 mRNA expression, with EC-8105 at 15 nmol/L showing a fold change of 0.19 (95% CI, 0.17–0.20) and at 5 nmol/L showing statistically significant suppression at a fold change of 0.68 (95% CI, 0.58–0.78; P = 0.0002)(Supplementary Fig. S3A). Finally, the suppression of EWS-FLI1 observed in these studies translates into a marked suppression in cell viability and an IC50 of 3.29 nmol/L (95% CI, 3.1–3.5) for EC-8105, which is again substantially lower than the IC50 of MMA of 15.5 nmol/L (95% CI, 14.7–17.1)(Fig. 1D).
EC-8105 suppressed an EWS-FLI1 gene signature
To confirm that the effect of EC-8105 treatment extends to other EWS-FLI1 targets, we evaluated the expression of a gene signature of EWS-FLI1. EWS-FLI1 is known to both induce and suppress expression of its target genes by binding DNA to either establish enhancers or displace the binding of other ETS family members (26). This translates into a change in expression of more than 500 genes (27), but no definitive list of EWS-FLI1 targets exists. Therefore, we randomly selected a panel of EWS-FLI1 target genes to reflect both direct and indirect targets established by both genome-wide techniques and specific dedicated studies (see Supplementary Table S2 for evidence, S1 for primers)(11, 12, 24, 27–45). Next, we verified that siRNA silencing of EWS-FLI1 did in fact lead to the suppression of the EWS-FLI1 induced targets and induction of the suppressed targets (Supplementary Fig. S3B and S3C). We used both induced and suppressed targets to account for both mechanisms of EWS-FLI1 activity and to rule out a general effect on transcription, because a general inhibitor of RNAPII would not be expected to induce gene expression.
We utilized quantitative to PCR to show that 15 nM EC-8105 reversed the gene signature of EWS-FLI1 for both induced and suppressed targets as shown in the heat map (Fig. 1E). All five EWS-FLI1 repressed genes were induced with a 3-hour treatment at 15 nmol/L EC-8105. In addition, all 14 EWS-FLI1-induced target genes were suppressed by treating TC32 Ewing sarcoma cells with 15 nmol/L EC-8105 for 18 hours (Fig. 1E).
EC-8105 suppressed the protein expression of EWS-FLI1 target genes
Next, we showed that this suppression of EWS-FLI1 targets at both the promoter and mRNA levels extends to the protein level in Ewing sarcoma cells. Treatment of TC32 and TC71 cells over a range of concentrations of EC-8105 or mithramycin for 18 h suppressed expression of the EWS-FLI1 target genes EZH2, NR0B1, and ID2 without suppressing EWS-FLI1 expression or the housekeeping gene ACTB (Fig. 1F). It is notable that EC-8105 achieved similar suppression of EWS-FLI1 targets at 5 to 15 nmol/L as was seen at 50 to 100 nmol/L of mithramycin (Fig. 1F).
EC-8105 and mithramycin showed a similar maximum tolerated dose
In order to determine whether the improved suppression of EWS-FLI1 comes at the expense of increased toxicity, we performed toxicity studies on the majority of the analogs to determine the maximum tolerated dose (MTD)(Table 1; structures of lead compounds shown). Mice tolerated EC-8105 and mithramycin to a similar extent: EC-8105 had an MTD less than 4 mg/kg intravenously, versus 2 mg/kg for mithramycin. The majority of the analogs were at least equally as well-tolerated as mithramycin; inactive compounds were not evaluated (see Supplementary Fig. S4A and S4B for structures)
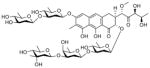
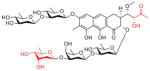
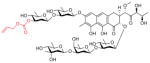
Table 1.
Maximum tolerated dose of mithramycin and analogs in the mouse. Structures of lead compounds shown for mithramycin (MMA), EC-8042 and EC-8105. See supplementary S4A,B for all other structures and NSC numbers.
| Structure | Intraperitoneal | Intravenous | |
|---|---|---|---|
| EC-code | MTD (mg/kg) | MTD (mg/kg) | |
| MMA (EC-7071) |
|
1.5a | 2 |
| EC-7073 | * n.d. | <4 | |
| EC-7092 | * n.d. | <4 | |
| EC-8042 |
|
200 | 64 |
| EC-8043 | 50 | * n.d. | |
| EC-8044 | 6.25 | <4 | |
| EC-8062 | 1.5 | <4 | |
| EC-8063 | 12.5 | <4 | |
| EC-8071 | 12.5 | <4 | |
| EC-8072 | * n.d. | <8 | |
| EC-8074 | 3.13 | <4 | |
| EC-8073 | 25 | * n.d. | |
| EC-8105 |
|
* n.d. | <4 |
| EC-8106 | * n.d. | <4 | |
| EC-8108 | * n.d. | 8 | |
| EC-7072 | * n.d. | 32 | |
| EC-9012 | * n.d. | <4 |
Data from the DTP website at the NCI
n.d. = not determined
EC-8042 is a less toxic analog of mithramycin
One mithramycin analog, EC-8042, was substantially less toxic than any of the other compounds. EC-8042 had an MTD in mice of 200 mg/kg intraperitoneally and 64 mg/kg intravenously that is 130 or 32 times higher than the MTD of mithramycin (EC7071). In order to confirm that the drug is in fact less toxic, we compared the toxicity of mithramycin to EC-8042 in another species, the rat. We found that treatment of the rat with 0.8 mg/kg of mithramycin intravenously recapitulated the human toxicity profile causing almost no myelosuppression and instead lead to an immediate increase in circulating ALT and AST, to 46.99 U/L (SD +/− 4.30) and 149.20 U/L (SD +/− 6.64) following drug administration (Fig. 2A and 2C). In contrast, there was no elevation in ALT or AST with a 5 times higher dose of EC-8042. Indeed, the animals required almost a 10 times higher dose to show the same increase in circulating liver enzymes (Fig. 2A). Furthermore, EC-8042 showed no evidence of other toxicities such as myelosuppression or more progressive liver damage leading to a compromise of liver synthetic function even at 8 mg/kg dose (Fig. 2B and 2C). This improved toxicity profile translated into substantially higher serum levels of drug in mice from 385 nmol/L for mithramycin (at the MTD) to 4295 nmol/L with EC-8042 (at <20% of the MTD)(Fig. 2D). Additionally, based on PK data from rats and dogs dosed intravenously every three days, we predicted by allometric scaling an increase in the MTD for patients from 0.07 mg/kg for mithramycin to 0.59 mg/kg for EC-8042; an order of magnitude higher than mithramycin (46)(Supplementary Fig. S4C).
Figure 2. EC-8042 is a less toxic mithramycin analog.

EC-8042 had a less pronounced effect on A, liver enzymes; B, liver synthetic function; and C, hematopoiesis in rats after doses of 0.8 mg/kg IV of mithramycin relative to (4 mg/kg) or (8 mg/kg) of EC-8042. D EC-8042 exhibited a higher Cmax and delayed clearance relative to mithramycin (MMA) in mice.
EC-8042 and mithramycin suppressed EWS-FLI1 activity to a comparable extent
Having demonstrated that EC-8042 is less toxic, we next wanted to confirm that the compound maintains suppression of EWS-FLI1 activity. We confirmed that 50 nmol/L EC-8042 suppressed NR0B1 expression to the identical degree as mithramycin, with a fold change of 0.62 (95% CI, 0.50–0.72, P <0.0001) vs. 0.62 (95% CI, 0.50–0.72, P <0.0001)(Fig. 3A). Next we showed that the suppression extended to our panel of EWS-FLI1 target genes (Fig. 3B). All the EWS-FLI1 induced targets were suppressed and all the repressed targets were induced to a comparable extent as mithramycin (MMA)(Fig. 3B). Similar to the case with EC-8105, this is not a general suppressive effect on transcription because of the marked induction in expression of the repressed targets (Fig. 3B).
Figure 3. EC-8042 achieves suppression of EWS-FLI1 comparable to that of mithramycin.

A, Mean (±SEM) fold change in NR0B1 expression as measured by qPCR as a function of GAPDH (2ΔΔCT) for treatment for 18 h with solvent control (S) or drugs as shown. B, Heat map of ΔΔCt score as a measure of induction (red) or repression (blue) of expression for EWS-FLI1-induced (top) and repressed (bottom) targets as a function of GAPDH for EC-8042 treatment at 15 nM for 18 h or 3 h, respectively C, Heat map of ΔΔCt score as a measure of induction (red) or repression (blue) of expression for EWS-FLI1 gene signature in control cell lines (U2OS, osteosarcoma, RD, embryonal rhabdomyosarcoma and RH30 alveolar rhabdomyosarcoma) following treatment for 18 hours with 50 nmol/L mithramycin (MMA), 50 nmol/L EC-8042 or 15 nmol/L EC-8105 for 18 h. D, Immunoblot from TC32 and TC71 cell lines showing the effect of mithramycin or EC-8042 treatment on EWS-FLI1 downstream target expression (EZH2, NR0B1, and ID2) and γH2AX phosphorylation with ACTB as a loading control. E, Dose response curves of cell number at 48 h of treatment. All qPCR data is the average of 3 independent experiments and all other results are representative of 3 independent experiments.
To further confirm that this is not a general repression of transcription and is linked to EWS-FLI1 blockade, we evaluated the effect of treatment with mithramycin, EC-8105 and EC-8042 on a panel of childhood sarcoma cell lines; U2OS osteosarcoma, RD embryonal rhabdomyosarcoma and RH30 alveolar rhabdomyosarcoma cell lines. Notably, these cell lines represent a different bone tumor (U2OS) and a cell line driven by an alternate PAX3-FOXO1 transcription factor (RH30). Although some genes showed a minor degree of suppression (WRN, IL1RAP), most did not change or were even induced with drug treatment with the three compounds (ID2 in RD and RH30 cells)(Fig. 3C). Importantly, since EWS-FLI1 is not found in these cell lines, there was no consistent alteration in expression of this panel of genes like with EC-8042, EC-8105 or mithramycin.
To confirm suppression of EWS-FLI1 targets at the protein level, we treated TC32 and TC71 cells with either mithramycin or EC-8042 for 18 h. In TC32 cells, 50 nmol/L of mithramycin or EC-8042 suppressed the EWS-FLI1 targets EZH2, NR0B1, and ID2 (Fig. 3D). In TC71 cells, 100 nmol/L of either compound suppressed the EWS/FL1 targets NR0B1 and EZH2 (Fig. 3D).
Importantly, in contrast to mithramycin, the suppression of EWS-FLI1 by EC-8042 happened in the absence of DNA damage, as measured by the phosphorylation of γH2AX (Fig. 3D). Furthermore, the concentration that causes EWS-FLI1 target suppression more closely approximates the cell viability IC50 of 37.8 nmol/L (95% CI, 35.6–40.0), for EC-8042 than the 15.5 nmol/L (95% CI, 14.7–17.1) value for mithramycin (Fig. 3E). These results suggest that EC-8042 suppresses cell viability by blocking EWS-FLI1 while mithramycin gains additional cytotoxicity from non-specific DNA damage leading to a lower IC50 but a broader toxicity profile.
EC-8105 and EC-8042 showed cell context–dependent toxicity that favors Ewing sarcoma cells
To model this cleaner cytotoxicity of EC-8042 and EC-8105, we evaluated the effect of drug treatment using time-lapse microscopy. Since the major toxicity of mithramycin is liver toxicity, we compared the effects of drug treatment in Ewing sarcoma versus HepG2 cells immortalized liver cells. Although not a perfect model, HepG2 cells have been used in several studies to model liver toxicity (47, 48). They appear to be a reasonable model when the toxicity is due to changes in gene expression, but not when they are due to changes in drug-metabolizing enzymes. Therefore, we used these cells as a model system to compare toxicity induced by suppression of EWS-FLI1 that should be specific to Ewing sarcoma cells versus general mechanisms of toxicity such as DNA damage, which should occur in both types of cells.
We first established concentrations of each compound that showed equivalent suppression of EWS-FLI1 targets NR0B1, EZH2, and ID2: 50 nmol/L mithramycin, 50 nmol/L EC-8042, and 7.5 nmol/L EC-8105 (Fig. 4A). Further, those concentrations also released the EWS-FLI1-mediated repression of LOX1, PHLDA1, and TAF1C to a similar degree (Fig. 4A).
Figure 4. EC-8105 and EC-8042 are less toxic to immortalized hepatocytes at concentrations that suppress EWS-FLI1 in Ewing sarcoma cells.

A, Mean fold change in expression of EWS-FLI1-induced targets or -repressed targets as a function of GAPDH (2ΔΔCT) after treatment with 50 nmol/L mithramycin, 50 nmol/L EC-8042 or 7.5 nmol/L EC-8105 for 12 h. qPCR data is the average of 3 independent experiments. B, Time-lapse microscopy demonstrating suppression of TC32 Ewing sarcoma cell proliferation over time following drug addition and EWS-FLI1 target suppression (black arrow) for 50 nmol/L mithramycin, 50 nmol/L EC-8042 or 7.5 nmol/L EC-8105 C, End point MTS assay confirming effect on cell viability in TC32 cells. D, Time-lapse microscopy demonstrating suppression of HepG2 proliferation with 50 nmol/L mithramycin but not 50 nmol/L EC-8042 or 7.5 nmol/L EC-8105. E, End point MTS assay confirming effect on cell viability in HepG2 cells. F, Confocal microscopy and G, western blot analysis demonstrates induction of DNA damage as measured by the phosphorylation of γH2AX at concentrations that suppress expression of the EWS-FLI1 target gene NR0B1 only with 50 nmol/L mithramycin and not with 50 nmol/L EC-8042 or marginally with 7.5 nmol/L EC-8105.
Next, we used time-lapse microscopy to observe the effect of treating TC32 cells with these concentrations of drugs. We previously showed that EWS-FLI1 target suppression occurs at the protein level in vitro after 12–18 h of treatment with mithramycin ((11) and Figs. 1H, 3D)). Consistent with these kinetics, treatment of TC32 cells with the established concentrations of all three drugs markedly impaired proliferation 18 h after exposure (black arrow)(Fig. 4B). Treatment of HepG2 cells with 50 nmol/L mithramycin impaired their proliferation to a comparable extent, although with much different kinetics, consistent with an alternative mechanism of cytotoxicity and with the liver toxicity observed in the clinic (Fig. 4D). In contrast, neither EC-8105 or EC-8042 had any effect on the proliferation of HepG2 cells (Fig. 4D). Finally, in order to exclude changes in cell shape as the cause for the change in percent confluence, we confirmed the results using a standard MTS endpoint assay (Figs. 4C and 4E).
We then evaluated the effect of this treatment on the DNA integrity of the cells. Mithramycin at 50 nmol/L generated significant DNA damage as measured by the phosphorylation of γH2AX by confocal microscopy (Fig. 4F) or western blot analysis (Fig. 4G). In contrast, EC-8105 showed substantially less DNA damage and EC-8042 had no DNA damaging effects (Fig. 4F, G).
Finally, to further explore the activity of these three agents, we screened a panel of pediatric cell lines as part of the Pediatric Preclinical Testing Program (PPTP). Consistent with a common mechanism of action, the panel responded similarly to all three compounds as measured by a Pearson correlation analysis (Supplementary Fig. S5A). In addition, both compounds had a nmol/L IC50 in all of the Ewing sarcoma cells tested. Interestingly, there was an unexpected sensitivity of rhabdoid tumor and acute lymphoblastic leukemia cell lines to all three agents (Supplementary Fig. S5B). Finally, all cell lines that were p53 mutated were statistically more sensitive to mithramycin and EC-8105 but not EC-8042 consistent with the known DNA-damaging properties of these agents (Supplementary Fig. S5C).
EC-8105 and EC-8042 suppressed xenograft tumor growth and extended survival
We previously demonstrated that treatment of TC32 and TC71 Ewing sarcoma xenografts with a dose of 1 mg/kg of mithramycin IP on a Monday/Wednesday/Friday (M/W/F) schedule markedly suppresses and even regresses tumor growth, particularly for the TC32 xenograft (11). Since the TC71 xenograft was more resistant to mithramycin than TC32, in the current study we evaluated EC-8105 and EC-8042 in the more resistant TC71 xenograft model and compared the intraperitoneal (IP) route we previously employed to intravenous (IV) administration on a similar schedule (11).
We treated mice with EC-8105 at 1 mg/kg IP and the M/W/F schedule, and found limited suppression of tumor growth (Supplementary Fig. S6). In contrast, when mice were injected IV with a slightly higher dose of 1.5 mg/kg, every mouse in the cohort showed suppression of tumor growth (Fig. 5A). While on treatment, tumors in this group grew an average of 171.7 mm3 less per day than the control (P <0.0001, 95% CI, 112.4–231.1). In addition, there was a delayed regression of tumors that was seen in 3 out of 8 mice and persisted long after treatment discontinuation, including one mouse that was cured (see thin lines in Fig. 5A). Overall, the effect translated into a statistically significant survival advantage as measured by time to a tumor size of 2 cm (P < 0.0001)(Fig. 5B). It is notable that, overall, the drug was well tolerated, with some transient weight loss that resolved for every mouse (Supplementary Fig. S7).
Figure 5. EC-8105 and EC-8042 suppress Ewing sarcoma xenograft growth.

A, Prediction plot showing mean tumor volume (dotted line) while on treatment (grey rectangle) and tumor growth for individual mice (thin lines) bearing a TC71 xenograft treated with 1.5 mg/kg of EC-8105 IV on a Q3D X 8 schedule. B, Survival curves for mice bearing the TC71 xenografts showing time to 2 cm in control (grey) and mice treated with 1.5 mg/kg of EC-8105 IV on a Q3D X 8 schedule (black). C, Prediction plots showing mean tumor volume (dotted line) while on treatment (grey rectangle) and tumor growth for individual mice (thin lines) bearing a TC71 xenograft treated with 24 mg/kg of EC-8042 IV Q3D X 8 or D, 24 mg/kg IP on a M, W, F X 8 schedule. Arrows indicate final day of treatment. E. Representative tissue section showing suppression of NR0B1 expression by immunofluorescence following treatment with IP EC-8042.
EC-8042 also showed excellent activity in the resistant TC71 model, but the activity was independent of route of administration. In parallel to the EC-8105 study, mice were treated with EC-8042 IV at 37% of its IV MTD (24 mg/kg) on a Q3D X * schedule (Fig. 5C). While on treatment, tumors in this cohort grew an average of 151 mm3 less per day than the control (P <0.001, 95% CI, 92.0–211.1). This marked suppression of tumor growth extended the survival of the EC-8042-treated cohort (P <0.0001)(Supplementary Fig. S8A). Again regressions following a period of growth were seen, but unfortunately two of the mice that were responding to drug died of unknown causes (Fig. 5C, red asterisks).
A separate cohort of mice were treated by the intraperitoneal route in order to compare the activity of EC-8042 to our previously published report for mithramycin. Mice were again treated at 24 mg/kg to compare to the IV dose, even though this dose was only 12% of the IP MTD. Even at this low dose of EC-8042, every tumor in every mouse showed some level of regression following variable periods of tumor growth, remaining suppressed until therapy was discontinued (Fig. 5D; supplementary Fig. S9A). Not only did this low-dose result in consistent repression, the overall effect was quite impressive, conferring a tumor growth rate that was, on average 268.2 mm3 less per day than the control (while being treated)(95% CI, 206.0–330.5, P <0.0001). This regression translated into a difference in tumor volume on day 11 of treatment: the mean tumor size (or final measurement) for control mice was 3177 mm3 (SEM +/− 308.2), versus a mean tumor size in treated mice of 422.5 mm3 (SEM +/− 48)(P <0.0001, Supplementary S9B). This regression extended survival but lacked permanence, and with cessation of treatment the tumors grew back (Fig. 5D and Supplementary Fig. S8B). The mice were not re-challenged with drug, despite the fact that more drug would likely have been well tolerated. Finally, examination of tumor tissue post-mortem showed clear suppression of EWS-FLI1 activity on day 3 of treatment with EC-8042 as measured by immunofluorescent staining for NR0B1 expression (Fig. 5E). Similar results were obtained with immunofluorescent staining for NR0B1 after treatment with EC-8105, although these tumors were larger at the time of collection and so show more variability (Supplementary Fig. S10).
Discussion
Ewing sarcoma is dependent on the continued expression of the EWS-FLI1 transcription factor for cell survival. We have previously characterized mithramycin as an EWS-FLI1 inhibitor and translated it to the clinic, but were unable to achieve high enough serum levels to block the target in patients. In this study, we sought to improve the targeting of EWS-FLI1 by identifying mithramycin analogs that widen the gap between efficacy and toxicity.
We screened 22 mithramycin analogs and identified EC-8105 as more potent and EC-8042 as less toxic. We validated the improvement in toxicity in multiple species, showed some preference for the Ewing sarcoma histotype, demonstrated suppression of EWS-FLI1 both in vitro and in vivo, and showed good activity in xenograft models of the disease.
It is unclear which of the two analogs should be prioritized for clinical development and/or will ultimately achieve the therapeutic suppression of EWS-FLI1, which highlights the challenge of using preclinical testing to predict the value of agents in the clinic. While both compounds were superior to mithramycin in all our assays, neither was better than the other in every assay. For example, EC-8042 shows a more dramatic effect against xenograft tumors when administered IP, and it was active by both IV and IP routes (even though the IP dose was 1/10th of the maximum tolerated dose). Unfortunately, by this dose, schedule, and route, the effect was reversible. In contrast, EC-8105 was more active via IV but completely inactive by IP injection. However, 3 out of the 8 mice showed impressive regressions of the xenograft following a period of initial growth, including a complete cure in one mouse. Therefore, future studies will focus on optimizing the dose, route, and schedule of both agents in an effort to prioritize one agent for development. However, because these results are not necessarily predictive of activity in the clinic, they will need to weighed against practical considerations when prioritizing the two analogs, such as activity in other tumor types, ease of synthesis, and stability over time.
This study also highlights the challenge of predicting toxicity in patients based on preclinical models. In our original studies with mithramycin, we saw little toxicity in the mouse, which allowed us to achieve high serum levels of drug determined in this study to be over 300 nmol/L. These concentrations far exceed the 50 to 100 nmol/L concentration that blocks EWS-FLI1 activity. However, in the clinic, there was more toxicity, and serum levels were a fraction of those achieved in the mouse; as a result, therapeutic activity was limited in patients.
The gold standard is to test toxicity across several species, and because the basis for selecting EC-8042 was an improved toxicity profile, we felt it necessary to carry out such tests in this study. This presented the opportunity to evaluate other traditional surrogates of toxicity such as evaluation of toxicity in control cell lines. We evaluated the cytotoxicity of mithramycin, EC-8042, and EC-8105 against a panel of cell lines for a histotype preference. We found a limited preference for Ewing sarcoma cell lines. Since we know EC-8042 is less toxic, this approach as a surrogate for toxicity is disfavored. Instead these studies should be reserved to highlight particularly unique sensitivities of specific tumor types to agents as was seen for rhabdoid tumor and perhaps ALL in this study.
In a complementary approach, we also modeled the liver toxicity in patients by evaluating the compounds in immortalized hepatocytes at concentrations that effectively suppress EWS-FLI1 as the mechanism of cytotoxicity in Ewing sarcoma cell lines. Both analogs were superior to mithramycin: both suppressed EWS-FLI1 and Ewing sarcoma growth without affecting the growth of HepG2 cells. In contrast, concentrations of mithramycin that suppressed EWS-FLI1 induced marked cytotoxicity in HepG2 cells. These differences are at least partially explained by the differences in the DNA-damaging properties of the three drugs. Both analogs achieve suppression of EWS-FLI1 with limited (EC-8105) or no (EC-8042) associated DNA damage, while mithramycin suppressed EWS-FLI1 at relatively high concentrations that produced marked DNA damage.
From a mechanistic standpoint, it is not clear if the DNA damage induced by the drug is favorable or not to the activity of this class of compounds. The fact that tumors markedly regressed under EC-8105 treatment and have a substantially lower IC50 with this agent relative to EC-8042 suggests that some DNA damage assists the mechanism of EWS-FLI1 suppression. In addition, in our panel of cell lines, there was a statistically significant sensitivity in cell lines that are p53 wild type (49). This is reflected in our in vivo results, where the less-sensitive TC71 xenograft was p53 mutant while TC32 was p53 wild type and much more sensitive in our previously published study. Importantly, the majority of Ewing sarcoma cases are p53 wild type. Nevertheless, it has been suggested that Ewing sarcoma cells have a baseline tolerance for low-level DNA damage. This may be related to reports that show the direct modulation of the p53 axis by EWS-FLI1. It is possible that by suppressing EWS-FLI1, restoration of the p53 axis while generating low-level DNA damage (as seen with EC-8105) may contribute to the effectiveness of the drug. Further mechanistic studies are in progress.
Finally and perhaps most importantly, this study provides the basis for the use and optimization of DNA-binding drugs as targeted agents. In general, these compounds are thought to be nonspecific inhibitors of transcription. Here we show that this is not the case, that there is some preference for particular transcription factors and that this preference can be tuned by optimized analogs even when the mechanism of target suppression is not completely understood. By directly addressing the limitations of mithramycin while preserving the suppression of EWS-FLI1, this study provides the basis for the further development of these compounds for Ewing sarcoma therapy. In addition, the study serves as a precedent for similar strategies with DNA-binding compounds for other tumor types and other transcription factor targets.
Supplementary Material
Statement of Translational Relevance.
A substantial literature has established a dependence of Ewing sarcoma on the EWS-FLI1 transcription factor, but no clinically relevant EWS-FLI1 inhibitor is known. We previously identified mithramycin as an inhibitor of EWS-FLI1 and translated this compound to the clinic. Because of unforeseen toxicity issues, we were not able to achieve high enough serum levels to inhibit the target. In this study, we tested two different second-generation mithramycin analogs that are more likely to achieve serum concentrations sufficient to block the activity of EWS-FLI1. We found that EC-8042 was less toxic and EC-8105 was more potent than the parent mithramycin, and both compounds suppressed EWS-FLI1 activity at concentrations that were nontoxic to other cell types. This study provides a basis for evaluating these EWS-FLI1 inhibitors in the clinic.
Acknowledgments
The majority of the funding for this work was from the Hyundai Hope on Wheels Program (PJG, CGK, KNM). Funding was also provided by the T32 training grant conducting research in pediatric oncology as well as the Vanderbilt Clinical Oncology Research Career Development K12 both for CLO. Additional internal funds were provided by the Vanderbilt University Department of Pediatrics. (PJG, CLO, KNM). Immunofluorescent assay development was supported by the Alex’s Lemonade Stand Reach Award (PJG). Additional funding was provided by the Lily’s Garden Foundation (PJG, LES). EntreChem thanks Mariam Hermosilla and Patricia Oro for superior technical assistance. The authors acknowledge the contractor, the Southern Research Company for intravenous treatment of mice in this manuscript. This project has also been funded in part with federal funds from the Frederick National Laboratory for Cancer Research, National Institutes of Health under contract HHSN261200800001E (GMW). The authors would like to thank David Nadziejka for technical editing of the manuscript.
References
- 1.Esiashvili N, Goodman M, Marcus RB., Jr Changes in incidence and survival of Ewing sarcoma patients over the past 3 decades: Surveillance Epidemiology and End Results data. J Pediatr Hematol Oncol. 2008;30:425–30. doi: 10.1097/MPH.0b013e31816e22f3. [DOI] [PubMed] [Google Scholar]
- 2.Grier HE, Krailo MD, Tarbell NJ, Link MP, Fryer CJ, Pritchard DJ, et al. Addition of ifosfamide and etoposide to standard chemotherapy for Ewing’s sarcoma and primitive neuroectodermal tumor of bone. N Engl J Med. 2003;348:694–701. doi: 10.1056/NEJMoa020890. [DOI] [PubMed] [Google Scholar]
- 3.Womer RB, West DC, Krailo MD, Dickman PS, Pawel BR, Grier HE, et al. Randomized controlled trial of interval-compressed chemotherapy for the treatment of localized Ewing sarcoma: a report from the Children’s Oncology Group. J Clin Oncol. 2012;30:4148–54. doi: 10.1200/JCO.2011.41.5703. [DOI] [PMC free article] [PubMed] [Google Scholar]
- 4.Miser JS, Goldsby RE, Chen Z, Krailo MD, Tarbell NJ, Link MP, et al. Treatment of metastatic Ewing sarcoma/primitive neuroectodermal tumor of bone: evaluation of increasing the dose intensity of chemotherapy--a report from the Children’s Oncology Group. Pediatr Blood Cancer. 2007;49:894–900. doi: 10.1002/pbc.21233. [DOI] [PubMed] [Google Scholar]
- 5.Hamilton SN, Carlson R, Hasan H, Rassekh SR, Goddard K. Long-term Outcomes and Complications in Pediatric Ewing Sarcoma. Am J Clin Oncol. 2015 doi: 10.1097/COC.0000000000000176. [DOI] [PubMed] [Google Scholar]
- 6.Maksimenko A, Malvy C. Oncogene-targeted antisense oligonucleotides for the treatment of Ewing sarcoma. Expert Opin Ther Targets. 2005;9:825–30. doi: 10.1517/14728222.9.4.825. [DOI] [PubMed] [Google Scholar]
- 7.Delattre O, Zucman J, Plougastel B, Desmaze C, Melot T, Peter M, et al. Gene fusion with an ETS DNA-binding domain caused by chromosome translocation in human tumours. Nature. 1992;359:162–5. doi: 10.1038/359162a0. [DOI] [PubMed] [Google Scholar]
- 8.Stegmaier K, Wong JS, Ross KN, Chow KT, Peck D, Wright RD, et al. Signature-based small molecule screening identifies cytosine arabinoside as an EWS/FLI modulator in Ewing sarcoma. PLoS Med. 2007;4:e122. doi: 10.1371/journal.pmed.0040122. [DOI] [PMC free article] [PubMed] [Google Scholar]
- 9.Erkizan HV, Kong Y, Merchant M, Schlottmann S, Barber-Rotenberg JS, Yuan L, et al. A small molecule blocking oncogenic protein EWS-FLI1 interaction with RNA helicase A inhibits growth of Ewing’s sarcoma. Nat Med. 2009;15:750–6. doi: 10.1038/nm.1983. [DOI] [PMC free article] [PubMed] [Google Scholar]
- 10.Grohar PJ, Griffin LB, Yeung C, Chen QR, Pommier Y, Khanna C, et al. Ecteinascidin 743 interferes with the activity of EWS-FLI1 in Ewing sarcoma cells. Neoplasia. 2011;13:145–53. doi: 10.1593/neo.101202. [DOI] [PMC free article] [PubMed] [Google Scholar]
- 11.Grohar PJ, Woldemichael GM, Griffin LB, Mendoza A, Chen QR, Yeung C, et al. Identification of an Inhibitor of the EWS-FLI1 Oncogenic Transcription Factor by High-Throughput Screening. J Natl Cancer Inst. 2011;103:962–78. doi: 10.1093/jnci/djr156. [DOI] [PMC free article] [PubMed] [Google Scholar]
- 12.Boro A, Pretre K, Rechfeld F, Thalhammer V, Oesch S, Wachtel M, et al. Small-molecule screen identifies modulators of EWS/FLI1 target gene expression and cell survival in Ewing’s sarcoma. Int J Cancer. 2012;131:2153–64. doi: 10.1002/ijc.27472. [DOI] [PubMed] [Google Scholar]
- 13.Chen C, Wonsey DR, Lemieux ME, Kung AL. Differential disruption of EWS-FLI1 binding by DNA-binding agents. PLoS One. 2013;8:e69714. doi: 10.1371/journal.pone.0069714. [DOI] [PMC free article] [PubMed] [Google Scholar]
- 14.Sankar S, Theisen ER, Bearss J, Mulvihill T, Hoffman LM, Sorna V, et al. Reversible LSD1 inhibition interferes with global EWS/ETS transcriptional activity and impedes Ewing sarcoma tumor growth. Clin Cancer Res. 2014;20:4584–97. doi: 10.1158/1078-0432.CCR-14-0072. [DOI] [PMC free article] [PubMed] [Google Scholar]
- 15.DuBois SG, Krailo MD, Lessnick SL, Smith R, Chen Z, Marina N, et al. Phase II study of intermediate-dose cytarabine in patients with relapsed or refractory Ewing sarcoma: a report from the Children’s Oncology Group. Pediatr Blood Cancer. 2009;52:324–7. doi: 10.1002/pbc.21822. [DOI] [PMC free article] [PubMed] [Google Scholar]
- 16.Baruchel S, Pappo A, Krailo M, Baker KS, Wu B, Villaluna D, et al. A phase 2 trial of trabectedin in children with recurrent rhabdomyosarcoma, Ewing sarcoma and non-rhabdomyosarcoma soft tissue sarcomas: a report from the Children’s Oncology Group. Eur J Cancer. 2012;48:579–85. doi: 10.1016/j.ejca.2011.09.027. [DOI] [PubMed] [Google Scholar]
- 17.Kofman S, Eisenstein R. Mithramycin in the Treatment of Disseminated Cancer. Cancer Chemother Rep. 1963;32:77–96. [PubMed] [Google Scholar]
- 18.Kofman S, Medrek TJ, Alexander RW. Mithramycin in the Treatment of Embryonal Cancer. Cancer. 1964;17:938–48. doi: 10.1002/1097-0142(196407)17:7<938::aid-cncr2820170714>3.0.co;2-n. [DOI] [PubMed] [Google Scholar]
- 19.Mendez C, Gonzalez-Sabin J, Moris F, Salas JA. Expanding the Chemical Diversity of the Antitumoral Compound Mithramycin by Combinatorial Biosynthesis and Biocatalysis: The Quest for Mithralogs with Improved Therapeutic Window. Planta Med. 2015;81:1326–38. doi: 10.1055/s-0035-1557876. [DOI] [PubMed] [Google Scholar]
- 20.Nunez LE, Nybo SE, Gonzalez-Sabin J, Perez M, Menendez N, Brana AF, et al. A novel mithramycin analogue with high antitumor activity and less toxicity generated by combinatorial biosynthesis. J Med Chem. 2012;55:5813–25. doi: 10.1021/jm300234t. [DOI] [PMC free article] [PubMed] [Google Scholar]
- 21.Gonzalez-Sabin J, Nunez LE, Brana AF, Mendez C, Salas JA, Gotor V, et al. Regioselective Enzymatic Acylation of Aureolic Acids to Obtain Novel Analogues with Improved Antitumor Activity. Adv Synth Catal. 2012;354:1500–8. [Google Scholar]
- 22.Kang MH, Smith MA, Morton CL, Keshelava N, Houghton PJ, Reynolds CP. National Cancer Institute pediatric preclinical testing program: model description for in vitro cytotoxicity testing. Pediatr Blood Cancer. 2011;56:239–49. doi: 10.1002/pbc.22801. [DOI] [PMC free article] [PubMed] [Google Scholar]
- 23.Grohar PJ, Segars LE, Yeung C, Pommier Y, D’Incalci M, Mendoza A, et al. Dual targeting of EWS-FLI1 activity and the associated DNA damage response with trabectedin and SN38 synergistically inhibits Ewing sarcoma cell growth. Clin Cancer Res. 2014;20:1190–203. doi: 10.1158/1078-0432.CCR-13-0901. [DOI] [PMC free article] [PubMed] [Google Scholar]
- 24.Kinsey M, Smith R, Lessnick SL. NR0B1 is required for the oncogenic phenotype mediated by EWS/FLI in Ewing’s sarcoma. Mol Cancer Res. 2006;4:851–9. doi: 10.1158/1541-7786.MCR-06-0090. [DOI] [PubMed] [Google Scholar]
- 25.Kinsey M, Smith R, Iyer AK, McCabe ER, Lessnick SL. EWS/FLI and its downstream target NR0B1 interact directly to modulate transcription and oncogenesis in Ewing’s sarcoma. Cancer Res. 2009;69:9047–55. doi: 10.1158/0008-5472.CAN-09-1540. [DOI] [PMC free article] [PubMed] [Google Scholar]
- 26.Riggi N, Knoechel B, Gillespie SM, Rheinbay E, Boulay G, Suva ML, et al. EWS-FLI1 utilizes divergent chromatin remodeling mechanisms to directly activate or repress enhancer elements in Ewing sarcoma. Cancer Cell. 2014;26:668–81. doi: 10.1016/j.ccell.2014.10.004. [DOI] [PMC free article] [PubMed] [Google Scholar]
- 27.Kauer M, Ban J, Kofler R, Walker B, Davis S, Meltzer P, et al. A molecular function map of Ewing’s sarcoma. PLoS One. 2009;4:e5415. doi: 10.1371/journal.pone.0005415. [DOI] [PMC free article] [PubMed] [Google Scholar]
- 28.Hancock JD, Lessnick SL. A transcriptional profiling meta-analysis reveals a core EWS-FLI gene expression signature. Cell Cycle. 2008;7:250–6. doi: 10.4161/cc.7.2.5229. [DOI] [PubMed] [Google Scholar]
- 29.Wei GH, Badis G, Berger MF, Kivioja T, Palin K, Enge M, et al. Genome-wide analysis of ETS-family DNA-binding in vitro and in vivo. EMBO J. 2010;29:2147–60. doi: 10.1038/emboj.2010.106. [DOI] [PMC free article] [PubMed] [Google Scholar]
- 30.Gangwal K, Sankar S, Hollenhorst PC, Kinsey M, Haroldsen SC, Shah AA, et al. Microsatellites as EWS/FLI response elements in Ewing’s sarcoma. Proc Natl Acad Sci U S A. 2008;105:10149–54. doi: 10.1073/pnas.0801073105. [DOI] [PMC free article] [PubMed] [Google Scholar]
- 31.Patel M, Simon JM, Iglesia MD, Wu SB, McFadden AW, Lieb JD, et al. Tumor-specific retargeting of an oncogenic transcription factor chimera results in dysregulation of chromatin and transcription. Genome Res. 2012;22:259–70. doi: 10.1101/gr.125666.111. [DOI] [PMC free article] [PubMed] [Google Scholar]
- 32.Nishimori H, Sasaki Y, Yoshida K, Irifune H, Zembutsu H, Tanaka T, et al. The Id2 gene is a novel target of transcriptional activation by EWS-ETS fusion proteins in Ewing family tumors. Oncogene. 2002;21:8302–9. doi: 10.1038/sj.onc.1206025. [DOI] [PubMed] [Google Scholar]
- 33.Bilke S, Schwentner R, Yang F, Kauer M, Jug G, Walker RL, et al. Oncogenic ETS fusions deregulate E2F3 target genes in Ewing sarcoma and prostate cancer. Genome Res. 2013;23:1797–809. doi: 10.1101/gr.151340.112. [DOI] [PMC free article] [PubMed] [Google Scholar]
- 34.Tirado OM, Mateo-Lozano S, Villar J, Dettin LE, Llort A, Gallego S, et al. Caveolin-1 (CAV1) is a target of EWS/FLI-1 and a key determinant of the oncogenic phenotype and tumorigenicity of Ewing’s sarcoma cells. Cancer Res. 2006;66:9937–47. doi: 10.1158/0008-5472.CAN-06-0927. [DOI] [PubMed] [Google Scholar]
- 35.Smith R, Owen LA, Trem DJ, Wong JS, Whangbo JS, Golub TR, et al. Expression profiling of EWS/FLI identifies NKX2.2 as a critical target gene in Ewing’s sarcoma. Cancer Cell. 2006;9:405–16. doi: 10.1016/j.ccr.2006.04.004. [DOI] [PubMed] [Google Scholar]
- 36.Mendiola M, Carrillo J, Garcia E, Lalli E, Hernandez T, de Alava E, et al. The orphan nuclear receptor DAX1 is up-regulated by the EWS/FLI1 oncoprotein and is highly expressed in Ewing tumors. Int J Cancer. 2006;118:1381–9. doi: 10.1002/ijc.21578. [DOI] [PubMed] [Google Scholar]
- 37.Luo W, Gangwal K, Sankar S, Boucher KM, Thomas D, Lessnick SL. GSTM4 is a microsatellite-containing EWS/FLI target involved in Ewing’s sarcoma oncogenesis and therapeutic resistance. Oncogene. 2009;28:4126–32. doi: 10.1038/onc.2009.262. [DOI] [PubMed] [Google Scholar]
- 38.Tilan JU, Lu C, Galli S, Izycka-Swieszewska E, Earnest JP, Shabbir A, et al. Hypoxia shifts activity of neuropeptide Y in Ewing sarcoma from growth-inhibitory to growth-promoting effects. Oncotarget. 2013;4:2487–501. doi: 10.18632/oncotarget.1604. [DOI] [PMC free article] [PubMed] [Google Scholar]
- 39.Riggi N, Suva ML, Suva D, Cironi L, Provero P, Tercier S, et al. EWS-FLI-1 expression triggers a Ewing’s sarcoma initiation program in primary human mesenchymal stem cells. Cancer Res. 2008;68:2176–85. doi: 10.1158/0008-5472.CAN-07-1761. [DOI] [PubMed] [Google Scholar]
- 40.Richter GH, Plehm S, Fasan A, Rossler S, Unland R, Bennani-Baiti IM, et al. EZH2 is a mediator of EWS/FLI1 driven tumor growth and metastasis blocking endothelial and neuro-ectodermal differentiation. Proc Natl Acad Sci U S A. 2009;106:5324–9. doi: 10.1073/pnas.0810759106. [DOI] [PMC free article] [PubMed] [Google Scholar]
- 41.Grunewald TG, Diebold I, Esposito I, Plehm S, Hauer K, Thiel U, et al. STEAP1 is associated with the invasive and oxidative stress phenotype of Ewing tumors. Mol Cancer Res. 2012;10:52–65. doi: 10.1158/1541-7786.MCR-11-0524. [DOI] [PubMed] [Google Scholar]
- 42.Nakatani F, Tanaka K, Sakimura R, Matsumoto Y, Matsunobu T, Li X, et al. Identification of p21WAF1/CIP1 as a direct target of EWS-Fli1 oncogenic fusion protein. J Biol Chem. 2003;278:15105–15. doi: 10.1074/jbc.M211470200. [DOI] [PubMed] [Google Scholar]
- 43.Sankar S, Bell R, Stephens B, Zhuo R, Sharma S, Bearss DJ, et al. Mechanism and relevance of EWS/FLI-mediated transcriptional repression in Ewing sarcoma. Oncogene. 2013;32:5089–100. doi: 10.1038/onc.2012.525. [DOI] [PMC free article] [PubMed] [Google Scholar]
- 44.Agra N, Cidre F, Garcia-Garcia L, de la Parra J, Alonso J. Lysyl oxidase is downregulated by the EWS/FLI1 oncoprotein and its propeptide domain displays tumor supressor activities in Ewing sarcoma cells. PLoS One. 2013;8:e66281. doi: 10.1371/journal.pone.0066281. [DOI] [PMC free article] [PubMed] [Google Scholar]
- 45.Guillon N, Tirode F, Boeva V, Zynovyev A, Barillot E, Delattre O. The oncogenic EWS-FLI1 protein binds in vivo GGAA microsatellite sequences with potential transcriptional activation function. PLoS One. 2009;4:e4932. doi: 10.1371/journal.pone.0004932. [DOI] [PMC free article] [PubMed] [Google Scholar]
- 46.Peterson JK, Houghton PJ. Integrating pharmacology and in vivo cancer models in preclinical and clinical drug development. Eur J Cancer. 2004;40:837–44. doi: 10.1016/j.ejca.2004.01.003. [DOI] [PubMed] [Google Scholar]
- 47.Fredriksson L, Wink S, Herpers B, Benedetti G, Hadi M, de Bont H, et al. Drug-induced endoplasmic reticulum and oxidative stress responses independently sensitize toward TNFalpha-mediated hepatotoxicity. Toxicol Sci. 2014;140:144–59. doi: 10.1093/toxsci/kfu072. [DOI] [PubMed] [Google Scholar]
- 48.Persson M, Loye AF, Mow T, Hornberg JJ. A high content screening assay to predict human drug-induced liver injury during drug discovery. J Pharmacol Toxicol Methods. 2013;68:302–13. doi: 10.1016/j.vascn.2013.08.001. [DOI] [PubMed] [Google Scholar]
- 49.Lerman DM, Monument MJ, McIlvaine E, Liu XQ, Huang D, Monovich L, et al. Tumoral TP53 and/or CDKN2A alterations are not reliable prognostic biomarkers in patients with localized Ewing sarcoma: a report from the Children’s Oncology Group. Pediatr Blood Cancer. 2015;62:759–65. doi: 10.1002/pbc.25340. [DOI] [PMC free article] [PubMed] [Google Scholar]
Associated Data
This section collects any data citations, data availability statements, or supplementary materials included in this article.