Significance
We hear sounds varying in intensity over six orders of magnitude using spiral ganglion neurons (SGNs), each of which changes its firing rates over only a fraction of this range. Somehow, the SGNs with different dynamic ranges collectively encode the full range of sound levels represented in the receptor potential of the inner hair cell (IHC) in the mammalian cochlea. Our study, combining subcellular imaging, mouse genetics, and auditory systems physiology, offers a unifying synaptic hypothesis for wide dynamic range sound encoding in the spiral ganglion. We propose that IHCs, from one receptor potential but via presynaptic active zones that vary in the voltage dependence of Ca2+ influx, generate complementary codes on sound pressure level in functionally distinct SGNs.
Keywords: auditory system, spiral ganglion neuron, dynamic range, synaptic strength, presynaptic heterogeneity
Abstract
For sounds of a given frequency, spiral ganglion neurons (SGNs) with different thresholds and dynamic ranges collectively encode the wide range of audible sound pressures. Heterogeneity of synapses between inner hair cells (IHCs) and SGNs is an attractive candidate mechanism for generating complementary neural codes covering the entire dynamic range. Here, we quantified active zone (AZ) properties as a function of AZ position within mouse IHCs by combining patch clamp and imaging of presynaptic Ca2+ influx and by immunohistochemistry. We report substantial AZ heterogeneity whereby the voltage of half-maximal activation of Ca2+ influx ranged over ∼20 mV. Ca2+ influx at AZs facing away from the ganglion activated at weaker depolarizations. Estimates of AZ size and Ca2+ channel number were correlated and larger when AZs faced the ganglion. Disruption of the deafness gene GIPC3 in mice shifted the activation of presynaptic Ca2+ influx to more hyperpolarized potentials and increased the spontaneous SGN discharge. Moreover, Gipc3 disruption enhanced Ca2+ influx and exocytosis in IHCs, reversed the spatial gradient of maximal Ca2+ influx in IHCs, and increased the maximal firing rate of SGNs at sound onset. We propose that IHCs diversify Ca2+ channel properties among AZs and thereby contribute to decomposing auditory information into complementary representations in SGNs.
The auditory system enables us to perceive sound pressures that vary over six orders of magnitude. This is achieved by active amplification of cochlear vibrations at low sound pressures and compression at high sound pressures. The receptor potential of inner hair cells (IHCs) represents the full range (1), whereas each postsynaptic type I spiral ganglion neuron (hereafter termed SGN) encodes only a fraction (2–6). SGNs with comparable frequency tuning but different spontaneous spike rates and sound responses are thought to emanate from neighboring, if not the same, IHC at a given tonotopic position of the organ of Corti (2, 5, 7, 8). Even in silence, IHC active zones (AZs) release glutamate at varying rates, evoking “spontaneous” spiking in SGNs. SGNs with greater spontaneous spike rates respond to softer sounds (high-spontaneous rate, low-threshold SGNs), than those with lower spontaneous spike rates (low-spontaneous rate, high-threshold SGNs) (2, 9). This diversity likely underlies the representation of sounds across all audible sound pressure levels in the auditory nerve, to which neural adaptation also contributes (10).
How SGN diversity arises is poorly understood. Candidate mechanisms include the heterogeneity of ribbon synapses that differ in pre- and/or postsynaptic properties even within individual IHCs (7, 11–14). IHC AZs vary in the number (11, 15) and voltage dependence of gating (11) of their Ca2+ channels regardless of tonotopic position (16). Lateral olivocochlear efferent projections to the SGNs regulate postsynaptic excitability (17) and contribute to the establishment of a gradient of presynaptic ribbon size along the “modiolar–pillar” axis (18), where the modiolar side faces the ganglion and the pillar side is away from the ganglion, toward the pillar cells.
In postnatal development of the mouse, high-spontaneous-rate SGNs coemerge with AZs that exhibit stronger maximal Ca2+ influx. Moreover, IHCs deficient for the AZ protein bassoon lack the population of AZs with strongest Ca2+ influx and, concurrently lack SGNs with high spontaneous rates (19). Based on these correlations and given the eminent role of presynaptic Ca2+ influx in controlling synaptic strength (20–22), we proposed that the varying Ca2+ influx at a given IHC AZ largely determines the difference in spontaneous and evoked spiking among SGNs (19). Larger and more complex AZs (7, 13, 14) with stronger Ca2+ influx (16) tend to reside on the modiolar IHC side. However, according to classical findings from the cat cochlea, modiolar synapses seem weaker as they drive low-spontaneous-rate, high-threshold SGNs (2, 7). This discrepancy suggests that factors other than AZ size and amplitude of Ca2+ influx contribute to differences in SGN properties.
Here, we live-imaged most, if not all, AZs of individual IHCs for analyzing the amplitude and voltage dependence of Ca2+ influx as well as AZ size and position within the IHC. Combined with immunohistochemical estimation of ribbon size and Ca2+-channel abundance of AZs, our data indicate opposing gradients of maximal amplitude and voltage dependence of Ca2+ influx along the modiolar–pillar axis: modiolar AZs, thought to drive low-spontaneous-rate, high-threshold SGNs, are, on average, larger and have more Ca2+ channels but operate in a more depolarized range. We propose that the more hyperpolarized activation range of Ca2+ influx at pillar AZs poises them to enable high spontaneous rates and low sound thresholds of SGN firing. We studied candidate regulators of Ca2+ influx at IHC AZs and found that disruption of the deafness gene GIPC3 in mice causes a hyperpolarizing shift of Ca2+-channel activation and increases spontaneous SGN firing.
Results
Heterogeneity of Presynaptic Ca2+ Influx Among the AZs of IHCs.
The strength of presynaptic Ca2+ influx and the large (∼2 µm) distance between hair cell AZs (16, 23) enable spatiotemporally resolved optical analysis of presynaptic Ca2+ signaling (11, 24, 25). However, given the limited duration of stable Ca2+ influx in whole-cell patch-clamp recordings, the low speed of laser-scanning confocal microscopy had prohibited a comprehensive comparison of the Ca2+-influx properties among the AZs within a given IHC. To overcome this technical limitation we combined spinning disk microscopy with fast piezoelectric focusing to sequentially and rapidly (frame rate 100 Hz) image confocal IHC sections. This enabled the analysis of voltage dependence and maximal amplitude of the Ca2+ influx, visualized as local fluorescence increase of the low-affinity Ca2+ indicator Fluo-8FF (Kd = 10 µM) at most if not all synapses of a given IHC (Fig. 1A) while the IHC Ca2+ current remained stable (rundown <25%; a few IHCs were excluded from the analysis because of rundown >25%).
Fig. 1.
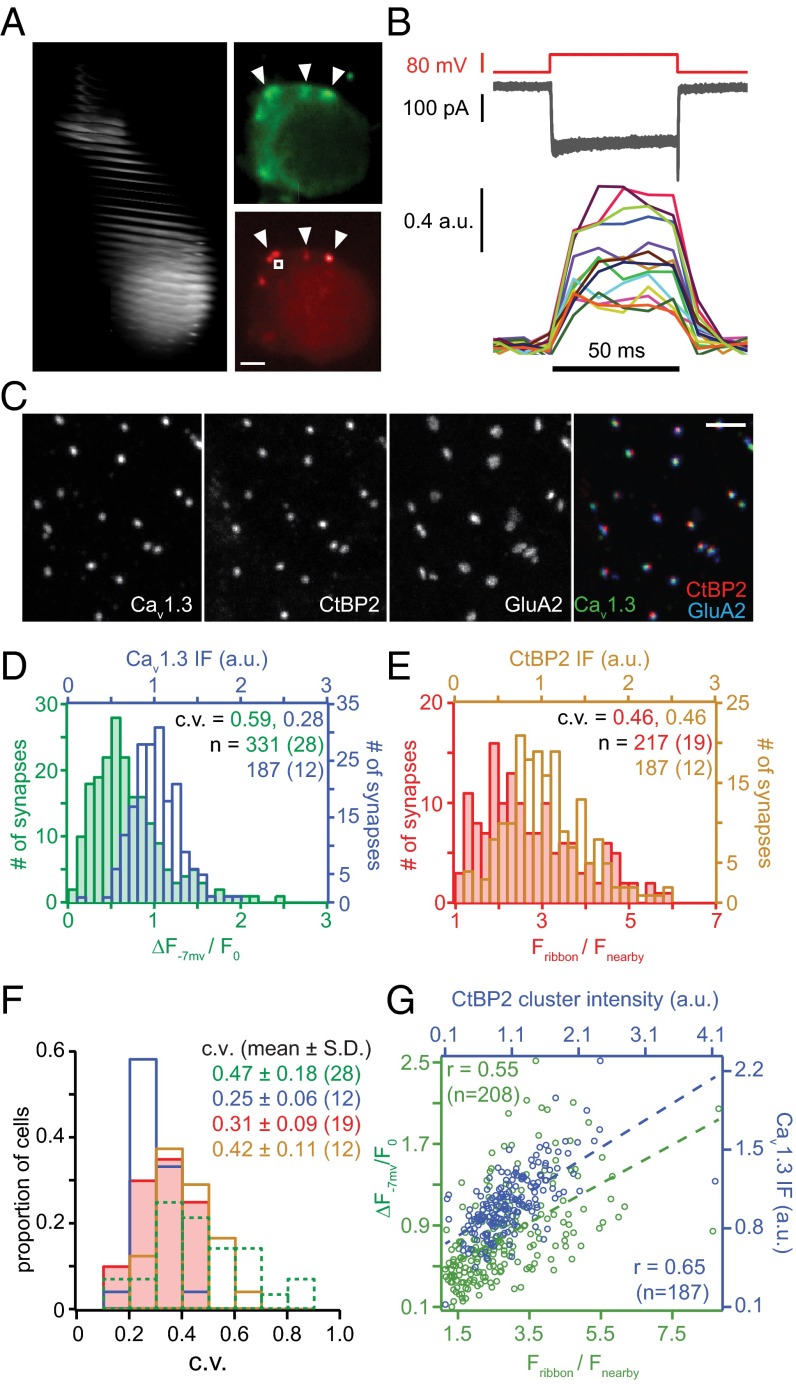
AZ heterogeneity: Those with larger ribbons have more Ca2+ channels. (A, Left) Stack of confocal sections covering an exemplary IHC filled with TAMRA-RIBEYE-binding peptide via the patch pipette. (A, Upper Right) Fluo-8FF fluorescence reports Ca2+ influx (arrowheads) as spot-like maxima near the membrane during depolarization. (A, Lower Right) Corresponding image of TAMRA-RIBEYE-binding peptide fluorescence labeling synaptic ribbons (arrowheads), where Ca2+ influx occurs. White square indicates where the background fluorescence (Fnearby) was measured. (Scale bar: 1 µm.) (B) Measurement of Ca2+ influx at individual AZs in an exemplary IHC. Depolarizations to −7 mV (Upper) evoked similar whole-cell Ca2+ currents with each stimulus (superimposed, Middle). Focusing on single AZs during each repetition revealed major heterogeneity of maximal Ca2+-indicator fluorescence amplitudes (Lower, ΔF−7 mV/F0, 100-Hz frame rate; panel superimposes one trace per AZ, each marked by a different color). (C) Confocal projections of immunolabeled presynaptic Ca2+ channels (Cav1.3), presynaptic ribbons (CtBP2/RIBEYE), and postsynaptic AMPA receptors (GluA2) with overlay on far right. (Scale bar: 2 µm.) (D) Green: distribution of the maximal ΔF−7 mV/F0 for each AZ from live imaging. Blue: distribution of the integrated Cav1.3 immunofluorescence pixel intensities for each AZ in fixed tissue. (E) Red: distribution of the maximal fluorescence intensity of TAMRA-peptide labeled ribbons, normalized to the cytosolic fluorescence (Fribbon/Fnearby). Brown: distribution of the integrated CtBP2/RIBEYE immunofluorescence pixel intensites for each AZ. (F) Distributions of the c.v. estimated within individual IHCs for AZ parameters: maximal Ca2+ influx (ΔF−7 mV/F0, dashed green), TAMRA-RIBEYE-binding peptide fluorescence (solid red), Cav1.3 immunofluorescence (solid blue), and CtBP2/RIBEYE immunofluorescence (solid brown). (G) Scatter plot of maximal ΔF−7 mV/F0 vs. TAMRA-RIBEYE-binding fluorescence intensity (green) and of Cav1.3 vs. CtBP2/RIBEYE immunofluorescence (blue). Dashed lines are linear regressions and r is Pearson’s correlation coefficient.
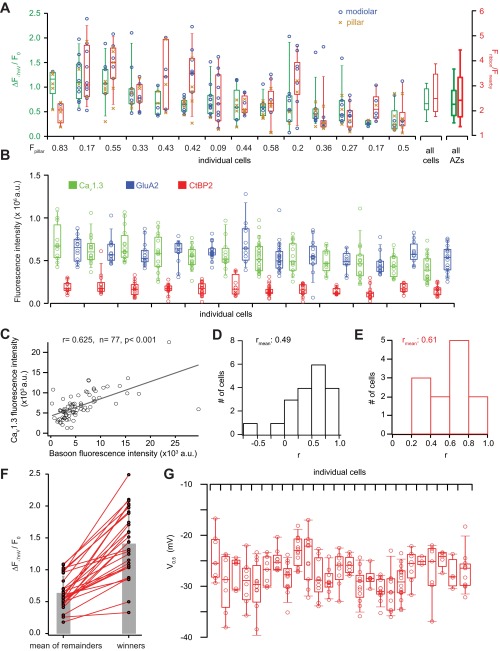
We first imaged the fluorescence of the TAMRA (tetramethylrhodamine)-labeled RIBEYE (major protein constituent of the ribbon)-binding peptide (26) to localize AZs and to measure the fluorescence intensity of labeled ribbons before unavoidable TAMRA bleaching by the strong blue laser light used for Ca2+ imaging. Another set of images was collected after completing the time-critical Ca2+ imaging to capture IHC morphology based on the RIBEYE-peptide background fluorescence (Fig. 1A). Supported by our previous work we assume that, in conditions of strong cytosolic Ca2+ buffering (10 mM EGTA in the pipette), the fluorescence change (ΔF/F0, Fig. 1B) of the low-affinity Ca2+ indicator at the AZ faithfully reports synaptic Ca2+ influx (11), but note that this assumption could be violated should Ca2+-indicator saturation or Ca2+-induced Ca2+ release, nonetheless, occur. For simplicity, we hence refer to the Fluo-8FF ΔF/F0 at AZs as “synaptic Ca2+ influx.” We depolarized the IHC to −7 mV to maximize Ca2+-channel-open probability. As shown in Fig. 1B, the “maximal synaptic Ca2+ influx” varied among the AZs of this representative IHC, whereas the whole-cell Ca2+ current remained stable. We postulate that this heterogeneity largely arises from differences in the number of Ca2+ channels among the AZs within a given IHC. The coefficient of variation (c.v.) of maximal AZ Ca2+ influx per IHC was on average similar to the c.v. of maximal AZ Ca2+ influx across AZ pooled from all IHCs (c.v. = 0.47 ± 0.18, N = 28 IHCs vs. c.v.= 0.59, n = 331 AZs of the same 28 IHCs; Fig. 1 D and F), whereas the c.v. of maximal AZ Ca2+ influx across all IHCs was smaller (0.38). Thus, most of the AZ population variance was explained by heterogeneity among the AZs within the individual IHCs. However, IHCs varied in the extent of this heterogeneity: The c.v. of maximal Ca2+ influx among AZs per IHC ranged from 0.15 to 0.81 (Fig. 1F; see Fig. S1A for statistics of individual IHCs).
Fig. S1.
Quantification of functional and molecular markers of the strength of IHC synapses. (A) Box plots (10, 25, 50, 75, and 90% values) show the statistics of maximal AZ Ca2+ influx (ΔF−7mV/F0, green) intensity and of RIBEYE-peptide fluorescence (red) of AZs in individual cells (left), of mean ΔF−7mV/F0 and mean RIBEYE-peptide fluorescence of all cells (right), and of ΔF−7mV/F0 and of RIBEYE-peptide fluorescence all AZs (rightmost) as recorded in the live-imaging experiments. Individual data points are superimposed on the box plots of the individual IHCs, with color coding for modiolar (blue) or pillar (amber) position of the AZ. The number underneath each IHC represents the fraction of pillar AZs. (B) Statistics of the immunofluorescence for all labeled synapses of individual IHCs in the organ of Corti. Box plots display the distributions of the immunofluorescence intensity of presynaptic Cav1.3 clusters (green) and RIBEYE/CtBP2-labeled ribbons (red) as well as GluA2-labeled glutamate receptor clusters (blue). Individual data points are superimposed on the box plots of the individual IHCs. (C) Scatter plot of the immunofluorescence intensity of presynaptic Cav1.3 clusters and corresponding bassoon immunofluorescence. (D) Correlation of maximal AZ Ca2+ influx and RIBEYE-peptide fluorescence within individual IHCs. Histogram displays the distribution of the correlation coefficients of individual IHCs in the live-imaging experiment: The average correlation coefficient among cells in the live-imaging experiment was 0.49. (E) Correlation of CaV1.3 and RIBEYE/CtBP2 immunofluorescence within individual IHCs. Histogram displays the distribution of the correlation coefficients of individual IHCs in the immunolabeled organ of Corti. The averaged correlation coefficient among cells was 0.61 in immunohistochemistry. (F) AZ Ca2+ influx between the strongest AZ (winners) and the mean of the remaining AZs in individual IHCs. Gray: mean ± SEM. (G) Box plots and individual values of V0.5 of the AZs within individual IHCs.
We directly tested for heterogeneous abundance of Ca2+ channels at AZs by analyzing the relative fluorescence intensities of IHC AZs immunolabeled for Cav1.3 L-type Ca2+ channels (Fig. 1 C and D, blue), which mediate >90% of IHC Ca2+ influx (27, 28). To measure the relative abundance of Cav1.3 Ca2+ channels among AZs, we identified synapses in fixed tissue by juxtaposition of immunolabeled presynaptic ribbons and postsynaptic glutamate receptors (Fig. 1C) and integrated the synaptic Cav1.3 immunofluorescence. Interestingly, the variability of the synaptic CaV1.3 immunofluorescence was smaller (c.v. = 0.28) than that of maximal Ca2+ influx in live-cell imaging experiments (c.v. = 0.59, Fig. 1D; see statistics of individual cells in Fig. S1 A and B). Variance in maximal Ca2+ influx exceeding that of CaV1.3 immunofluorescence could be explained, for example, by AZs having CaV1.3 channels with different open probabilities.
Ca2+-Channel Abundance and Maximal Ca2+ Influx Scale with Ribbon Size.
Do larger AZs contain more Ca2+ channels and display stronger maximal Ca2+ influx? To address this, we related our estimates of Ca2+-channel abundance from live imaging and immunohistochemistry to the corresponding fluorescence intensity of RIBEYE-peptide or immunolabeled ribbons (Fig. 1 A and C; see statistics of individual cells in Fig. S1 A and B). We assume that ribbon fluorescence scales with the number of RIBEYE molecules per ribbon and, hence, with ribbon size (26, 29). Moreover, we assume that AZ size scales with ribbon size (29, 30), which was further supported by a positive correlation of synaptic immunofluorescence of RIBEYE and the AZ marker bassoon, a presynaptic scaffold, in separate experiments (r = 0.46, n = 77 AZs, P < 0.001). The distributions of ribbon fluorescence intensity were broad and slightly skewed in live imaging (Fig. 1 E and F; c.v. of 0.46 for the entire population and 0.31 as the mean c.v. of individual cells, Fig. S1D) and immunofluorescence (c.v. of 0.46 for the entire population and 0.42 as the mean c.v. of individual cells) analyses, respectively.
Maximal AZ Ca2+ influx showed a positive correlation with the RIBEYE-peptide fluorescence in live-imaging experiments, suggesting that, indeed, larger AZs exhibit stronger maximal Ca2+ influx (Fig. 1G, green). We found a stronger correlation between CaV1.3 and RIBEYE immunofluorescence (Fig. 1G, blue), indicating that larger AZs contain more Ca2+ channels. This weaker correlation in live imaging might relate to greater variability of maximal synaptic Ca2+ influx, which next to the number of Ca2+ channels depends on their open probability that can also be enhanced by calmodulin-mediated cooperative gating (31). Positive correlations were also found within most individual IHCs in both live-cell imaging and immunohistochemistry (Fig. S1 D and E), indicating that larger AZs tended to have more Ca2+ channels and, consequently, stronger maximal Ca2+ influx. This was further supported by finding a positive correlation of synaptic CaV1.3 and bassoon immunofluorescence in separate experiments (Fig. S1C, r = 0.625, n = 77 AZs, P < 0.001). Most cells contained an AZ whose Ca2+ influx was substantially stronger than that of the others: On average the ΔF/F0 of the strongest AZ (“winner”) was 2.5 times greater than the average of the others (Fig. S1F, P < 0.001, Wilcoxon rank sum test).
Maximal Ca2+ Influx Varies with AZ Position in a Modiolar–Pillar Gradient.
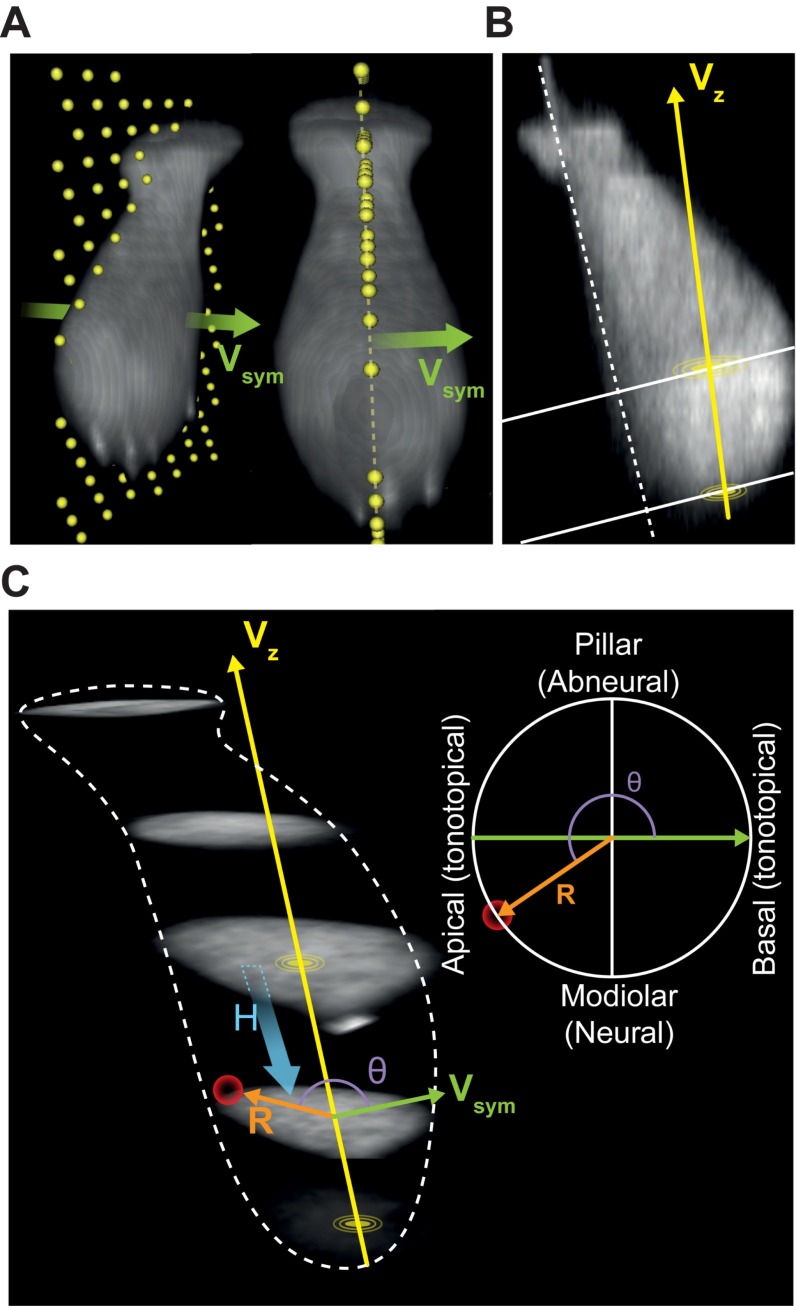
To study whether structural and functional AZ properties vary with position in mouse IHCs, we maintained the native morphology and position of the IHC within the organ of Corti as much as possible, by patching the modiolar IHC face with minimal disruption of the surrounding cells. To combine live-imaging data from several cells, we reconstructed the morphology of individual IHCs and the positions of their synapses based on the fluorescence of the TAMRA-conjugated RIBEYE-binding peptide and then transformed the Cartesian coordinates onto cell-aligned cylindrical coordinates (Fig. S2). In brief, for each cell we identified the plane of maximized mirror symmetry orthogonal to the tonotopic axis (Fig. S2A). Then, we optically resectioned the IHC orthogonal to a straight line fit to the pillar edge of the plane of symmetry (Fig. S2B). We estimated the center of mass for each section and connected those of the bottom-most and of the largest section to define the central axis for our cylindrical coordinate system. We projected the AZ coordinates of several cells along their central axis for the polar charts, with the four sides annotated as modiolar or pillar (facing toward or away from the ganglion), or tonotopic-apical or tonotopic-basal (toward the cochlear apex or base, Fig. S2C). The analogous fixed-tissue volumes were also transformed into cylindrical coordinates (Fig. S3).
Fig. S2.
The method and definition for the reconstruction of hair cell in cylindrical-like coordination system. (A) Three-dimensional images of an IHC from different viewpoints. (Left) The viewpoint from modiolar (tonotopically) basal side. (Right) The viewpoint from modiolar side. The plane containing yellow dots depicts the plane of symmetry of the IHC and the green arrow represents the normal vector of the plane of symmetry (Vsym). (B) The plane of symmetry: The white dot line is drawn along the pillar edge of the IHC. The original 3D stack image was sectioned along this line. The yellow disk is the center of the new coordination system, which is the center of mass of the section containing the largest area of cell fluorescence. The central axis Vz connects the origin to the center of mass of the lowest section. (C, Right) The distance of a synapse (the red ball) to the center of mass of the plane containing this synapse. H, distance in height between the plane containing origin to the plane containing the synapse; Θ, angle of R to Vsym. We identified the plane of symmetry by maximizing mirror symmetry along the orthogonal tonotopic axis (A). Then we sectioned the IHC in a straight line (white dashed line, B) which fits to the pillar edge on the plane of symmetry. The center of mass for each section was estimated and we connected the center of the bottom-most one to the center of the largest section to form the central axis (Vz, B and C). The cylindrical coordinate of each synapse/microdomain was transformed based on the central axis Vz, vector of plane of symmetry Vsym, and their cross-product Vmp.
Fig. S3.
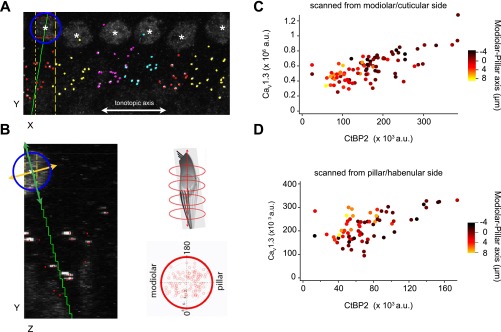
Analysis of AZ properties by synaptic position on the IHC. (A and B) Multicellular alignment via 3D transformation from Cartesian coordinates of the confocal stack to a cell-centric cylindrical coordinate system, using custom MATLAB routines. For each cell, the nuclear center (white asterisks) was registered in three dimensions using the nuclear immunoreactivity of the CtBP2 antibody. The tonotopic dimension for each image was approximated as the confocal microscope’s X dimension (white line in A) by adjusting the rotation of the region of interest. Synapses were sorted by cell, based on proximity to nuclei and orientation of each juxtaposed pre- and postsynaptic pair of CtBP2- and GluA2-labeled puncta. A and B show the CtBP2 channel only. Presynaptic ribbons are marked with dots colored by cell. The center of the nucleus defined one point on a line chosen as the cell’s central longitudinal axis. The cell on the left of A (XY plane) has a blue circle around the nucleus. IHCs were visualized individually in the ZY plane by projecting a volume limited along the X axis, within the width of the cell nucleus (yellow vertical lines in A). Synapses belonging to this cell, but positioned outside of the subvolume displayed in the ZY plane, were included as colored markers (red dots without accompanying fluorescence in B). The center of each nucleus was defined as zero on the central longitudinal axis, which extended positively toward the basal pole of the IHC from the direction of the cuticular plate toward the habenula perforata. The second point defining this axis was set by adjusting the axis line in the XY plane (green line in A) and in the ZY plane (green line in B). In the YZ plane, visualizing only the synapses belonging to the cell being analyzed, the axis was chosen based on a user-defined balance of synapses on either side of a line through the nuclear center and through the cluster of synapses at the basal pole. The IHC central longitudinal axis (green) is perpendicular to the defined modiolar–pillar axis in the ZY plane (orange line in B). Using the cell-centric cylindrical coordinates, data from all six cells in the image were overlaid on a projection along the longitudinal axis (polar plot, B, lower right). The longitudinal axis is orthogonal to the plane defined by the perpendicular tonotopic axis (0–180°) and modiolar–pillar axis. (C and D) Synapses with greater CaV1.3 and CtBP2 fluorescence tended to be positioned toward the modiolar side of the modiolar–pillar axis. In C, the scatter plot is for the six cells shown in A, imaged with the modiolar side toward the objective in a top-down sequence, imaging the modiolar-side synapses first. In D, the scatter plot is for the same six cells imaged with opposite orientation of the specimen, to control for potential artifacts due to optical attenuation and bleaching. The modiolar-side synapses closer to the coverslip and imaged first in C were further from the coverslip and imaged last in D. A similar relationship was observed in each case, showing that modiolar synapses tended to have more immunofluorescence for CaV1.3 and CtBP2.
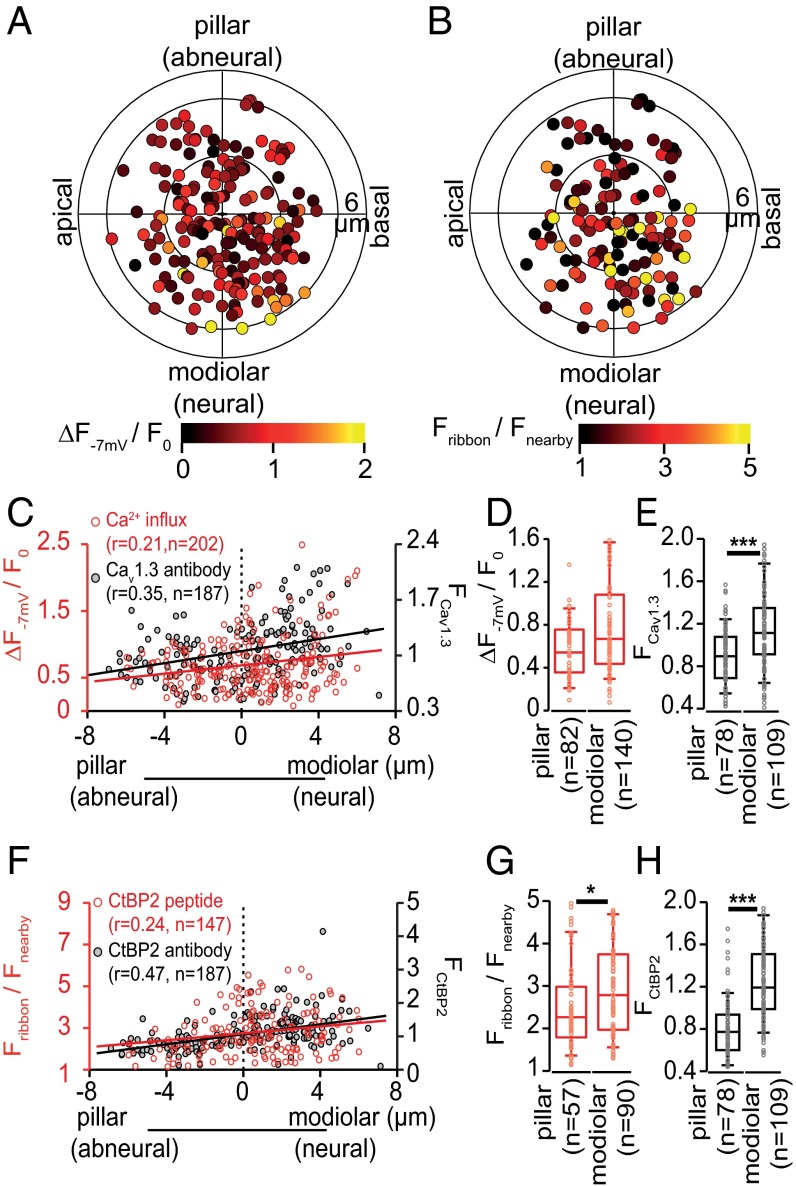
Polar charts of maximal Ca2+ influx and ribbon size for 202 AZs from 14 IHCs as a function of AZ cylindrical coordinates are displayed in Fig. 2 A and B. Our analysis revealed a modiolar–pillar gradient: large AZs with stronger Ca2+ influx tended toward the modiolar face (Fig. 2 A–D, F, and G). There was a nonsignificant trend for maximal Ca2+ influx to be greater in the modiolar half of the AZ population. This difference became significant when excluding the AZs of the basal IHC pole (r ≤ 3 µm, Fig. S4A, P = 0.024, Wilcoxon rank sum test), for which modiolar/pillar sorting is less certain. In 13 out of 14 IHCs the AZ with the strongest Ca2+ influx was located on the modiolar side. CaV1.3 immunofluorescence was significantly more intense for modiolar AZs (Fig. 2 C and E, P < 0.001, Wilcoxon rank sum test). RIBEYE-peptide ribbon fluorescence (Fig. 2 B, F, and G, P < 0.05, Wilcoxon rank sum test) and RIBEYE immunofluorescence (Fig. 2 F and H, P < 0.01, Wilcoxon rank sum test) consistently revealed significant modiolar–pillar differences, indicating that modiolar AZs are larger. In contrast, we did not detect gradients along the tonotopic or the central axes of the IHCs for any of the analyzed parameters (Fig. S4 B and C). In conclusion, IHC AZs follow a modiolar–pillar gradient for size and Ca2+-channel number, whereby modiolar AZs are larger and have more Ca2+ channels.
Fig. 2.
Maximal synaptic Ca2+ influx varies with AZ position in IHCs: modiolar–pillar gradient. (A) The polar chart displays intensity of maximal AZ Ca2+ influx (ΔF−7 mV/F0) as a function of AZ position in live-imaging experiments. Modiolar and pillar refer to facing toward or away from the ganglion in the modiolus; apical and basal refer to the tonotopic axis of the organ of Corti. The radius of the inner circle is 3 µm. Data were pooled from 21 IHCs. (B) The polar chart displays locations and intensity of AZ TAMRA-peptide fluorescence intensity in live-imaging experiments. Data were pooled from 14 IHCs. (C) Maximal AZ Ca2+ influx (red, 202 AZs of 21 cells) and integrated AZ Cav1.3 immunofluorescence (black, 187 AZs of 12 cells) as a function of position along the modiolar–pillar axis. Solid lines represent linear regressions and r indicates the Pearson’s correlation coefficient. (D) The box plot (10, 25, 50, 75, and 90% percentiles) shows the statistics of maximal AZ Ca2+ influx for the modiolar (140 AZs) and pillar (82 Azs) halves of the same IHCs as in A. No significant difference was reported by Wilcoxon rank sum test (P = 0.33). (E) The box plot shows the statistics (as in D) of Cav1.3 immunofluorescence intensity for AZs of 12 cells, which was stronger on the modiolar (109 AZs) than on the pillar side (78 AZs, P < 0.001). (F) Spatial gradient of AZ TAMRA-peptide fluorescence in live-imaging (red, 14 IHCs) and CtBP2/RIBEYE immunofluorescence (black circle, same AZs as in E) along the modiolar–pillar axis. (G and H) The box plot shows the statistics (as in D) of the TAMRA-peptide fluorescence intensity (G) and CtBP2/RIBEYE immunofluorescence intensity (H). Both measures indicate greater CtBP2/RIBEYE abundance on the modiolar side than on the pillar side: G, P < 0.05 and H, P < 0.001.
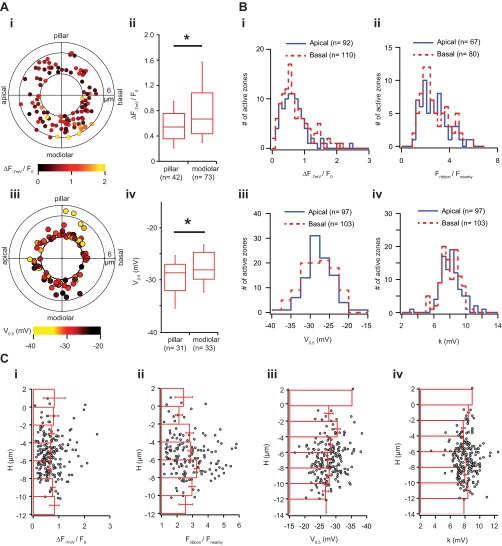
Fig. S4.
AZ properties as a function of position within the IHC. (A) Spatial distribution of maximal AZ Ca2+ influx (ΔF−7mV/F0) without the basal cap. (i) Polar chart displays ΔF−7mV/F0 as a function in position, when AZ were projected along the central axis. In contrast to Fig. 2A, we removed AZs with a radius smaller than 3 µm, which are mostly located on the basal end of IHC (n = 115) and pose a challenge to assign to one of the sectors. (ii) Box plots describe the distribution of ΔF−7mV/F0 of modiolar and pillar halves. The AZs on the modiolar half had significantly stronger ΔF−7mV/F0 than those on the pillar half. (iii) Polar chart displays V0.5 as a function in position, when AZ were projected along the central axis. In contrast to Fig. 4A, we removed AZs with a radius smaller than 3 µm, which are mostly located on the basal end of IHC and pose a challenge to assign to one of the sectors. (iv) Box plots describe the distribution of V0.5 on modiolar and pillar halves. The AZs of the pillar half had significantly more hyperpolarized V0.5 than those of the modiolar side. (B) No obvious gradients of synaptic properties along the tonotopic axis. (i) The distributions of maximal AZ Ca2+ influx (ΔF−7mV/F0), (ii) intensity of RIBEYE-peptide fluorescence, (iii) V0.5, and (iv) k in both tonotopical apical (low-frequency) and basal (higher-frequency) sides of IHCs. There are no significant statistical differences observed between these two sides in all four measured parameters (Wilcoxon rank sum test). (C) No obvious gradients of synaptic properties along the longitudinal axis. This figure shows the spatial arrangements of (i) maximal AZ Ca2+ influx (ΔF−7mV/F0), (ii) the intensity of RIBEYE-peptide fluorescence, (iii) V0.5, and (iv) k along the longitudinal axis of the IHC. The 0 layer of the H position corresponds to the plane with the largest IHC cross-section on the axis Vz (Fig. S2). Positive H values indicate an AZ position closer to cuticular plate, and negative closer to the basal pole. Red bars in this figure represent the mean and SD of the corresponding quantity in their specified longitudinal positions.
Voltage Dependence of Ca2+ Influx Varies with AZ Position in a Pillar–Modiolar Gradient.
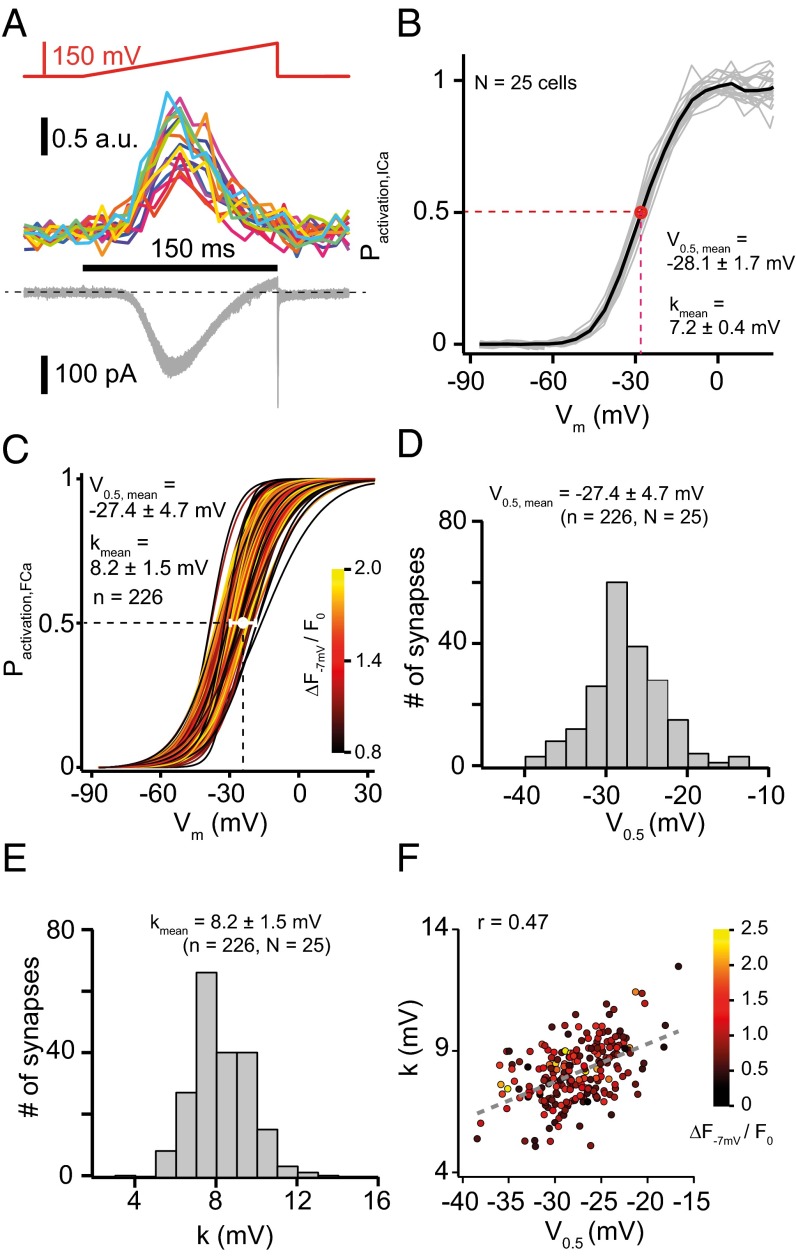
Next, we examined the voltage dependence of synaptic Ca2+ influx for most if not all AZs of a given IHC. We applied voltage ramps (from −87 mV to 63 mV) to the IHC while sequentially imaging the AZs (Fig. 3A), thereby establishing the voltage dependence of AZ Ca2+ influx in single depolarizations. Using ramps instead of step depolarizations, we limited stimulation to at most 80 depolarizations per IHC. We estimated the voltage of half-maximal activation of the whole-cell Ca2+ current of 25 IHCs by fitting a Boltzmann function to their activation curves [V0.5 = −28.1 ± 1.7 mV (SD), Fig. 3B]. Given the noise of the fluorescence–voltage relationships of the individual AZs we approximated the data by a fit function (SI Methods) and then analyzed the derived fractional activation curves by fitting a Boltzmann function. The mean V0.5 of synaptic Ca2+ influx at 210 AZs of these IHCs (−27.4 mV) was very similar to that of the mean whole-cell Ca2+ influx. However, fractional activation varied substantially among the AZs (Fig. 3C). Accordingly, the V0.5 of Ca2+ influx showed a wide distribution for the entire AZ population, ranging from −38.4 mV to −18.1 mV (SD: 4.7 mV, Fig. 3 C and D) and within the individual IHCs [mean: −27.3 ± 3.2 mV (SD), Fig. S1G]. The voltage sensitivity of Ca2+ influx reported by the slope factor k was similar for whole-cell and synaptic Ca2+ influx (7.2 ± 0.4 mV vs. 8.2 ± 1.5 mV, Fig. 3 B and E). The scatter plot of slope factor and V0.5 (Fig. 3F) also presents the maximal Ca2+ influx (color scale) for a total of 210 AZs: The synapses with the strongest maximal Ca2+ influx showed intermediate V0.5. We found a tendency for synapses with more hyperpolarized V0.5 to have greater voltage sensitivity (i.e., smaller k; r = 0.47).
Fig. 3.
Heterogeneity of voltage-dependent activation of AZ Ca2+ influx in IHCs. (A) Representative experiment analyzing voltage-dependent activation of AZ Ca2+ influx. Ramp depolarizations were used (Upper: from −87 mV to 63 mV in 150 ms, that is, 1 mV/ms), which elicited Ca2+ influx at the AZs (Middle) and whole-cell Ca2+ currents (Lower) within an individual cell. (B) Fractional activation of the whole-cell Ca2+ current: data from 25 IHCs (gray) and average (black). The red circle and error bars indicate the mean and SD of V0.5 of these 25 IHCs. (C) Fractional activation of 210 AZs, which are coded by colors according to their ΔF−7 mV/F0. The white circle and bars represent the mean and SD of the V0.5 of Ca2+ influx at these AZs. (D and E) Histograms of V0.5 (D) or slope factor k (E) of all AZs along with mean and SD. (F) Relation of V0.5 and k of the 210 AZs with color indicating their maximal Ca2+ influx. The gray dashed line represents a line fit to the k vs. V0.5 relationship with r = 0.47.
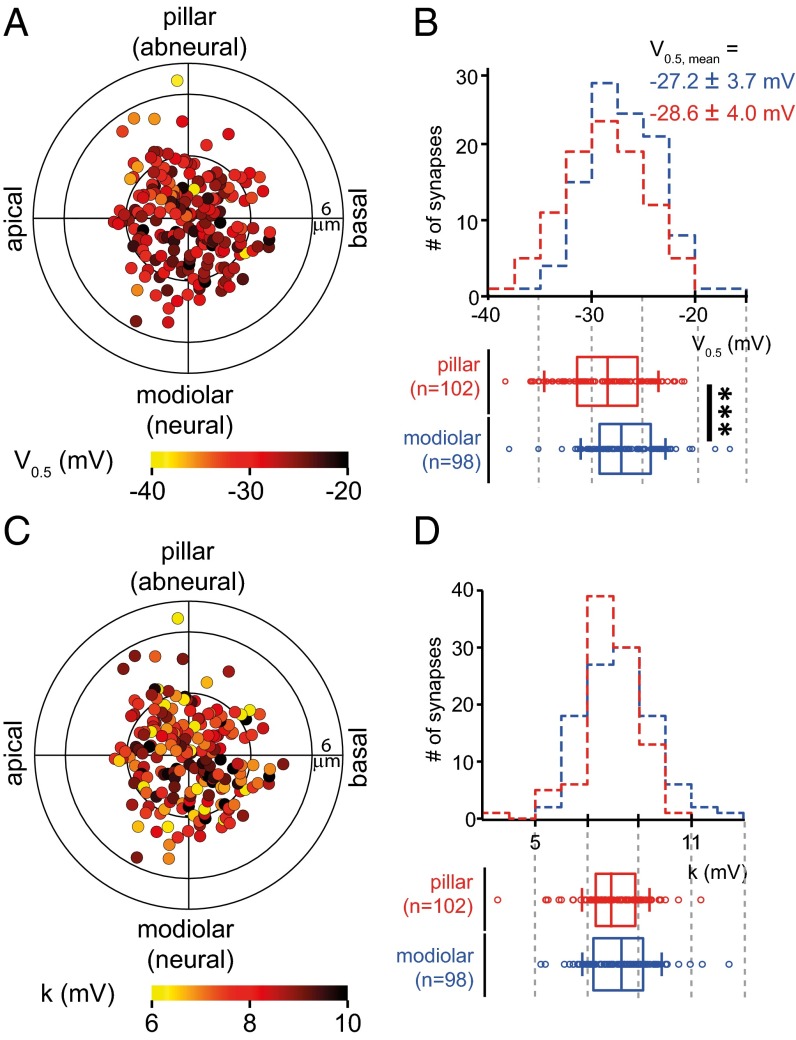
We found that, on average, Ca2+ influx at pillar AZs had slightly more hyperpolarized V0.5 than that of the modiolar ones (Fig. 4 A and B, ∼1.4 mV, P < 0.001, Wilcoxon rank sum test), whereas there was no significant difference in voltage sensitivity between pillar and modiolar synapses (Fig. 4 C and D, P > 0.05, Wilcoxon rank sum test). We did not detect gradients along the tonotopic and central axes of the IHCs for either V0.5 or k (Fig. S4 B and C). In summary, our data indicate major differences in presynaptic Ca2+ signaling for a given receptor potential. This may translate into differences in transmitter release and postsynaptic spiking. The more negative operating point of pillar AZs might account for the high spontaneous rates and low sound thresholds of SGNs emanating from pillar synapses reported for the cat. How the pillar–modiolar gradient of the voltage dependence of Ca2+ influx may be reconciled with the opposing modiolar–pillar gradient of maximal Ca2+ influx is discussed below.
Fig. 4.
Spatial gradients of voltage-dependent activation of AZ Ca2+ influx. (A and C) Polar charts display V0.5 (A) and k (C) of 210 AZs of 25 IHCs as a function of AZs location within IHCs (as in Fig. 2A). (B and D) (Upper) Histograms of V0.5 (B) or k (D) of AZs on the modiolar side (blue) and pillar side (red). (Lower) The box plots of V0.5 or k for pillar and modiolar AZs. V0.5 was more hyperpolarized for pillar AZs than for modiolar AZs (P < 0.001, Wilcoxon rank sum test). Modiolar and pillar AZs did not show statistically significant differences in k.
Probing Molecular Candidate Mechanisms for Regulation of Synaptic Ca2+ Influx.
How does the IHC, a compact presynaptic cell, establish heterogeneity of Ca2+ influx among its AZs? Here, we considered two classes of candidate mechanisms: (i) differences in the subunit composition of the Ca2+-channel complex and (ii) different interaction partners. The pore-forming CaV1.3α and the auxiliary CaVβ2 are the dominating subunits of IHC Ca2+-channel complexes, but other subunits contribute (27, 28, 32, 33). Differences in the biophysical properties of CaV1.3 Ca2+ channels among IHC AZs might arise from the preferential abundance of specific auxiliary subunits (32, 33) or splice variants of the pore-forming α subunit (34, 35).
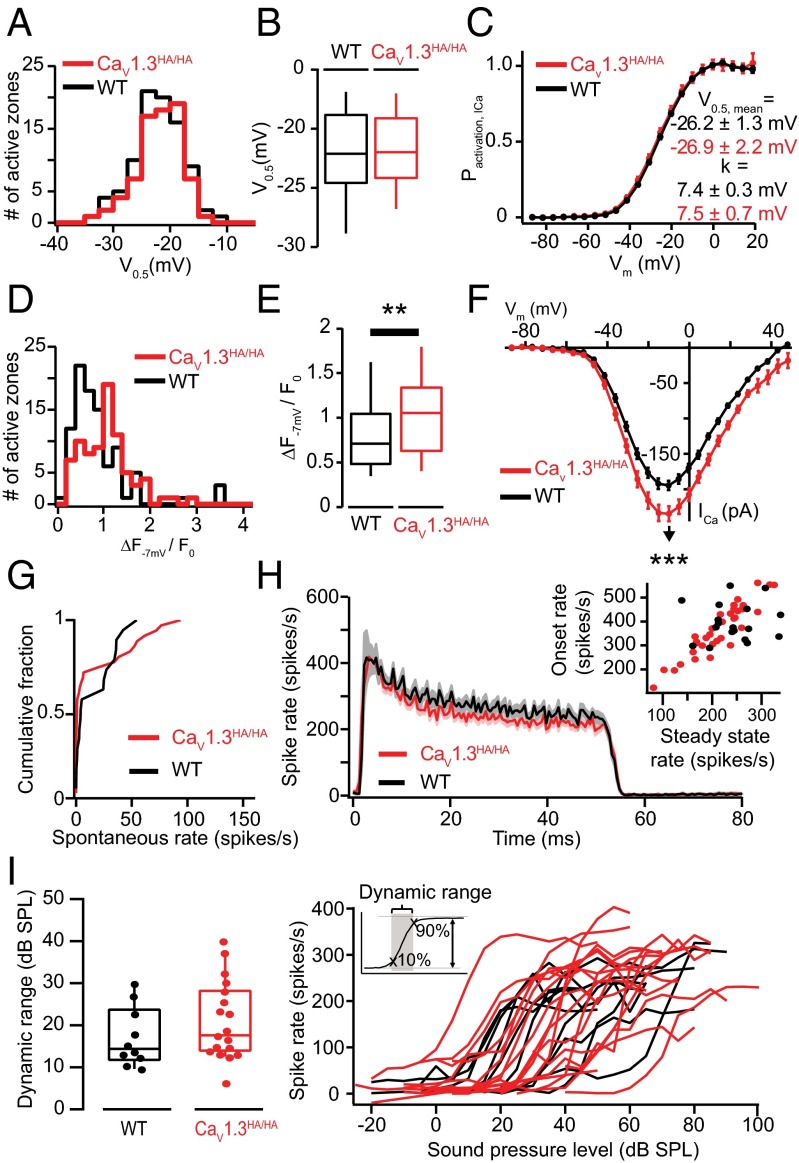
Indeed, analysis of splice variants with short C terminus or long C terminus, both expressed by IHCs (36), in HEK293 cells revealed more hyperpolarized activation and higher open probability for short splice variants of the channel (34, 35). Here, we studied synaptic Ca2+ influx in IHCs of knock-in mice expressing the pore-forming CaV1.3α with an HA-tag in exon 49 (36). The HA-tag disrupts the C-terminal automodulatory domain in the long CaV1.3α splice variant. This preserves potential C-terminal protein interaction domains but when expressed in HEK293 cells functionally converts the gating of “long” splice variants to that of “short” ones. Therefore, we expected to find more hyperpolarized activation of synaptic Ca2+ influx. However, the mean V0.5 (t test) and its variance (Levene’s test) were unchanged (Fig. 5 A–C), whereas the maximal AZ Ca2+ influx (Fig. 5 D and E, P < 0.005, Wilcoxon rank sum test) and whole-cell Ca2+ current (Fig. 5F) were larger. Next, we studied sound encoding at the single SGN level in CaV1.3HA/HA mice and found a normal distribution of spontaneous firing rates (Fig. 5G), normal sound-evoked firing rates (Fig. 5H), and normal sound-pressure dependence of firing (Fig. 5I). The observed lack of effect of the C-terminal CaV1.3α manipulation on the voltage dependence of Ca2+ current activation may be due to strong regulation of CaV1.3 in IHCs by interactions with Ca2+-binding proteins (37–39). The increased maximal Ca2+ influx, likely resulting from an increased open probability (34), apparently did not change SGN firing behavior.
Fig. 5.
Disrupting the C-terminal regulatory domain of CaV1.3 does enhance maximal synaptic Ca2+ influx but does not alter V0.5 heterogeneity and sound encoding. (A) Distributions of V0.5 of the AZ Ca2+ influx in Cav1.3HA/HA (red, 76 AZs of 10 IHCs) and WT (black, 89 AZs of 10 IHCs) mice. Experiments were performed as in Fig. 3. (B) Box-whisker charts of V0.5 of the AZ Ca2+ influx: nonsignificant differences for Cav1.3HA/HA. (C) Comparable fractional activation of Ca2+ current as a function of voltage for IHCs of both genotypes. Neither V0.5 nor k has significant differences observed between the two different mouse strains. Experiments and analysis were conducted as described in SI Methods. (D) Distributions of maximal AZ Ca2+ influx in Cav1.3HA/HA (red, 79 AZs of 10 IHCs) and control (black, 94 AZs of 10 IHCs) mice. Experiments were performed as in Fig. 1B. (E) Box-whisker charts of maximal AZ Ca2+ influx in Cav1.3HA/HA IHCs, which was significantly stronger than that of WT IHCs (P < 0.01, Wilcoxon rank sum test). (F) Current–voltage relationship of the whole-cell Ca2+ current of IHC in WT (black) or Cav1.3HA/HA (red). The Cav1.3HA/HA IHC has larger maximal Ca2+ current than the WT cells (P < 0.001, ICa,−7 mV,WT = −194.6 ± 6.6 pA, ICa,−7 mV,HA = −234.6 ± 10.6 pA). The errors in this panel are SEM. (G) Histogram showing the spontaneous rate distribution of CaV1.3HA/HA and WT SGNs. (H) Average poststimulus time histogram of SGN responses to 50-ms suprathreshold tone bursts at the characteristic frequency. Both the onset (average firing rate in a 1-ms window after median first spike latency) and steady-state rate (average firing rate over the last 5-ms window of 50-ms tone bursts) did not differ significantly between CaV1.3HA/HA and WT SGNs. (I) Rate-level functions (Right) and dynamic range (Left) for CaV1.3HA/HA and WT SGNs. Dynamic range is defined as the range of sound pressure levels in which the rate-level function showed a rate increase between 10% and 90% of the difference between spontaneous and maximum rate. No statistically significant difference between the dynamic ranges was observed between CaV1.3HA/HA and WT SGNs (19 for CaV1.3HA/HA vs. 10 for WT SGNs, not significant by Wilcoxon rank sum test).
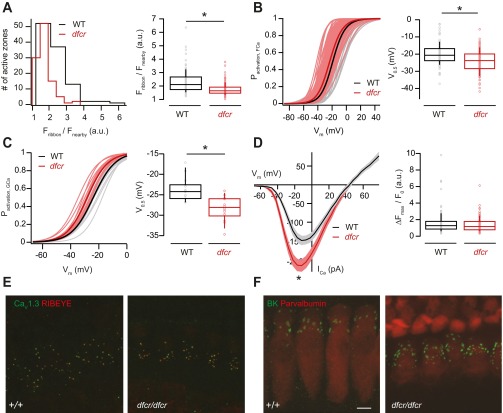
AZ proteins known to directly or indirectly interact with the Ca2+-channel complex include bassoon (40) and rab-interacting protein (RIM) (41, 42). Both positively regulate the number of Ca2+ channels at the IHC AZ (15, 43). Bassoon, moreover, contributes to establishing heterogeneity of maximal Ca2+ influx whereas RIM2α does not seem to be required. Another candidate interacting partner is harmonin, which regulates CaV1.3 Ca2+ channels, likely by binding of one of its PDZ domains to the ITTL motif of the extreme CaV1.3 C terminus (44, 45). Here, we revisited the regulation of IHC AZs by harmonin in deaf-circler mice (dfcr) (46), reasoning that site-specific expression of harmonin might contribute to the heterogeneity of maximal Ca2+ influx and voltage dependence of activation. Dfcr IHCs had weaker RIBEYE-peptide fluorescence regardless of the AZ position (Fig. S5A, P < 0.05, Wilcoxon rank sum test). AZ Ca2+ influx and whole-cell Ca2+ current activated at more hyperpolarized potentials (Fig. S5 B and C, P < 0.05, t test and Wilcoxon rank sum test, respectively). However, this V0.5 shift was observed for both modiolar and pillar dfcr AZs (both P < 0.05, one-way ANOVA with Tukey’s post hoc test), arguing against a substantial contribution of harmonin to presynaptic heterogeneity.
Fig. S5.
Genetic disruption of harmonin function leads to decreased ribbon size and hyperpolarizing shift of the activation of Ca2+ influx but leaves developmental confinement of Ca2+ and expression of large-conductance Ca2+-activated K+ channels unaltered. (A) Distribution of the intensities of AZ TAMRA-peptide fluorescence in dfcr (red, 105 AZs of 15 IHCs, c.v. = 0.26) and in WT (BALB/c, black, 107 AZs of 14 IHCs, c.v. = 0.35) IHCs (Left) and box plot (Right) depicting a significant decrease in the fluorescence intensity of labeled ribbons in dfcr IHCs (Left, P < 0.05, Wilcoxon rank sum test). (B) Fractional activation of AZ Ca2+ influx shows comparable heterogeneity of dfcr (red) and WT (black) IHCs, but a more hyperpolarized mean V0.5 in dfcr IHCs (Right, P < 0.05, t test). Experiments were performed as in Fig. 3. Thin lines present the fractional activation of individual AZs of dfcr (light red, 105 synapses) and WT (gray, 107 synapses) and thick red and black lines the mean fractional activation, respectively. (C) Fractional activation of the whole-cell Ca2+ conductance (GCa). (Left) The activation of single IHCs (thinner and lighter traces) from dfcr (red and light red, 14 IHCs) and WT (black and gray, 15 IHCs) and mean fractional activation of all IHCs (thick and dark traces), respectively. In agreement with the single AZ data (B), the mean V0.5 of the whole-cell Ca2+ conductance was also shifted toward more hyperpolarized potentials in the dfcr cells (Right, P < 0.05, Wilcoxon rank sum test). (D) Current–voltage relationship for ICa evoked by 20-ms voltage steps in whole-cell patch-clamp recordings from dfcr (red, 14 IHCs) and WT (black, 15 IHCs) cells showing an increased Ca2+ current peak in the dfcr mice (Left, mean ± SEM, P < 0.05, Wilcoxon rank sum test). However, the maximal AZ Ca2+ influx dfcr (red, 105 AZs, c.v. = 0.61) was not significantly different from that of WT (black, 107 AZs, c.v. = 0.83), suggesting an increased extrasynaptic Ca2+ influx (Right). (E) Maximum projection of confocal sections of organs of Corti immunolabeled for CaV1.3 (green) and RIBEYE/CtBP2 (red). Most CaV1.3 immunofluorescence was confined to presynaptic AZs (labeled by the RIBEYE immunofluorescence) in both dfcr (Right) and WT (Left) IHCs. Immaturity would have expected to show more ribbons and many more CaV1.3 immunofluorescence spots (29). (F) Maximum projection of confocal sections of organs of Corti immunolabeled for large-conductance Ca2+-activated K+ channels (BK, green) and the EF-hand Ca2+ binding protein parvalbumin (red). Spot-like BK immunofluorescence, most likely reflecting BK channel clusters was found at the ‟neck” of the IHC in both dfcr (Right) and WT (Left) IHCs. Immaturity would have expected to cause a lack of BK immunofluorescence. (Scale bar: 10 µm.)
The whole-cell Ca2+ influx was enhanced (P < 0.05, Wilcoxon rank sum test), but the mean synaptic Ca2+ influx was not (Fig. S5D), suggesting greater extrasynaptic Ca2+ influx in dfcr IHCs. To test for IHC immaturity and the greater extrasynaptic Ca2+ influx that accompanies it (29), we immunolabeled for CaV1.3 and large-conductance Ca2+-activated K+ channels (BK channels, Fig. S5 E and F). However, CaV1.3 was confined to synapses, which seemed present at normal numbers, and BK channels clustered at the IHC neck, both indicating IHC maturity. We speculate that the V0.5 shift reflects the absence of CaV1.3 regulation by harmonin or might relate to impaired mechanoelectrical transduction in dfcr mice (47).
Gipc3 Disruption Causes a Hyperpolarized Shift in Ca2+ Channel Activation and Enhances Spontaneous SGN Firing.
Another PDZ protein and candidate regulator of Ca2+ channels and AZ heterogeneity is Gipc3 (GAIP interacting protein, C terminus 3). Defects of the human GIPC3 gene cause human deafness (48, 49) and Gipc3 disruption in mice lead to audiogenic seizures and progressive hearing loss (48). GIPC proteins share a central PDZ domain flanked by GIPC homologous domains. Gipc1 has broad roles in intracellular protein trafficking and in hair cells is required for development of stereociliary bundles and planar cell polarity (50–52). We studied Black Swiss (BLSW, hereafter Gipc3 mutant) mice that carry a missense mutation in the Gipc3 gene (c.343G > A), which replaces a highly conserved glycine with an arginine at position 115 (Gly115Arg) located within the PDZ domain. Early-onset hearing impairment in Gipc3 mutant mice has been attributed to dysfunction of hair cell stereocilia, although its localization within hair cells resembles a cytoplasmic vesicular pattern similar to myosin VI (48). In the brain, glutamate release was shown to depend on interaction between myosin VI and its binding partner Gipc1 (50). In hair cells, a synaptic function for Gipc proteins is yet unknown.
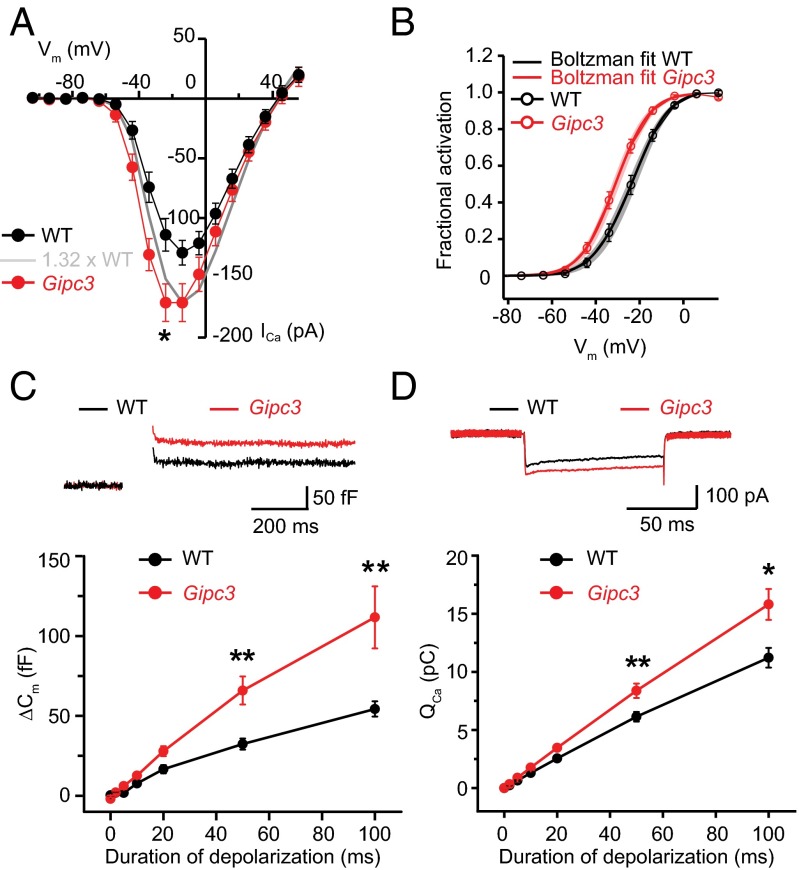
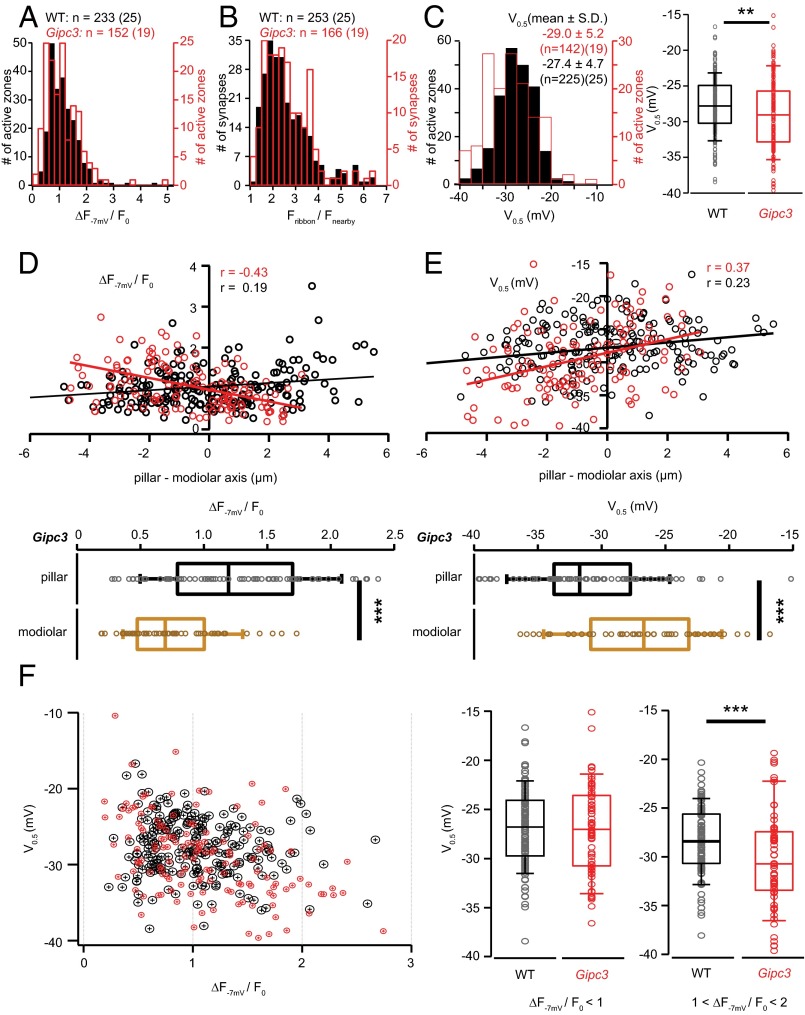
In Gipc3 mutant IHCs we found an increased whole-cell Ca2+ current (Fig. 6 A and D, P < 0.05, Wilcoxon rank sum test) and a more hyperpolarized V0.5 of activation [Fig. 6B, P = 0.004, Wilcoxon rank sum test; Gipc3 mutant IHCs: V0.5 = −31.2 ± 1.4 mV, n = 19 compared with C57BL/6J control IHCs (WT): V0.5 = −24.1 ± 1.8 mV, n = 20]. Moreover, we found Ca2+ current inactivation to be reduced in Gipc3 mutants when comparing Ca2+ currents elicited by 500-ms-long depolarizations (Ires/Ipeak 0.59 ± 0.04 for 10 Gipc3 mutant IHCs vs. 0.41 ± 0.03 for 8 WT IHCs, P = 0.007, Wilcoxon rank sum test). We also observed enhanced exocytosis reported as membrane capacitance increments (Fig. 6 C and D, significant for 50- and 100-ms-long depolarizations), likely as a consequence of the increased Ca2+ current. At the AZ level, the distributions of maximal Ca2+ influx (Fig. 7A) and RIBEYE-peptide fluorescence (Fig. 7B) and were comparable to WT, but the V0.5 distribution was broader in Gipc3 mutant IHCs and AZs activated at more hyperpolarized potentials on average (Fig. 6C, P < 0.01 for variance, Brown–Forsythe test and P < 0.01 for mean, Wilcoxon rank sum test). Opposite that in WT, maximal AZ Ca2+ influx (Fig. 7D) exhibited a pillar–modiolar gradient in Gipc3 mutants. As a result, the pillar AZs, operating at even more hyperpolarized potentials than in WT, also had stronger maximal Ca2+ influx on average (Fig. 7 D–F).
Fig. 6.
Disruption of Gipc3 results in increased amplitude and hyperpolarized shift of activation of IHC Ca2+ influx as well as enhanced exocytosis. (A) Average steady-state ICa-V of WT IHCs (black trace, 11 cells) and Gipc3 IHCs (red trace, 7 cells) acquired with 10-ms-long depolarizations (steady-state Ca2+ currents during depolarization): hyperpolarized voltage dependence and increased amplitude (ICa,−24 mV, WT = −110.6 ± 13 pA, ICa,−24 mV, Gipc3 = −166.2 ± 17.3 pA, <0.05, Wilcoxon rank sum test). Data are shown as mean ± SEM. (B) Fractional activation of Ca2+ current as a function of voltage for IHCs of WT IHCs (black trace, 19 cells) and Gipc3 IHCs (red trace, 20 cells). V0.5 of Gipc3 IHCs is significantly different from that of WT IHCs (<0.05, Wilcoxon rank sum test). Data are shown as mean ± SEM. (C) (Upper) Average capacitance increments (ΔCm) traces of WT IHCs (black trace, 11 cells) and Gipc3 IHCs (red trace, 8 cells) in response to 100-ms-long step depolarization to −14 mV. (Lower) Average ΔCm of p14-16 WT IHCs (black, 11 cells) and Gipc3 IHCs (red, 8 cells) for depolarizations of different durations. Capacitance increments are significantly increased in Gipc3 IHCs at depolarizations of 50 ms (WT: 32.4 ± 3.4 fF, Gipc3: 65.9 ± 8.7 fF, <0.01, Wilcoxon rank sum test) and 100 ms (WT: 54.3 ± 4.7 fF, Gipc3: 111.7 ± 19.4 fF, <0.01, Wilcoxon rank sum test). Data are shown as mean ± SEM. (D) (Upper) Average Ca2+ currents (QCa) traces of WT IHCs (black trace, 11 cells) and Gipc3 IHCs (red trace, 8 cells) in response to 100-ms-long step depolarization to −14 mV. (Lower) Average QCa corresponding to C). Ca2+ currents are significantly increased in Gipc3 IHCs (red) at depolarizations of 50 ms (WT: 6.1 ± 0.4 pC, Gipc3: 8.3 ± 0.6 pC, <0.01, Wilcoxon rank sum test) and 100 ms (WT: 11.2 ± 0.8 pC, Gipc3: 15.8 ± 1.3 pC, <0.05, Wilcoxon rank sum test). Data are shown as mean ± SEM.
Fig. 7.
Disruption of Gipc3 in mice shifts the activation of Ca2+ influx to more hyperpolarized potentials and reverses the modiolar–pillar gradient of maximal Ca2+ influx. (A) Distribution of maximal AZ Ca2+ influx in IHCs of Gipc3 mutant (red trace, n = 152, 19 cells) and WT mice (blue trace, 225 AZs of 25 cells). The experimental protocol is the same as Fig. 1B. (B) Distribution of the AZ TAMRA-peptide fluorescence in Gipc3 mutant IHCs (red trace, 166 AZs, 19 IHCs) and WT IHCs (blue trace, 253 AZs of 25 IHCs). (C, Left) Distribution of V0.5 of the voltage-dependent activation of AZ Ca2+ influx in Gipc3 mutant IHCs (red trace, 142 AZs of 19 IHCs) and WT IHCs (blue trace, n = 225, 25 cells). The experimental protocol is the same as Fig. 3A. (C, Right) Box plot of V0.5 of voltage-dependent activation of AZ Ca2+ influx in Gipc3 mutant IHCs: V0.5 was significantly more hyperpolarized in Gipc3 mutant IHCs (P < 0.01, Wilcoxon rank sum test). (D, Upper) Opposing gradients of maximal AZ Ca2+ influx in Gipc3 (red circle, 128 AZs of 19 IHCs) and WT (blue circle, 226 AZs of 25 IHCs) along the modiolar–pillar axis. Solid lines are their fitting lines, r indicates their correlation coefficients. (D, Lower) The box plots summarize the distributions of maximal Ca2+ influx of pillar and modiolar AZs for Gipc3 mutant IHCs. The maximal AZ Ca2+ influx of pillar AZs was significantly stronger than that of pillar AZs (P < 0.001, Wilcoxon rank sum test). (E) (Upper) Spatial distribution of the V0.5 in Gipc3 mutant IHCs (red circle, 119 AZs of 19 IHCs) and WT IHCs (blue, 194 AZs, 21 IHCs) along the modiolar–pillar axis. Solid lines are line fits to the data. (E, Lower) Box plots summarize the V0.5 distributions of pillar and modiolar AZs in Gipc3 mutant IHCs. The V0.5 of pillar AZs was significantly more hyperpolarized than that of modiolar AZs (P < 0.001, Wilcoxon rank sum test). (F, Left) The relationship of maximal AZ Ca2+ influx and V0.5 (red: Gipc3, blue: WT). (F, Right) Box-whisker charts summarize the distributions of V0.5 in subgroups of their ΔF−7 mV/F0: smaller than 1 (Left) and between 1 and 2 (Right). V0.5 of AZs from Gipc3 mutant IHCs were more hyperpolarized (−30.2 ± 4.9 mV) than those of WT IHCs (−28.4 ± 3.5 mV, P < 0.001, Wilcoxon rank sum test) for the subgroup of AZs with ΔF−7 mV/F0 is between 1 and 2, whereas it was statistically indistinguishable for the AZ subgroup with smaller maximal Ca2+ influx.
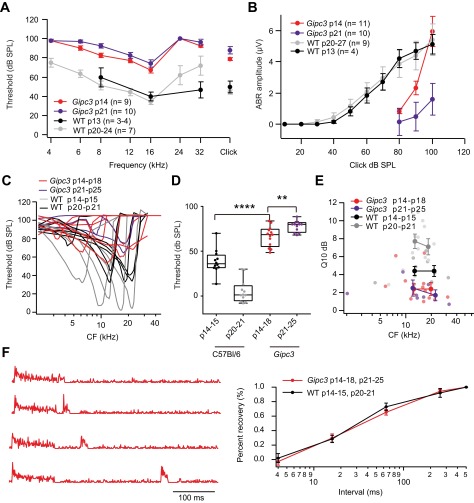
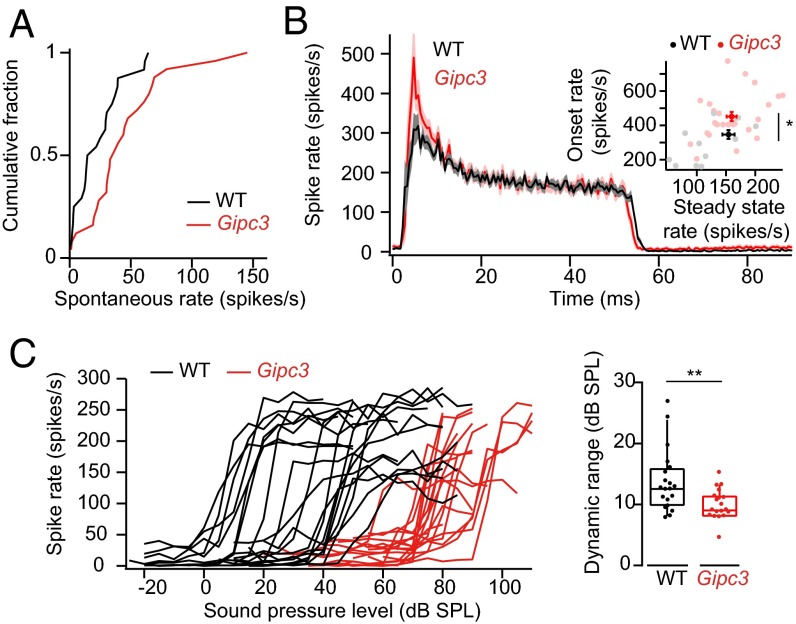
To relate these presynaptic observations to SGN firing properties, we performed in vivo recordings of SGN firing in Gipc3 mutant mice after onset of hearing [postnatal days (p) 14–25]. Gipc3 mutant mice showed elevated auditory brainstem response (ABR) thresholds at p14 and p21 (Fig. S6 A and B). Single SGN frequency tuning was broad and thresholds at the characteristic frequency in Gipc3 mutant mice were elevated on average by 28 dB (2 wk) and 72 dB (3 wk) (Fig. S6 B–D). These effects are attributable to impaired mechanoelectrical transduction and cochlear amplification (48). This stereociliary impairment precluded assessment of the influence of the observed hyperpolarized activation of Ca2+ channels on sound-response properties. However, in the absence of sound the spontaneous spike rate in SGNs comes from Ca2+-dependent transmitter release from the hair cell at its resting potential (53), allowing us to assess the effects of shifted voltage dependence of AZ Ca2+ influx on baseline release. Despite impaired transduction of sound, spontaneous SGN firing rates were elevated in Gipc3 mutant mice (P < 0.05, one-sided Kolmogorov–Smirnov test). In contrast to WT animals, where about 50% of SGNs had a spontaneous rate below 20 Hz, only 16% of SGNs in Gipc3 mutant mice exhibited spontaneous rates below 20 Hz (Fig. 8A). Some low-spontaneous-rate SGNs, which generally have higher thresholds, may not have been activated by the highest-intensity search stimuli (100-dB sound pressure level). Regardless, we found a greater abundance of SGNs with high spontaneous firing rates (28% with rates >50 Hz vs. only 12% in WT).
Fig. S6.
Auditory population responses, single unit tuning curves, and assessing recovery from adaptation using a forward masking paradigm in Gipc3 mutant mice. (A) ABR thresholds for tone burst stimuli and click were elevated in both p14 and p21 Gipc3 mutant mice compared with WT (C57BL/6). (B) Average ABR wave I amplitude as a function of click sound pressure level. At p14, higher click levels were needed to evoke a reproducible ABR wave I, but the amplitude of this wave can grow very steeply to a value that was comparable to WT controls. However, at p21, the wave I amplitude of Gipc3 mutant mice did not reach the level at p14 and of control. (C) Representative tuning curves of Gipc3 mutant SGNs. (D) Gipc3 mutant SGNs had elevated thresholds at the characteristic frequency in comparison with WT SGNs at comparable ages (66.6 ± 3.1, n =13 for Gipc3 mutant p14–18 vs. 38.5 ± 3.9, n = 12 for WT p14–15, P < 0.00001; 77.8 ± 1.8, n = 12 for Gipc3 mutant p21–25 vs. 5.4 ± 3.7, n = 12 for WT p20–21, P < 0.0001). (E) Sharpness of tuning was significantly broader in Gipc3 mutant SGNs (2.7 ± 0.5, n = 12 for Gipc3 mutant p14–18 vs. 4.3 ± 0.4, n = 12 for WT p14–15, P < 0.05; 2.1 ± 0.5, n = 7 for Gipc3 mutant p21–25 vs. 7.1 ± 0.6, n = 12 for WT p20–21, P < 0.0001). (F) Assessing recovery from adaptation using forward masking paradigm. (Left) Representative responses of a Gipc3 mutant SGN to the experimental paradigm that consisted of a 100-ms-long masker stimulus and a 15-ms probe tone (both tone bursts at the characteristic frequency, 30 dB above threshold). (Right) The time course of recovery was derived by normalizing the response to 15-ms probe stimulus to the last 15 ms (0% recovery) and first 15 ms of masker response (100% recovery). Gipc3 mutant SGNs (n = 9) showed a recovery time course similar to that of WT SGNs (n = 8).
Fig. 8.
Gipc3 disruption enhances spontaneous SGN firing. (A) Cumulative histogram of spontaneous rate distribution: no major overlap of the data. WT (C57BL/6) data were taken from ref. 19. The spontaneous rate of Gipc3 SGNs showed a shift of mean about 21.5 Hz in comparison with that of WT SGNs. The null hypothesis that the spontaneous discharge rates Gipc3 and WT SGNs came from populations with the same distribution was rejected, and the alternative hypothesis that the cumulative distribution function of WT was larger than that of Gipc3 SGNs was favored (P < 0.05, one-sided Kolmogorov–Smirnov test). (B) Peristimulus time histogram of 3-wk-old Gipc3 and WT SGNs to 50-ms suprathreshold tone bursts at the characteristic frequency. The onset firing rates of Gipc3 were elevated (451.4 ± 27.0 Hz for Gipc3 mutant, 25 SGNs vs. 347.1 ± 26.1 Hz for WT, 24 SGNs, P < 0.05). The steady-state firing rates did not differ significantly (159.5 ± 8.6 Hz for Gipc3 mutant, 25 SGNs vs. 154.3 ± 10.4 Hz for WT, 24 SGNs, not significant by Wilcoxon rank sum test). (C) Rate-intensity functions (Left) and dynamic range (Right) of sound encoding in Gipc3 and WT SGNs. Gipc3 SGNs had a narrower dynamic range than WT SGNs (9.9 ± 0.6 dB for Gipc3 p14–25, 19 SGNs vs. 13.7 ± 1.1 dB for WT p14–21, 20 SGNs, P < 0.01, Wilcoxon rank sum test).
Despite elevated thresholds in Gipc3 mutant mice that most likely resulted from impaired mechanotransduction and cochlear amplification, firing rates at sound onset were elevated when probed at 30 dB above threshold with tone bursts at the characteristic frequency in 2- to 3-wk-old mice. SGNs had onset rates of 451.4 ± 27.0 Hz for Gipc3 mutant (n = 25) vs. 347.1 ± 26.1 Hz for WT (n = 24, P < 0.05, Wilcoxon rank sum test). In contrast, the adapted firing rates were indistinguishable from WT (Fig. 8B). Consistent with the defect of cochlear amplification, rate vs. level functions had steeper slopes and significantly narrower dynamic ranges (Fig. 8C). Recovery from adaptation, most likely reflecting presynaptic replenishment of the readily releasable pool, proceeded at normal pace in Gipc3 mutant mice (Fig. S6F).
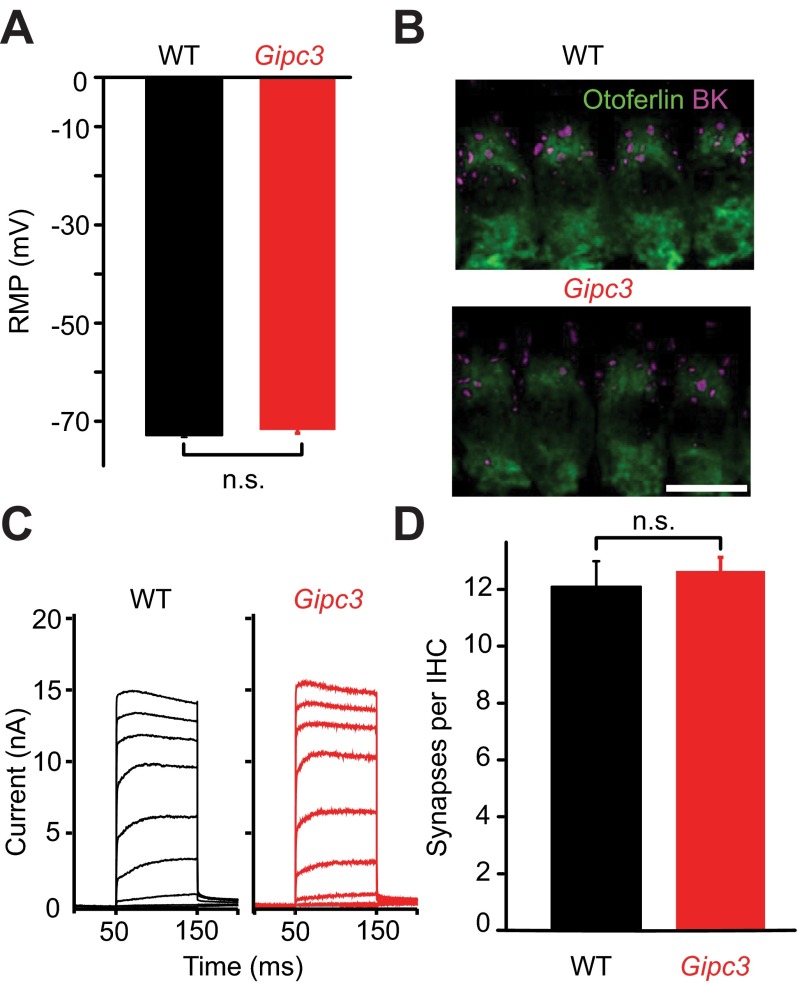
In principle, the increased spontaneous discharge rates of SGNs in Gipc3 mutant mice could have resulted from a more depolarized IHC resting membrane potential, potentially due to reduced basolateral K+ conductances (48). However, IHC resting membrane potentials were unaltered (Fig. S7A), BK channels clustered at the neck as in WT (Fig. S7B), and BK currents were normally sized (Fig. S7C) in Gipc3 mutant IHCs at p14–16, indicating normal IHC maturation (54). This notion was further corroborated by the normal number of ribbon synapses (Fig. S7D). In conclusion, disruption of Gipc3 produced a shift of Ca2+-current activation toward hyperpolarized potentials, reversed the modiolar–pillar gradient of maximal Ca2+ influx at IHC AZs, and increased spontaneous firing rates in SGNs.
Fig. S7.
Increased whole-cell Ca2+ current but largely maintained IHC K+ currents and synapses in IHCs of Gipc3 mutant mice. (A) The resting membrane potential as recorded in the current-clamp configuration was normal in Gipc3 mutant IHCs: 71.7 ± 0.7 mV, n = 12 for Gipc3 mutant IHCs vs. −72.8 ± 0.5 mV; n = 19, for WT IHCs (P = 0.21, both p14–16). (B) Maximum projection of confocal section of immunolabeled organs of Corti: Gipc3 mutant IHCs (visualized by otoferlin immunofluorescence) show clusters of large-conductance Ca2+-activated K+ channels (magenta) at their “neck” region. (C) Representative potassium currents in Gipc3 mutant and WT IHCs: no obvious reduction due to Gipc3 disruption. (D) Normal number of ribbon synapses in Gipc3 mutant IHCs of 2-wk-old mice (12.09 ± 0.9, n = 28 for WT, 12.6 ± 0.5, n = 44 for Gipc3, P = 0.48). Analysis was performed on confocal stacks of organs of Corti following immunolabeling for RIBEYE/CtBP2 and postsynaptic GluA2/3.
SI Methods
Animals.
C57BL/6 mice of either sex were used for hair cell physiology and morphology at p14–20 (Figs. 1–4). CaV1.3HA/HA mice (36) and littermate controls were provided by Jörg Striessnig, University of Innsbruck, Innsbruck, Austria, and used at p14–18 (patch clamp) and 6–8 wk (in vivo). Dfcr mice (46), Jax (Balb/C background), and littermates were used at p14–17. Gipc3 mutants (48) were compared with age-matched C57BL/6 at p14–27 (19).
Patch Clamp and Confocal Ca2+ Imaging.
Apical cochleae (first 2/3 turns) were freshly dissected. Inner border cells and phalangeal cells were gently removed by a suction pipette, exposing an IHC basolateral membrane. The patch pipette solution contained (in millimolar) 123 Cs-glutamate, 1 MgCl2, 1 CaCl2, 10 EGTA, 13 tetraethylammonium (TEA)-Cl, 20 Hepes, 2 MgATP, and 0.3 NaGTP (pH 7.3). For live imaging, it contained the Ca2+ indicator Fluo-8FF (0.8 mM; AAT Bioquest) and the TAMRA-conjugated CtBP2/RIBEYE-binding dimer peptide (20 µM; Biosynthan). For Fig. S5, we used 111 mM l-glutamate, 4 mM MgATP, 1 mM glutathione, 0.8 mM Fluo-4FF penta-K+ salt (Life Technologies), and 10 µM TAMRA-conjugated CtBP2/RIBEYE-binding dimer peptide. IHCs were continuously superfused with an extracellular solution containing (in millimolar) 102.2 NaCl, 2.8 KCl, 1 MgCl2, 5 CaCl2, 35 TEA-Cl, 10 Hepes, and 2 g/L glucose (pH 7.2). An EPC-10 amplifier and Patchmaster software (HEKA Elektronik) were used and Ca2+ influx was evoked by step depolarizations from −87 mV to −7 mV or ramp depolarizations from −87 mV to 63 mV. All voltages were corrected for liquid junction potential (17 mV) and voltage drops across series resistance (Rs). IHCs were held at −87 mV. Recordings were discarded when holding current exceeded 50 pA, Rs exceeded 10 MΩ within 4 min after break-in, or rundown of Ca2+ current exceeded 25%. Ca2+ imaging was performed with a spinning disk confocal scanner (CSU22; Yokogawa) mounted on an upright microscope (Axio Examiner; Zeiss) with 63×, 1.0 N.A. objective (W Plan-Apochromat; Zeiss). Images were acquired by a back-illuminated CCD camera with 80 × 80 pixels within a 19.2- × 19.2-mm CCD chip (NeuroCCD; Redshirt Imaging) or a scientific complementary metal–oxide–semiconductor camera (Neo; Andor). Ca2+ indicators and TAMRA-conjugated peptide were excited by diode-pumped solid-state lasers with 491-nm and 561-nm wavelength, respectively (Cobolt AB). The spinning disk was set to 2,000 rpm to synchronize with the 10-ms acquisition time of the camera. Using a piezo positioner for the objective (Piezosystem), focal planes were acquired in an order randomized in each cell to avoid systematic effects of fluorophore bleaching. Cm measurements were performed as previously described (69) and exocytic Cm changes calculate from the difference of Cm before and after the depolarization (400 ms, skipping the initial 40 ms).
Immunohistochemistry and Confocal Imaging.
The organ of Corti apical 2/3 turn was prepared for “whole-mount” imaging as described in ref. 70, but the protocol was modified after the secondary antibody rinse. The following primary antibodies were used: goat anti-CtBP2 (1:150; Santa Cruz Biotechnology), mouse anti-GluA2 (1:75; Millipore), rabbit anti-CaV1.3 (1:75; Alomone Labs), mouse anti-bassoon SAP7F407 (Abcam), rabbit anti-BKCa (1:200; Alomone Labs), and mouse anti-otoferlin (1:300; Abcam). Secondary antibodies used were Alexa Fluor 488-conjugated antimouse, Alexa Fluor 596-conjugated anti-goat, and Alexa Fluor 647-conjugated anti-rabbit IgG antibodies (1:200; Invitrogen).
For improved structural preservation, 50-µm-thick plastic film was taped to the glass surface on either side of the sample to act as spacers, preventing overflattening of the whole-mount. To minimize differences in attenuation at different focal depths, tissue was embedded in 2,2′-thiodiethanol (71). To control for artifactual differences between synapses due to bleaching and attenuation of the optical signal resulting from order of acquisition and synapse position, respectively, we mounted the tissue between two coverslips. This allowed for imaging the same field of IHCs with either the apical surface or the basilar membrane surface oriented toward the objective of the Leica SP5 confocal microscope (Fig. S3). Data pooled from multiple volumes were acquired with identical settings. For display in Fig. 1C the projections were made from optical sections deconvolved with a model of the optical point spread function using the Richardson–Lucy algorithm in ImageJ software, with default settings and the pixel dimensions, emission wavelength, and numerical aperture of the experiments.
Extracellular Recordings from Auditory Nerve Fibers.
Single unit recordings from mouse SGNs were performed as described (4, 70). In brief, mice were anesthetized by i.p. injection of urethane (1.32 µg/g), xylazine (5 µg/g), and buprenorphine (0.1 µg/g), and parts of the occipital bone and cerebellum were removed to expose the anteroventral cochlear nucleus (AVCN). Sound-responsive single neurons were identified based on spontaneous and noise-induced action potential firing and a basic characterization was performed by measuring their spontaneous rate, tuning curve, and poststimulus time histograms. SGNs were discriminated from primary neurons of the AVCN by their discharge pattern, first spike latency, and stereotaxic position. Recordings and offline analysis using waveform-based spike detection were performed using custom-written MATLAB software (The MathWorks, Inc.) and TDT system III hardware (Tucker-Davis Technologies) and an ELC-03XS amplifier (NPI Electronics).
Data Analysis.
Live-imaging and IHC patch-clamp data were analyzed by custom programs in Igor Pro-6.2 (Wavemetrics). The change of Ca2+-indicator fluorescence, our proxy of AZ Ca2+ influx, was estimated as ΔF/F0, where F0 is the fluorescence intensity at −87 mV and ΔF is the difference when depolarized to −7 mV (steps) or variable potentials (voltage ramps). Ca2+-indicator intensity was calculated by the average of nine pixels centered on the pixel showing the greatest fluorescence increase. Maximal ΔF/F0 was the average of last 40 ms during step depolarizations and five points at the peak ΔF/F0 during the voltage ramp. To refine the noisy FV traces, we fit the raw traces to the equation . The fit was used to calculate the fractional activation curve, dividing it by the extrapolated maximal ΔF/ΔV estimated by linear fitting of the decay of fluorescence with voltage. Then, this trace was fitted by a Boltzman function to estimate the Vh and slope factor of the Ca2+-indicator fluorescence at a given AZ. Synaptic ribbon fluorescence was estimated as the ratio of TAMRA fluorescence to that of the nearby IHC cytoplasm typically eight or nine pixels away (Fribbon/Fnearby), measuring the pixel with strongest intensity. IHC cytoplasmic volumes were displayed with the plugin “3D viewer” in Fiji software.
To analyze the intensity and position of synapses in confocal images of fixed organ of Corti whole mounts, a customized algorithm was developed as a program in MATLAB software. The locations of synapses were defined as the centers of mass of fluorescent spots after thresholding by a subjective intensity criterion for each of the three channels. The average voxel intensity in the volume, excluding voxels that exceeded the threshold value, was subtracted as background. Gaussian functions were fitted in three dimensions to determine the center of mass of each cluster. Immunofluorescence intensities were measured on each channel as the sum of the voxel values within a defined region of interest (± 500, 500, and 835 nm or ± 10, 10, and 2 pixels in X, Y, and Z) with origin at the center of mass of each GluA2-positive cluster. After marking the center of each IHC nucleus, observing the relative orientation of the presynaptic ribbon and the postsynaptic receptor array allowed us to assign each synapse to an IHC. The Cartesian coordinates of synapses were transformed to cell-centric cylindrical coordinates to define the cellular axes and to adjust differences in cellular orientation relative to the XYZ axes of the microscope. Keeping one end of the line centered on the nucleus, the angle of the axis was adjusted once in the XY plane and once in the YZ plane to compensate for the pitch and yaw of each hair cell (Fig. S3). After adjustment, points along the central axis were defined as zero on the tonotopic and modiolar–pillar axes. Intensities of synaptic puncta as a function of position could be analyzed for multiple cells by overlaying their central axes with alignment to the center of each nucleus.
Jitter is presented as SD or SEM, as noted. Two-tailed t tests or, if data were not normally distributed and/or variance was unequal between samples, the Wilcoxon rank sum test were used for statistical comparisons between two samples. Box plots show 10, 25, 50, 75, and 90% percentiles; *P < 0.05, **P < 0.01, and ***P < 0.001.
Discussion
The ear encodes changes in sound pressure over six orders of magnitude using SGNs that change their firing rates over different fractions of the audible range, but the mechanisms underlying such dynamic range fractionation are unknown. Therefore, we used fluorescence imaging to characterize heterogeneity among AZs in cochlear IHCs as a candidate mechanism. Our study indicates that IHCs decompose information on sound intensity into different outputs by varying the Ca2+ influx among their AZs. Two key determinants of presynaptic Ca2+ influx, the voltage dependence and the number of Ca2+ channels, differed greatly among the AZs within IHCs and exhibited shallow opposing spatial gradients along the pillar–modiolar IHC axis. AZs of the pillar face, on average, were smaller but activated at more hyperpolarized potentials and, hence, are likely presynaptic to high-spontaneous-rate, low-threshold SGNs. The number of CaV1.3 Ca2+ channels and maximal synaptic Ca2+ influx, on average, were greater for modiolar AZs, which also were larger in size. We propose that these AZs, given their more depolarized operation range, are recruited by stronger sounds and likely drive low-spontaneous-rate, high-threshold SGNs. Disruption of Gipc3 reversed the normal modiolar–pillar gradient of maximal AZ Ca2+ influx, shifted Ca2+ channel activation to more hyperpolarized potentials, and increased the fraction of SGNs with high-spontaneous firing rate.
Dynamic Range Fractionation Through Heterogeneity of Synaptic Voltage Dependence.
Each presynaptic AZ in a given IHC is controlled by a common potential and provides the sole excitatory input to “its” postsynaptic SGN. How the operating range of Ca2+ influx at an AZ matches the IHC resting and receptor potential critically determines its transmitter release and hence the spontaneous and sound-evoked firing of the postsynaptic SGN. Because technically challenging in vivo tight-seal patch-clamp recordings from IHCs have not yet been achieved there is uncertainty about the resting (in quiescence) and the receptor (during sound stimulation) potential. Pioneering recordings with sharp electrodes from guinea pig IHCs indicated a resting potential of −40 mV and maximal receptor potentials between ∼10 and 30 mV (1), and a patch-clamp study trying to emulate physiological ionic conditions in the explanted gerbil organ of Corti estimated a resting potential of −55 mV (55). Regardless of the precise resting potential it is evident that Ca2+ influx is partially active at least at a subset of IHC AZs (Fig. 3) and the relatively depolarized IHC resting potential is expected to facilitate Ca2+ influx and transmitter release (56, 57). Moreover, the range covered by Ca2+ activation at the various AZs (V0.5 spanning from −38 mV to −18 mV) matches the reported range of IHC receptor potentials very well (Fig. 3). The SGNs with identical frequency tuning but different sound-response properties presumably receive input from the same IHC and collectively convey acoustic information across the entire audible range of sound pressures to the brain. Candidate mechanisms underlying the diversity of SGN response properties include presynaptic (7, 11, 12), postsynaptic (13), and efferent (17, 18) mechanisms. Here, we asked how IHCs might fractionate the auditory signal for different parallel outputs through heterogeneous Ca2+ influx among AZs. Fast 3D live imaging enabled us to analyze functional and morphological properties of most, if not all, AZs as a function of position within an individual IHC. In parallel, we performed semiquantitative confocal microscopy of immunolabeled IHC synapses. AZs differed considerably in size, number, and voltage dependence of Ca2+ channels whereby differences among AZs within individual IHCs explained most of the variance of the entire AZ population. The estimates for Ca2+-channel number were positively correlated with our proxy of AZ size in both live-imaging and immunohistochemistry experiments, even at the level of the single IHC.
Modiolar AZs were larger, had more Ca2+ channels, and tended to show stronger maximal Ca2+ influx. The hypothesis that these AZs drive SGNs with lower spontaneous firing rate and higher sound threshold, at first sight, seems counterintuitive because a greater number of Ca2+ channels is expected to elicit more spontaneous and evoked release. However, we found that modiolar AZs, on average, required more depolarization for their activation (Fig. 4), consistent with the idea that modiolar synapses drive high-threshold SGNs (2, 7, 8). Modiolar AZs that hold more Ca2+ channels may support higher maximal rates of transmitter release, which could explain the higher susceptibility of low-spontaneous-rate, high-threshold SGNs to excitotoxic insult during acoustic overexposure (58). The operation of pillar AZ at relatively hyperpolarized potentials may contribute to high-spontaneous firing rates and responses to soft sounds found for SGNs innervating the pillar side (2, 7). Based on the spatial distribution of the voltage dependence of presynaptic Ca2+ influx found here for mice, and the spatial distribution of postsynaptic spontaneous rates in cats, we hypothesize that the voltage dependence of presynaptic Ca2+ influx is a major determinant of spontaneous and sound-driven SGN firing. This hypothesis is supported by the more hyperpolarized V0.5 of AZ Ca2+ influx in IHCs (Fig. 7) and the increase in SGN spontaneous firing rates in Gipc3 mutant mice (Fig. 8), but not in in CaV1.3HA/HA mice, for which, too, we found more AZ Ca2+ influx but no change in voltage dependence. However, we note that different from classic experiments in mature cats (2, 7) the present data were obtained from mice and we cannot rule out some immaturity of the afferent synaptic connectivity because we recorded soon after the onset of hearing. Moreover, the variability of voltage dependence of presynaptic Ca2+ influx was high in both the modiolar and pillar halves, whereby the differences between V0.5 among modiolar or pillar synapses could exceed that between the average pillar and modiolar synapse. In addition, the spatial segregation of functionally distinct classes of type SGNs at the level of IHC innervation in mice might deviate from that described for cats. Future experiments simultaneously addressing presynaptic properties and postsynaptic firing will be required to further test our hypothesis.
Regulation of the Number and Voltage Dependence of Ca2+ Channels at IHC AZs.
Which mechanisms determine the number and voltage dependence of Ca2+ channels at an AZ? The number of Ca2+ channels at the presynaptic AZ is governed by the expression of the specific Ca2+-channel subunits and splice variants (33, 36, 59) as well as by that of scaffold proteins that tether Ca2+ channels to the AZ (15, 42, 43, 60, 61) and/or regulate their turnover (44) by direct or indirect interaction with the channels. Moreover, subunit composition as well as splice variants and interacting proteins also modulate functional properties of the specific Ca2+ channel (62). The Ca2+-channel complex at IHC AZs is likely composed of splice variants of the pore-forming subunit CaV1.3α containing exons 43S or 43L (36), of the CaVβ2 (33), and less likely of other CaVβ subunits (32), and of a yet-to-be-identified CaVα2δ subunit. CaVβ2, the synaptic ribbon, and the presynaptic scaffolds bassoon and RIM2α and β were previously shown to promote the abundance of CaV1.3 at IHC AZs (15, 33, 43), whereas harmonin seems to reduce the number of synaptic CaV1.3 (44). Work in zebrafish hair cells has revealed an intriguing molecular interplay between RIBEYE and CaV1.3 channels, whereby RIBEYE overexpression promotes the formation of CaV1.3-positive AZ-like specializations and synaptic Ca2+ influx negatively regulates RIBEYE abundance at the AZ (63, 64). The present study corroborates the notion that the Ca2+-channel number is proportional to ribbon size in cochlear hair cells (11, 30). We speculate that release rate for a given open probability scales linearly with the number of Ca2+ channels, assuming nanodomain coupling (29, 65, 66), regardless of the AZ size. Future simultaneous measurements of AZ Ca2+ influx and exocytosis or SGN firing will be required to analyze the consequences of presynaptic heterogeneity for transmitter release at IHC AZs.
How do IHCs form opposing gradients of AZ size, CaV1.3 abundance, and voltage dependence of activation? The modiolar–pillar gradient of AZ size was lost upon lesion of the lateral olivocochlear efferents (18), and it is tempting to speculate that they provide an instructive influence on the postsynaptic SGN terminal and/or the IHC AZ. Here, we found that the intracellular gradient of maximal Ca2+ influx was altered in Gipc3 mutant mice. In addition, Gipc3 disruption increased Ca2+ influx and caused a hyperpolarizing shift in its activation. These presynaptic changes likely underlie the enhanced spontaneous and sound-onset firing in Gipc3 mutant mice, although alternative explanations exist. How the Gipc3 protein might be involved directly or indirectly for establishing a modiolar–pillar gradient remains to be elucidated. Considering analogy to Gipc1 (50, 52), it is tempting to speculate that Gipc3 serves to adapt components of the Ca2+-channel complex to motor proteins and thereby assists their trafficking to AZs with a preference for the modiolar face. Signals instructing polarized trafficking might originate from lateral olivocochlear fibers, SGNs themselves, and/or the planar cell polarity that sets the orientation of the apical hair bundle (67, 68) and involves Gipc1 signaling (50). Future work should address the mechanism by which Gipc3 operates to traffic and/or regulate Ca2+ channels.
Methods
Research followed national animal care guidelines and was approved by the University of Göttingen board for animal welfare and the animal welfare office of the state of Lower Saxony. For details of patch-clamp and confocal Ca2+ imaging, immunohistochemistry and confocal imaging, extracellular recordings from auditory nerve fibers, and data analysis see SI Methods.
Acknowledgments
We thank S. Gerke, C. Senger-Freitag, and N. Herrmann for expert technical assistance and Dr. Konrad Noben-Trauth for providing us with Black Swiss mice (Gipc3 mutant). This work was supported by a scholarship from the German Academic Exchange Service (T.-L.O.), by a fellowship from the Alexander von Humboldt Foundation (M.A.R.), funding from MED-EL, an international project grant from Action on Hearing Loss, and the Department of Otolaryngology at Washington University in St. Louis. This work was also supported by the German Federal Ministry of Education and Research through Bernstein Focus for Neurotechnology Grant 01GQ0810 (to T.M.) and the German Research Foundation through the Collaborative Research Center 889 [Projects A2 (to T.M.) and A6 (to N.S.)], Center for Nanoscale Microscopy and Molecular Physiology of the Brain Grants ECX 101 and FZT 103 (to T.M.), the Leibniz Program (T.M.), and Austrian Science Fund Grant FWF F44020 (to Jörg Striessnig).
Footnotes
The authors declare no conflict of interest.
This article is a PNAS Direct Submission.
This article contains supporting information online at www.pnas.org/lookup/suppl/doi:10.1073/pnas.1605737113/-/DCSupplemental.
References
- 1.Russell IJ, Sellick PM. Low-frequency characteristics of intracellularly recorded receptor potentials in guinea-pig cochlear hair cells. J Physiol. 1983;338(1):179–206. doi: 10.1113/jphysiol.1983.sp014668. [DOI] [PMC free article] [PubMed] [Google Scholar]
- 2.Liberman MC. Auditory-nerve response from cats raised in a low-noise chamber. J Acoust Soc Am. 1978;63(2):442–455. doi: 10.1121/1.381736. [DOI] [PubMed] [Google Scholar]
- 3.Sachs MB, Abbas PJ. Rate versus level functions for auditory-nerve fibers in cats: Tone-burst stimuli. J Acoust Soc Am. 1974;56(6):1835–1847. doi: 10.1121/1.1903521. [DOI] [PubMed] [Google Scholar]
- 4.Taberner AM, Liberman MC. Response properties of single auditory nerve fibers in the mouse. J Neurophysiol. 2005;93(1):557–569. doi: 10.1152/jn.00574.2004. [DOI] [PubMed] [Google Scholar]
- 5.Winter IM, Robertson D, Yates GK. Diversity of characteristic frequency rate-intensity functions in guinea pig auditory nerve fibres. Hear Res. 1990;45(3):191–202. doi: 10.1016/0378-5955(90)90120-e. [DOI] [PubMed] [Google Scholar]
- 6.Zagaeski M, Cody AR, Russell IJ, Mountain DC. Transfer characteristic of the inner hair cell synapse: steady-state analysis. J Acoust Soc Am. 1994;95(6):3430–3434. doi: 10.1121/1.409963. [DOI] [PubMed] [Google Scholar]
- 7.Merchan-Perez A, Liberman MC. Ultrastructural differences among afferent synapses on cochlear hair cells: Correlations with spontaneous discharge rate. J Comp Neurol. 1996;371(2):208–221. doi: 10.1002/(SICI)1096-9861(19960722)371:2<208::AID-CNE2>3.0.CO;2-6. [DOI] [PubMed] [Google Scholar]
- 8.Liberman MC. Single-neuron labeling in the cat auditory nerve. Science. 1982;216(4551):1239–1241. doi: 10.1126/science.7079757. [DOI] [PubMed] [Google Scholar]
- 9.Kiang NY, Pfeiffer RR, Warr WB, Backus AS. Stimulus coding in the cochlear nucleus. Trans Am Otol Soc. 1965;53:35–58. [PubMed] [Google Scholar]
- 10.Wen B, Wang GI, Dean I, Delgutte B. Dynamic range adaptation to sound level statistics in the auditory nerve. J Neurosci. 2009;29(44):13797–13808. doi: 10.1523/JNEUROSCI.5610-08.2009. [DOI] [PMC free article] [PubMed] [Google Scholar]
- 11.Frank T, Khimich D, Neef A, Moser T. Mechanisms contributing to synaptic Ca2+ signals and their heterogeneity in hair cells. Proc Natl Acad Sci USA. 2009;106(11):4483–4488. doi: 10.1073/pnas.0813213106. [DOI] [PMC free article] [PubMed] [Google Scholar]
- 12.Grant L, Yi E, Glowatzki E. Two modes of release shape the postsynaptic response at the inner hair cell ribbon synapse. J Neurosci. 2010;30(12):4210–4220. doi: 10.1523/JNEUROSCI.4439-09.2010. [DOI] [PMC free article] [PubMed] [Google Scholar]
- 13.Liberman LD, Wang H, Liberman MC. Opposing gradients of ribbon size and AMPA receptor expression underlie sensitivity differences among cochlear-nerve/hair-cell synapses. J Neurosci. 2011;31(3):801–808. doi: 10.1523/JNEUROSCI.3389-10.2011. [DOI] [PMC free article] [PubMed] [Google Scholar]
- 14.Kantardzhieva A, Liberman MC, Sewell WF. Quantitative analysis of ribbons, vesicles, and cisterns at the cat inner hair cell synapse: Correlations with spontaneous rate. J Comp Neurol. 2013;521(14):3260–3271. doi: 10.1002/cne.23345. [DOI] [PMC free article] [PubMed] [Google Scholar]
- 15.Frank T, et al. Bassoon and the synaptic ribbon organize Ca2+ channels and vesicles to add release sites and promote refilling. Neuron. 2010;68(4):724–738. doi: 10.1016/j.neuron.2010.10.027. [DOI] [PMC free article] [PubMed] [Google Scholar]
- 16.Meyer AC, et al. Tuning of synapse number, structure and function in the cochlea. Nat Neurosci. 2009;12(4):444–453. doi: 10.1038/nn.2293. [DOI] [PubMed] [Google Scholar]
- 17.Ruel J, et al. Dopamine inhibition of auditory nerve activity in the adult mammalian cochlea. Eur J Neurosci. 2001;14(6):977–986. doi: 10.1046/j.0953-816x.2001.01721.x. [DOI] [PubMed] [Google Scholar]
- 18.Yin Y, Liberman LD, Maison SF, Liberman MC. Olivocochlear innervation maintains the normal modiolar-pillar and habenular-cuticular gradients in cochlear synaptic morphology. J Assoc Res Otolaryngol. 2014;15(4):571–583. doi: 10.1007/s10162-014-0462-z. [DOI] [PMC free article] [PubMed] [Google Scholar]
- 19.Wong AB, et al. Concurrent maturation of inner hair cell synaptic Ca2+ influx and auditory nerve spontaneous activity around hearing onset in mice. J Neurosci. 2013;33(26):10661–10666. doi: 10.1523/JNEUROSCI.1215-13.2013. [DOI] [PMC free article] [PubMed] [Google Scholar]
- 20.Ariel P, Hoppa MB, Ryan TA. Intrinsic variability in Pv, RRP size, Ca2+ channel repertoire, and presynaptic potentiation in individual synaptic boutons. Front Synaptic Neurosci. 2013;4:9. doi: 10.3389/fnsyn.2012.00009. [DOI] [PMC free article] [PubMed] [Google Scholar]
- 21.Holderith N, et al. Release probability of hippocampal glutamatergic terminals scales with the size of the active zone. Nat Neurosci. 2012;15(7):988–997. doi: 10.1038/nn.3137. [DOI] [PMC free article] [PubMed] [Google Scholar]
- 22.Sheng J, et al. Calcium-channel number critically influences synaptic strength and plasticity at the active zone. Nat Neurosci. 2012;15(7):998–1006. doi: 10.1038/nn.3129. [DOI] [PMC free article] [PubMed] [Google Scholar]
- 23.Roberts WM, Jacobs RA, Hudspeth AJ. Colocalization of ion channels involved in frequency selectivity and synaptic transmission at presynaptic active zones of hair cells. J Neurosci. 1990;10(11):3664–3684. doi: 10.1523/JNEUROSCI.10-11-03664.1990. [DOI] [PMC free article] [PubMed] [Google Scholar]
- 24.Issa NP, Hudspeth AJ. The entry and clearance of Ca2+ at individual presynaptic active zones of hair cells from the bullfrog’s sacculus. Proc Natl Acad Sci USA. 1996;93(18):9527–9532. doi: 10.1073/pnas.93.18.9527. [DOI] [PMC free article] [PubMed] [Google Scholar]
- 25.Tucker T, Fettiplace R. Confocal imaging of calcium microdomains and calcium extrusion in turtle hair cells. Neuron. 1995;15(6):1323–1335. doi: 10.1016/0896-6273(95)90011-x. [DOI] [PubMed] [Google Scholar]
- 26.Zenisek D, Horst NK, Merrifield C, Sterling P, Matthews G. Visualizing synaptic ribbons in the living cell. J Neurosci. 2004;24(44):9752–9759. doi: 10.1523/JNEUROSCI.2886-04.2004. [DOI] [PMC free article] [PubMed] [Google Scholar]
- 27.Brandt A, Striessnig J, Moser T. CaV1.3 channels are essential for development and presynaptic activity of cochlear inner hair cells. J Neurosci. 2003;23(34):10832–10840. doi: 10.1523/JNEUROSCI.23-34-10832.2003. [DOI] [PMC free article] [PubMed] [Google Scholar]
- 28.Platzer J, et al. Congenital deafness and sinoatrial node dysfunction in mice lacking class D L-type Ca2+ channels. Cell. 2000;102(1):89–97. doi: 10.1016/s0092-8674(00)00013-1. [DOI] [PubMed] [Google Scholar]
- 29.Wong AB, et al. Developmental refinement of hair cell synapses tightens the coupling of Ca2+ influx to exocytosis. EMBO J. 2014;33(3):247–264. doi: 10.1002/embj.201387110. [DOI] [PMC free article] [PubMed] [Google Scholar]
- 30.Martinez-Dunst C, Michaels RL, Fuchs PA. Release sites and calcium channels in hair cells of the chick’s cochlea. J Neurosci. 1997;17(23):9133–9144. doi: 10.1523/JNEUROSCI.17-23-09133.1997. [DOI] [PMC free article] [PubMed] [Google Scholar]
- 31.Moreno CM, et al. Ca2+ entry into neurons is facilitated by cooperative gating of clustered CaV1.3 channels. eLife. 2016;5:e15744. doi: 10.7554/eLife.15744. [DOI] [PMC free article] [PubMed] [Google Scholar]
- 32.Kuhn S, et al. Ba2+ currents in inner and outer hair cells of mice lacking the voltage-dependent Ca2+ channel subunits beta3 or beta4. Channels (Austin) 2009;3(5):366–376. doi: 10.4161/chan.3.5.9774. [DOI] [PubMed] [Google Scholar]
- 33.Neef J, et al. The Ca2+ channel subunit beta2 regulates Ca2+ channel abundance and function in inner hair cells and is required for hearing. J Neurosci. 2009;29(34):10730–10740. doi: 10.1523/JNEUROSCI.1577-09.2009. [DOI] [PMC free article] [PubMed] [Google Scholar]
- 34.Bock G, et al. Functional properties of a newly identified C-terminal splice variant of Cav1.3 L-type Ca2+ channels. J Biol Chem. 2011;286(49):42736–42748. doi: 10.1074/jbc.M111.269951. [DOI] [PMC free article] [PubMed] [Google Scholar]
- 35.Tan BZ, et al. Functional characterization of alternative splicing in the C terminus of L-type CaV1.3 channels. J Biol Chem. 2011;286(49):42725–42735. doi: 10.1074/jbc.M111.265207. [DOI] [PMC free article] [PubMed] [Google Scholar]
- 36.Scharinger A, et al. Cell-type-specific tuning of Cav1.3 Ca2+-channels by a C-terminal automodulatory domain. Front Cell Neurosci. 2015;9:309. doi: 10.3389/fncel.2015.00309. [DOI] [PMC free article] [PubMed] [Google Scholar]
- 37.Cui G, et al. Ca2+-binding proteins tune Ca2+-feedback to Cav1.3 channels in mouse auditory hair cells. J Physiol. 2007;585(Pt 3):791–803. doi: 10.1113/jphysiol.2007.142307. [DOI] [PMC free article] [PubMed] [Google Scholar]
- 38.Schrauwen I, et al. A mutation in CABP2, expressed in cochlear hair cells, causes autosomal-recessive hearing impairment. Am J Hum Genet. 2012;91(4):636–645. doi: 10.1016/j.ajhg.2012.08.018. [DOI] [PMC free article] [PubMed] [Google Scholar]
- 39.Yang PS, et al. Switching of Ca2+-dependent inactivation of Ca(v)1.3 channels by calcium binding proteins of auditory hair cells. J Neurosci. 2006;26(42):10677–10689. doi: 10.1523/JNEUROSCI.3236-06.2006. [DOI] [PMC free article] [PubMed] [Google Scholar]
- 40.Davydova D, et al. Bassoon specifically controls presynaptic P/Q-type Ca2+ channels via RIM-binding protein. Neuron. 2014;82(1):181–194. doi: 10.1016/j.neuron.2014.02.012. [DOI] [PubMed] [Google Scholar]
- 41.Gebhart M, et al. Modulation of Cav1.3 Ca2+ channel gating by Rab3 interacting molecule. Mol Cell Neurosci. 2010;44(3):246–259. doi: 10.1016/j.mcn.2010.03.011. [DOI] [PubMed] [Google Scholar]
- 42.Kaeser PS, et al. RIM proteins tether Ca2+ channels to presynaptic active zones via a direct PDZ-domain interaction. Cell. 2011;144(2):282–295. doi: 10.1016/j.cell.2010.12.029. [DOI] [PMC free article] [PubMed] [Google Scholar]
- 43.Jung S, et al. Rab3-interacting molecules 2α and 2β promote the abundance of voltage-gated CaV1.3 Ca2+ channels at hair cell active zones. Proc Natl Acad Sci USA. 2015;112(24):E3141–E3149. doi: 10.1073/pnas.1417207112. [DOI] [PMC free article] [PubMed] [Google Scholar]
- 44.Gregory FD, et al. Harmonin inhibits presynaptic Cav1.3 Ca²⁺ channels in mouse inner hair cells. Nat Neurosci. 2011;14(9):1109–1111. doi: 10.1038/nn.2895. [DOI] [PMC free article] [PubMed] [Google Scholar]
- 45.Gregory FD, Pangrsic T, Calin-Jageman IE, Moser T, Lee A. Harmonin enhances voltage-dependent facilitation of Cav1.3 channels and synchronous exocytosis in mouse inner hair cells. J Physiol. 2013;591(13):3253–3269. doi: 10.1113/jphysiol.2013.254367. [DOI] [PMC free article] [PubMed] [Google Scholar]
- 46.Johnson KR, et al. Mouse models of USH1C and DFNB18: Phenotypic and molecular analyses of two new spontaneous mutations of the Ush1c gene. Hum Mol Genet. 2003;12(23):3075–3086. doi: 10.1093/hmg/ddg332. [DOI] [PMC free article] [PubMed] [Google Scholar]
- 47.Grillet N, et al. Harmonin mutations cause mechanotransduction defects in cochlear hair cells. Neuron. 2009;62(3):375–387. doi: 10.1016/j.neuron.2009.04.006. [DOI] [PMC free article] [PubMed] [Google Scholar]
- 48.Charizopoulou N, et al. Gipc3 mutations associated with audiogenic seizures and sensorineural hearing loss in mouse and human. Nat Commun. 2011;2:201. doi: 10.1038/ncomms1200. [DOI] [PMC free article] [PubMed] [Google Scholar]
- 49.Rehman AU, et al. Mutations of GIPC3 cause nonsyndromic hearing loss DFNB72 but not DFNB81 that also maps to chromosome 19p. Hum Genet. 2011;130(6):759–765. doi: 10.1007/s00439-011-1018-5. [DOI] [PMC free article] [PubMed] [Google Scholar]
- 50.Giese AP, et al. Gipc1 has a dual role in Vangl2 trafficking and hair bundle integrity in the inner ear. Development. 2012;139(20):3775–3785. doi: 10.1242/dev.074229. [DOI] [PMC free article] [PubMed] [Google Scholar]
- 51.Naccache SN, Hasson T, Horowitz A. Binding of internalized receptors to the PDZ domain of GIPC/synectin recruits myosin VI to endocytic vesicles. Proc Natl Acad Sci USA. 2006;103(34):12735–12740. doi: 10.1073/pnas.0605317103. [DOI] [PMC free article] [PubMed] [Google Scholar]
- 52.Yano H, et al. BDNF-mediated neurotransmission relies upon a myosin VI motor complex. Nat Neurosci. 2006;9(8):1009–1018. doi: 10.1038/nn1730. [DOI] [PubMed] [Google Scholar]
- 53.Robertson D, Paki B. Role of L-type Ca2+ channels in transmitter release from mammalian inner hair cells. II. Single-neuron activity. J Neurophysiol. 2002;87(6):2734–2740. doi: 10.1152/jn.2002.87.6.2734. [DOI] [PubMed] [Google Scholar]
- 54.Kros CJ, Ruppersberg JP, Rüsch A. Expression of a potassium current in inner hair cells during development of hearing in mice. Nature. 1998;394(6690):281–284. doi: 10.1038/28401. [DOI] [PubMed] [Google Scholar]
- 55.Johnson SL, Beurg M, Marcotti W, Fettiplace R. Prestin-driven cochlear amplification is not limited by the outer hair cell membrane time constant. Neuron. 2011;70(6):1143–1154. doi: 10.1016/j.neuron.2011.04.024. [DOI] [PMC free article] [PubMed] [Google Scholar]
- 56.Goutman JD, Glowatzki E. Short-term facilitation modulates size and timing of the synaptic response at the inner hair cell ribbon synapse. J Neurosci. 2011;31(22):7974–7981. doi: 10.1523/JNEUROSCI.0604-11.2011. [DOI] [PMC free article] [PubMed] [Google Scholar]
- 57.Cho S, Li G-L, von Gersdorff H. Recovery from short-term depression and facilitation is ultrafast and Ca2+ dependent at auditory hair cell synapses. J Neurosci. 2011;31(15):5682–5692. doi: 10.1523/JNEUROSCI.5453-10.2011. [DOI] [PMC free article] [PubMed] [Google Scholar]
- 58.Furman AC, Kujawa SG, Liberman MC. Noise-induced cochlear neuropathy is selective for fibers with low spontaneous rates. J Neurophysiol. 2013;110(3):577–586. doi: 10.1152/jn.00164.2013. [DOI] [PMC free article] [PubMed] [Google Scholar]
- 59.Hoppa MB, Lana B, Margas W, Dolphin AC, Ryan TA. α2δ expression sets presynaptic calcium channel abundance and release probability. Nature. 2012;486(7401):122–125. doi: 10.1038/nature11033. [DOI] [PMC free article] [PubMed] [Google Scholar]
- 60.Han Y, Kaeser PS, Südhof TC, Schneggenburger R. RIM determines Ca2+ channel density and vesicle docking at the presynaptic active zone. Neuron. 2011;69(2):304–316. doi: 10.1016/j.neuron.2010.12.014. [DOI] [PMC free article] [PubMed] [Google Scholar]
- 61.Kiyonaka S, et al. RIM1 confers sustained activity and neurotransmitter vesicle anchoring to presynaptic Ca2+ channels. Nat Neurosci. 2007;10(6):691–701. doi: 10.1038/nn1904. [DOI] [PMC free article] [PubMed] [Google Scholar]
- 62.Zamponi GW, Striessnig J, Koschak A, Dolphin AC. The physiology, pathology, and pharmacology of voltage-gated calcium channels and their future therapeutic potential. Pharmacol Rev. 2015;67(4):821–870. doi: 10.1124/pr.114.009654. [DOI] [PMC free article] [PubMed] [Google Scholar]
- 63.Sheets L, Trapani JG, Mo W, Obholzer N, Nicolson T. Ribeye is required for presynaptic Ca(V)1.3a channel localization and afferent innervation of sensory hair cells. Development. 2011;138(7):1309–1319. doi: 10.1242/dev.059451. [DOI] [PMC free article] [PubMed] [Google Scholar]
- 64.Sheets L, Kindt KS, Nicolson T. Presynaptic CaV1.3 channels regulate synaptic ribbon size and are required for synaptic maintenance in sensory hair cells. J Neurosci. 2012;32(48):17273–17286. doi: 10.1523/JNEUROSCI.3005-12.2012. [DOI] [PMC free article] [PubMed] [Google Scholar]
- 65.Brandt A, Khimich D, Moser T. Few CaV1.3 channels regulate the exocytosis of a synaptic vesicle at the hair cell ribbon synapse. J Neurosci. 2005;25(50):11577–11585. doi: 10.1523/JNEUROSCI.3411-05.2005. [DOI] [PMC free article] [PubMed] [Google Scholar]
- 66.Pangršič T, et al. EF-hand protein Ca2+ buffers regulate Ca2+ influx and exocytosis in sensory hair cells. Proc Natl Acad Sci USA. 2015;112(9):E1028–E1037. doi: 10.1073/pnas.1416424112. [DOI] [PMC free article] [PubMed] [Google Scholar]
- 67.Ezan J, Montcouquiol M. Revisiting planar cell polarity in the inner ear. Semin Cell Dev Biol. 2013;24(5):499–506. doi: 10.1016/j.semcdb.2013.03.012. [DOI] [PubMed] [Google Scholar]
- 68.Sienknecht UJ, Köppl C, Fritzsch B. Evolution and development of hair cell polarity and efferent function in the inner ear. Brain Behav Evol. 2014;83(2):150–161. doi: 10.1159/000357752. [DOI] [PubMed] [Google Scholar]
- 69.Moser T, Beutner D. Kinetics of exocytosis and endocytosis at the cochlear inner hair cell afferent synapse of the mouse. Proc Natl Acad Sci USA. 2000;97(2):883–888. doi: 10.1073/pnas.97.2.883. [DOI] [PMC free article] [PubMed] [Google Scholar]
- 70.Jing Z, et al. Disruption of the presynaptic cytomatrix protein bassoon degrades ribbon anchorage, multiquantal release, and sound encoding at the hair cell afferent synapse. J Neurosci. 2013;33(10):4456–4467. doi: 10.1523/JNEUROSCI.3491-12.2013. [DOI] [PMC free article] [PubMed] [Google Scholar]
- 71.Staudt T, Lang MC, Medda R, Engelhardt J, Hell SW. 2,2′-thiodiethanol: A new water soluble mounting medium for high resolution optical microscopy. Microsc Res Tech. 2007;70(1):1–9. doi: 10.1002/jemt.20396. [DOI] [PubMed] [Google Scholar]


