Abstract
The proteasome is essential for the selective degradation of most cellular proteins but how cells maintain adequate amounts of proteasome is unclear. Here we found an evolutionarily conserved signalling pathway controlling proteasome homeostasis. Central to this pathway is TORC1 whose inhibition induced all known yeast 19S regulatory particle assembly-chaperones (RACs) as well as proteasome subunits. Downstream of TORC1 inhibition, the yeast mitogen-activated protein kinase, Mpk1, ensured that the supply of RACs and proteasome subunits increased under challenging conditions to maintain proteasomal degradation and cell viability. This adaptive pathway was evolutionarily conserved, with mTOR and Erk5 controlling the levels of the four mammalian RACs and proteasome abundance. Thus, the central growth and stress controllers, TORC1 and Mpk1/Erk5, endow cells with a rapid and vital adaptive response to adjust proteasome abundance to the rising needs. Enhancing this pathway may be a useful therapeutic approach for diseases resulting from impaired proteasomal degradation.
Cell survival depends on adaptive signalling pathways to ensure that the supply of vital components matches the fluctuating needs. The proteasome is essential for the selective degradation of most cellular proteins and thereby controls virtually all cellular processes1–3. Proteasome abundance is crucial for cell fitness but how cells maintain adequate amounts of proteasome is unclear. Failure to degrade mutant or misfolded proteins causes diverse diseases, including the devastating neurodegenerative diseases which might be prevented by increasing proteasome degradation3. Whilst the idea is attractive, increasing proteasome capacity remains a challenge and overcoming this challenge requires an understanding of the mechanisms regulating proteasome abundance.
The proteasome is composed of 33 subunits assembled in two sub-complexes, the 20S core particle (CP), flanked at one or both ends by the 19S regulatory particle (RP) to form the 26S proteasome2. Proteasome assembly requires the assistance of proteasome assembly chaperones4. Four evolutionarily conserved 19S regulatory particle assembly-chaperones (RAC) Nas2, Nas6, Hsm3 and Rpn14 in yeast and p27, p28, S5b and Rpn14/PAAF1 in mammals are needed for RP assembly5–9. In addition, yeast cells have Adc17, a stress-inducible RAC, which is vital for cells to survive proteasome challenges10. This suggests that cells have evolved adaptive signalling pathways to adjust proteasome assembly to arising needs but how this is achieved is unknown.
TORC1 inhibition increases Adc17 and proteasome
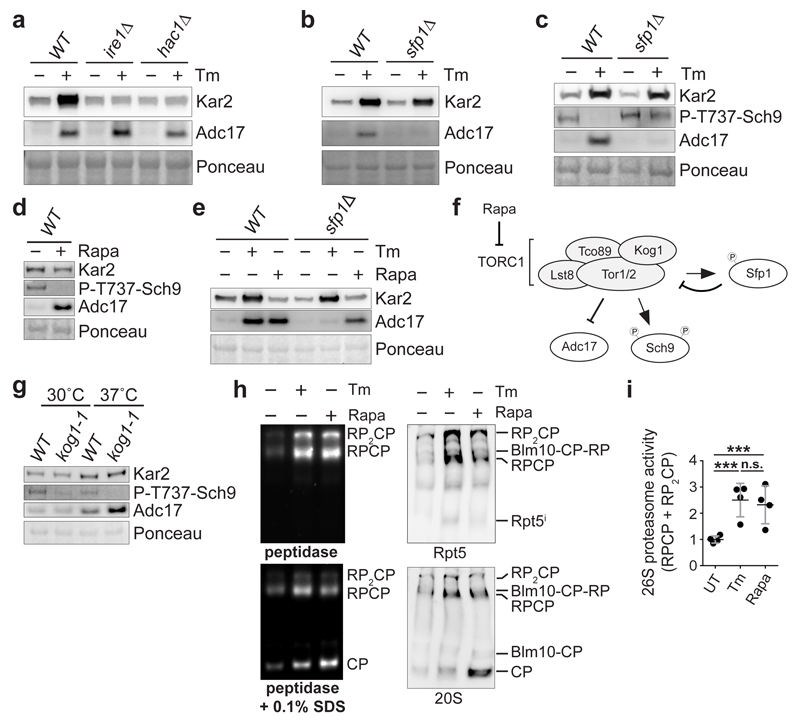
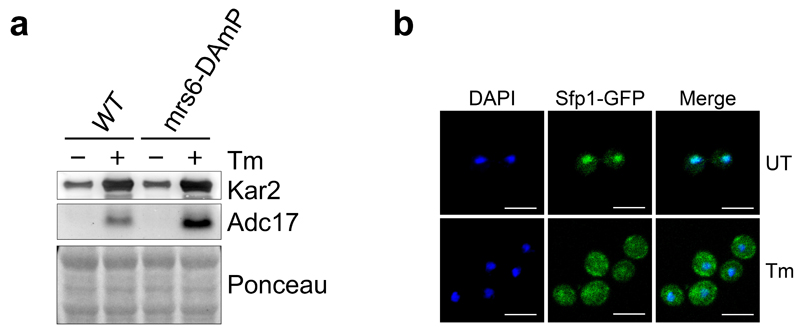
To unveil how yeast cells maintain proteasome homeostasis, we searched for the pathway regulating Adc17. Adc17 is a component of an unknown generic stress response, upregulated by diverse stresses that impose a high burden on the proteasome. Because Adc17 is induced by tunicamycin, an inducer of the unfolded protein response (UPR)11, we next deleted the UPR genes IRE1 or HAC111. This prevented tunicamycin induction of the UPR marker Kar2, as expected11, but not that of Adc17 (Fig. 1a) establishing that ADC17 was not a UPR target gene. We next tested Adc17 induction by tunicamycin in mutants suspected to regulate Adc17 from a genome-wide regulation study12 and found that deletion of SFP1 abolished Adc17 but not Kar2 induction by tunicamycin (Fig. 1b). Consistently, Adc17 induction by tunicamycin was higher in a strain carrying a hypomorphic allele of MRS6, a negative regulator of Sfp1 (Extended Data Fig. 1a). Sfp1 is a stress- and nutrient-sensitive regulator of cell growth with dual function13–15. Under optimal growth condition, Sfp1 is in the nucleus to activate transcription of ribosomal protein genes but re-localises to the cytosol upon stress13,14. Sfp1 is activated by TORC1 and in turn negatively regulates TORC1 signalling, as a feedback mechanism15. In absence of Spf1, TORC1 is hyperactive15. Thus, SFP1 deletion could prevent Adc17 induction directly or by over-activating TORC1. Adc17 induction by tunicamycin (Fig. 1a, b) coincided with Sfp1 re-localisation from the nucleus to the cytosol (Extended Data Fig. 1b), suggesting that Sfp1 may not directly regulate Adc17 but indirectly through TORC1. Tunicamycin inhibits TORC1 signalling15, as seen here (Fig. 1c) with the phosphorylation of the TORC1 effector Sch916. In the absence of Sfp1, TORC1 was hyperactive15 (Fig. 1c) and it remained active during tunicamycin stress, while Adc17 induction was abolished (Fig. 1c) suggesting that Sfp1 regulated Adc17 via TORC1. Confirming this suspicion, rapamycin, a selective inhibitor of TORC117, induced Adc17 (Fig. 1d). Deletion of SFP1 abolished induction of Adc17 by tunicamycin but not by rapamycin (Fig. 1e) because SFP1 deletion controlled Adc17 expression by hyperactivating TORC1 (Fig. 1f). To confirm this finding with a genetic approach, we examined Adc17 regulation in the thermosensitive kog1-1 mutant. Kog1 (Fig. 1f) is the yeast homolog of Raptor, a specific subunit of TORC118. Inactivation of KOG1 inhibited TORC1, as expected18, and induced Adc17 (Fig. 1g) establishing that selective TORC1 inhibition induces Adc17. We next inquired whether rapamycin increased proteasome abundance. Similarly to what we found for tunicamycin10, proteasome levels increased by more than two fold after 3 hours of rapamycin (Fig. 1h, i). Thus, inhibition of the central stress and growth controller, TORC1, induces Adc17 and increases proteasome abundance in yeast.
Figure 1. TORC1 inhibition induces the proteasome assembly chaperone Adc17 and increases proteasome levels.
a-c, Immunoblots of lysates from cells treated ± 5 µg/ml tunicamycin (Tm) for 4 hours. d, Immunoblots of lysates from cells treated ± 0.2 µg/ml rapamycin (Rapa) for 4 hours. e, Immunoblots of cell lysates after treatment ± 5 µg/ml Tm or 0.2 µg/ml Rapa for 4 hours. f, Cartoon depicting the relationship between Sfp1, TORC1 and Adc17. g, Immunoblots from cells cultured at 30 or 37°C for 4 hours. h, Native-PAGE (4.2%) of yeast extracts from cells treated with 5 µg/ml Tm or 0.2 µg/ml Rapa, revealed with the fluorogenic substrate Suc-LLVY-AMC and by immunoblots. i, Quantification of the 26S proteasome activity (RP-CP and RP2-CP) in four independent experiments such as the one shown in (h). Data are means ± SD; n = 4 biological replicates. ***P≤0.001; n.s., not significant (one-way ANOVA).
The MAPK Mpk1 induces Adc17
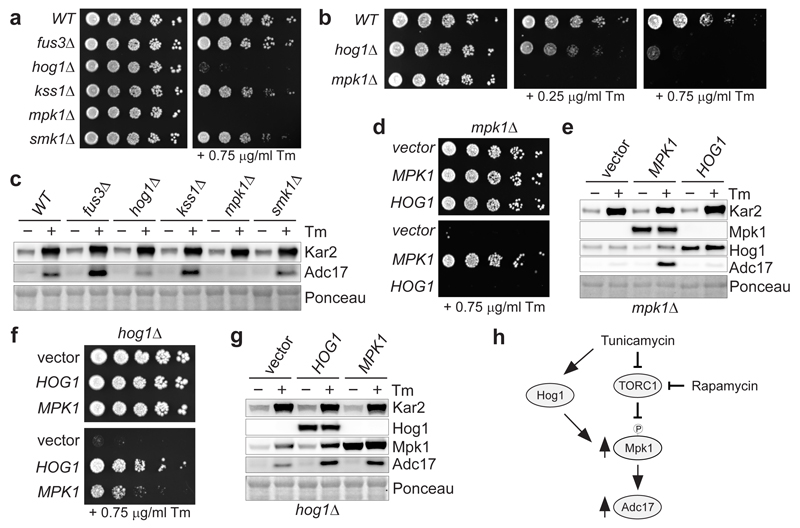
TORC1 integrates multiple signalling pathways17,19. We next searched for the pathway downstream of TORC1 controlling Adc17 and proteasome abundance. Adc17 is not a UPR gene (Fig. 1a) but adc17Δ cells are sensitive to tunicamycin stress10. Thus, we next examined non-UPR mutants sensitive to tunicamycin. The mitogen-activated protein kinase (MAPK) Hog1 and Mpk1 were important for tunicamycin-stress survival in yeast (Fig. 2a), as expected20, unlike the other MAPK Fus3, Kss1 and Smk1 (Fig. 2a); Hog1 being advantageous and Mpk1 essential (Fig. 2b). Adc17 induction by tunicamycin was compromised in HOG1 deleted cells and abolished in cells lacking a functional allele of MPK1 (Fig. 2c and Extended Data Fig. 2a, b) revealing a perfect correlation between tunicamycin stress-resistance and Adc17 induction. Genetic interactions studies showed that overexpression of HOG1 failed to restore tunicamycin resistance and Adc17 induction in mpk1Δ cells (Fig. 2d, e) while overexpression of MPK1 increased both tunicamycin resistance and Adc17 induction in hog1Δ cells (Fig. 2f, g). Thus, signalling through Mpk1 is required for Adc17 induction and tunicamycin survival.
Figure 2. The MAPK Mpk1 is a master regulator of the stress-inducible proteasome assembly chaperone Adc17.
a and b, Cells spotted in a 6-fold dilution and grown for 3 days on plates ± tunicamycin (Tm). c, Immunoblots from cells grown ± 5 µg/ml Tm for 4 hours. d and f, Cells transformed with empty vector or with MPK1 or HOG1 spotted in a 6-fold dilution and grown on plates ± 0.75 µg/ml Tm for 3 days. e and g, Immunoblots of lysates from cells grown ± 5 µg/ml Tm for 4 hours. h, Cartoon depicting the signalling pathway to Adc17.
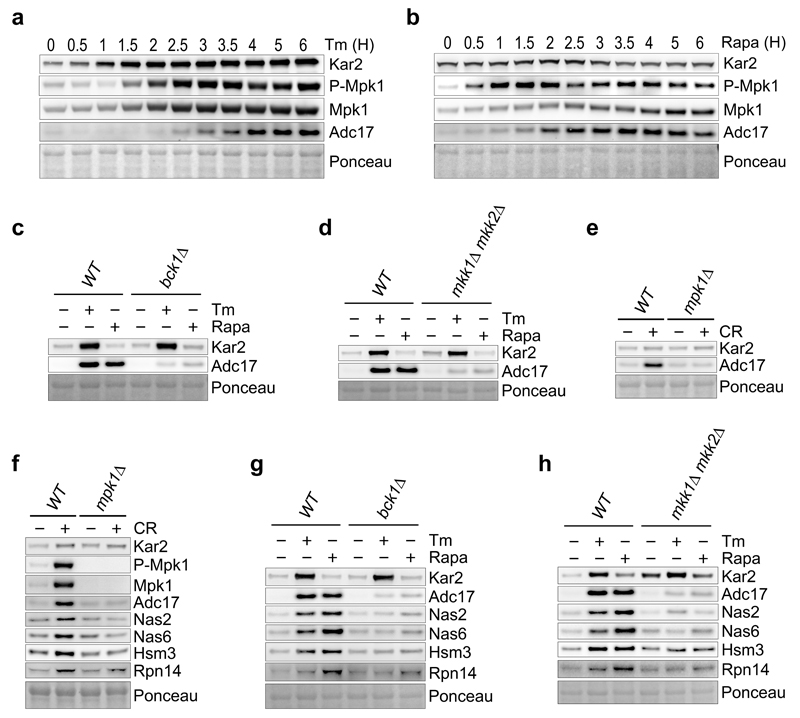
We next examined if Mpk1 was required for Adc17 induction by rapamycin. MPK1 is negatively regulated by TORC1 and essential for rapamycin survival21,22. Unlike the other MAPK, Mpk1 was essential for both cell viability and Adc17 induction in the presence of rapamycin (Extended Data Fig. 2c-e). HOG1 contributed to Adc17 upregulation by tunicamycin (Fig. 2c) but not by rapamycin (Extended Data Fig. 2d). Consistently, HOG1 was dispensable for survival in the presence of rapamycin (Extended Data Fig. 2c). Thus, induction of Adc17 and rapamycin-resistance are perfectly correlated (Extended Data Fig. 2c, d). As expected23, the levels of Mpk1 increased in response to tunicamycin (Extended Data Fig. 2d) but were compromised in hog1Δ cells (Extended Data Fig. 2d). Thus, one key function of Hog1 is to regulate Mpk1 levels (Fig. 2h), explaining why Mpk1 overexpression in hog1Δ cells rescued tunicamycin-resistance and Adc17 induction (Fig. 2f, g). Over time, both Mpk1 phosphorylation and abundance were increased by tunicamycin and rapamycin and this preceded Adc17 induction (Extended Data Fig. 3a, b). Confirming these findings, Bck1 and Mkk1/2, three kinases upstream of Mpk124, were also required for Adc17 induction by tunicamycin and rapamycin (Extended Data Fig. 3c, d). Moreover, Congo Red, a cell wall-damaging agent and known inducer of Mpk1 MAPK pathway24 also induced Adc17, in a Mpk1-dependent manner (Extended Data Fig. 3e). These results establish that diverse challenges inhibiting TORC1 signal to the Mpk1 MAPK to induce the proteasome assembly chaperone Adc17.
Mpk1 is a master regulator of the proteasome
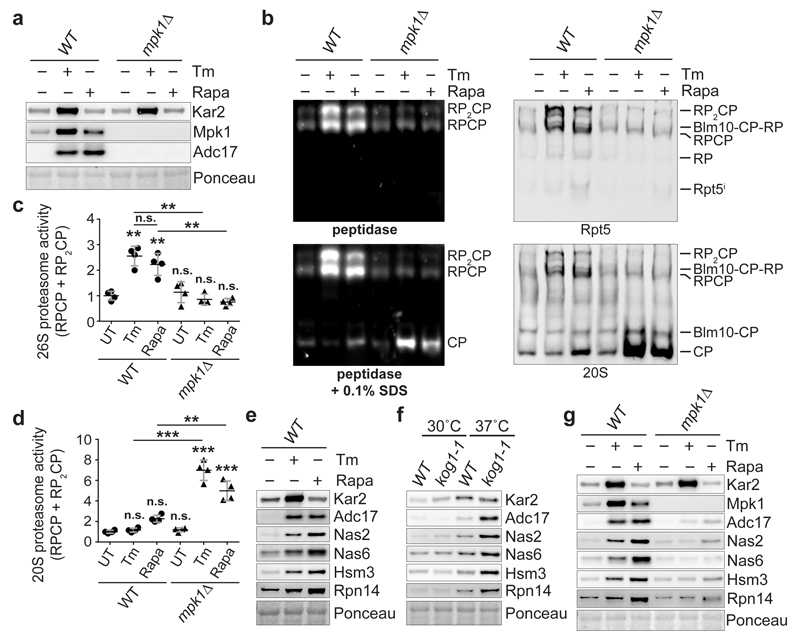
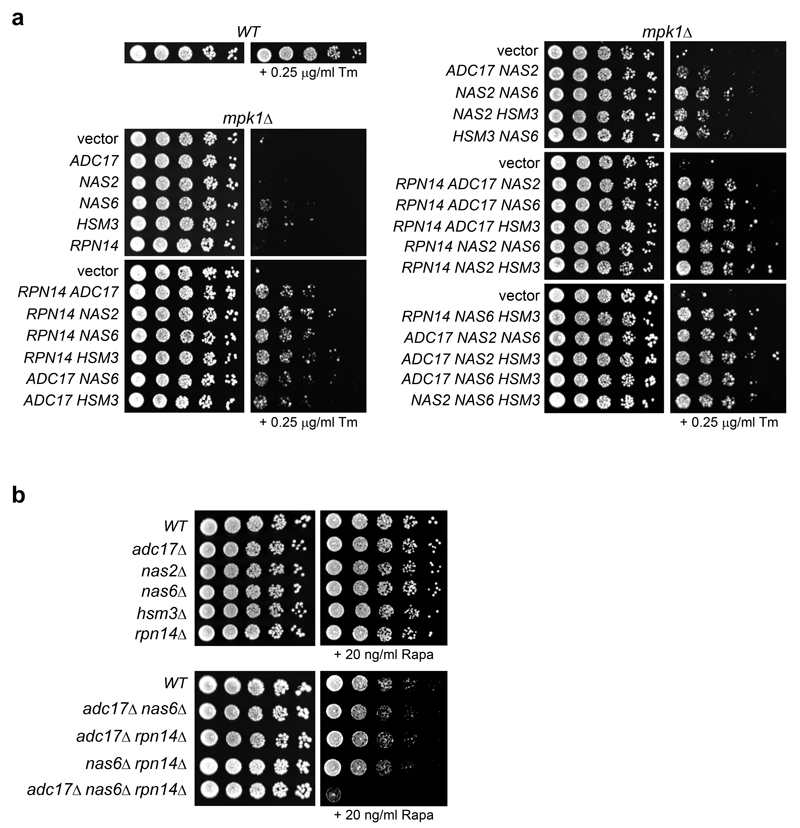
We next focussed on Mpk1 because it is essential for Adc17 induction (Fig. 3a) and examined if Mpk1 regulated proteasome abundance. Deleting MPK1 completely abolished the tunicamycin- or rapamycin-induced increase of 26S proteasomes while increasing the abundance of the free core particles (CP) (Fig. 3b-d). This defect is symptomatic of RP assembly defects6–8 and a hallmark of adc17Δ cells in response to stress10. However the mpk1Δ cells (Fig. 3b-d) appeared more severely affected than adc17Δ cells10 suggesting that other MPK1-regulated factors assist RP assembly. We found that all the known yeast RACs Nas2, Nas6, Hsm3 and Rpn14 were inducible by tunicamycin, rapamycin and Congo red in wild-type cells (Fig. 3e and Extended Data Fig. 3f). Genetic inactivation of TORC1 in kog1-1 cells also induced all RACs at the non-permissive temperature (Fig. 3f). Induction of all yeast RACs by tunicamycin and rapamycin was abolished in mpk1Δ, bck1Δ and mkk1/2Δ cells (Fig. 3g and Extended Data Fig. 3g, h). Overexpression of different combinations of three RACs markedly improved tunicamycin resistance in mpk1Δ cells (Extended Data Fig. 4a). Conversely, the deletion of three RACs severely impaired cell viability in the presence of rapamycin (Extended Data Fig. 4b). Thus, regulating the expression of RACs is a significant function of Mpk1. These results reveal that downstream of TORC1 inhibition, signalling through the Mpk1 MAPK pathway coordinates the induction of all RACs to control proteasome abundance and viability upon various stresses.
Figure 3. Mpk1 coordinates the expression of all yeast RACs to control proteasome abundance.
a, Immunoblots of lysates from cells cultured ± 5 µg/ml tunicamycin (Tm) or 0.2 µg/ml rapamycin (Rapa) for 4 hours. b, Native-PAGE (4.2%) of yeast cells cultured ± 5 µg/ml Tm or 0.2 µg/ml Rapa, revealed with Suc-LLVY-AMC and by immunoblots. Rpt5i (Rpt5 intermediates). c and d, Quantifications from experiments as in (b). Data are means ± SD of four biological replicates. **P≤0.01; ***P≤0.001; n.s., not significant (two-way ANOVA). e, Immunoblots from lysates of cells cultured ± 5 µg/ml Tm or 0.2 µg/ml Rapa for 4 hours. f, Immunoblots from lysates of cells cultured at 30 or 37°C for 4 hours. g, As in (e).
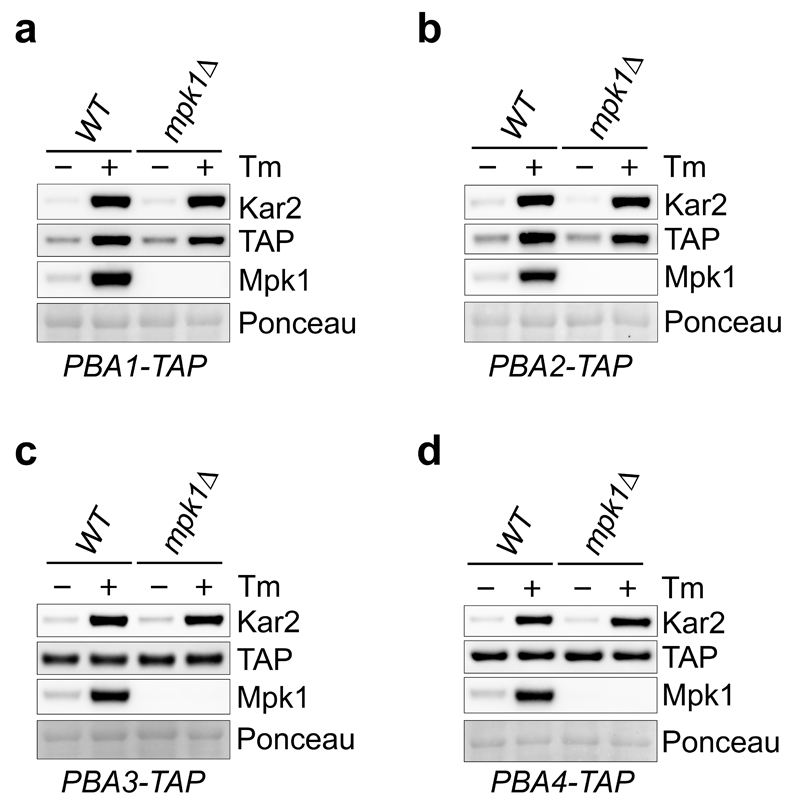
Tunicamycin and rapamycin increased 26S abundance in wild-type cells and increased free CP in mpk1Δ cells (Fig. 3b) suggesting that CP assembly might also be regulated. We next analysed the levels of the CP assembly chaperones Pba (proteasome biogenesis-associated) 1-425,26 after tunicamycin, the most potent inducer of CP in mpk1Δ cells (Fig. 3b, d). In wild-type cells, tunicamycin increased Pba1/2 levels but not Pba3/4 (Extended Data Fig. 5a-d). Thus, the increase in CP was accompanied by an increase of the assembly chaperones Pba1/2. This was unaltered upon MPK1 deletion (Extended Data Fig. 5a-d). This demonstrates that Pba1/2 are regulated by tunicamycin and their regulation is independent of Mpk1. The mechanism of Mpk1-independent regulation of Pba1/2 is an important issue for future study.
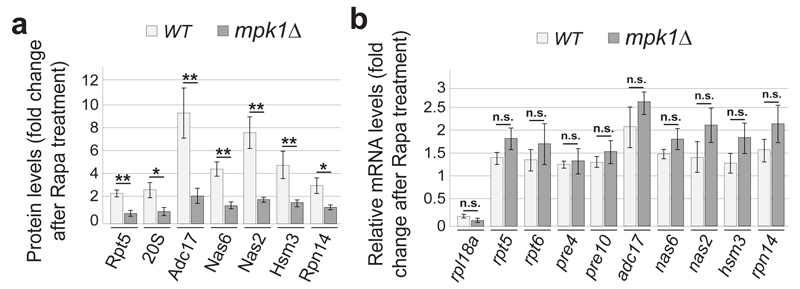
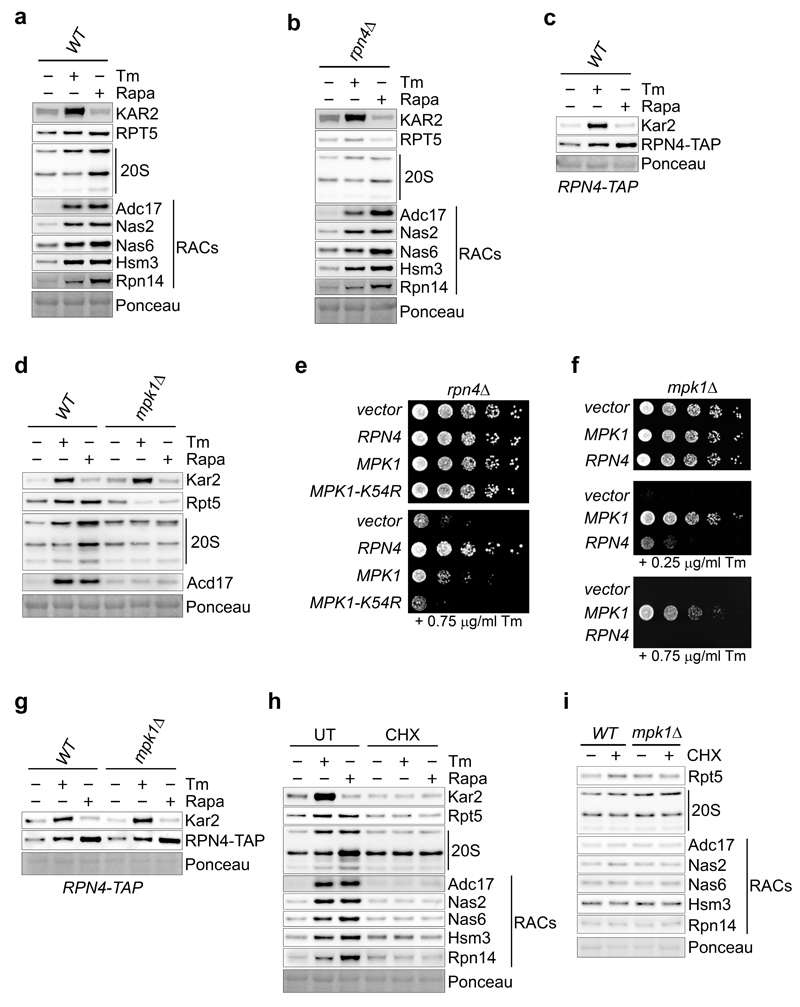
We next examined the regulation of proteasome subunits. Both tunicamycin and rapamycin increased the levels of proteasome subunits and this required Rpn4, the transcription factor controlling expression of proteasome subunits27 (Extended Data Fig. 6a, b). Consistently, Rpn4 increased upon tunicamycin or rapamycin treatment (Extended Data Fig. 6c). In contrast, Adc17 is upregulated upon diverse stresses independently of Rpn410 and all yeast RACs followed the same paradigm (Extended Data Fig. 6b). This confirms that upregulation of proteasome subunits depends on Rpn4 and establishes that upregulation of all known RACs is independent of Rpn4. Deletion of MPK1 completely abrogated the tunicamycin- and rapamycin-induced upregulation of proteasome subunits, revealing that Mpk1 is a master regulator of proteasome homeostasis (Fig. 4a and Extended data Fig. 6d).
Figure 4. Post-transcriptional control of RAC and proteasome subunit abundance by Mpk1.
a, Relative abundance of the indicated proteins in cells treated with rapamycin (Rapa) for 4 hours relative to untreated cells. b, Relative abundance of the indicated mRNA in cells treated with Rapa for 2 hours relative to untreated cells. rpl18a is used as a control. a and b, Data are means ± SD; n=3 biological replicates. *P≤0.05, **P≤0.01; n.s., not significant (two-way ANOVA).
We next identified a weak genetic interaction between RPN4 and MPK1 and found that both were required for tunicamycin survival (Extended Data Fig. 6e, f). Tunicamycin and rapamycin increased Rpn4 levels to wild-type levels in mpk1Δ cells (Extended Data Fig. 6g) suggesting that Mpk1 is acting downstream of the transcription factor Rpn4, possibly post-transcriptionally. At the protein level, MPK1 deletion completely abrogated the induction of proteasome subunits and RACs by rapamycin (Fig. 4a). At the mRNA level, rapamycin only modestly yet reproducibly increased abundance of RACs and proteasome subunits mRNAs (Fig. 4b) and this increase is similar in wild-type and mpk1Δ cells (Fig. 4b). Consistently, Rpn4 induction was similar in both strains (Extended Data Fig. 6g). Blocking the synthesis of new proteins with cycloheximide (CHX) for 4 hours did not change the abundance of proteasome subunits and RACs establishing that they were stable over this time period (Extended Data Fig. 6h, lanes 1 and 4). Likewise, the stability of proteasome subunits and RACs appeared similar in mpk1Δ cells and wild-type cells (Extended Data Fig. 6i). However, CHX completely blocked induction of proteasome subunits and RACs by tunicamycin and rapamycin in wild-type cells (Extended Data Fig. 6h). Together these results reveal that the MAPK Mpk1 coordinates the translation of proteasome subunits and RACs to provide the increased proteasome abundance required to sustain cell viability.
Mpk1 adapts proteasome degradation to rising needs
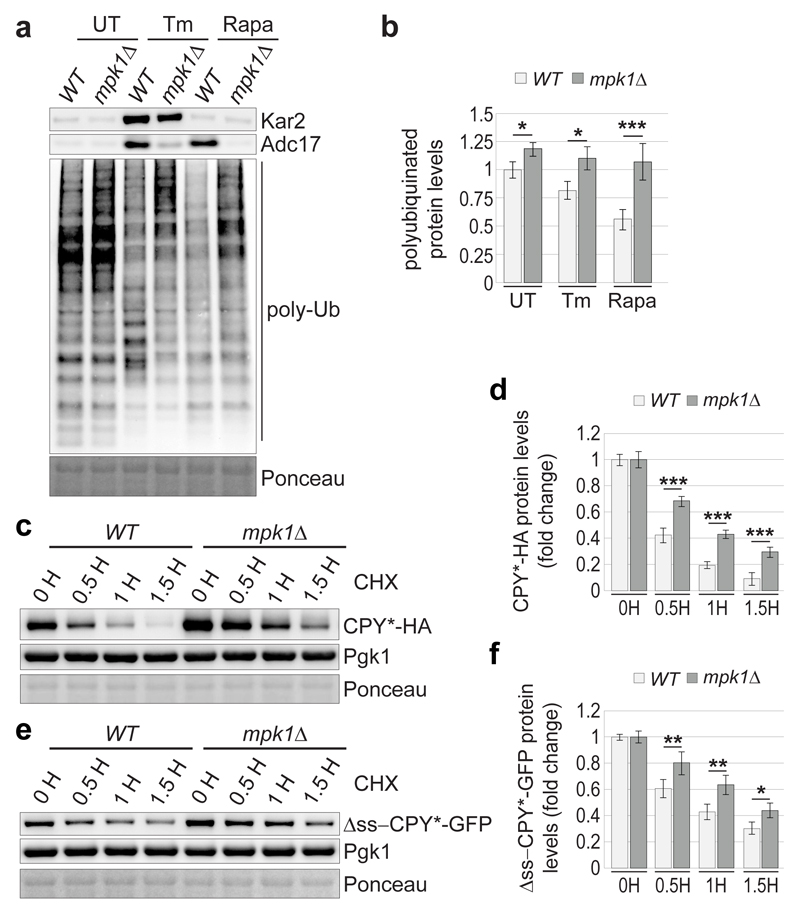
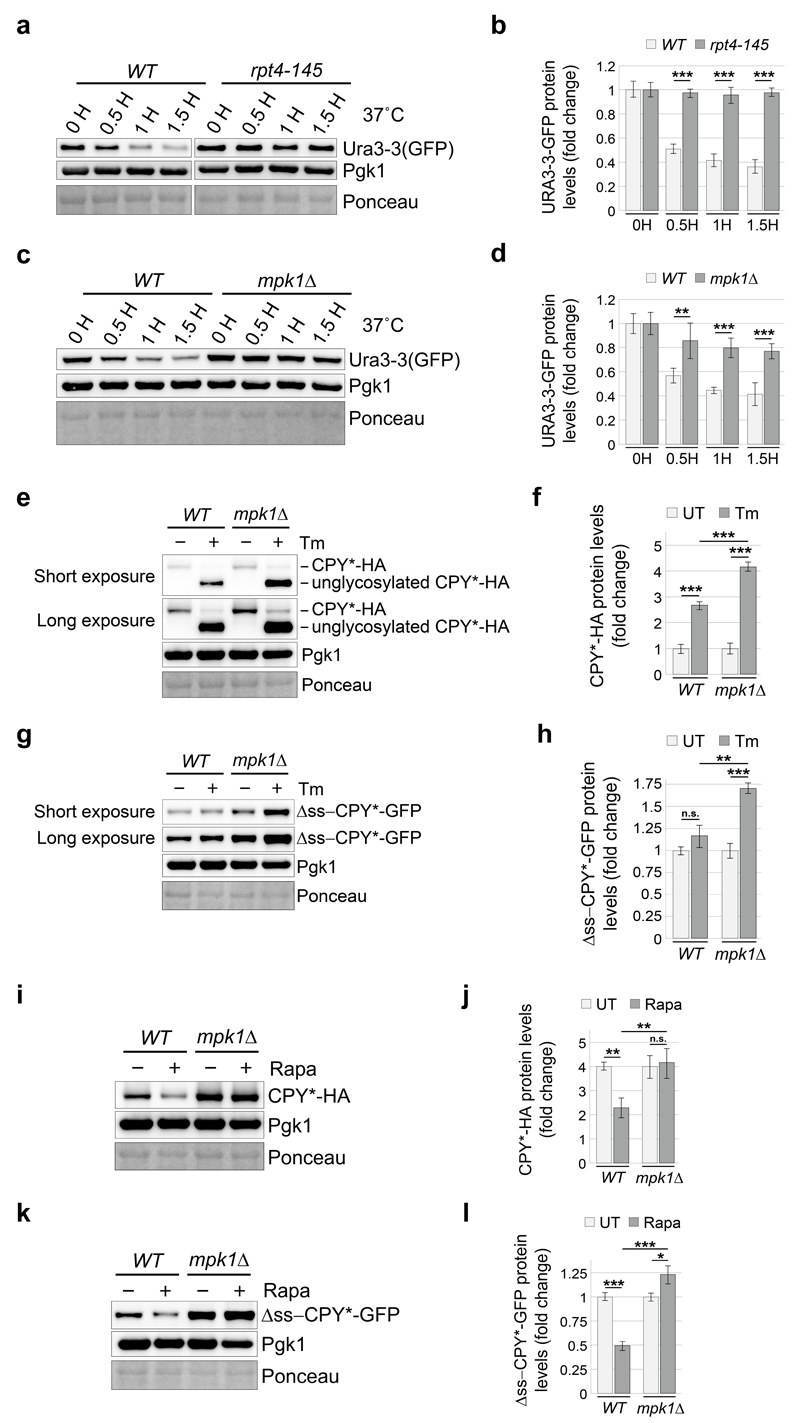
We next analysed the consequences of the MPK1-dependent increase of proteasome abundance on protein degradation. Polyubiquitinated conjugates represent a hallmark of impaired proteasomal degradation and were slightly elevated in mpk1Δ cells compared to wild-type (Fig. 5a, b). This defect was exacerbated upon tunicamycin or rapamycin treatment (Fig. 5a, b), suggesting an impaired proteasomal degradation and explaining why mpk1Δ cells failed to survive tunicamycin (Fig. 2a) or rapamycin (Extended Data Fig. 2c). To consolidate these findings, we examined the degradation of diverse proteasome reporter substrates. The metastable Ura3-3 reporter28 was rapidly degraded in wild-type cells cultured at 37°C but not in cells harbouring a thermosensitive mutation in the proteasome subunit Rpt4 (Extended Data Fig. 7a, b). Likewise, the degradation of the reporter substrate was dramatically compromised in mpk1Δ cells (Extended Data Fig. 7c, d). The degradation of the two well-characterised proteasome reporter substrates, CPY*-HA and Δss-CPY*-GFP, which are localized in the endoplasmic reticulum and in the cytosol, respectively29,30 was also compromised in mpk1Δ cells (Fig. 5c-f) and this was aggravated in cells challenged with tunicamycin and rapamycin (Extended Data Fig. 7e-l). This unifies the previous findings and demonstrates that Mpk1 maintains the adequate levels of proteasome required to sustain protein degradation and cell viability under challenging conditions.
Figure 5. Mpk1 adjusts proteasome degradation to match the needs.
a, Immunoblots of lysates of cells cultured ± 5 µg/ml tunicamycin (Tm) or 0.2 µg/ml rapamycin (Rapa) for 4 hours. Poly-Ub: polyubiquitinated conjugates. c and e, Immunoblots from lysates of cells expressing CPY*-HA (c) or Δss-CPY*-GFP (e) treated with 35 µg/ml cycloheximide (CHX) for the indicated time. (b, d, f) Quantification of (a, c, e), respectively. Data are means ± SD; n=4 (b) and n=3 (d and f) biological replicates.*P≤0.05; **P≤0.01; ***P≤0.001; n.s., not significant (two-way ANOVA).
Evolutionary conservation of proteasome regulation
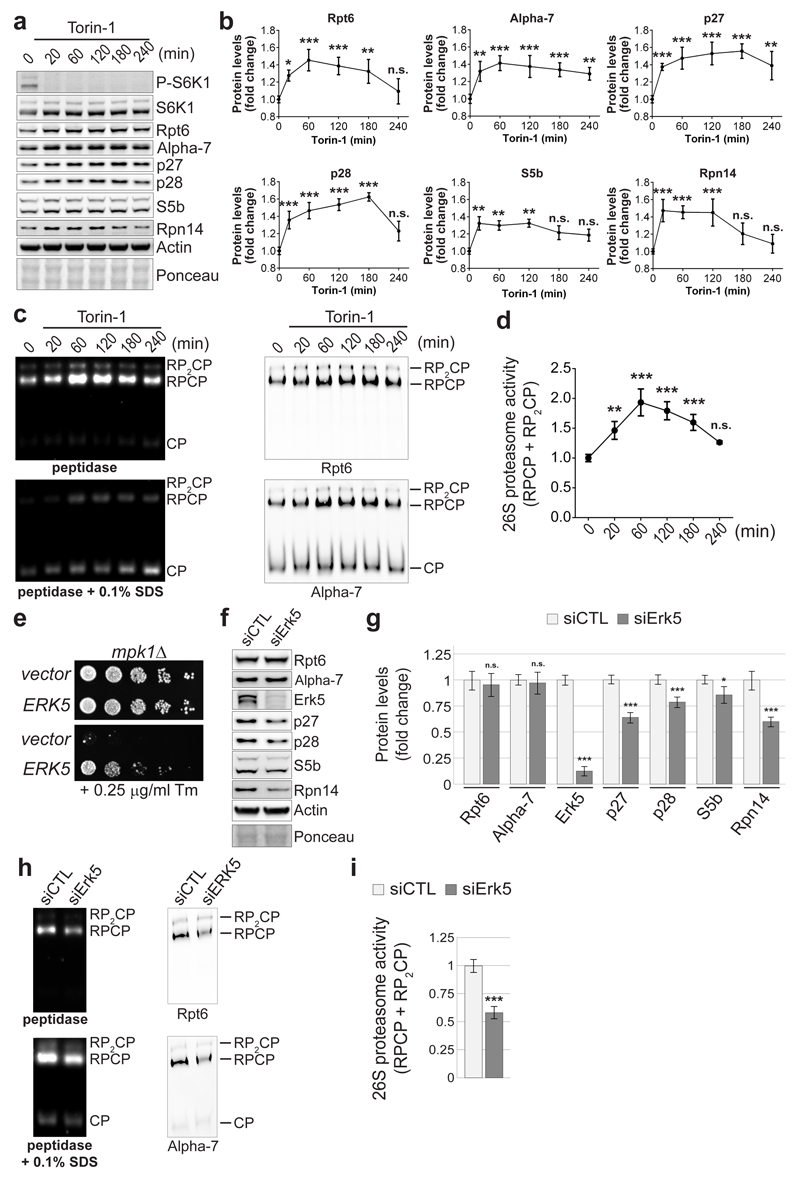
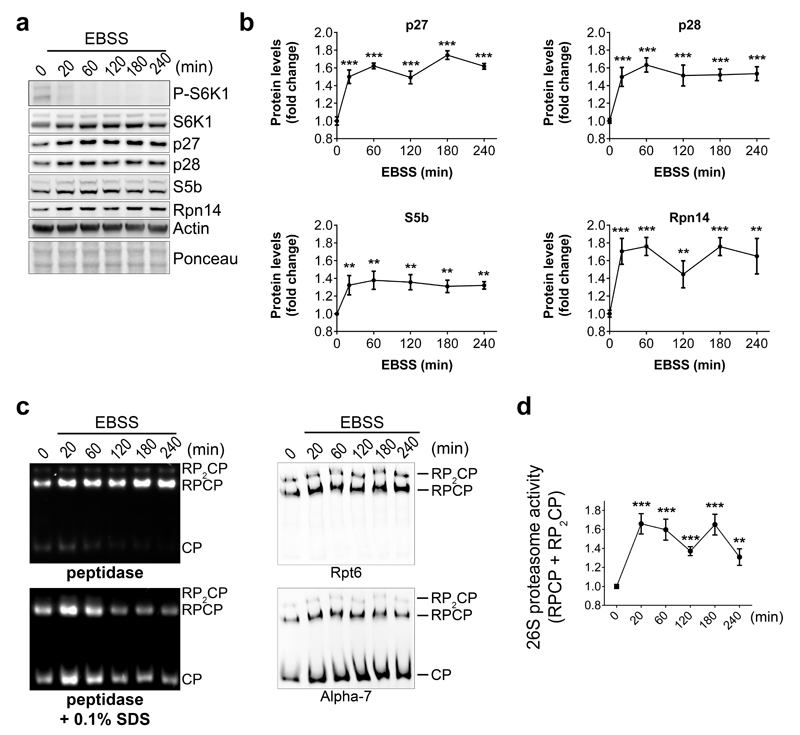
Four RACs are evolutionarily conserved with p27, p28, S5b and Rpn14/PAAF1 being human orthologs of the yeast Nas2, Nas6, Hsm3 and Rpn145–9. We next investigated whether the TORC1-Mpk1 regulation of RACs was evolutionarily conserved. Inhibition of mTOR by Torin-1 rapidly increased the levels of all mammalian RACs (Fig. 6a, b), similar to what was found in yeast (Fig. 3e, f). Likewise, mTOR inhibition resulting from nutrient starvation also increased the RACs (Extended Data Fig. 8a, b). As in yeast, the concerted increase of the RACs was accompanied by an upregulation of proteasome subunits (Fig. 6a, b) and resulted in an increase in the levels of 26S proteasome (Fig. 6c, d and Extended Data Fig. 8c, d). This response was acute, with a rapid return to basal levels (Fig. 6a-d). Note that RPCP is more abundant than RP2CP in mammalian cells, as previously reported31.
Figure 6. Evolutionary conservation of the pathway controlling RACs and proteasome abundance.
a and b, Immunoblots (a) and quantifications (b) of the indicated proteins in lysates of HeLa cells treated with 250 nM Torin-1 for the indicated time. c and d, Native-PAGE (4.2%) (c) and quantifications (d) of HeLa cell lysates following treatment as in (a) and revealed with Suc-LLVY-AMC and by immunoblots. e, mpk1Δ cells transformed with a plasmid encoding the human Erk5 or an empty vector were spotted in a 6-fold dilution and grown on plates ± Tm for 3 days. f and g, Immunoblots (f) and quantifications (g) of the indicated proteins in lysates of HeLa cells 3 days after transfection with a non-target siRNA (siCTL) or a siRNA targeting Erk5 (siErk5). h and i, Native-PAGE (4.2%) (h) and quantifications (i) of HeLa cell extracts 3 days after transfection with siCTL or siErk5 revealed with Suc-LLVY-AMC or by immunoblots. (b, d, g, i) Data are means ± SD; n=3 biological replicates. *P≤0.05; **P≤0.01; ***P≤0.001; n.s., not significant (b and d, one-way ANOVA; g, two-way ANOVA; i, two-tailed Student’s t-test).
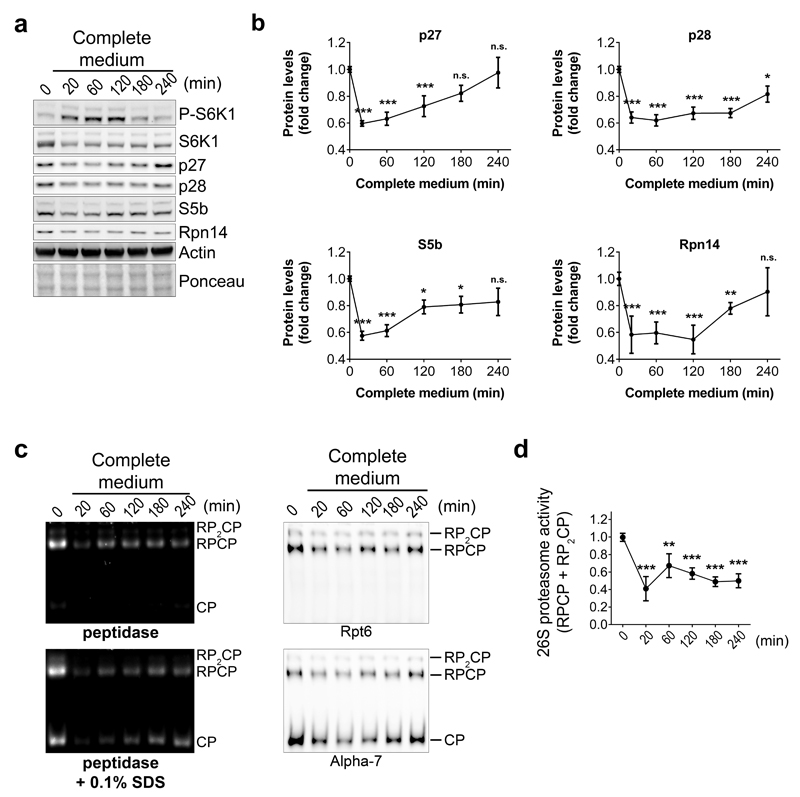
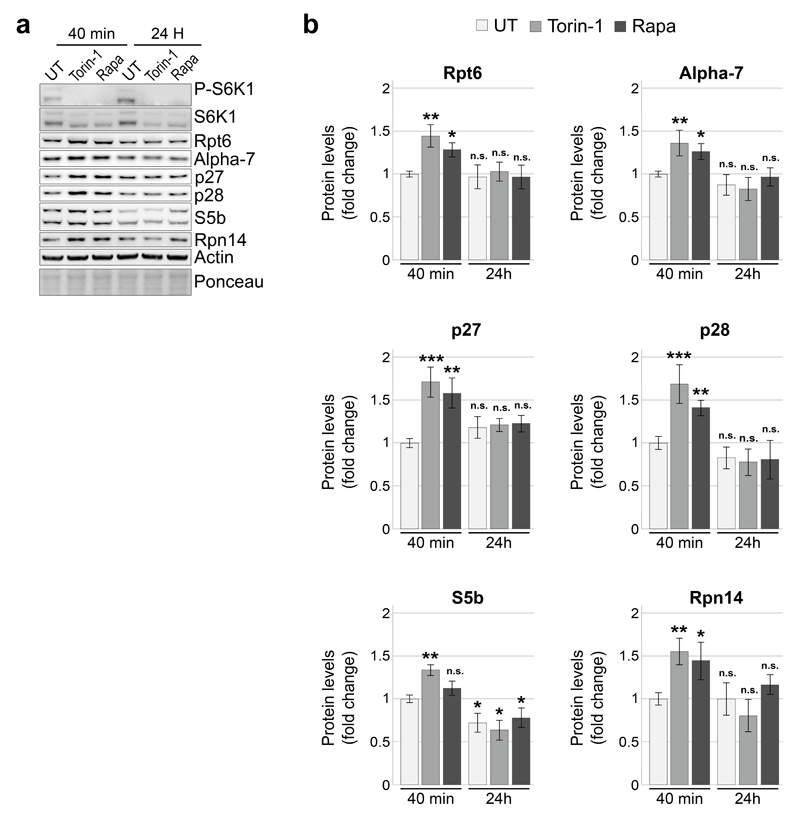
Conversely, medium replenishment to increase nutrient supply and activate mTORC1 had the opposite effect resulting in S6K1 phosphorylation (Extended Data Fig. 9a), decreased abundance of RACs (Extended Data Fig. 9a, b) and proteasome amounts (Extended Data Fig. 9c, d). Rapamycin, a selective mTORC1 inhibitor, also acutely and transiently induced the RACs as well as proteasome subunits (Extended Data Fig. 10), confirming that, as in yeast, mTORC1 controls proteasome homeostasis. We next wondered whether Erk532, the mammalian ortholog of Mpk1, also regulates proteasome abundance. Erk5 overexpression in yeast rescued tunicamycin resistance in mpk1Δ cells (Fig. 6e). Knocking down Erk5 with siRNA in human cells resulted in a decrease of the four mammalian RACs p27, p28, S5b and Rpn14 (Fig. 6f, g), as well as the 26S proteasome (Fig. 6h, i). Thus, mammalian Erk5, like yeast Mpk1, controls RACs and thereby acts as a switch to control proteasome abundance.
Discussion
Here we report a general and evolutionarily conserved homeostatic response that increases proteasome abundance as needed, through the coordinated upregulation of RP assembly chaperones and proteasome subunits. The master regulators of growth and stress TORC1 and Mpk1/Erk5 are central to this response. In line with the general principle of homeostatic responses, we observed that proteasome increase is an acute and rapidly reversible response. Future work will identify the other components of this proteasome homeostatic response, in particular the mechanisms regulating 20S assembly and how proteasome levels return to baseline after an acute increase.
Our results also provide a framework for rationalizing previous observations. It was reported that when cultured in absence of serum, proteasomal degradation is increased in cells lacking Tsc2, a negative regulator of TORC133. Conflicting with this, a recent study reported that mTOR inhibition activates proteasomal degradation by a mechanism proposed to be driven by increased ubiquitination34. In light of our results, it may be the adaptive response to the stress resulting from the lack of Tsc2 combined with serum starvation that increases proteasomal degradation in Tsc2-/- cells, rather than Tsc2 deletion per se.
In line with our findings is the well-established notion that mTOR activation enhances anabolic processes and represses catabolic processes19,35. mTORC1 is known to repress autophagy. We show here that TORC1 restricts proteasome abundance and this is rapidly alleviated upon TORC1 inhibition. Therefore, the same controller TORC1 restricts the abundance of the two cellular proteolytic machineries, the proteasome and autophagy. Our findings integrate proteasome assembly and abundance with growth and cellular metabolism and suggest that the increased proteasome capacity resulting from TORC1 inhibition may also contribute to the benefit of the widely used TORC1 inhibitors.
The current prevailing view is that protein degradation is largely regulated at the level of ubiquitination. Here we demonstrate that modulating proteasome abundance is an important component of regulation of proteasomal degradation. Adapting proteasome abundance is vital to cope with overwhelming needs implying that proteasome abundance can be rate limiting under critical conditions. The fact that the TORC1-Mpk1/Erk5 pathway controlling proteasome abundance is evolutionarily conserved further highlights the importance of this regulation.
The pathway identified here can be used as a unique switch to increase proteasome assembly and abundance on demand. Because many human diseases are associated with accumulation of misfolded proteins, increasing proteasome abundance by manipulating the switches identified here could be used as a generic strategy to reduce the burden of misfolded proteins that accumulate in such age-related diseases.
Methods
Yeast strains, plasmids and growth assays
Gene-deletion mutants and their isogenic wild-type strain (BY4741) were grown in YPD medium according to standard protocols 36. To assess growth phenotypes, exponentially growing liquid cultures expressing the indicated genes were equilibrated to an OD600 of 0.2, and 4 μl were spotted in serial dilutions (1/6) onto YPD or selective media as required. Plates were incubated at 30°C for 3 days. To assess tunicamycin and rapamycin sensitivity, cells were spotted on plates supplemented with tunicamycin (0.25 μg/ml or 0.75 μg/ml, as indicated) or rapamycin (20 ng/ml). Yeast strains and plasmids used in this study are presented in Extended Data Table 1 and Extended Data Table 2, respectively.
Tunicamycin (Sigma-Aldrich; 2.5 mg/ml stock) aliquots were stored at -20°C and used within three months. Rapamycin (Sigma-Aldrich; 1 mM in DMSO) and Torin-1 (Santa Cruz Biotechnology; 1 mM in DMSO) aliquots were stored at −80°C and used within a month. Cycloheximide (Sigma-Aldrich; 35 mg/ml in ethanol) was used at 35 μg/ml final concentration to inhibit translation in yeast. MG132 (Cell Signaling Technology; 10 mM in DMSO) was used at 10 μM final concentration.
Immunoblot analyses in yeast
10 ml of exponentially growing cells adjusted to an OD600 of 0.2 were treated with 5 μg/ml tunicamycin (Tm), 0.2 μg/ml rapamycin (Rapa), 50 μg/ml congo red (CR) or DMSO for 4 hours at 30°C. Cells were harvested by centrifugation at 9,000 rpm for 30 seconds at 4°C, pre-treated with 2 M LiAc and then 0.4 M NaOH for 5 minutes on ice as in 37. Cell lysates were then performed as in 38. Briefly, cells were resuspended in 100 μl of Lysis Buffer (0.1 M NaOH, 0.05 M EDTA, 2% SDS, 2% β-mercaptoethanol, one complete protease inhibitor cocktail tablet [PiC, Roche] per 50 ml, one phosphatase inhibitor cocktail tablet [PhosSTOP, Roche] per 10 ml). For the detection of poly-ubiquitinated proteins, the Lysis buffer is supplemented with 5 mM N-ethylmaleimide (Sigma-Aldrich). Lysates were incubated at 90°C for 10 minutes. 2.5 μl of 4 M acetic acid were subsequently added prior to vortex for 30 seconds. Lysates were incubated at 90°C for 10 minutes and then cleared by centrifugation for 10 minutes at 13,000 rpm. Supernatants were transferred to a clean tube and protein concentrations were measured by monitoring OD280. Protein concentrations were equilibrated to 1 µg of total proteins per µl and 80 μl of lysates were mixed with 20 μl of 5X Loading Buffer (0.25 M Tris-HCl [pH 6.8], 10% SDS, 50% Glycerol, 0.05% Bromophenolblue). 15 μg of total protein extract were loaded on Bolt 4%–12% Bis-Tris Plus gels (Life Technologies) and resolved in MES buffer. Gel-separated protein samples were transferred to nitrocellulose membranes (Life Technologies). Membranes were cut and their fragments were incubated with antibodies to Kar2 (sc-33630; Santa Cruz Biotechnology, 1:1,000), GFP (ab290; Abcam, 1:5000), HA (mHA.11; Covance, 1:2000), TAP (CAB1001; Pierce, 1:1000), ubiquitin (646302 (P4D1); BioLegend, 1:1000), Adc17 (Bertolotti lab; 10 1:1,000), P-T737-Sch9 (Maeda lab; 16 1:5,000), Mpk1 (sc-6803; Santa Cruz Biotechnology, 1:1,000), Hog1 (sc-9079; Santa Cruz Biotechnology, 1:1,000), P-Mpk1 (#9101; Cell Signaling Technology, 1:1,000), Rpt5 (BML-PW8245; Enzo life sciences, 1:5000), 20S core subunits (CP) (BML-PW9355; Enzo life sciences, 1:2000), Nas6 (ab91447; Abcam, 1:1,000;) and Nas2, Hsm3 and Rpn14 (Hochstrasser lab; 7, 1:1,000). Proteins were visualized by ECL Prime (GE Healthcare) using chemi-Smart 5000 or ChemiDoc Touch equipments (Bio-Rad).
For analyses of the phosphorylation status of Sch9, cell aliquots were taken at the indicated times and mixed with trichloroacetic acid (TCA) at a final concentration of 6%. Cell lysates were then prepared as described previously39.
Native-PAGE in yeast
30 ml of exponentially growing cells adjusted to an OD600 of 0.2 were treated with 5 μg/ml tunicamycin (Tm), 0.2 μg/ml rapamycin (Rapa) or DMSO for 3 hours at 32°C. Cells were then harvested, washed in ice-cold water, resuspended in Native Lysis Buffer (50 mM Tris-HCl [pH 7.4], 1 mM EDTA, 5 mM MgCl2, 1 mM DTT, 2 mM ATP) as in 40, and disrupted with glass beads (10 times 30 seconds) at 4°C. After removal of the glass beads, the extracts were cleared by centrifugation at 12,500 rpm for 10 minutes at 4°C. Protein concentration was measured by monitoring OD280 and 80 μl of adjusted extracts were mixed with 20 μl of 5X Native Loading Buffer (0.25 M Tris-HCl [pH 6.8], 50% Glycerol, 0.05% Bromophenolblue). 25 μg of each extract were subjected to 4.2% native-PAGE. In-gel peptidase assay was performed as described previously 10 prior to being transferred to nitrocellulose membranes. Membranes were incubated with antibodies to 20S (PW9355; Biomol, 1:2000) and Rpt5 (PW8245; Biomol, 1:1000). Proteins were visualized by ECL Prime (GE Helthcare).
Microscopy
Images of yeast cells carrying a GFP-tagged SFP1 at the endogenous locus were taken using Zeiss-710 confocal microscope. The excitation laser wavelength, emission detection bands and pinhole diameter were chosen based on the manufacturers recommended settings for Hoechst 33342 and GFP. The laser power and detector gain settings were adjusted to avoid saturation.
Quantitative RT-PCR
Total yeast RNA was extracted as previously described41. 15 μg of purified RNA was treated with the Turbo DNase kit (Ambion) and 1 μg of DNA-free RNA was synthesized into cDNA using the iScript cDNA synthesis kit (Bio-Rad Laboratories). cDNA was diluted 1:10 before the quantitative RT-PCR was performed.
Quantitative RT-PCR with primers alg9 (f): cacggatagtggctttggtgaacaattac, alg9 (r): tatgattatctggcagcaggaaagaacttggg, rpl18a (f): gtgccagagccaagattgtt, rpl18a (r): tggagctctgacagctaattga, pre4 (f): tgaaaatgcgtatgacaatcct, pre4 (r): tcaaaaatatagctgggttcgag, pre10 (f): aagtggctcttattggggcta, pre10 (r): ttcgcagattgcctaccttt, rpt5 (f): gcaaagaaccatgctggaat, rpt5 (r): tgacacgatcatcggagcta, rpt6 (f): ttccattggctctactcgtg, rpt6 (r): aaacccgtccaattggttta, adc17 (f): cgacgacttggagaacattg, adc17 (r): caatgcgtccactctctcat, nas6 (f): tccaaaccttccttgttgcta, nas6 (r): tgcttggaaagaaactgacca, nas2 (f): ctagaggcgtatttcagtgtgc, nas2 (r): tcaccaacgcagagtccat, hsm3 (f): aaaatttctgctcaatgagatgc, hsm3 (r): gcgctcccatcacctatc, rpn14 (f): tgccataatagaccgaggaag, rpn14 (r): aggcgaattgtaccatccaa was performed using SYBR® Select Master Mix (4472908; Applied Biosystems) on a ViiA™ 7 system (Life technologies). Expression of each gene was normalized to the housekeeping gene ALG9 and expressed as fold change after 2h rapamycin treatment calculated using Paffl equation.
Mammalian cell culture
HeLa cells were from IGBMC (Strasbourg, France) with authentication and they were not used beyond passage 20 from original derivation. HeLa cells were routinely tested for mycoplasma contaminations. HeLa cells were cultured in Minimum Essential Media (MEM) (11095-080; Life technologies) supplemented with L-glutamine-penicillin-streptomycin solution (G6784; Sigma-Aldrich) and containing 10% fetal bovine serum (FBS). The medium was changed every 24 hours. Medium replenishment experiment was carried out using DMEM (11960-044; Life technologies, [high glucose, no glutamine]) supplemented with L-glutamine-penicillin-streptomycin solution (G6784; Sigma-Aldrich) and containing 10% FBS.
Mammalian cell treatments
For mTOR inhibition by Torin-1, cells were plated in 6-well plates at a density of 400,000 cells/well. The medium was changed 24 hours after plating and a final concentration of 250 nM Torin-1, 200 nM rapamycin or DMSO was directly added to the medium 48 hours after plating (confluence: 85-95%) for the indicated time. For starvation experiments, cells were plated in 6-well plates at a density of 400,000 cells/well. The medium was changed 24 hours after plating. 48 hours after plating, HeLa cells were washed twice with PBS prior to being cultured in Earle’s Balanced Salt Solution (EBSS) for the indicated time points. For medium replenishment experiments, cells were plated in 6-well plates at a density of 400,000 cells/well. The medium was changed 24 hours after plating. 48 hours after plating, HeLa cells were washed twice with PBS prior to being cultured in fresh DMEM for the indicated time points.
Immunoblot analyses in mammalian cells
Cells were rinsed twice with ice-cold PBS, harvested by centrifugation and lysed in 100 μl of ice-cold lysis buffer (50 mM Tris-HCl [pH 7.4], 150 mM NaCl, 1% Triton X-100, 0.1% SDS, 1% sodium deoxycholate, one complete protease inhibitor cocktail tablet [PiC, Roche] per 50 ml, one phosphatase inhibitor cocktail tablet [PhosSTOP, Roche] per 10 ml). Lysates were then sonicated for 3 minutes (1 second on/1 second off). The soluble fractions from cell lysates were isolated by centrifugation at 13,000 rpm for 10 minutes at 4°C and protein concentrations were measured using BCA Protein Assay Kit (Thermo scientific) and adjusted to 1 μg of total proteins per μl. 80 μl of adjusted protein extracts were mixed with 20 μl of 5X Loading Buffer (0.25 M Tris-HCl [pH 6.8], 10% SDS, 50% Glycerol, 0.05% Bromophenolblue). 15 μg of total protein extract were loaded on Bolt 4%–12% Bis-Tris Plus gels (Life Technologies) and resolved in MES buffer. Gel-separated protein samples were transferred to nitrocellulose membranes (Life Technologies). Membranes were cut and their fragments were incubated with antibodies to P-p70-S6 Kinase (P-S6K1) (#9205; Cell Signaling Technology, 1:1,000), p70-S6 Kinase (S6K1) (#92vh02; Cell Signaling Technology, 1:1,000), Rpt6 (SUG-1B8; Euromedex, 1:5000), Alpha-7 (PW8110; Biomol, 1:1000), p27 (Psmd9) (WH0005715M1; Sigma-Aldrich, 1:1,000), p28 (Psmd10) (#12985; Cell Signaling Technology, 1:1,000), S5b (Psmd5) (LS-C133418; LifeSpan BioSciences inc, 1:1,000), Rpn14 (Paaf1) (ab103566; Abcam, 1:1,000), Actin (ab3280; Abcam, 1:1,000), Erk5 (E1523, Sigma-Aldrich, 1:1,000) and POMP (ab170865; Abcam, 1:1,000). Proteins were visualized by ECL Prime (GE Healthcare) using chemi-Smart 5000 or ChemiDoc Touch equipments (Bio-Rad).
For native-PAGE, cells were rinsed twice with ice-cold PBS, harvested by centrifugation and lysed in 200 μl of Native Lysis Buffer (50 mM Tris-HCl [pH 7.4], 1 mM EDTA, 5 mM MgCl2, 1 mM DTT, 2 mM ATP) as in 40 and disrupted with glass beads (3 times 20 seconds) at 4°C. After removal of the glass beads, the extracts were cleared by centrifugation at 12,500 rpm for 10 minutes at 4°C. Protein concentration was measured by monitoring OD280 and 80 μl of adjusted extracts were mixed with 20 μl of 5X Native Loading Buffer (0.25 M Tris-HCl [pH 6.8], 50% Glycerol, 0.05% Bromophenolblue). 25 μg of each extract were subjected to 4.2% native-PAGE. In-gel peptidase assay was performed as described previously 10 prior to being transferred to nitrocellulose membranes. Membranes were incubated with antibodies to Alpha7 (PW8110; Biomol, 1:1000) and Rpt6 (SUG-1B8; Euromedex, 1:5000). Proteins were visualized by ECL Prime (GE Helthcare).
RNA interference
ON-TARGET plus SMARTpool siRNA for Erk5, POMP or non-targeting control (Dharmacon) were used in knock down experiments. HeLa cells (400,000 cells/well) were plated in 6-well plates. 24 hours after plating, media were replenished and siRNAs were delivered into cells using RNAiMAX (#13778075 from Invitrogen) according to manufacturer’s instructions. The medium was changed every 24 hours post transfection for a total of 3 days. Cells were then harvested and analyzed by immunoblot.
Statistical analysis
Representative results of at least three independent experiments (biological replicates) are shown in all panels. GraphPad Prism software was used for all statistical analyses. Data are presented as means and standard deviations. For immunoblot quantifications, level of each protein was normalized to PGK1 in yeast and β-actin in mammalian cells and expressed as fold change. Data were analyzed using unpaired Student t-test or repeated measures analysis of variance (two-way ANOVA). The level of significance was set at *P≤0.05; **P≤0.01; ***P≤0.001; n.s., not significant.
Extended Data
Extended Data Figure 1. Adc17 induction is increased in mrs6-DAmp cells and occurs when Sfp1 is cytosolic.
a, Immunoblots of the indicated proteins in lysates of WT and Mrs6-hypomorphic (mrs6-DAmP) strains ± 5 µg/ml tunicamycin (Tm) for 4 hours. b, Representative images of yeast cells carrying a GFP-tagged SFP1 at the endogenous locus, ±5 µg/ml tunicamycin (Tm) for 4 hours. Scale bar: 5 µm. Representative results of at least three independent experiments (biological replicates) are shown.
Extended Data Figure 2. Mpk1 is essential for tunicamycin and rapamycin survival and Adc17 induction.
a, mpk1Δ cells transformed with wild-type MPK1 or a kinase-dead allele (MPK1-K52R) or empty vector were spotted in a 6-fold dilution and grown on plates containing or lacking tunicamycin (Tm). b, Immunoblots of lysates of strains shown in (a), cultured for 4 hours ± 5 µg/ml Tm. c, Cells of the indicated genotype were spotted in a 6-fold dilution and grown for 3 days at 30°C on plates containing or lacking rapamycin (Rapa). d, Immunoblots of lysates from wild-type (WT) and MAPK gene-deletion mutant cells cultured for 4 hours ± 5 µg/ml Tm or 0.2 µg/ml Rapa. e, Same as in (a) using mpk1Δ cells transformed with empty vector or a vector encoding MPK1 or HOG1. Representative results of at least three independent experiments (biological replicates) are shown.
Extended Data Figure 3. Mpk1 MAPK pathway is essential for stress-mediated RACs induction.
a and b, Immunoblots of the indicated proteins in lysates of wild-type (WT) cells ± 5 µg/ml tunicamycin (Tm) (a) or 0.2 µg/ml rapamycin (Rapa) (b) for the indicated time. c and g, Immunoblots of the indicated proteins in lysates of WT and bck1Δ cells cultured ± 5 µg/ml Tm or 0.2 µg/ml Rapa for 4 hours. d and h, Immunoblots of the indicated proteins in lysates of WT and mkk1/2Δ cells cultured ± 5 µg/ml Tm or 0.2 µg/ml Rapa for 4 hours. e and f, Immunoblots of the indicated proteins in lysates of WT or mpk1Δ cells ± 50 µg/ml Congo red (CR) for 4 hours. Representative results of at least three independent experiments (biological replicates) are shown.
Extended Data Figure 4. Induction of RACs under challenging conditions is an important function of Mpk1.
a, WT cells or mpk1Δ cells transformed with one or combinations of two or three RACs were spotted in a 6-fold dilution and grown on plates containing or lacking Tm, where indicated. b, Multiple-deletion strains of different RACs were spotted in a 6-fold dilution and grown on plates containing or lacking rapamycin (Rapa). Representative results of at least three independent experiments (biological replicates) are shown.
Extended Data Figure 5. Pba1-2 are induced by tunicamycin in a Mpk1-independent manner.
a-d, Immunoblots of the indicated proteins in lysates of WT cells carrying a TAP-tagged Pba1 (a), Pba2 (b), Pba3 (c) and Pba4 (d) at the endogenous locus ± 5 µg/ml tunicamycin (Tm) for 3 hours. Representative results of at least three independent experiments (biological replicates) are shown.
Extended Data Figure 6. Mpk1 regulates proteasome subunits and RACs post-transcriptionally.
a and b, Immunoblots of the indicated proteins in lysates of wild-type (WT) (a) and rpn4Δ (b) cells ± 5 µg/ml tunicamycin (Tm) or 0.2 µg/ml rapamycin (Rapa) for 4 hours. c, Immunoblots of the indicated proteins in lysates of WT cells carrying a TAP-tagged RPN4 at the endogenous locus ± 5 µg/ml tunicamycin (Tm) or 0.2 µg/ml rapamycin (Rapa) for 4 hours. d, Immunoblots of the indicated proteins in lysates of wild-type (WT) and mpk1Δ cells ± 5 µg/ml Tm or 0.2 µg/ml Rapa for 4 hours. e, rpn4Δ cells transformed with RPN4, MPK1, a kinase-dead allele of MPK1 (MPK1-K52R) or empty vector were spotted in a 6-fold dilution and grown on plates containing or lacking tunicamycin (Tm). f, mpk1Δ cells transformed with MPK1, RPN4 or empty vector were spotted in a 6-fold dilution and grown on plates containing or lacking tunicamycin (Tm) where indicated. g, Immunoblots of the indicated proteins in lysates of WT and mpk1Δ cells carrying a TAP-tagged RPN4 at the endogenous locus ± 5 µg/ml Tm or 0.2 µg/ml Rapa for 4 hours. h and i, Immunoblots of the indicated proteins in lysates of WT (h and i) and mpk1Δ (i) cells treated with different combinations of drugs: 5 µg/ml Tm, 0.2 µg/ml Rapa and 35 µg/ml cycloheximide (CHX), where indicated for 4 hours. Representative results of at least three independent experiments (biological replicates) are shown.
Extended Data Figure 7. Mpk1 maintains the adequate levels of proteasome required to sustain protein degradation.
a and c, Cells of the indicated genotype expressing GFP-tagged Ura3-3 proteins were treated with cycloheximide and incubated at 37°C for the indicated time. b and d, Quantifications from three independent experiments (biological replicates) such as the one shown in (a and c). e and g, Cells of the indicated genotype expressing CPY*-HA (e) or Δss-CPY*-GFP (g) proteins were treated with tunicamycin (Tm) for 4 hours. f and h, Quantifications from three independent experiments (biological replicates) such as the one shown in (e and g). i and k, Cells of the indicated genotype expressing CPY*-HA (i) or Δss-CPY*-GFP (k) proteins were treated with rapamycin (Rapa) for 4 hours. j and l, Quantifications from three independent experiments (biological replicates) such as the one shown in (i and k). b, d, f, h, j and l, Data are means ± SD. n=3 biological replicates. *P≤0.05; **P≤0.01; ***P≤0.001; n.s., not significant (two-way ANOVA).
Extended Data Figure 8. Starvation inhibits TORC1 signaling, induces mammalian RACs and increases proteasome abundance.
a and b, Immunoblots (a) and quantification (b) of the indicated proteins in lysates of HeLa cells after EBSS treatment for the indicated time. c, HeLa cell extracts following EBSS treatment for the indicated time were resolved on Native-PAGE (4.2%) and revealed with the fluorogenic substrate Suc-LLVY-AMC or by immunoblots. d, Quantification of the 26S proteasome activity (RPCP and RP2CP) of experiments such as the one shown in (c). b and d, Data are means ± SD. n=3 biological replicates. *P≤0.05; **P≤0.01; ***P≤0.001; n.s., not significant (one-way ANOVA). Representative results of at least three independent experiments (biological replicates) are shown.
Extended Data Figure 9. TORC1 activation by nutrient replenishment decreases the abundance of RACs as well as 26S proteasome.
a and b, Immunoblots (a) and quantification (b) of the indicated proteins in lysates of HeLa cells after replenishment with rich complete medium for the indicated time. c, Native-PAGE (4.2%) of cell extracts from HeLa cells following media replenishment as in (a), revealed with the fluorogenic substrate Suc-LLVY-AMC or by immunoblots. d, Quantification of the 26S proteasome activity (RPCP and RP2CP) of experiments such as the one shown in (c). b and d, Data are means ± SD. n=3 biological replicates. *P≤0.05; **P≤0.01; ***P≤0.001; n.s., not significant (one-way ANOVA). Representative results of at least three independent experiments (biological replicates) are shown.
Extended Data Figure 10. mTORC1 inhibition by Torin-1 and rapamycin acutely induced the RACs.
a and b, Immunoblots (a) and quantification (b) of the indicated proteins in lysates of HeLa cells treated with 250 nM Torin-1 or 200 nM rapamycin for the indicated time. Data are means ± SD. n=3 biological replicates. *P≤0.05; **P≤0.01; ***P≤0.001; n.s., not significant (two-way ANOVA). Representative results of at least three independent experiments (biological replicates) are shown.
Supplementary Information
Supplementary Information contains SI Table 1 and SI Table 2, listing the strains and the plasmids used in this study, respectively, and SI Figure 1 containing full-scan gel images with size indications corresponding to Figures 1a-e, 1g-h, 2c, 2e, 2g, 3a-b, 3e-g, 5a, 5c, 5e, 6a, 6c, 6e-f, 6h, and Extended Data Figures 1a, 2b, 2d, 3a-h, 5a-d, 6a-d, 6g-i, 7a, 7c, 7e, 7g, 7i, 7k, 8a, 8c, 9a, 9c and 10a.
Supplementary Table 1| List of strains used in this study.
Supplementary Table 2| List of plasmids used in this study.
Supplementary Figure 1
Acknowledgements
We thank Y. Lee and M. Hochstrasser for the kind gift of Nas2, Nas6, Hsm3 and Rpn14 antibodies; D. H. Wolf for CPY*-HA and Δss-CPY*-GFP constructs and T. Maeda for the P-Sch9 antibody, members of the Bertolotti lab for discussion. A.B. is an honorary fellow of the Clinical Neurosciences Department of Cambridge University. This work was supported by the Medical Research Council (UK) MC_U105185860. A. R. is supported by an EMBO long-term fellowship.
Footnotes
Author Contributions
A.R. designed, performed and analysed all experiments, prepared the figures and helped with the manuscript. A.B. designed and supervised the study and wrote the manuscript.
Author Information
The authors declare no competing financial interests.
References
- 1.Goldberg AL. Functions of the proteasome: from protein degradation and immune surveillance to cancer therapy. Biochem Soc Trans. 2007;35:12–17. doi: 10.1042/BST0350012. [DOI] [PubMed] [Google Scholar]
- 2.Finley DD. Recognition and processing of ubiquitin-protein conjugates by the proteasome. Annu Rev Biochem. 2009;78:477–513. doi: 10.1146/annurev.biochem.78.081507.101607. [DOI] [PMC free article] [PubMed] [Google Scholar]
- 3.Tanaka K, Mizushima T, Saeki Y. The proteasome: molecular machinery and pathophysiological roles. Biol Chem. 2012;393:217–234. doi: 10.1515/hsz-2011-0285. [DOI] [PubMed] [Google Scholar]
- 4.Tomko RJJ, Hochstrasser M. Molecular Architecture and Assembly of the Eukaryotic Proteasome. Annu Rev Biochem. 2013;82:415–445. doi: 10.1146/annurev-biochem-060410-150257. [DOI] [PMC free article] [PubMed] [Google Scholar]
- 5.Le Tallec B, Barrault MB, Guerois R, Carre T, Peyroche A. Hsm3/S5b participates in the assembly pathway of the 19S regulatory particle of the proteasome. Mol Cell. 2009;33:389–399. doi: 10.1016/j.molcel.2009.01.010. [DOI] [PubMed] [Google Scholar]
- 6.Saeki Y, Toh-e A, Kudo T, Kawamura H, Tanaka K. Multiple proteasome-interacting proteins assist the assembly of the yeast 19S regulatory particle. Cell. 2009;137:900–913. doi: 10.1016/j.cell.2009.05.005. [DOI] [PubMed] [Google Scholar]
- 7.Funakoshi M, Tomko RJ, Kobayashi H, Hochstrasser M. Multiple assembly chaperones govern biogenesis of the proteasome regulatory particle base. Cell. 2009;137:887–899. doi: 10.1016/j.cell.2009.04.061. [DOI] [PMC free article] [PubMed] [Google Scholar]
- 8.Roelofs J, et al. Chaperone-mediated pathway of proteasome regulatory particle assembly. Nature. 2009;459:861–865. doi: 10.1038/nature08063. [DOI] [PMC free article] [PubMed] [Google Scholar]
- 9.Kaneko T, et al. Assembly pathway of the Mammalian proteasome base subcomplex is mediated by multiple specific chaperones. Cell. 2009;137:914–925. doi: 10.1016/j.cell.2009.05.008. [DOI] [PubMed] [Google Scholar]
- 10.Hanssum A, et al. An Inducible Chaperone Adapts Proteasome Assembly to Stress. Molecular Cell. 2014;55:566–577. doi: 10.1016/j.molcel.2014.06.017. [DOI] [PMC free article] [PubMed] [Google Scholar]
- 11.Wiseman RL, Haynes CM, Ron D. SnapShot: The unfolded protein response. Cell. 2010;140:590–590.e2. doi: 10.1016/j.cell.2010.02.006. [DOI] [PubMed] [Google Scholar]
- 12.Venters BJ, et al. A comprehensive genomic binding map of gene and chromatin regulatory proteins in Saccharomyces. Mol Cell. 2011;41:480–492. doi: 10.1016/j.molcel.2011.01.015. [DOI] [PMC free article] [PubMed] [Google Scholar]
- 13.Marion RM, et al. Sfp1 is a stress- and nutrient-sensitive regulator of ribosomal protein gene expression. Proceedings of the National Academy of Sciences. 2004;101:14315–14322. doi: 10.1073/pnas.0405353101. [DOI] [PMC free article] [PubMed] [Google Scholar]
- 14.Jorgensen P, et al. A dynamic transcriptional network communicates growth potential to ribosome synthesis and critical cell size. Genes & Development. 2004;18:2491–2505. doi: 10.1101/gad.1228804. [DOI] [PMC free article] [PubMed] [Google Scholar]
- 15.Lempiäinen H, et al. Sfp1 Interaction with TORC1 and Mrs6 Reveals Feedback Regulation on TOR Signaling. Molecular Cell. 2009;33:704–716. doi: 10.1016/j.molcel.2009.01.034. [DOI] [PubMed] [Google Scholar]
- 16.Takahara T, Maeda T. Transient sequestration of TORC1 into stress granules during heat stress. Mol Cell. 2012;47:242–252. doi: 10.1016/j.molcel.2012.05.019. [DOI] [PubMed] [Google Scholar]
- 17.Soulard A, Hall MN. SnapShot: mTOR Signaling. Cell. 2007;129:434.e1–434.e2. doi: 10.1016/j.cell.2007.04.010. [DOI] [PubMed] [Google Scholar]
- 18.Loewith R, Hall MN. Target of Rapamycin (TOR) in Nutrient Signaling and Growth Control. Genetics. 2011;189:1177–1201. doi: 10.1534/genetics.111.133363. [DOI] [PMC free article] [PubMed] [Google Scholar]
- 19.Zoncu R, Efeyan A, Sabatini DM. mTOR: from growth signal integration to cancer, diabetes and ageing. Nature Reviews Molecular Cell Biology. 2011;12:21–35. doi: 10.1038/nrm3025. [DOI] [PMC free article] [PubMed] [Google Scholar]
- 20.Myriam Bonilla KWC. Mitogen-activated Protein Kinase Stimulation of Ca2+ Signaling Is Required for Survival of Endoplasmic Reticulum Stress in Yeast. Molecular Biology of the Cell. 2003;14:4296. doi: 10.1091/mbc.E03-02-0113. [DOI] [PMC free article] [PubMed] [Google Scholar]
- 21.Krause SA, Gray JV. The protein kinase C pathway is required for viability in quiescence in Saccharomyces cerevisiae. Current Biology. 2002;12:588–593. doi: 10.1016/s0960-9822(02)00760-1. [DOI] [PubMed] [Google Scholar]
- 22.Torres J, Di Como CJ, Herrero E, de la Torre-Ruiz MA. Regulation of the cell integrity pathway by rapamycin-sensitive TOR function in budding yeast. J Biol Chem. 2002;277:43495–43504. doi: 10.1074/jbc.M205408200. [DOI] [PubMed] [Google Scholar]
- 23.Babour A, Bicknell AA, Tourtellotte J, Niwa MA. Surveillance Pathway Monitors the Fitness of the Endoplasmic Reticulum to Control Its Inheritance. Cell. 2010;142:256–269. doi: 10.1016/j.cell.2010.06.006. [DOI] [PMC free article] [PubMed] [Google Scholar]
- 24.Levin DE. Regulation of cell wall biogenesis in Saccharomyces cerevisiae: the cell wall integrity signaling pathway. Genetics. 2011;189:1145–1175. doi: 10.1534/genetics.111.128264. [DOI] [PMC free article] [PubMed] [Google Scholar]
- 25.Hirano Y, et al. A heterodimeric complex that promotes the assembly of mammalian 20S proteasomes. Nature. 2005;437:1381–1385. doi: 10.1038/nature04106. [DOI] [PubMed] [Google Scholar]
- 26.Le Tallec B, et al. 20S proteasome assembly is orchestrated by two distinct pairs of chaperones in yeast and in mammals. Mol Cell. 2007;27:660–674. doi: 10.1016/j.molcel.2007.06.025. [DOI] [PubMed] [Google Scholar]
- 27.Xie Y, Varshavsky A. RPN4 is a ligand, substrate, and transcriptional regulator of the 26S proteasome: a negative feedback circuit. Proc Natl Acad Sci USA. 2001;98:3056–3061. doi: 10.1073/pnas.071022298. [DOI] [PMC free article] [PubMed] [Google Scholar]
- 28.Suraweera A, Münch C, Hanssum A, Bertolotti A. Failure of Amino Acid Homeostasis Causes Cell Death following Proteasome Inhibition. Molecular Cell. 2012;48:242–253. doi: 10.1016/j.molcel.2012.08.003. [DOI] [PMC free article] [PubMed] [Google Scholar]
- 29.Hiller MM, Finger A, Schweiger M, Wolf DH. ER degradation of a misfolded luminal protein by the cytosolic ubiquitin-proteasome pathway. Science. 1996;273:1725–1728. doi: 10.1126/science.273.5282.1725. [DOI] [PubMed] [Google Scholar]
- 30.Medicherla B, Kostova Z, Schaefer A, Wolf DH. A genomic screen identifies Dsk2p and Rad23p as essential components of ER-associated degradation. EMBO reports. 2004;5:692–697. doi: 10.1038/sj.embor.7400164. [DOI] [PMC free article] [PubMed] [Google Scholar]
- 31.Asano S, et al. Proteasomes. A molecular census of 26S proteasomes in intact neurons. Science. 2015;347:439–442. doi: 10.1126/science.1261197. [DOI] [PubMed] [Google Scholar]
- 32.Truman AW, et al. Expressed in the yeast Saccharomyces cerevisiae, human ERK5 is a client of the Hsp90 chaperone that complements loss of the Slt2p (Mpk1p) cell integrity stress-activated protein kinase. Eukaryotic Cell. 2006;5:1914–1924. doi: 10.1128/EC.00263-06. [DOI] [PMC free article] [PubMed] [Google Scholar]
- 33.Zhang Y, et al. Coordinated regulation of protein synthesis and degradation by mTORC1. Nature. 2014;513:440–443. doi: 10.1038/nature13492. [DOI] [PMC free article] [PubMed] [Google Scholar]
- 34.Zhao J, Zhai B, Gygi SP, Goldberg AL. mTOR inhibition activates overall protein degradation by the ubiquitin proteasome system as well as by autophagy. Proceedings of the National Academy of Sciences. 2015;112:15790–15797. doi: 10.1073/pnas.1521919112. [DOI] [PMC free article] [PubMed] [Google Scholar]
- 35.Albert V, Hall MN. mTOR signaling in cellular and organismal energetics. Current Opinion in Cell Biology. 2015;33:55–66. doi: 10.1016/j.ceb.2014.12.001. [DOI] [PubMed] [Google Scholar]
- 36.Gietz RD, Woods RA. Yeast transformation by the LiAc/SS Carrier DNA/PEG method. Yeast Protocol. 2006 [Google Scholar]
- 37.Zhang T, et al. An improved method for whole protein extraction from yeast Saccharomyces cerevisiae. Yeast. 2011;28:795–798. doi: 10.1002/yea.1905. [DOI] [PubMed] [Google Scholar]
- 38.von der Haar T. Optimized protein extraction for quantitative proteomics of yeasts. PLoS ONE. 2007;2:e1078. doi: 10.1371/journal.pone.0001078. [DOI] [PMC free article] [PubMed] [Google Scholar]
- 39.Urban J, et al. Sch9 Is a Major Target of TORC1 in Saccharomyces cerevisiae. Molecular Cell. 2007;26:663–674. doi: 10.1016/j.molcel.2007.04.020. [DOI] [PubMed] [Google Scholar]
- 40.Elsasser S, Schmidt M, Finley DD. Characterization of the proteasome using native gel electrophoresis. Methods Enzymol. 2005;398:353–363. doi: 10.1016/S0076-6879(05)98029-4. [DOI] [PubMed] [Google Scholar]
- 41.Knutson BA, Hahn S. Domains of Tra1 important for activator recruitment and transcription coactivator functions of SAGA and NuA4 complexes. Mol Cell Biol. 2011;31:818–831. doi: 10.1128/MCB.00687-10. [DOI] [PMC free article] [PubMed] [Google Scholar]
Associated Data
This section collects any data citations, data availability statements, or supplementary materials included in this article.


