Abstract
Two-dimensional (2D) crystalline materials possess unique structural, mechanical, and electronic properties1,2, which have rendered them highly attractive in many applications3-5. Although there have been advances in preparing 2D materials that consist of one or few atomic/molecular layers6,7, bottom-up assembly of 2D crystalline materials remains a considerable challenge and an active area of development8-10. Even more challenging is the design of dynamic 2D lattices that can undergo large-scale motions without loss of crystallinity. Dynamicity in porous 3D crystalline solids has been exploited for stimuli-responsive functions and adaptive behavior11-13. As in the case of such 3D materials, integrating flexibility/adaptiveness into crystalline 2D lattices would greatly broaden the functional scope of 2D materials. Here we report the self-assembly of unsupported, 2D protein lattices with precise spatial arrangements and patterns through a readily accessible design strategy. Three single- or double-point mutants of the C4 symmetric protein RhuA were designed to assemble via different modes of intermolecular interactions (single disulfide, double disulfide and metal coordination) into crystalline 2D arrays. Owing to the flexibility of the single disulfide interactions, the lattices of one of the variants (C98RhuA) are essentially defect-free and undergo substantial but fully correlated changes in molecular arrangement, giving coherently dynamic 2D molecular lattices. Notably, C98RhuA lattices possess a Poisson's ratio of −1, the lowest thermodynamically possible value for an isotropic material.
Proteins are attractive building blocks for 2D materials because of their structural/chemical diversity and inherent functions. Examples for natural, protein-based 2D materials include bacterial S-layer proteins and purple-membrane assemblies, which form crystalline arrays in association with cell walls and membranes, respectively, and have been employed in diverse technological applications14,15. On the synthetic front, methods for 2D protein crystallization have been developed for the structural characterization of membrane proteins16,17 or functional applications18, generally relying on lipid layers as supports. Recently, 2D or 3D supramolecular protein arrays have been designed through the symmetric polymerization of protein building blocks via computationally designed protein-protein interactions or fusion of protein components19-22. While elegant, these approaches are engineering-intensive and highly dependent on the accuracy of the design, and the integration of dynamic/adaptive behavior has not been explored.
To address these issues, we used a simple chemical bonding strategy to control protein self-assembly. We reasoned that both cysteine (Cys)-mediated disulfide bonds and metal coordination interactions between protein building blocks could produce crystalline and dynamic arrays with minimal design, because these bonds are: 1) strong but reversible (to minimize the surface area to be designed and ensure self-healing), 2) short yet sufficiently flexible (to simultaneously afford crystallinity and adaptiveness), and 3) chemically tunable (to exert external control over self-assembly and enable stimuli-responsiveness), and 4) easily designed and engineered.
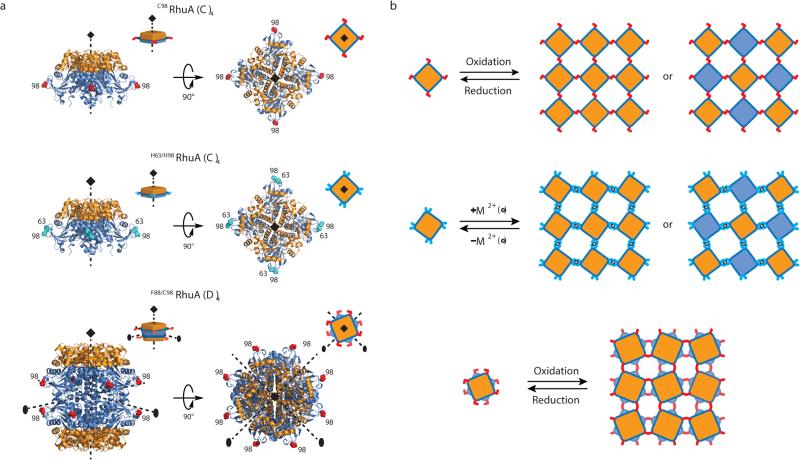
The most straightforward route to obtaining 2D lattices is the tesselation of C3, C4 or C6 symmetric building blocks through appropriately positioned C2 symmetric linkages such as disulfide bonds or many metal coordination interactions. As a model building block, we chose L-rhamnulose-1-phosphate aldolase (RhuA), a C4 symmetric homotetramer (dimensions: 7×7×5 nm) that was previously used as a synthon for supramolecular assemblies23 (Fig. 1a). An inspection of RhuA indicated protrusions in the four corner positions as ideal locations to incorporate single Cys or two histidine (His) residues for disulfide- or metal-directed self-assembly, respectively. We generated two variants, C98RhuA and H63/H98RhuA, with four conditionally self-associating corners for forming square lattices (Fig. 1a, b, top and middle rows). The relative positions of residues 63 and 98 were deemed to be conducive to forming a bis-His metal coordination motif to afford a tetrahedral or square planar coordination geometry for metal-mediated RhuA pairing interactions. Additionally, we noted that RhuA could be converted into a stable D4 symmetric octamer through a single point mutation (A88F)24. Thus, we prepared a third variant, F88/C98RhuA, which presents eight symmetry-related cysteines at roughly 45° angles in a 2D projection (Fig. 1a, bottom row). We envisioned that the C4 symmetric C98RhuA and H63/H98RhuA variants could yield square lattices with two distinct patterns in terms of the orientation of the building blocks with respect to the 2D plane (Fig. 1b). On the other hand, the D4 symmetry of F88/C98 RhuA would dictate a 2D lattice with equivalent faces (Fig. 1b). These RhuA building blocks would also provide three distinct modes of inter-building-block interactions, whose effects on self-assembly we hoped to investigate: single disulfide, double disulfide and bis-His-anchored metal coordination.
Figure 1. RhuA constructs and their disulfide- and metal-mediated self-assembly modes.
a, Cartoon representations of the C98RhuA, H63/H98RhuA and F88/C98RhuA structures. The top and bottom halves of RhuA are differently colored (orange and blue) to highlight the relative molecular orientations in b. Cys and His residues inserted into positions 98 and 63 are shown in red and cyan, respectively. b, Expected 2D molecular arrangements of C98RhuA, H63/H98RhuA and F88/C98RhuA lattices.
For the oxidative self-assembly of C98RhuA and F88/C98RhuA, we tested various strategies including air oxidation, redox buffer systems containing reduced and oxidized glutathione (GSH and GSSG) or low concentrations (≤10 mM) of the reductant β-mercaptoethanol (βME), which slowly decomposes in aqueous solution and results in gradually more oxidizing conditions. In these experiments, solutions of purified C98RhuA and F88/C98RhuA were first rapidly exchanged via repeated centrifugal filtration into solutions that varied in terms of their pH (6 to 8.5), buffering species (sodium phosphate, CHES, MES, MOPS, TRIS; at 5 to 20 mM), different compositions of the redox buffering system (1:19 or 19:1 GSH:GSSG; at 1 mM total concentration) or different concentrations of βME (0-10 mM). After adjustment to the desired final protein concentration (25 – 175 μM), these solutions were monitored for the formation of self-assembled structures by visual inspection for emergence of cloudiness and by transmission electron microscopy (TEM). Likewise, for metal-directed assembly, purified H63/H98RhuA was exchanged into solutions with varying pH's and buffer ions (to modulate metal binding kinetics and thermodynamics), with the exception that these solutions did not contain any reductants. Self-assembly was initiated by addition of 4 – 40 molar equivalents of Zn2+ and Cu2+ (1-10 equiv. per bis-His motif), both of which can accommodate the desired four-coordinate geometries to link H63/H98RhuA building blocks at their corners.
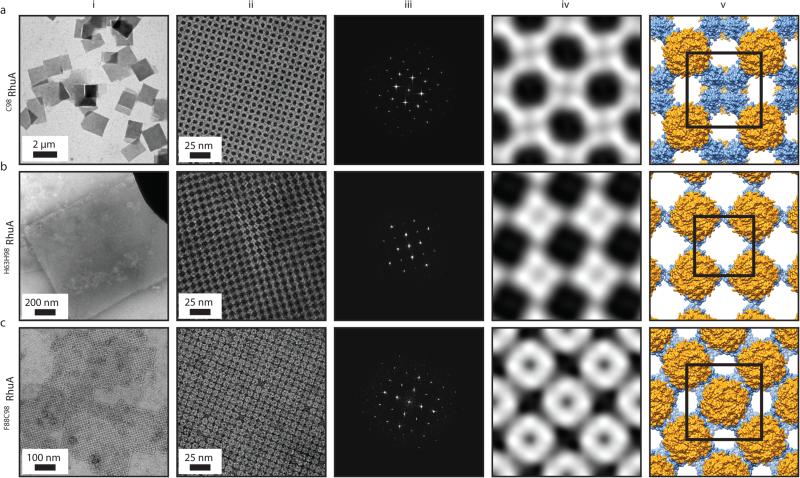
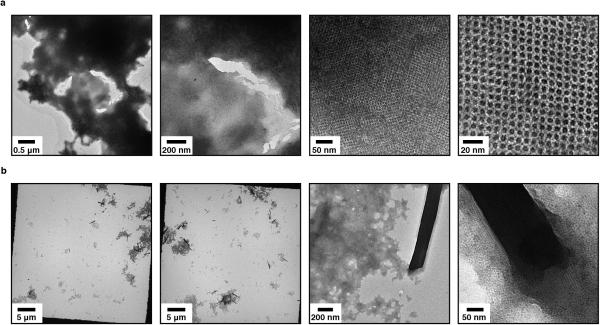
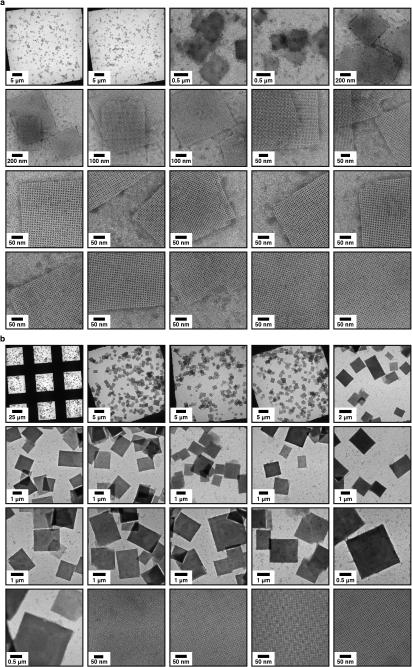
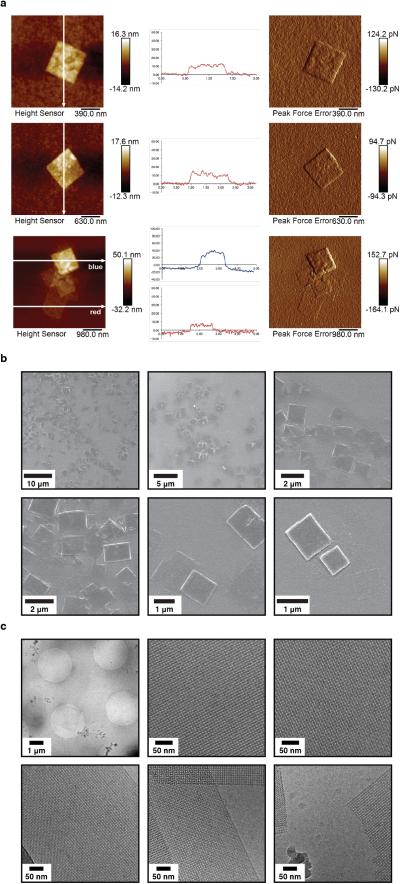
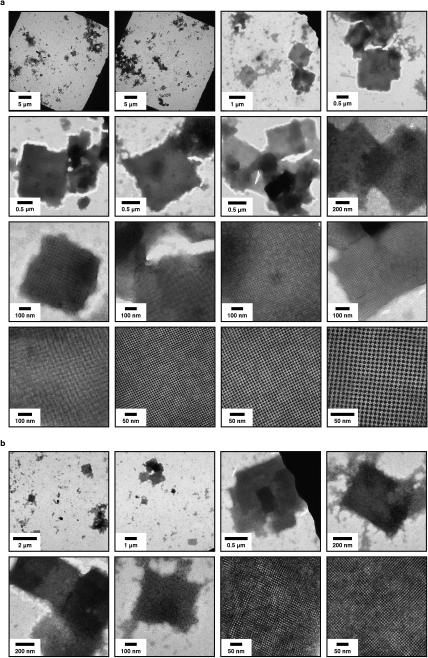
We found that the assembly of all variants into 2D arrays was robust and occurred under a wide range of conditions. As expected, crystalline self-assembly was favored by conditions that promoted slow, controlled oxidation or slow metal-binding kinetics. For example, uncontrolled air oxidation of C98RhuA solutions or addition of large molar excess of Zn2+ and Cu2+ to H63/H98RhuA samples resulted largely in amorphous aggregates in addition to some crystalline domains (Extended Data Fig. 1). The following solution conditions yielded 2D assemblies that were optimized in terms of size, crystallinity, and yield: C98RhuA and F88/C98RhuA (≥125 μM protein, 10 mM βME, pH 7.5, 10 mM TRIS); H63/H98RhuA (25 μM protein, 200 μM ZnCl2, pH 7, 20 mM MOPS). Under these conditions, C98RhuA reproducibly assembled into straight-edged, single- or few-layered 2D crystals that grew to several μm's over several days (Fig. 2a). Negative-stain and cryo-TEM, scanning electron microscopy (SEM) and atomic force microscopy (AFM) measurements revealed that the C98RhuA crystals were highly ordered and possessed uniform square/rectangular shapes with molecularly sharp boundaries (Fig. 2a, Extended Data Figs. 2 and 3); these features have not been previously observed in designed 2D protein crystals19,21. 2D crystals of H63/H98RhuA (Fig. 2b, Extended Data Fig. 4) and F88/C98RhuA (Fig. 2c, Extended Data Fig. 5) were several hundred nm's to 1 μm in size, but typically displayed irregular morphologies. H63/H98RhuA lattices were monocrystalline, but tended to grow in 3D over time, whereas F88/C98RhuA crystals consisted of poly-crystalline domains.
Figure 2.
TEM characterization of the 2D crystals of RhuA variants. a, C98RhuA; b, H63/H98RhuA (Zn2+ coordination); c, F88/C98RhuA. (i) Low-magnification views, (ii) high-magnification views, (iii) Fourier transforms of ii, (iv) reconstructed 2D images, (v) structural models based on the 2D reconstructions. The high-resolution limits in panels iii are ~14 Å. Unit cells are shown as black squares (with corners placed at four-fold symmetry axes); unit cell constants (α=β, γ) are: C98RhuA (114 Å, 90°); H63/H98RhuA (91 Å, 90°); F88/C98RhuA (115 Å, 90°).
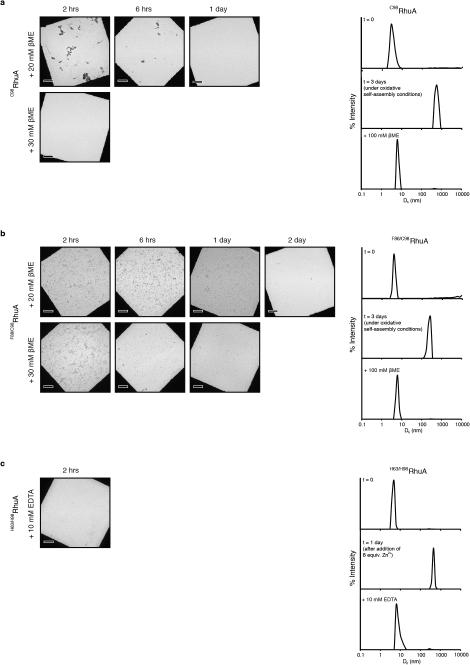
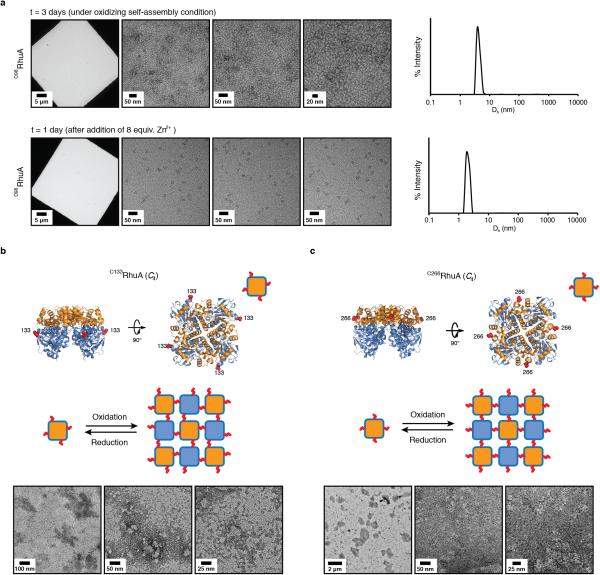
As monitored by TEM and dynamic light scattering (DLS), self-assembly of all variants was reversible, either upon addition of high concentrations of βME (>10 mM) in the case of C98RhuA and F88/C98RhuA crystals or ethylene-diaminetetraacetic acid (EDTA, >10 mM) in the case of H63/H98RhuA (Extended Data Fig. 6). The variant D98RhuA, which bears the native D98 residue and is devoid of corner Cys's or the bis-His motifs, was not competent to self-assemble upon oxidation or metal addition (Extended Data Fig. 7a). These observations confirm the proposed modes of disulfide- or metal-mediated self-assembly. Two additional variants (C133RhuA and C266RhuA) were prepared with surface cysteines located on the sides of the tetramers (Extended Data Figs. 7b, c). Theoretically, these variants could be envisioned to self-associate into close-packed 2D square lattices through disulfide linkages. Instead, they both formed non-crystalline aggregates upon oxidation, which we ascribe to the steric crowding around the C133 and C266 positions that precludes the orientation of RhuA molecules for planar self-assembly. These experiments suggest that the placement of Cys residues at sterically isolated, corner locations is preferable for the formation of 2D crystalline arrays.
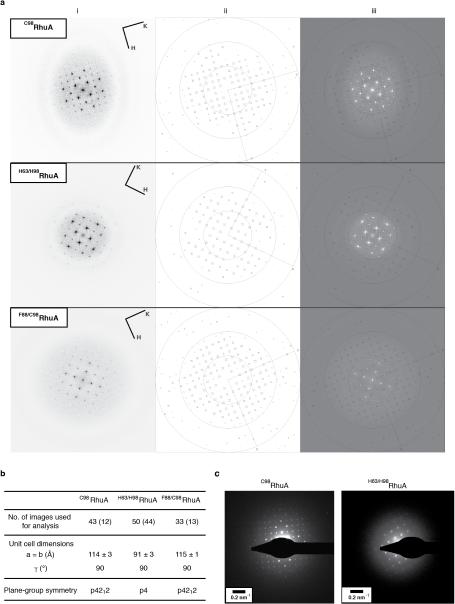
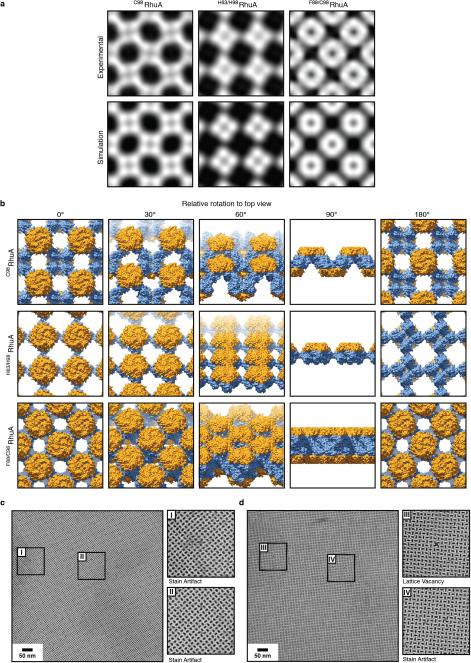
Exhaustive TEM analyses involving many crystals of each variant indicated p4212 plane group symmetry for C98RhuA and F88/C98RhuA, and p4 symmetry for H63/H98RhuA crystals (Fig. 2, Extended Data Figs. 8a, 8b, and Supplementary Table 4). These assignments were corroborated by electron diffraction (ED) data for C98RhuA and H63/H98RhuA crystals (Extended Data Fig. 8c). Experimental 2D EM projection maps agree very well with those calculated from structural models (Extended Data Fig. 9a) and confirm the expected protein-protein interaction geometries: corner-attached C98RhuA and H63/H98RhuA, and side-attached F88/C98RhuA (Fig. 2, columns iv and v). Plane group symmetries suggest that C98RhuA tetramers adopt a checkerboard pattern (p4212 symmetry) whereas H63/H98RhuA tetramers self-assemble in the same orientation with respect to the 2D plane (p4 symmetry). Together with the fact that F88/C98RhuA possesses two-fold symmetry parallel to the 2D plane, we thus obtain three distinct 2D molecular patterns with minimal alteration of a single protein building block (Extended Data Fig. 9b). It is noteworthy that C98RhuA and H63/H98RhuA molecules self-assemble in distinct orientations in the 2D plane, suggesting that the energetic bias stemming from disulfide or metal bonding configurations and surrounding protein-protein interactions must be sufficiently large to favor one orientation over others to yield long-range order.
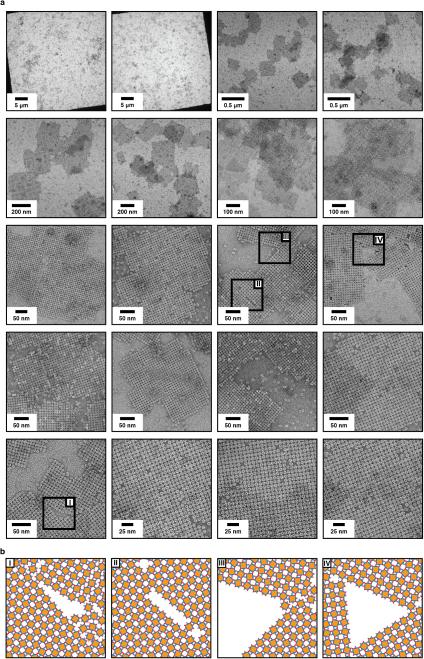
Superior quality and larger sizes of C98RhuA crystals compared to F88/C98RhuA and H63/H98RhuA lattices are readily explained by interactions that direct the self-assembly of the variants. F88/C98RhuA presents a roughly circular distribution of eight cysteines (Fig. 1a, bottom row). This arrangement renders the desired double-disulfide-mediated, side-to-side self-assembly mode non-unique and permits alternate attachment geometries between F88/C98RhuA molecules (Extended Data Fig. 5). Moreover, the increased Cys-valency of F88/C98RhuA leads to considerably stronger interactions and therefore “stiffer” lattices: in fact, the dissolution of F88/C98RhuA polycrystallites requires significantly higher amounts of βME and longer incubation periods compared to C98RhuA lattices (Extended Data Fig. 6). Consequently, F88/C98RhuA lattices display vacancies as well as both high- (>30°) and low-angle (<10°) grain boundaries (Extended Data Fig. 5). H63/H98RhuA crystals possess fewer such defects owing to the reversibility of Zn2+-coordination interactions. Yet, each H63/H98RhuA building block also contains numerous surface residues that can weakly coordinate Zn2+ ions, promoting crystal growth in the third dimension (Extended Data Fig. 4a).
In contrast to F88/C98RhuA and H63/H98RhuA, self-assembly of C98RhuA is both chemically and orientationally specific. Moreover, the reversibility and inherent flexibility of single Cys-Cys linkages–containing five rotatable bonds–likely allows for the correction of any defects such as vacancies and grain boundaries, which would be difficult to accomplish in a rigid lattice composed of strongly interacting building blocks such as F88/C98RhuA. Indeed, as TEM images of mono-layered C98RhuA crystals illustrate, the outcomes are a) macroscopic crystal morphologies that reflect the molecular symmetry of the building blocks, b) molecularly sharp crystal boundaries, and c) lattices with extremely low defect frequencies. In hundreds of monocrystalline C98RhuA lattices with surface areas >1 μm2 that we examined closely, we rarely found a lattice defect, despite the fact that these crystals grow in 3D space in an unsupported fashion. Even in a rare instance such as that shown in Extended Data Fig. 9c, the defect frequency still was one missing C98RhuA molecule within a lattice grid of ~9000 molecules (~0.6 μm2).
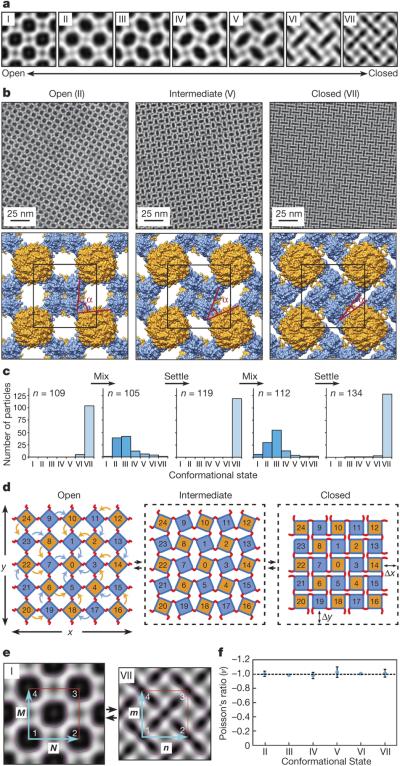
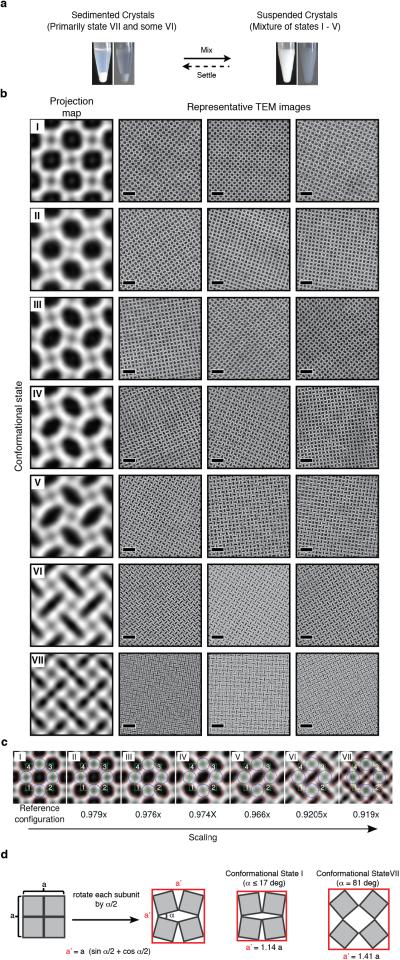
A more striking consequence of the disulfide bond flexibility is the coherent dynamicity of C98RhuA crystals. While our initial sample preparations of C98RhuA crystals predominantly yielded open lattices with large pores (Fig. 2a), we noticed that these crystal suspensions developed a dense sediment over a period of 1-3 days at 4 °C (Extended Data Fig. 10a). TEM analysis of these sedimented crystals indicated a close-packed lattice arrangement (Fig. 3a and 3b, right panels). Upon resuspension of the sedimented crystals by repeated gentle mixing with a pipette and subsequent TEM imaging of the resulting samples, we captured a total of at least seven types of 2D C98RhuA crystals in distinct conformational states (I through VII) (Fig. 3a, Extended Data Fig. 10b). These conformational states were categorized by computational image analysis according to the roundness indices of the lattice pores, ranging from ≥0.85 for State I to ≤0.35 for State VII (see Methods). As evidenced by the retention of p4212 symmetry and nearly equal unit cell dimensions, these seven conformational states are clearly interconnected and implicate a continuous lattice motion between fully open and fully closed states (Supplementary Data Video1). These large amplitude motions of the C98RhuA lattices are afforded by a remarkable extent of hinging about the flexible disulfide linkages and their placement at corner locations of RhuA molecules. The transition from the open to the closed state is accompanied by the compression of the inter- C98RhuA hinge angle (α) from >80° to 17°, decrease of the pore size from ~4.4 nm to ~1.0 nm (for the passage of a spherical object), and increase in the relative protein/hole surface density of 170% (Fig. 3b, Table 1).
Figure 3. Dynamic and auxetic nature of 2D C98RhuA crystals.
a, Reconstructed 2D images of seven (I-VII) distinct conformational states of 2D C98RhuA crystals. b, High-magnification views and derived structural models of conformations II, V and VII. Unit cells and hinge angles (α) between C98RhuA units are highlighted in black and red, respectively. c, Population distributions of C98RhuA crystals in different conformational states during repeated resuspension/sedimentation cycles. n refers to the total number of individual lattices analyzed in each panel. d, Schematic representation of the rotating, rigid square model that describes the 2D C98RhuA lattice dynamics. ΔX and ΔY denote changes in transverse and longitudinal dimension lengths upon lattice opening and closing. e, Digital image correlation analysis of reconstructed TEM images of C98RhuA crystals for determining auxetic behaviour. Representative volume elements in the lattices of the two extreme states (I and VII) are indicated with red squares and the vectors M, N (in state I) and m, n (in state VII) to calculate local engineering strains are shown with cyan arrows. f, Calculated Poisson's ratios of lattice conformational states with respect to state I.
Table 1.
Structural parameters for conformations II, V and VII of C98RhuA crystals derived from images shown in Fig. 3.
| State II | State V | State VII | |
|---|---|---|---|
| Unit cell (a=b, γ) | 114.4 Å, 90° | 110 Å, 90° | 107.8 Å, 90° |
| Plane-group symmetry | p4212 | p4212 | p4212 |
| Intertetramer hinge angle, α | 79° | 49° | 17° |
| Protein surface area per unit cell, Aprotein | 82.7 nm2 | 86.2 nm2 | 88.0 nm2 |
| Pore surface area per unit cell, Apore | 44.7 nm2 | 34.7 nm2 | 28.2 nm2 |
| Relative protein/pore density, Aprotein/Apore | 1.9 | 2.5 | 3.1 |
Conformational dynamics of C98RhuA crystals are fully coherent: in each crystal examined, only one type of conformational state (I-VII) was observed throughout the lattice (Fig. 3b). This observation implies that any mechanical deformation of a C98RhuA crystal is cooperatively propagated along the 2D plane, enabled by both the flexibility and short linker-length of single disulfide linkages: longer, more flexible linkages would preclude coherent dynamics, whereas inflexible linkages would lead to non-adaptive lattices. Indeed, F88/C98RhuA and H63/H98RhuA lattices do not display any apparent dynamic behaviour because their double-disulfide- or metal-mediated modes of assembly do not allow rotation of the neighboring protein molecules with respect to one another.
To establish that the conformational dynamics of C98RhuA crystals are reversible, we subjected them to repeated sedimentation/resuspension cycles within the solutions in which they self-assembled at 4 °C. In each cycle, we obtained TEM images of >100 individual crystals from the same container, collected either a) from the sediments that formed overnight, or b) from the suspensions immediately after mixing the sediments by repeated pipetting. As shown in Fig. 3c, the conversion between the closed states (VI and VII) and open/intermediate states (I-V) is completely reversible and absolute. Sedimented samples do not contain any open/intermediate states and resuspended samples do not contain any closed states, providing unambiguous evidence that C98RhuA lattices are reversibly dynamic. Based on the observed distribution profiles, the opening of the lattices by mechanical agitation and their distribution among conformational states I-V appear to be immediate (at least within the ~ 5-min time scale of TEM sample preparation), whereas their full closure takes several hours. We posit that the energetic barriers between different C98RhuA lattice conformations (due to different disulfide bond configurations and long-range protein-protein interactions) must be small enough to be overcome by mechanical agitation and internal protein dynamics. The fully closed conformation (state VII) appears to be a kinetically stable conformation that accumulates over time in unagitated solutions at 4 °C. This kinetic stability may be ascribed to the dense protein packing interactions in state VII and the resulting restriction of the dynamics of both the lattice and the individual building blocks.
Geometric considerations based on the retention of p4212 symmetry (Figs. 3b, d) as well as a strain analysis of the seven conformational states by digital image correlation (Fig. 3e, Extended Data Fig. 10c) indicate that C98RhuA crystals are auxetic and possess a Poisson's ratio of −1.00±0.01 (Fig. 3f). Poisson's ratio (v) is a scale-independent metric that describes the response of a material to strain; it is defined as the ratio between transverse (ex) and longitudinal strains (ey) under uniaxial loading25. ex and ey are, in turn, approximated by changes in material length in transverse (ΔX) and longitudinal (ΔY) directions (Fig. 3d)25:
where −1≤v≤0.5 for an isotropic 3D material and −1≤v≤ 1 for an isotropic 2D material26. Most materials possess positive v's, i.e., they become thinner in the longitudinal direction when stretched transversely25. Materials with negative v's (i.e., auxetic materials), in contrast, display the counterintuitive behavior of longitudinal expansion upon transverse stretching. Thus, auxetic materials can be expected to possess enhanced toughness, resistance to indentation and shear stiffness as well as favorable damping and acoustic response, and have been proposed for use in protective armors, smart textiles, actuated filtration, piezoelectric and biomedical devices25,27-29. Although materials with negative v's exist, most fall in the range of −0.4<v<0, with lowest reported values of −0.7 to −0.8 observed in reentrant foams30,31. Grima et al. postulated that for a 2D lattice of rotating rigid squares with flexible hinges, v should be equal to the lowest thermodynamically permissible value of −1 at all rotation angles26. C98RhuA lattices represent a true realization of this theoretical model and represent the first isotropic material with v = −1 designed and constructed at the molecular scale. Assuming Grima's model, we calculate that C98RhuA crystals should shrink or expand simultaneously in x and y dimensions by at least 24% during the conversion between fully open (state I) and fully closed states (state VII) (Extended Data Fig. 10d).
We envision that upon hierarchical assembly through physical methods or incorporation into polymeric materials through chemical strategies, molecular architectures like 2D C98RhuA lattices may be used as feedstocks for adaptive and auxetic macroscopic materials. In general, our study underscores the utility of dynamic covalent bonds in the construction of highly ordered yet adaptive protein materials. Specifically, due to their high structural quality and chemically tunable assembly under ambient conditions, C98RhuA crystals provide a unique medium for studying molecular self-assembly and crystallization as well as for investigating the energy landscape of lattice dynamics. The resulting understanding of structural dynamics at the nanoscale should greatly aid the fabrication of functional materials.
METHODS
Design of RhuA variants and site-directed mutagenesis
RhuA variants were designed as described in main text based on previously reported crystal structures (PDB ID: 1GT723 for C98RhuA, H63/H98RhuA, D98RhuA, C133RhuA, and C266RhuA and PDB ID: 2UYU24 for F88/C98RhuA. All RhuA variants also contain the mutations E192A and C126S as previously reported23,24. The gene for C98RhuA, pre-inserted into the pJ414 expression vector optimized for expression in E. coli, was purchased from DNA2.0. F88/C98RhuA, H63/H98RhuA, D98RhuA, C133RhuA, and C266RhuA were prepared using QuikChange mutagenesis (Stratagene) with primers obtained from Integrated DNA Technologies (Supplementary Table 1). The mutant plasmids were transformed into XL-1 Blue E. coli cells followed by purification using the QIAprep Spin Miniprep kit (Qiagen). The presence of the mutations was verified by sequencing (Retrogen). Amino acid sequences of RhuA variants are shown in Supplementary Table 2.
Protein expression and purification
Bacterial expression of RhuA variants was performed according to previously published procedures with slight modifications32. Plasmids bearing the variants were transformed into BL21(DE3) E. coli cells, and the colonies were grown overnight at 37 °C on lysogeny broth (LB) agar plates (pH 7.4) containing 100 mg/L ampicillin. Starter cultures (5 mL with 100 mg/L ampicillin) from single colonies were grown for ~4-6 h at 37 °C (with shaking at 250 rpm) before inoculation into 1-L LB cultures containing 100 mg/L ampicillin. After the cells were grown to an optical density of ~0.8 at 600 nm, protein expression was induced with 1 mM isopropyl β-D-1-thiogalactopyranoside (IPTG, Gold Biotechnology) for 12 – 13 h (at 37 °C with shaking at 250 rpm). Cells were pelleted by centrifugation (5,000 rpm at 4 °C for 10 min), and resuspended in a buffer solution containing 10 mM Tris(hydroxymethyl)aminomethane hydrochloride (TRIS) (pH 7.5), 1 mM ZnCl2, and 10 mM β-mercaptoethanol (βME). For H63/H98RhuA preparations, ZnCl2 was excluded from buffer solutions to avoid possible protein precipitation during purification. Cell lysis was performed by sonication for 15 min on ice. The lysis solution was centrifuged for 30 min at 12,000 rpm at 4 °C. Polymin-P (Acros) was added to the supernatant at a final concentration of 0.15% (w/v) for nucleic acid precipitation and the resulting mixture was stirred for 30 min prior to centrifugation for 30 min at 12,000 rpm at 4 °C. The supernatant was loaded onto a DEAE-Sepharose CL-6B (GE Healthcare) column and eluted using a gradient of 0 – 500 mM NaCl in Tris buffer at 4 °C. Fractions containing RhuA which eluted at ~200 mM NaCl were added 1.7 M ammonium sulfate, and were centrifuged for 45 min at 12,000 rpm at 4 °C. The precipitate was dissolved in a buffer solution containing 5 mM sodium phosphate (NaPi) (pH 7.2), 1 mM ZnCl2, and 10 mM βME, and then dialyzed three times against 5 L of the same buffer solution. Further purification was done using either a High Q cartridge column (BioRad) (at pH 8.0) using a 0-500 mM NaCl gradient or a Mini CHT Type I hydroxyapatite column (BioRad) (at pH 7.2) using a 5-500 mM NaPi gradient on a DuoFlow fast protein chromatography workstation (Bio-Rad). Pure protein fractions eluted at 350 mM NaCl and 200 mM NaPi, respectively. These fractions were combined, dialyzed three times against a buffer solution of 10 mM TRIS (pH 7.5), 1 mM ZnCl2, and 10 mM β-mercaptoethanol (βME), and concentrated in an Amicon stirred cell at 4 °C. The protein was then flash frozen and kept at −80 °C until use. Protein purity was confirmed by SDS PAGE (Supplementary Figure 1) and ESI-MS (Supplementary Figure 2 and Supplementary Table 3), and stock concentrations were determined as previously reported33.
Preparation of 2D RhuA crystals
All 2D RhuA crystals reported herein were obtained in an unsupported fashion in solutions. As described in the Main Text, several solution conditions were screened for optimizing the formation of 2D protein crystals of C98RhuA, F88/C98RhuA and H63/H98RhuA variants. For all variants, these screening conditions included various pH's (6 to 8), starting protein concentrations (25 to 175 μM), buffer salt concentration and identity (5 – 20 mM bis-TRIS, CHES, MES, MOPS, NaPi, and TRIS), and temperature (4 – 37 °C). For the disulfide-mediated self-assembly of C98RhuA and F88/C98RhuA, we additionally screened various oxidizing conditions (1 – 2 mM total GSH/GSSG at ratios varying from 1:19 to 19:1, or 5 – 10 mM βME, which slowly decomposed in aqueous solution in the presence of metal ions). For the metal-mediated assembly of H63/H98RhuA, we screened 4 – 20 molar equivalents (over tetrameric protein concentration) of ZnCl2 and CuCl2. As stated in the Main Text, the best conditions were: C98RhuA and F88/C98RhuA (≥125 μM protein, 10 mM βME, pH 7.5, 10 mM TRIS); H63/H98RhuA (25 μM protein, 200 μM ZnCl2, pH 7, 20 mM MOPS) at 4 °C. In general, the formation of crystals was either immediate (upon metal addition for H63/H98RhuA) or lasted overnight to several days (for C98RhuA and F88/C98RhuA). Crystal formation resulted in increasing cloudiness of the self-assembly solutions. The growth of C98RhuA crystals could be accelerated by gentle shaking (Extended Data Fig. 2a, b). In additional experiments, we have tested the thermo- and chemo-stability of C98RhuA crystals as shown in Supplementary Figure 3.
Electron microscopy
For negative-stain TEM sample preparation, 3 – 3.5 μL aliquots of crystal suspensions were applied onto negatively glow-discharged carbon-coated Cu grids (Ted Pella, Inc.), washed with Milli-Q water, and stained with 1% uranyl acetate at 4 °C. For cryo-EM sample preparation, 3 – 3.5 μl aliquots of 25 μM C98RhuA sample (diluted sample) were deposited onto negatively glow-discharged Quantifoil grids, and then plunged into liquid ethane after blotting. The sample was then stored under liquid nitrogen until analysis. Sample screening was performed in an FEI Sphera transmission electron microscope equipped with a LaB6 electron gun at 200 keV and imaged on Gatan 2K2 CCD. A complete electron crystallographic analysis was done on 43, 50 and 33 micrographs for C98RhuA, H63/H98RhuA and F88/C98RhuA, respectively, which were selected by visual assessment. Micrographs were each processed separately using the 2dx software33, which implements a semi-automatic processing pipeline mostly based on programs from the MRC suite34. The program allows one to determine the 2D plane group lattice symmetry of each crystal, to calculate its unit cell dimensions and to generate a projection density map. The processing involves estimation of the Contrast Transfer Function (CTF) by CTFFIND335, spot-list determination, automatic lattice determination, crystal masking, unbending and generation of projection map after CTF correction. Within this program, the symmetry plane group is determined using ALLSPACE36 by comparing the internal phase residual for each symmetry to its expected value. Lattice unit cell dimensions were determined on a subset of images, screened by the quality of the reflections, of 12, 44 and 13 for C98RhuA, H63/H98RhuA and F88/C98RhuA, respectively. The estimated resolution limit of each image (between 15 and 30 Å) was assessed both by visual inspection of its computed Fourier transform and by comparison with simulated images filtered at different levels of resolution.
AFM measurements
For AFM sample preparation, 2 μL of crystal suspensions were applied on freshly cleaved mica, washed with deionized water and dried. AFM images were collected using a Dimension Icon microscope (Bruker, USA) using Scan Asyst peak force tapping (in air) mode at a resolution of 512 lines per image and a scan rate of 0.3 – 0.5 Hz. AFM images obtained were processed using Nanoscope Analysis (Bruker, USA).
SEM measurements
For SEM sample preparation, 2 μL of crystal suspensions were applied onto SiO2 substrates. Sample was sputter-coated with iridium oxide before analysis to reduce charging effects. SEM micrographs were collected on an FEIXL 30UHR scanning electron microscope operated at 5 keV.
DLS measurements
DLS experiments were performed using Wyatt DynaPro NanoStar instrument. The experiment runs were performed to collect 10 acquisitions with 657 nm excitation at a power setting of 100%. Measurements were plotted using a Rayleigh sphere model. Peak radius cutoffs were fixed according to default settings (0.5 – 10000 nm).
Structural modelling and simulations
Projected electron density maps were used as a reference in the visualization software UCSF Chimera37 to determine the orientation of the RhuA molecules in each crystal. The atomic coordinates were extracted from the PDB entries 1GT7 (C4-symmetric tetramer for C98RhuA and H63/H98RhuA) and 2UYU (D4-symmetric octamer for F88/C98RhuA) and placed manually to fit the position of one subunit in the observed projected density map. The orientation of the molecule was refined in an iterative manner by comparing the experimental density with the density simulated from a model of the unit cell, obtained as explained below. Simulated projected electron density maps were computed using Bsoft (http://lsbr.niams.nih.gov/bsoft)38 and EMAN2 (http://blake.bcm.edu/emanwiki/EMAN2)39. Starting from the estimated position and orientation of a single subunit, multiple copies of the model were generated to cover one unit cell (bmoledit in Bsoft) and converted to electron density (e2pdb2mrc.py in EMAN2) with a resolution limit of 30 Å. Finally, the density volume was projected along the vertical direction (bproject in Bsoft) to generate a 2D density map comparable to the experimental map.
Classification of the conformational states of 2D C98RhuA crystals
TEM micrographs of C98RhuA crystals were analyzed computationally to categorize different conformational states of the 2D lattice. Essentially, for each raw image we determined a roundness index number derived from the shape of the pores in the lattice, and used this value to classify the images. The analysis was performed on 982 images using an ad hoc algorithm coded as a macro in Fiji (http://fiji.sc/Fiji)40 and ImageJ (http://imagej.nih.gov/ij)41. Each image was initially processed by applying a 3×3 mean filter applied three times and then converted to a binary image after automatic thresholding to segment out the pores. The mask was then filtered using the opening morphological operator to smooth the shape of the pores and to remove small outliers. Pores that were distorted from potential bending of the crystal in some regions of the field of view were discarded using their size for screening. For images acquired at nominal magnifications of ×50,000 and ×68,000 (calibrated pixel size = 2.033 Å and 1.646 Å, respectively), only pores with areas that covered 500–1200 pixels were kept. The remaining pores were modeled as ellipses and their roundness index was determined as the ratio between the lengths of the major and the minor elliptical axes. A single index value was assigned to each micrograph as the average from all the segmented pores. The images were assigned to one of the seven identified states using the following criterion: State I: >0.85; State II: >0.75 – 0.85; State III: >0.65 – 0.75; State IV: >0.55 – 0.65; State V: >0.35 – 0.45; State VI: >0.35 – 0.45; State VII <0.35.
Generation of video simulating the lattice motions
A video (Supplementary Video 1) to illustrate the dynamics of 2D C98RhuA crystals was generated starting from the TEM snapshots of the seven conformational states (I-VII) (Fig. 3a). All projected density images were rescaled to include the same field of view (bint and bimg from Bsoft). Twenty four intermediate image frames were created between each pair in the sequence by pseudo-morphing, using the program convert from the software suite ImageMagick®. Finally, the video was generated with ffmpeg (http://www.ffmpeg.org) by combining the images as frames.
Digital Image Correlation for Poisson's value determination
Using Matlab, we performed digital image processing of the reconstructed 2D TEM images of dynamic C98RhuA crystals for evaluating Poisson's ratios. As a first step, histogram normalization was performed taking as a reference the image of conformational state I in order to normalize the intensity of the images (Extended Data Fig. 10c). This normalization guarantees that the thresholds used for pixel selection have the same meaning through all the images. After normalizing, we proceeded to select the representative volume element (RVE) in each one of the images. The RVE considered has a rectangular section whose vertices correspond to the centroid of the lattice pores (shown as green rectangles in Extended Data Fig. 10c and red rectangles in Fig. 3e). To find the position of the centroids, we determined the edges of the pores using the Sobel edge detection method. The edges of the pores are shown as purple lines in Extended Data Fig. 10c and Fig. 3e. Then, centroid calculation was performed by taking the mean of the coordinates in x and y for each pixel in the border. After the selection of the RVE, the size of the RhuA building blocks was measured on each image by defining the circle that is circumscribed to each square (shown as blue circles in Extended Data Fig. 10c). Since the square shape of the RhuA building blocks can be assumed to remain rigid in each conformational state, it was determined that the images were at slightly different scales; thus, appropriate magnification factors were calculated taking as a reference the image corresponding to conformational state I. The applied scaling factors are shown in Extended Data Fig. 10c. We then calculated the position of the vertices of the RVE on each conformational state and proceeded with the calculation of the Poisson's ratio. For each RVE, local values of engineering strains ex and ey can be calculated from the vectors M, N and m, n that span the RVE on its reference (state I) and deformed configurations (states II-VII), respectively (see Fig. 3e):
and considering that the deformed and undeformed configurations can be related through the deformation gradient F:
where
Then, homogenized values of the engineering strains for the RVE can be calculated as:
Finally, the Poisson's ratio is calculated as:
Extended Data
Extended Data Figure 1. TEM characterization of C98RhuA and H63/H98RhuA self-assembly under non-optimal conditions.
a, 25 μM C98RhuA was incubated at 4 °C under air exposure for 1 day; the solution contained 20 mM TRIS (pH 8) and no reductants/oxidants. b, 25 μM H63/H98RhuA was incubated in the presence of 1 mM ZnCl2 at 4 °C for 1 day; the solution contained 20 mM MOPS (pH 7).
Extended Data Figure 2. TEM characterization of optimized 2D C98RhuA crystals.
a, 125 μM C98RhuA was incubated in the presence of 10 mM βME at 4 °C in a standing solution for 3 days. b, 125 μM C98RhuA was incubated in the presence of 10 mM βME at 4 °C with gentle shaking for 3 days, followed by 2 days at rest, during which a dense precipitate of crystals formed.
Extended Data Figure 3. Additional structural characterization of 2D C98RhuA crystals.
a, AFM. b, SEM. c, Cryo-TEM.
Extended Data Figure 4. TEM characterization of 2D H63/H98RhuA crystals.
a, 25 μM H63H98RhuA was incubated with 200 μM ZnCl2 or b, CuCl2 in a 20 mM MOPS buffer solution (pH 7.0) at 4 °C for 1 day.
Extended Data Figure 5. TEM characterization of 2D F88/C98RhuA crystals.
a, 125 μM F88/C98RhuA was incubated in the presence of 10 mM βME at 4 °C with gentle shaking for 2 days. b, Cartoon representations of various types of defects observed in F88/C98RhuA crystals, corresponding to boxed areas (I – IV) in Panel a.
Extended Data Figure 6. Reversibility of oxidative or metal-mediated self-assembly of RhuA variants.
a, C98RhuA and b, F88/C98RhuA crystals. (left panels) The crystals were incubated in the presence of 20 or 30 mM βME and imaged by TEM at indicated times after addition of βME. (right panels) 125 μM C98RhuA or F88/C98RhuA were incubated under oxidative self-assembly conditions (in the presence of 10 mM βME at 4 °C with gentle shaking) and self-assembly was monitored by DLS at t = 0 (top), t = 3 days (center), and upon addition of 100 mM βME after self-assembly (bottom). c, (left panel) H63/H98RhuA crystals were incubated in the presence of 10 mM EDTA and imaged by TEM at 2 h after addition of EDTA. (right panels) 25 μM H63/H98RhuA was incubated under metal-mediated self-assembly conditions (in the presence of 200 μM ZnCl2 at 4 °C) and self-assembly was monitored by DLS at t = 0 (top), t = 3 days (center) and upon addition of 10 mM EDTA (bottom). Scale bars are 5 μm in all panels.
Extended Data Figure 7. Characterization of the self-assembly of D98RhuA, C133RhuA and C266RhuA variants by TEM and DLS.
a, TEM (right panels) and DLS (left panels) characterization of D98RhuA self-assembly under oxidative or metal-mediated self-assembly conditions that were optimized for C98RhuA; see Main Text or captions for Extended Figs. 2 and 4 for details. b, Possible mode of disulfide-mediated self-assembly ofC133RhuA (top panels) and TEM characterization of the self-assembly products obtained under conditions that were optimized for C98RhuA (bottom panels). c, Possible mode of disulfide-mediated self-assembly of c133RhuA (top panels) and TEM characterization of the self-assembly products obtained under conditions that were optimized for C98RhuA (bottom panels). No crystalline assemblies were detected under these conditions for any of these three variants (or other conditions that were used for screening C98RhuA self-assembly).
Extended Data Figure 8. Crystallographic analysis of the 2D lattices of RhuA variants.
a, (i) Representative Fourier transforms calculated from the full field of view of crystal images, displayed up to 10 Å. The reflections are consistent with the plane group symmetries estimated from the analysis of the phase residuals (see Supplementary Data Table 4). (ii) IQ-plot calculated from spectrum at left. Size of boxes around reflections reflects their IQ value, defined as ratio of the reflection peak amplitude and the amplitude of the background signal around each peak (R. Henderson et al., Ultramicroscopy 19, 147-178 (1998)). The most significant reflections are labeled with their IQ values, 1–4. Rings are displayed at resolutions of 30, 15 and 10 Å. (iii) Overlap of FFT and IQ-plots. b, Crystallographic data for the 2D lattices of RhuA variants. Reported are the numbers of TEM images used for the analysis of plane group symmetry. The numbers in parentheses are the number of images used for determining the statistics for the unit cell dimensions of each lattice. The plane group symmetry was determined by consensus from all of the images available. c, Electron diffraction patterns of C98RhuA and H63/H98RhuA lattices.
Extended Data Figure 9. 2D TEM reconstruction and structural modeling of the 2D lattices of RhuA variants.
a, Comparison of the observed and simulated projection maps of the 2D lattices of RhuA variants. b, Molecular arrangements in C98RhuA, H63/H98RhuA and F88/C98RhuA lattices viewed from different angles. c, Representative images 2D C98RhuA crystals containing no defects. d, Representative images 2D C98RhuA crystals containing a single lattice vacancy. The stain artifact images are shown to highlight areas that may appear to contain lattice vacancies in low-magnification views but in actuality do not.
Extended Data Figure 10. Conformational analysis of C98RhuA lattices.
a, Photographs of sedimented and resuspended C98RhuA crystals (alternative views with different backgrounds are shown for clarity). b, Representative TEM images for different conformational states (I – VII) of C98RhuA crystals shown in Fig. 3. Scale bars are 25 nm in all panels. c, Digital image processing of reconstructed images of each conformational state. Red lines represent the border of the pores in the lattice structure. Selected RVEs are shown with green lines. Blue lines show the circles circumscribed to the square RhuA building block. Values of scaling between TEM images (with conformational state I as reference) are shown below each image. d, Changes in the dimensions of a C98RhuA lattice of arbitrary size assuming a rotating-rigid-squares model.
Supplementary Material
Acknowledgements
We thank M. Sailor, H. Gray, R. Alberstein and F. Paesani for helpful discussions, N. Olson and J. Bouwer for assistance with TEM measurements and N. Gianneschi for the use of AFM and DLS instrumentation. This work was supported by the US Department of Energy (DOE) (Division of Materials Sciences, Office of Basic Energy Sciences, Award DE-FG02-10ER46677 to F.A.T.). Y.S. was partially supported (for EM measurements) by a grant from the Air Force Office of Scientific Research (AFOSR, BRI FA9550-12-1-0414). The EM facilities used in this work are supported by funding to T.S.B. from the NIH (1S10 RR-020016 and GM-033050), the Agouron Foundation and UCSD.
Footnotes
Author Contributions. Y.S. and F.A.T. conceived the work and designed the experiments. Y.S. carried out all experimental work and EM measurements. G.C. and Y.S. performed and T.S.B. oversaw EM data analysis. D.R. and P.D.Z. performed digital image correlation analysis. F.A.T. and Y.S. wrote the manuscript with contributions from G. C., T.S.B., D.R. and P.D.Z.
Author Information. F.A.T. and Y.S. are inventors on two provisional patent applications based on the described work.
References
- 1.Mas-Balleste R, Gomez-Navarro C, Gomez-Herrero J, Zamora F. 2D materials: to graphene and beyond. Nanoscale. 2011;3:20–30. doi: 10.1039/c0nr00323a. [DOI] [PubMed] [Google Scholar]
- 2.Butler SZ, et al. Progress, challenges, and opportunities in two-dimensional materials beyond graphene. ACS Nano. 2013;7:2898–2926. doi: 10.1021/nn400280c. [DOI] [PubMed] [Google Scholar]
- 3.Schedin F, et al. Detection of individual gas molecules adsorbed on graphene. Nat. Mater. 2007;6:652–655. doi: 10.1038/nmat1967. [DOI] [PubMed] [Google Scholar]
- 4.Lu C-H, Yang H-H, Zhu C-L, Chen X, Chen G-N. A Graphene Platform for Sensing Biomolecules. Angew. Chem. Int. Ed. Engl. 2009;121:4879–4881. doi: 10.1002/anie.200901479. [DOI] [PubMed] [Google Scholar]
- 5.Joshi RK, et al. Precise and Ultrafast Molecular Sieving Through Graphene Oxide Membranes. Science. 2014;343:752–754. doi: 10.1126/science.1245711. [DOI] [PubMed] [Google Scholar]
- 6.Nicolosi V, Chhowalla M, Kanatzidis MG, Strano MS, Coleman JN. Liquid exfoliation of layered materials. Science. 2013;340:1226419. [Google Scholar]
- 7.Li D, Muller MB, Gilje S, Kaner RB, Wallace GG. Processable aqueous dispersions of graphene nanosheets. Nat. Nano. 2008;3:101–105. doi: 10.1038/nnano.2007.451. [DOI] [PubMed] [Google Scholar]
- 8.Colson JW, et al. Oriented 2D covalent organic framework thin films on single-layer graphene. Science. 2011;332:228–231. doi: 10.1126/science.1202747. [DOI] [PubMed] [Google Scholar]
- 9.Kissel P, Murray DJ, Wulftange WJ, Catalano VJ, King BT. A nanoporous two-dimensional polymer by single-crystal-to-single-crystal photopolymerization. Nat. Chem. 2014;6:774–778. doi: 10.1038/nchem.2008. [DOI] [PubMed] [Google Scholar]
- 10.Kory MJ, et al. Gram-scale synthesis of two-dimensional polymer crystals and their structure analysis by X-ray diffraction. Nat. Chem. 2014;6:779–784. doi: 10.1038/nchem.2007. [DOI] [PubMed] [Google Scholar]
- 11.Shimomura S, et al. Selective sorption of oxygen and nitric oxide by an electron-donating flexible porous coordination polymer. Nat. Chem. 2010;2:633–637. doi: 10.1038/nchem.684. [DOI] [PubMed] [Google Scholar]
- 12.Rabone J, et al. An adaptable peptide-based porous material. Science. 2010;329:1053–1057. doi: 10.1126/science.1190672. [DOI] [PubMed] [Google Scholar]
- 13.Serre C, et al. Role of solvent-host interactions that lead to very large swelling of hybrid frameworks. Science. 2007;315:1828–1831. doi: 10.1126/science.1137975. [DOI] [PubMed] [Google Scholar]
- 14.Sleytr UB, Schuster B, Egelseer EM, Pum D. S- layers: principles and applications. FEMS Microbiol. Rev. 2014;38:823–864. doi: 10.1111/1574-6976.12063. [DOI] [PMC free article] [PubMed] [Google Scholar]
- 15.Hampp N. Bacteriorhodopsin as a photochromic retinal protein for optical memories. Chem. Rev. 2000;100:1755–1776. doi: 10.1021/cr980072x. [DOI] [PubMed] [Google Scholar]
- 16.Engel A, et al. Assembly of 2-D membrane protein crystals: dynamics, crystal order, and fidelity of structure analysis by electron microscopy. J. Struct. Biol. 1992;109:219–234. doi: 10.1016/1047-8477(92)90035-9. [DOI] [PubMed] [Google Scholar]
- 17.Stahlberg H, et al. Two-dimensional crystals: a powerful approach to assess structure, function and dynamics of membrane proteins. FEBS Lett. 2001;504:166–172. doi: 10.1016/s0014-5793(01)02746-6. [DOI] [PubMed] [Google Scholar]
- 18.Saboe PO, et al. Two- Dimensional Protein Crystals for Solar Energy Conversion. Adv. Mater. 2014;26:7064–7069. doi: 10.1002/adma.201402375. [DOI] [PubMed] [Google Scholar]
- 19.Sinclair JC, Davies KM, Venien-Bryan C, Noble MEM. Generation of protein lattices by fusing proteins with matching rotational symmetry. Nat. Nanotechnol. 2011;6:558–562. doi: 10.1038/nnano.2011.122. [DOI] [PubMed] [Google Scholar]
- 20.Brodin JD, et al. Metal-directed, chemically tunable assembly of one-, two- and three-dimensional crystalline protein arrays. Nat. Chem. 2012;4:375–382. doi: 10.1038/nchem.1290. [DOI] [PMC free article] [PubMed] [Google Scholar]
- 21.Gonen S, DiMaio F, Gonen T, Baker D. Design of ordered two-dimensional arrays mediated by noncovalent protein-protein interfaces. Science. 2015;348:1365–1368. doi: 10.1126/science.aaa9897. [DOI] [PubMed] [Google Scholar]
- 22.Lanci CJ, et al. Computational design of a protein crystal. Proc. Natl. Acad. Sci. USA. 2012;109:7304–7309. doi: 10.1073/pnas.1112595109. [DOI] [PMC free article] [PubMed] [Google Scholar]
- 23.Ringler P, Schulz GE. Self-assembly of proteins into designed networks. Science. 2003;302:106–109. doi: 10.1126/science.1088074. [DOI] [PubMed] [Google Scholar]
- 24.Grueninger D, et al. Designed protein-protein association. Science. 2008;319:206–209. doi: 10.1126/science.1150421. [DOI] [PubMed] [Google Scholar]
- 25.Greaves GN, Greer A, Lakes R, Rouxel T. Poisson's ratio and modern materials. Nat. Mater. 2011;10:823–837. doi: 10.1038/nmat3134. [DOI] [PubMed] [Google Scholar]
- 26.Grima J, Alderson A, Evans K. Auxetic behaviour from rotating rigid units. Phys. Stat. Sol. b. 2005;242:561–575. [Google Scholar]
- 27.Evans KE, Alderson A. Auxetic materials: functional materials and structures from lateral thinking! Adv. Mater. 2000;12:617–628. [Google Scholar]
- 28.Baughman RH. Auxetic materials: Avoiding the shrink. Nature. 2003;425:667–667. doi: 10.1038/425667a. [DOI] [PubMed] [Google Scholar]
- 29.Scarpa F, Ciffo L, Yates J. Dynamic properties of high structural integrity auxetic open cell foam. Smart Mat. Struct. 2004;13:49. [Google Scholar]
- 30.Lakes R. Foam structures with a negative Poisson's ratio. Science. 1987;235:1038–1040. doi: 10.1126/science.235.4792.1038. [DOI] [PubMed] [Google Scholar]
- 31.Choi JB, Lakes RS. Non-linear properties of metallic cellular materials with a negative Poisson's ratio. J. Mater. Sci. 1992;27:5375–5381. [Google Scholar]
- 32.Kroemer M, Schulz GE. The structure of L-rhamnulose-1-phosphate aldolase (class II) solved by low-resolution SIR phasing and 20-fold NCS averaging. Acta Cryst. D. 2002;58:824–832. doi: 10.1107/s0907444902004614. [DOI] [PubMed] [Google Scholar]
- 33.Edelhoch H. Spectroscopic determination of tryptophan and tyrosine in proteins. Biochemistry. 1967;6:1948–1954. doi: 10.1021/bi00859a010. [DOI] [PubMed] [Google Scholar]
- 34.Crowther R, Henderson R, Smith J. MRC image processing programs. J. Struct. Biol. 1996;116:9–16. doi: 10.1006/jsbi.1996.0003. [DOI] [PubMed] [Google Scholar]
- 35.Mindell JA, Grigorieff N. Accurate determination of local defocus and specimen tilt in electron microscopy. J. Struct. Biol. 2003;142:334–347. doi: 10.1016/s1047-8477(03)00069-8. [DOI] [PubMed] [Google Scholar]
- 36.Valpuesta J. M. a., Carrascosa JL, Henderson R. Analysis of electron microscope images and electron diffraction patterns of thin crystals of Ø29 connectors in ice. J. Mol. Biol. 1994;240:281–287. doi: 10.1006/jmbi.1994.1445. [DOI] [PubMed] [Google Scholar]
- 37.Pettersen EF, et al. UCSF Chimera—a visualization system for exploratory research and analysis. J. Comput. Chem. 2004;25:1605–1612. doi: 10.1002/jcc.20084. [DOI] [PubMed] [Google Scholar]
- 38.Heymann JB. Bsoft: image and molecular processing in electron microscopy. J. Struct. Biol. 2001;133:156–169. doi: 10.1006/jsbi.2001.4339. [DOI] [PubMed] [Google Scholar]
- 39.Tang G, et al. EMAN2: an extensible image processing suite for electron microscopy. J. Struct. Biol. 2007;157:38–46. doi: 10.1016/j.jsb.2006.05.009. [DOI] [PubMed] [Google Scholar]
- 40.Schindelin J, et al. Fiji: an open-source platform for biological-image analysis. Nat. Meth. 2012;9:676–682. doi: 10.1038/nmeth.2019. [DOI] [PMC free article] [PubMed] [Google Scholar]
- 41.Schneider CA, Rasband WS, Eliceiri KW. NIH Image to ImageJ: 25 years of image analysis. Nat. Methods. 2012;9:671–675. doi: 10.1038/nmeth.2089. [DOI] [PMC free article] [PubMed] [Google Scholar]
Associated Data
This section collects any data citations, data availability statements, or supplementary materials included in this article.


