

Rats localized airflow originating from one of five directions; performance was reduced after their whiskers were removed.
Keywords: vibrissa, vibrissae, wind following, somatosensory, tactile, rodents, hair, behavior, navigation, airflow
Abstract
Observation of terrestrial mammals suggests that they can follow the wind (anemotaxis), but the sensory cues underlying this ability have not been studied. We identify a significant contribution to anemotaxis mediated by whiskers (vibrissae), a modality previously studied only in the context of direct tactile contact. Five rats trained on a five-alternative forced-choice airflow localization task exhibited significant performance decrements after vibrissal removal. In contrast, vibrissal removal did not disrupt the performance of control animals trained to localize a light source. The performance decrement of individual rats was related to their airspeed threshold for successful localization: animals that found the task more challenging relied more on the vibrissae for localization cues. Following vibrissal removal, the rats deviated more from the straight-line path to the air source, choosing sources farther from the correct location. Our results indicate that rats can perform anemotaxis and that whiskers greatly facilitate this ability. Because air currents carry information about both odor content and location, these findings are discussed in terms of the adaptive significance of the interaction between sniffing and whisking in rodents.
INTRODUCTION
The sensory cues that underlie anemotaxis in terrestrial mammals have not been studied. However, studies in multiple other species implicate hair and hair-like appendages in flow sensing behaviors. The antennae of arthropods, the sensory hairs of insects and bats, and the whiskers (vibrissae) of pinnipeds are all used as flow sensors, mediating flight maneuvers (1–4), escape responses (1), wake tracking (5, 6) and contributing anemotaxic or rheotaxic information during olfactory search (7–12). Analogous to these systems, the vibrissae of terrestrial mammals would be a prime candidate to serve as flow sensors.
Two additional lines of evidence suggest a role for vibrissae in flow sensing. First, the mechanical response of a rat vibrissa to airflow contains information about both flow direction and magnitude (13). A vibrissa bends in the direction of airflow with an average bending amplitude that correlates with airspeed, and then vibrates around its new deflected position (13). Second, whisking and sniffing behaviors are synchronized by activity from the preBötzinger nucleus (14), conferring a degree of temporal precision that could align anemotaxic information from the vibrissae with odorant information during olfactory search. Together, these findings suggest that anemotaxic information from the vibrissae may be of high behavioral salience even when multiple anemotaxic cues are available (for example, from glabrous skin or pelage hairs). We therefore tested the hypothesis that the vibrissae contribute significantly to the ability of rats to localize airflow.
RESULTS
Five rats (female, Long-Evans, ~3 months old) were trained to localize airflow emanating from one of five fans placed around the circumference of a circular arena, spaced ~30° apart as measured from the arena center (Fig. 1A and figs. S1 and S2). Each day of training included at least 45 trials; only one of the five fans was on during any given trial. On each day, the sequence of fans was randomized while ensuring that each fan was on nine times (see Materials and Methods for details). At the start of each trial, a door opened to allow the rat to leave a holding box, enter the arena, and localize the airflow source by running toward a hole in front of the fan. The airspeed at the hole was 1.1 ± 0.3 m/s and the airspeed at the door was 0.5 ± 0.2 m/s (Fig. 1B).
Fig. 1. Rats were trained to localize airflow or light.
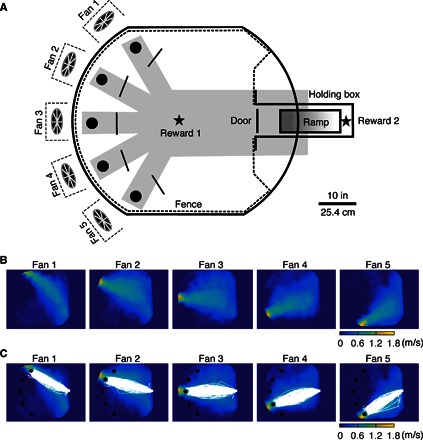
(A) The arena’s entrance door is opposite five fans, placed around the arena circumference. A fence confines the rat. Black solid lines indicate checkpoints. Five holes (black circles) allowed access to tunnels beneath the table (gray shadow) that led to a water reward port (reward 1, black star), activated only for correct trials. A ramp led back to the holding box where a second reward (reward 2, black star) was given for correct trials. (B) Airspeed color map shows that the maximum speed lies approximately along the line connecting fans and the entry door. (C) Five rats’ trajectories (all correct trials before vibrissal removal) superposed on airspeed color map.
In a preliminary study, we found that rats could circumvent the task by circling around the arena, exploring several fans in turn, and making a decision only when extremely close to the correct fan. To prevent this behavior, a correct choice required rats to first cross a virtual checkpoint 21.6 cm (8.5 inches) in front of the hole (Fig. 1A). If the rat both crossed the checkpoint and approached the hole, an audible click would signal the delivery of a water reward from a fluid port beneath the table. To obtain the reward, the rat had to go down a hole and follow a tunnel beneath the table to the water port. If the rat performed the trial correctly, it would receive a second reward for running up a ramp from the water port back to the holding box. Another trial began after a ~10-s intertrial interval.
Because a trial was counted as correct only if both the boundary of the hole and the checkpoint were crossed, all rats tended to follow a nearly straight-line path to the hole in front of the airflow source (Fig. 1C). Movie S1 shows examples of both correct and incorrect trials.
Upon performing the task for 10 consecutive days at a success rate above 55% (where chance is 20%), with no single day lower than 40%, a complete bilateral vibrissectomy was performed, and the rats were then tested for an additional 10 days. A control group of three rats was trained on the same task, except that the fans were replaced with a white light source. The control group underwent the same bilateral vibrissectomy. Careful acclimatization procedures (see Materials and Methods for details) allowed us to cut off (trim) all vibrissae in both groups of animals without anesthesia, using only gentle manual restraint. All vibrissae were trimmed to a length less than 2 mm; this trimming included all macrovibrissae and the longer of the microvibrissae (see Materials and Methods for more detail). We observed no significant groupwise change in locomotor speed or pausing of the rats after vibrissal trimming. Descriptive statistics for this analysis are shown in table S1.
Following vibrissal removal, all rats exhibited a notable decrement (~20%) in their ability to localize the source of the airflow; this effect was statistically significant in four of the five rats (Fig. 2A and table S2). In contrast, none of the rats trained to localize the light source showed a significant performance decrement. As expected, all rats could still perform the airflow localization task at levels well above chance (20%) regardless of the presence of vibrissae, confirming that these sensors are not the exclusive modality used for flow sensing.
Fig. 2. Vibrissal removal degrades performance in airflow but not light localization.
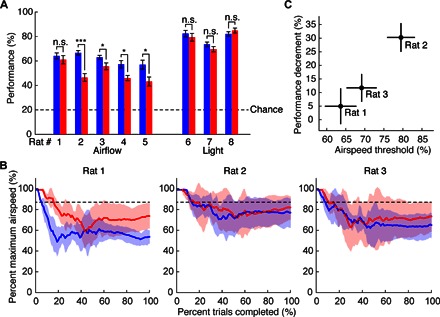
(A) Average (10-day) performance before (blue) and after (red) vibrissal removal for rats trained to localize either airflow or light. Error bars show means ± SEM. ***P < 0.001; *P < 0.05; n.s. (not significant), P ≥ 0.05; Wilcoxon rank sum test; median values are reported in table S2. (B) Average (6-day) localization threshold before (blue) and after (red) vibrissal removal on the two-up/two-down experiment. Data show means ± SD percent maximum airspeed. Dashed lines indicate the fixed airflow speed used in Fig. 2A (87% maximum). (C) Average performance decrement (10-day average) with fixed airspeed is related to localization threshold (12-day average). Data points show mean values; vertical lines indicate ±SEM performance decrement; horizontal lines indicate ±SEM threshold.
To investigate the basis for inter-rat performance variability after vibrissal removal, we performed a new experiment (see Materials and Methods, “Localization threshold experiment” section) in which we replicated the original experiment while manipulating airspeed. To determine the localization thresholds of individual rats, we used a two-up/two-down staircase paradigm. The vibrissae of three rats were allowed to regrow for 1 month, and the rats were then retrained for 2 weeks on the original experimental task (air speed, 1.1 ± 0.3 m/s at the hole). After 2 weeks, the threshold experiment started. Each day of training began with the fans running at full speed (1.4 ± 0.3 m/s at the hole); note that the full speed in this threshold experiment was higher than the speed used in the original experiment. Fan speed was decreased by 10% if the rat completed two trials correctly and increased by 10% following two incorrect trials. After the fan speed was reversed six times, the resolution of the speed change was decreased to 2%. On each day, data collection stopped either after a total of 12 reversals (6 reversals at 10% and 6 at 2%) or after ~1.5 hours of testing, when the rat had lost interest in the task (fig. S3).
Comparing the results of the localization threshold experiment across rats (Fig. 2B) offers a compelling explanation for the variability in performance decrement. The localization threshold for rat 1 was lower than the airspeed used during the original experiment, both before and after vibrissal removal. This rat was sufficiently sensitive to airflow that, although vibrissal removal caused a performance decrement, it was not large enough to reach statistical significance. In contrast, the localization thresholds for rats 2 and 3 more closely bracketed the 1.1 ± 0.3–m/s airspeed used in the original experiment (87% of max); these rats exhibited significant performance reductions with vibrissal removal. Figure 2C illustrates the relationship between performance decrement and localization threshold for these three rats.
Complementing the performance decrement, the magnitude of the localization error was also found to increase after vibrissal removal. Although the rats’ trajectories during correct trials were generally straight-line paths (Fig. 1C), their trajectories on incorrect trials deviated from these paths, and this deviation increased after vibrissal removal (Fig. 3A). Deviation was quantified as the shortest (that is, orthogonal) distance from the rat’s position to the straight-line trajectory. Average deviation was calculated in a two-step process: we first computed the area enclosed by three curves—the straight-line trajectory to the correct fan, the boundary of the arena, and the rat’s actual trajectory (fig. S4)—and then divided the area by the length of the straight-line trajectory. Average deviation thus captures the extent to which the rat’s trajectory diverges from the straight-line path to the correct fan (see Materials and Methods for more details on this metric). Figure 3B shows that on average, the deviation from the straight-line path increased 20.4% for all rats trained to localize the airflow source; this effect was significant for all but rat 1. In contrast, no significant changes in path length deviation were observed for any rat in the control group trained to localize the light source (Fig. 3B, fig. S5, and table S2).
Fig. 3. For incorrect trials, vibrissal removal causes rats localizing airflow to deviate more from the straight-line path to an airflow source but not a light source.
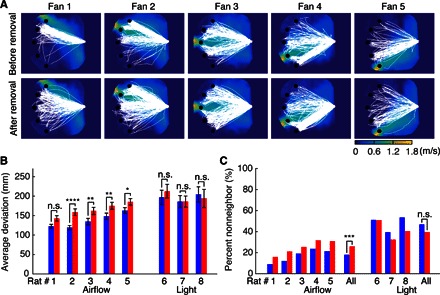
(A) Trajectories of all incorrect trials of five rats trained to localize airflow 10 days before vibrissal removal (top row) diverge less than after removal (bottom row). (B) For incorrect trials, deviation of each rat before vibrissal removal (blue) is smaller than after removal (red). Error bars show means ± SEM. ****P < 0.0001; **P < 0.01; *P < 0.05; n.s., P ≥ 0.05; Wilcoxon rank sum test; median values are reported in table S2. (C) The percentage of incorrect trials for which a nonneighboring fan was chosen before (blue) and after (red) vibrissal removal. ***P < 0.001; n.s., P ≥ 0.05; Yates’s corrected χ2 test.
The changes in path length deviation shown in Fig. 3 (A and B) suggest that rats were choosing fans farther away from the correct source of airflow. We confirmed this possibility by computing the percentage of incorrect trials in which rats chose either a neighboring (incorrect) source or a nonneighboring (incorrect) source. This analysis effectively measures the degree of spatial error in the rat’s localization choice (Fig. 3C). All rats trained to localize the airflow showed an increased tendency to choose nonneighboring fans after vibrissal removal. When pooled, the increase reached significance. In contrast, the rats trained to localize the light source showed no consistent change.
DISCUSSION
Our results demonstrate that the rodent vibrissal-trigeminal system, which has a well-established role in tactile detection and texture discrimination (15, 16), also contributes significantly to the detection and localization of airflow. Results show not only that rats can exploit information from the macrovibrissae for anemotaxis but also that they do exploit it, even when multiple cues are available. The task used here did not require rats to use their macrovibrissae; the animals were free to choose whichever cues were most helpful. Performance after macrovibrissal removal decreased for all rats but remained above chance, indicating that rats do not rely on the macrovibrissae alone for anemotaxis. Alternative cues could include thermal information from the snout, pinnae, and corneas, as well as mechanical cues from other sensory hairs, such as the pelage (fur), tylotrichs, the microvibrissae, and the residual lengths (<2 mm) of the macrovibrissae. Further studies are required to assess the relative contributions from each of these other submodalities.
Although the present work does not directly demonstrate that anemotaxic information obtained by the vibrissae is used for olfactory localization, we suggest that during an animal’s natural exploration, the most behaviorally relevant information to be obtained from air currents is the location of distant odor sources. While local odor concentrations within an odor plume generally provide limited information about a source location (8, 17), the vibrissal system offers a parallel stream of trigeminal-based tactile signals that contain spatial cues. Receiving parallel olfactory and vibrissal cues could greatly simplify olfactory search within the “patchy” odor plumes that typically characterize natural environments (8, 17). Determining the odor concentration gradient using olfaction alone is time-intensive, requiring the animal to take time-averaged concentration measurements of an odor plume at multiple locations (10, 17). In contrast, airflow signals are inherently vector quantities that can be combined with olfactory cues at a single spatial location to provide the animal with a rapid estimate of odor location. The direction of the airflow vector indicates the azimuthal angle to the odor source (10); the magnitude of the airflow vector (speed) and the scalar odorant concentration could jointly indicate the distance to the odor source. The vector from the animal’s position to the odor source could thus be efficiently computed. Similar chemoanemotaxic strategies are observed in other species (7–12).
Airflow sensing by the vibrissae offers a mechanical explanation for the anemotaxic contribution to olfactory search observed in behavioral experiments (18). The cross-modal nature of this proposed vibrissotactile-olfactory information stream underscores the need for rodents to continuously adjust the relationship between whisking and sniffing, as reflected in the dynamic relationship between the coupled neural oscillators known to drive these rhythmic behaviors (14, 19, 20). Passive displacements due to airflow will likely be easiest to sense if the vibrissae are held relatively immobile to avoid contamination with a peripheral reafferent signal (21–24). Thus, at times when anemotaxis is paramount, the rat may minimize whisking, whereas at other times, the animal may exploit bilateral nostril comparisons (25–27) and is likely to generate synchronized ~8-Hz sniffing and whisking (14, 18–20, 28). Future studies that directly assess involvement of the macrovibrissae in olfactory search would help to elucidate characteristics of the mechanotactile information that vibrissal-responsive regions of the nervous system evolved to process.
MATERIALS AND METHODS
All procedures were approved in advance by Northwestern University’s Animal Care and Use Committee.
Experimental setup
Five computer fans (Cooler Master, Blade Master 80) were placed radially around the edge of a circular table 1.83 m (6 feet) in diameter. Each fan was inserted into a 12.70 × 7.62 × 7.62–cm (5 × 3 × 3–inch) enclosure that helped direct the airflow forward. Each fan and enclosure was supported by a freestanding base that was weighted to the floor with heavy iron plates. No part of the fan or the enclosure touched the table. Fan vibrations were barely detectable when the fan enclosure was directly touched with a finger. Although we were not able to directly quantify the magnitude of these tiny vibrations, it is unlikely that they influenced the behavior of the rat because they would have had to have traveled from the fan, through the heavy iron base, through the cement laboratory floor, and back up through the table. The distance between each fan and the entrance door into the arena ranged from 1.41 to 1.56 m (55.5 to 61.25 inches), ensuring that airflow speeds at the entrance differed by no more than 0.2 m/s. All airflow speeds were measured using a hot-wire anemometer (Omega, model HHF42; resolution, 0.1m/s). The left and right edges of the table, outside of the fence, were removed to ensure that the entire area of the table was visible in the overhead camera frame.
Control stimuli consisted of white light-emitting diodes (LEDs) mounted to the top of each of the fan enclosures and directed toward the door. The light intensity of the bulbs was less than 0.1 lux in the center of the table, as measured by a light meter (Digi-Sense, model 20250-00). To ensure against bias toward any particular location, each of the five fans or lights was activated the same number of times per training session, and the order of the fans was randomized using the C++ random_shuffle algorithm (libstdc++, version 6.0.19). The randomization was reseeded for each new training session.
We controlled for extraneous cues from audition and vision for all rats. Ambient noise in the room due to building mechanicals was measured to be 50.5 dB (Casella CEL-63X sound meter). The manufacturer’s specifications indicated that the sound emitted from each fan was between 13 and 28 dB; the sound meter did not register a change when a fan was turned on. A masking stimulus was played continuously during training. It consisted of audio recordings from all fans with additional bandpass-limited white noise superimposed. The masking stimulus was played back through two speakers beneath the arena (Juster AC-691N), located between fans 1 and 2 and between fans 4 and 5. The amplitude of the masking stimulus was measured to be 67.8 dB. An ultrasound detector (Pettersson D 230) confirmed that the fans did not emit ultrasonic cues.
The experiments were run in a dark room where a computer monitor behind a curtain was the only ambient visible spectrum light source. Matte black cloth was mounted behind each fan to reduce the contrast between the fan’s blades and the background.
Behavioral shaping
Rats were trained 5 days a week, for 3 to 5 months, starting at 3 months of age. All rats completed 45 to 50 trials per day (usually ~30 min per rat), and the order in which the rats were trained changed each day. The rats were deprived of water for 23 hours before training but received ad libitum water 2 days per week.
Each day of training began with a 5-min gentling session in which the rat was conditioned to tolerate being held firmly while its vibrissae were brushed with a set of blunt-tipped scissors. This conditioning allowed us to cut off the vibrissae without anesthesia during the original experiment (stage 5b in fig. S1) and during the localization threshold experiment.
Rats were trained to localize airflow emanating from one of five fans. Training consisted of several stages of increasing difficulty, as schematized in fig. S1. During training, a correction procedure was used such that when a trial was completed incorrectly, the trial was repeated with the identical stimulus until the rat gave a correct response. In the final stage, the correction procedure was stopped. After the rats achieved a success rate above 40% for 10 consecutive days with an average above 55%, all vibrissae (both macrovibrissae and microvibrissae) were trimmed to <2 mm in length. Macrovibrissae included mystacial, supraorbital, genal, and mental vibrissae (whisker trident). Microvibrissae shorter than 2 mm were not trimmed. Vibrissae were retrimmed every other day to ensure that they never exceeded 2 mm in length.
Nineteen rats were initially trained. Of those, 10 were excluded from the experiment during the first stage of training (stage 1a in fig. S1). These 10 rats refused to ever traverse the open-field arena, choosing instead to sit within the tunnel system and groom. One rat was excluded in the last stage of training (stage 4a in fig. S1). This rat gradually became lethargic over a period of ~3 weeks, choosing to sit and groom in the tunnel underneath the table. Although the rat’s overall performance on the task (both percent correct and locomotor speed during the trial) resembled that of the other rats, training sessions gradually extended to 1 or 2 hours because of these extended periods of grooming, and the rat was therefore excluded from the study. Of the remaining eight rats, five composed the experimental group (localized airflow) and three composed the control group (localized light). A total of 7217 trials were recorded. Of these trials, 6.7% were removed from the data set because the rats were grooming, climbing, following the arena’s edge, or retreating back into the holding box before completing the trial. A total of 0.6% of all trials were removed because of computer malfunction.
On the third day after trimming the vibrissae of rat 2, a fire alarm went off after it had performed 26 trials. Only 26 trials were used on that day.
Reward criteria
Reward criteria for training are shown in fig. S2. To receive rewards, the rat was required to run toward the operating fan and cross two trigger regions along the way. All triggers were implemented digitally through images taken by an overhead camera and were not physically observable. The first (checkpoint) set of triggers consisted of five linear regions of interest, 15.24 cm (6 inches) wide, located 21.59 cm (8.5 inches) in front of their corresponding holes. Each trigger line was oriented to be orthogonal to the straight-line path connecting the center of its hole to the entrance of the arena. The second (hole) set of triggers consisted of 11.43-cm (4.5-inch) circles surrounding each hole. During training stages 1a, 2a, and 3a, the checkpoint triggers were turned off to promote a smoother transition between increasingly difficult training stages. The distances between the door and the holes ranged between 93.98 cm (37 inches) and 106.68 cm (42 inches).
Upon reaching the hole trigger, the rat was required to go down one of the holes 7.62 cm (3 inches) in diameter located in front of the fans leading to a tunnel system beneath the table. The tunnels led to the first reward and provided a path back to the holding box to receive a second reward. To prevent the rat from looping in the opposite direction, one-way doors were installed in each of the five branches of the tunnel system, as well as a one-way hatch at the top of the ramp. When a rat did not return to the holding box within a ~1-min time span, the rats were gently guided up the ramp by the trainer.
The first reward was a 0.09 ± 0.02–ml drop of fresh water and was dispensed by a solenoid valve in the center of the chamber beneath the table. The second reward was a 0.1 ± 0.07–ml drop of sucrose solution (85.575 g/liter) and was dispensed manually with a pipette at the rear of the holding box (Fig. 1A). The purpose of the second reward was to motivate the rat to return to the holding box. Both rewards were contingent on the rat getting the trial correct. A new trial was started once the rat returned to the holding box. The start of each trial was controlled manually by the trainer.
Video recording and rat tracking
An infrared light source (15 W) illuminated the arena from above. Videos were recorded at 20 fps at a resolution of 480 × 640 pixels by a surveillance camera (Swann PRO-760) and a video capture card (Pinnacle, AV to USB2 Rev. 1.2A). Custom circuitry and software were developed to monitor the checkpoints as well as to control the actions of the camera, the vertical lift entry door to the arena, the fans, the LEDs, and the reward solenoid. The triggers were implemented by monitoring their respective regions of interest for changes in pixel intensity from the white background. When the intensity within the trigger’s region of interest fell below a threshold value, the trigger was activated. Upon reaching a hole trigger, the arena door was automatically closed and the fan was turned off. For correct trials, the solenoid was automatically activated, producing a clicking sound and alerting the rat to the presence of a reward. The trial number, correct fan number, checkpoint trigger number, hole trigger number, and full video for each trial were automatically recorded.
Rat positions were automatically tracked in post-processing using MATLAB. The tracking algorithm exploited the contrast between the rat (brown) and the arena (white) to measure the position of the rat. An image of the empty arena was used to find and mask out persistently dark regions. Any remaining dark regions greater than a size threshold represented the rat. The position of the rat was defined as the centroid of the dark region.
Average deviation
The straight-line trajectory is defined as the line that connects the door with the correct hole. The rat’s deviation at each point in time is defined as the orthogonal distance between the rat’s position and the straight-line trajectory. Intuitively, the average deviation can be thought of by imagining that the rat has taken a trajectory in which its deviation is constant throughout its entire path. The rectangular area enclosed by this hypothetical trajectory is defined by the straight-line trajectory and the average deviation value. It follows that the average deviation is equal to the enclosed area divided by the length of the straight-line path. The average deviation values plotted in Fig. 3B were therefore calculated by measuring the enclosed area shown in fig. S4 and dividing the area by the length of the straight-line path.
Airflow maps
To monitor for changes in airspeed between training days, airspeed measurements were taken at 11 points throughout the arena for each fan, for a total of 55 measurements each day. For each fan, the first measurement point was taken at the door, the next five points were taken halfway between the door and each hole, and the final five points were taken in front of each hole. Typical fan speeds along the lines connecting the fans to the door were 1.1 ± 0.3, 0.8 ± 0.2, and 0.5 ± 0.2 m/s (mean ± maximum difference), as measured from the hole to the door. We also recorded 3 days of higher spatial resolution measurements taken at 162 points for each fan, spaced evenly throughout the arena. To produce the color map images for Figs. 1 (B and C) and 3A, fig. S4, and movie S1, small markers were placed at the 162 measurement locations, and the overhead camera was used to take a picture of the arena. The positions of the markers were then manually extracted from the image and used to linearly interpolate the airspeed for every pixel location within the arena.
Localization threshold experiment
For three of the five rats trained to localize airflow (rats 1, 2, and 3), a follow-up experiment was performed to investigate the threshold at which the rats were able to localize airflow. In this experiment, we used a two-up/two-down paradigm to alter the magnitude of the airspeed on the basis of the rat’s performance. After the rat performed two correct trials, the airspeed was lowered, increasing difficulty. Conversely, after the rat performed two incorrect trials, the airspeed was raised, decreasing difficulty. For the first six reversals, the airspeed was changed by 10% increments. For the next six reversals, the airspeed was changed by 2% increments (Fig. 2B and fig. S3). Each day, this process was continued until the airspeed was reversed 12 times (12 reversals) or after ~1.5 hours of testing. The speed of each fan was adjusted via a pulse-width modulation (PWM) signal. On average, a 1% change in the duty cycle of the PWM signal resulted in a 0.015-m/s change in airflow speed at the hole. The duty cycle could be adjusted within the range of 1 to 99%.
Rats 1 and 3 performed the staircase procedure for 6 days with vibrissae and 6 days without vibrissae. For several days, rat 2 did not achieve an adequate number of reversals. Therefore, it was tested for 10 days before trimming and for 10 days after trimming. The subset of 6 days with the highest number of reversals before and after trimming was used in the threshold analysis. Table S3 shows the number of reversals achieved for each rat on each day. To normalize for the variable number of trials that each rat took to achieve convergence, we analyzed percent complete as opposed to trial number. The percentage of maximum fan speed was then resampled using linear interpolation at integer values of percent complete. Means and SDs were computed at these integer values.
Supplementary Material
Acknowledgments
We thank H. Castillo and K. L. Werling for assistance with setup construction and behavioral training. We thank H. P. Zeigler, L. M. Kay, and T. Bozza for critical comments that improved the manuscript and V. Gopal and N. A. Patankar for useful discussions. Funding: This work was supported by NSF award CRCNS-IIS-1208118 and NIH award R01-NS093585 to M.J.Z.H. C.S.B. was partially supported by NSF IGERT (Integrative Graduate Education and Research Traineeship): Integrative Research in Motor Control and Movement grant no. DGE-0903637 and by NIH T32: Training in the Neurobiology of Movement and Rehabilitation Sciences grant no. HD057845. Author contributions: M.J.Z.H. conceived the project. Y.S.W.Y., M.M.G., C.S.B., Y.B.M., and M.J.Z.H. designed the experiments, analyzed data, and wrote the paper. Y.S.W.Y., M.M.G., C.S.B., and Y.B.M. performed experiments. Competing interests: The authors declare that they have no competing interests. Data and materials availability: All data needed to evaluate the conclusions in the paper are present in the paper and/or the Supplementary Materials. Additional data related to this paper may be requested from the authors.
SUPPLEMENTARY MATERIALS
Supplementary material for this article is available at http://advances.sciencemag.org/cgi/content/full/2/8/e1600716/DC1
fig. S1. Rats learned to perform the task through a series of behavioral shaping stages.
fig. S2. Reward delivery was contingent on performance.
fig. S3. Fan speed was adjusted to determine rat localization thresholds.
fig. S4. Path length deviation was quantified on the basis of the rat’s trajectory.
fig. S5. Vibrissal removal does not affect the rats’ ability to find a light source.
table S1. Descriptive statistics for locomotion.
table S2. Median values of the performance and deviation data.
table S3. Completion criteria for the localization threshold experiment vary by rat.
data file S1. Data for Fig. 2 (A and C).
data file S2. Data for Fig. 3 (B and C).
movie S1. The video shows 13 trials in which a rat localizes airflow emanating from one of five fans, arranged around the circumference of a table.
REFERENCES AND NOTES
- 1.Casas J., Dangles O., Physical ecology of fluid flow sensing in arthropods. Annu. Rev. Entomol. 55, 505–520 (2010). [DOI] [PubMed] [Google Scholar]
- 2.Marshall K. L., Chadha M., deSouza L. A., Sterbing-D’Angelo S. J., Moss C. F., Somatosensory substrates of flight control in bats. Cell Rep. 11, 851–858 (2015). [DOI] [PMC free article] [PubMed] [Google Scholar]
- 3.Budick S. A., Reiser M. B., Dickinson M. H., The role of visual and mechanosensory cues in structuring forward flight in Drosophila melanogaster. J. Exp. Biol. 210, 4092–4103 (2007). [DOI] [PubMed] [Google Scholar]
- 4.Sane S. P., Dieudonné A., Willis M. A., Daniel T. L., Antennal mechanosensors mediate flight control in moths. Science 315, 863–866 (2007). [DOI] [PubMed] [Google Scholar]
- 5.Dehnhardt G., Mauck B., Hanke W., Bleckmann H., Hydrodynamic trail-following in harbor seals (Phoca vitulina). Science 293, 102–104 (2001). [DOI] [PubMed] [Google Scholar]
- 6.Dehnhardt G., Mauck B., Bleckmann H., Seal whiskers detect water movements. Nature 394, 235–236 (1998). [Google Scholar]
- 7.Baker T. C., Kuenen L. P. S., Pheromone source location by flying moths: A supplementary non-anemotactic mechanism. Science 216, 424–427 (1982). [DOI] [PubMed] [Google Scholar]
- 8.Koehl M. A. R., The fluid mechanics of arthropod sniffing in turbulent odor plumes. Chem. Senses 31, 93–105 (2006). [DOI] [PubMed] [Google Scholar]
- 9.van Breugel F., Dickinson M. H., Plume-tracking behavior of flying Drosophila emerges from a set of distinct sensory-motor reflexes. Curr. Biol. 24, 274–286 (2014). [DOI] [PubMed] [Google Scholar]
- 10.Vickers N. J., Mechanisms of animal navigation in odor plumes. Biol. Bull. 198, 203–212 (2000). [DOI] [PubMed] [Google Scholar]
- 11.Zimmer-Faust R. K., Finelli C. M., Pentcheff N. D., Wethey D. S., Odor plumes and animal navigation in turbulent water-flow: A field-study. Biol. Bull. 188, 111–116 (1995). [DOI] [PubMed] [Google Scholar]
- 12.Rust M. K., Bell W. J., Chemo-anemotaxis: A behavioral response to sex pheromone in nonflying insects. Proc. Natl. Acad. Sci. U.S.A. 73, 2524–2526 (1976). [DOI] [PMC free article] [PubMed] [Google Scholar]
- 13.Yu Y. S. W., Graff M. M., Hartmann M. J. Z., Mechanical responses of rat vibrissae to airflow. J. Exp. Biol. 219, 937–948 (2016). [DOI] [PMC free article] [PubMed] [Google Scholar]
- 14.Moore J. D., Deschênes M., Furuta T., Huber D., Smear M. C., Demers M., Kleinfeld D., Hierarchy of orofacial rhythms revealed through whisking and breathing. Nature 497, 205–210 (2013). [DOI] [PMC free article] [PubMed] [Google Scholar]
- 15.Jadhav S. P., Feldman D. E., Texture coding in the whisker system. Curr. Opin. Neurobiol. 20, 313–318 (2010). [DOI] [PubMed] [Google Scholar]
- 16.Kleinfeld D., Ahissar E., Diamond M. E., Active sensation: Insights from the rodent vibrissa sensorimotor system. Curr. Opin. Neurobiol. 16, 435–444 (2006). [DOI] [PubMed] [Google Scholar]
- 17.Murlis J., Elkinton J. S., Cardé R. T., Odor plumes and how insects use them. Annu. Rev. Entomol. 37, 505–532 (1992). [Google Scholar]
- 18.Bhattacharyya U., Bhalla U. S., Robust and rapid air-borne odor tracking without casting. eNeuro 2, ENEURO.0102-15.2015 (2015). [DOI] [PMC free article] [PubMed] [Google Scholar]
- 19.Kleinfeld D., Deschênes M., Wang F., Moore J. D., More than a rhythm of life: Breathing as a binder of orofacial sensation. Nat. Neurosci. 17, 647–651 (2014). [DOI] [PMC free article] [PubMed] [Google Scholar]
- 20.Ranade S., Hangya B., Kepecs A., Multiple modes of phase locking between sniffing and whisking during active exploration. J. Neurosci. 33, 8250–8256 (2013). [DOI] [PMC free article] [PubMed] [Google Scholar]
- 21.Fee M. S., Mitra P. P., Kleinfeld D., Central versus peripheral determinants of patterned spike activity in rat vibrissa cortex during whisking. J. Neurophysiol. 78, 1144–1149 (1997). [DOI] [PubMed] [Google Scholar]
- 22.Khatri V., Bermejo R., Brumberg J. C., Keller A., Zeigler H. P., Whisking in air: Encoding of kinematics by trigeminal ganglion neurons in awake rats. J. Neurophysiol. 101, 1836–1846 (2009). [DOI] [PMC free article] [PubMed] [Google Scholar]
- 23.Leiser S. C., Moxon K. A., Responses of trigeminal ganglion neurons during natural whisking behaviors in the awake rat. Neuron 53, 117–133 (2007). [DOI] [PubMed] [Google Scholar]
- 24.Wallach A., Bagdasarian K., Ahissar E., On-going computation of whisking phase by mechanoreceptors. Nat. Neurosci. 19, 487–493 (2016). [DOI] [PubMed] [Google Scholar]
- 25.Catania K. C., Stereo and serial sniffing guide navigation to an odour source in a mammal. Nat. Commun. 4, 1441 (2013). [DOI] [PubMed] [Google Scholar]
- 26.Rajan R., Clement J. P., Bhalla U. S., Rats smell in stereo. Science 311, 666–670 (2006). [DOI] [PubMed] [Google Scholar]
- 27.Khan A. G., Sarangi M., Bhalla U. S., Rats track odour trails accurately using a multi-layered strategy with near-optimal sampling. Nat. Commun. 3, 703 (2012). [DOI] [PubMed] [Google Scholar]
- 28.Smear M., Shusterman R., O’Connor R., Bozza T., Rinberg D., Perception of sniff phase in mouse olfaction. Nature 479, 397–400 (2011). [DOI] [PubMed] [Google Scholar]
Associated Data
This section collects any data citations, data availability statements, or supplementary materials included in this article.
Supplementary Materials
Supplementary material for this article is available at http://advances.sciencemag.org/cgi/content/full/2/8/e1600716/DC1
fig. S1. Rats learned to perform the task through a series of behavioral shaping stages.
fig. S2. Reward delivery was contingent on performance.
fig. S3. Fan speed was adjusted to determine rat localization thresholds.
fig. S4. Path length deviation was quantified on the basis of the rat’s trajectory.
fig. S5. Vibrissal removal does not affect the rats’ ability to find a light source.
table S1. Descriptive statistics for locomotion.
table S2. Median values of the performance and deviation data.
table S3. Completion criteria for the localization threshold experiment vary by rat.
data file S1. Data for Fig. 2 (A and C).
data file S2. Data for Fig. 3 (B and C).
movie S1. The video shows 13 trials in which a rat localizes airflow emanating from one of five fans, arranged around the circumference of a table.