

Summary
Hematopoietic stem cells (HSCs) are self-renewing multipotent stem cells that generate mature blood lineages throughout life. They, together with hematopoietic progenitor cells (collectively known as HSPCs), emerge from hemogenic endothelium in the floor of the embryonic dorsal aorta by an endothelial-to-hematopoietic transition (EHT). Here we demonstrate that transforming growth factor β (TGFβ) is required for HSPC specification and that it regulates the expression of the Notch ligand Jagged1a in endothelial cells prior to EHT, in a striking parallel with the epithelial-to-mesenchymal transition (EMT). The requirement for TGFβ is two fold and sequential: autocrine via Tgfβ1a and Tgfβ1b produced in the endothelial cells themselves, followed by a paracrine input of Tgfβ3 from the notochord, suggesting that the former programs the hemogenic endothelium and the latter drives EHT. Our findings have important implications for the generation of HSPCs from pluripotent cells in vitro.
Keywords: TGFβ, notch, hematopoietic stem cell, EHT, zebrafish, jag1a
Graphical Abstract
Highlights
-
•
TGFβ signaling is required for hematopoietic stem cell (HSC) emergence in embryos
-
•
TGFβ regulates jag1a expression and programs endothelium to become hemogenic endothelium (HE)
-
•
Tgfb1a/Tgfb1b and Tgfb3 act sequentially to program HE and give rise to HSCs
Hematopoietic stem cells (HSCs) arise in the embryo from hemogenic endothelium in the dorsal aorta. Here, Monteiro et al. reveal that sequential activity by two TGFβ ligands and crosstalk between TGFβ and Notch signaling are required to program arterial endothelial cells to become hemogenic and give rise to HSCs.
Introduction
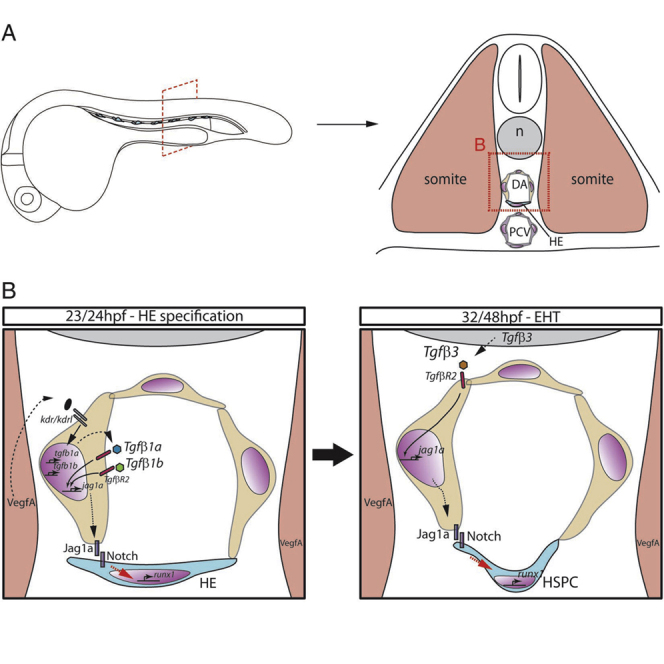
Hematopoietic stem cells (HSCs) are specified during embryonic development from a subset of arterial endothelial cells located in the floor of the dorsal aorta (DA). HSCs emerge by a process termed the endothelial-to-hematopoietic transition (EHT) (Bertrand et al., 2010, Boisset et al., 2010, Kissa and Herbomel, 2010). In zebrafish, the hematopoietic stem and progenitor cells (HSPCs) generated by EHT migrate to the caudal hematopoietic tissue (CHT), where they proliferate and undergo differentiation into erythroid and myeloid lineages (Kissa et al., 2008, Murayama et al., 2006). Some will exit the CHT and migrate to the thymus to give rise to T cells, and others move to the kidney, the adult site of hematopoiesis in the zebrafish, equivalent to the bone marrow in mammals (Ciau-Uitz et al., 2014).
The transcription factor Runx1 is required for EHT in mice and zebrafish (Chen et al., 2009, Kissa and Herbomel, 2010). Its expression in the floor of the DA is initiated by 23 hpf in zebrafish (Wilkinson et al., 2009) and marks a cell population committed to the hemogenic fate, the hemogenic endothelium (HE). Several signaling pathways including Hedgehog, VEGF, Notch and BMP are required sequentially to regulate programming of the arterial endothelium and HSPC emergence (Burns et al., 2005, Gering and Patient, 2005, Kim et al., 2014, Wilkinson et al., 2009). The Notch receptor Notch1 is the main driver of HSPC emergence from HE, likely downstream of its ligand Jagged1 (Gama-Norton et al., 2015, Hadland et al., 2015, Jang et al., 2015) and is thought to drive runx1 expression via Gata2 (Robert-Moreno et al., 2005). Jagged1 is dispensable for arterial programming but required in the endothelium for the specification of HSPCs (Espin-Palazon et al., 2014, Gama-Norton et al., 2015, Robert-Moreno et al., 2008).
In humans, defective transforming growth factor β (TGFβ) signaling is associated with proliferative disorders of HSPCs such as acute myeloid leukemia and T cell acute lymphoblastic leukemia (Kim and Letterio, 2003). More recently, it has been shown that paracrine TGFβ signaling in the bone marrow niche maintains quiescence of the resident HSC pool (Zhao et al., 2014) and may also direct differentiation of lineage-biased HSC subtypes (Challen et al., 2010), positioning TGFβ as a critical regulator of proliferation and differentiation of adult HSCs. Whether TGFβ plays a role in the formation of HSCs is however not known. Mutants for the ligand TGFβ1 or its receptor TGFβR2, including endothelial-specific conditional knockout mice, die between E9.5 and E10.5 due to defective recruitment of mural cells to the yolk sac vasculature and the subsequent loss of vessel integrity (Carvalho et al., 2004, Dickson et al., 1995, Oshima et al., 1996). This is before the emergence of HSPCs in the embryo proper (de Bruijn et al., 2002), effectively precluding the analysis of the role of TGFβ signaling in HSPC specification in mice. Zebrafish, however, develop externally and do not depend on extraembryonic tissues for survival. In addition, recruitment of mural cells to the endothelium does not happen until 72 hpf (Santoro et al., 2009), 2 days after the HSPCs are specified in the DA. Thus, we can address the role of TGFβ in HSPC emergence in zebrafish without the inherent limitations of the mouse models.
The TGFβ superfamily comprises BMPs, Activins, Nodals, and TGFβs. There are three TGFβ ligands in the mouse: TGFβ1, TGFβ2, and TGFβ3 (Goumans and Mummery, 2000), and they all signal through a single type II serine-threonine kinase receptor (TGFβR2) that recruits the type I receptors Activin-like kinase 1 (Alk1) or Alk5 (Shi and Massague, 2003). Alk1 expression is essentially restricted to endothelial cells (ECs) (Oh et al., 2000), whereas Alk5 is more broadly expressed (Goumans et al., 2002) but also present in ECs. Activated Alk1 phosphorylates Smad1, Smad5, and Smad9, whereas activated Alk5 phosphorylates Smad2 and Smad3 (Shi and Massague, 2003). Activated Smads migrate to the nucleus together with the co-Smad Smad4 and regulate transcription together with co-activators or co-repressors (Shi and Massague, 2003). In addition, TGFβ can signal through the non-canonical Erk, JNK, and p38 MAPK kinase pathways to instigate transcriptional responses (Derynck and Zhang, 2003). Thus, to circumvent the complexity of the intracellular signaling elicited by TGFβ, we focused our attention on TgfβR2, the type II receptor for TGFβ. Abrogation of TGFβR2 activity revealed that TGFβ signaling plays a key role in the formation of HSPCs. TGFβ is required for the correct programming of the HE downstream of Vegf and independently of arterial programming. We demonstrate that Jag1a is a target of TGFβ signaling, and jag1a overexpression in endothelium rescues the loss of HSPCs in tgfbR2-depleted embryos. Finally, we identified two independent sources of ligand: TGFβ1a and TGFβ1b in the endothelium and TGFβ3 in the nearby notochord. Both inputs contribute to the regulation of jag1a in endothelium through the TgfβR2 receptor and thus enable Notch signaling to program the HE prior to specification of HSPCs.
Results
TGFβ Signaling Components Are Expressed in or around the Embryonic Site of HSC Emergence
To investigate whether TGFβ signaling could play a role in HSPC specification in zebrafish, we first carried out expression analysis. tgfβR2 is expressed in the head vasculature and in the somites at 15 hpf and in the DA and the somites from at least 18 hpf up to 24 hpf (Figures 1A and S1A), prior to the onset of runx1 expression in the HE (Wilkinson et al., 2009). At 30 hpf, tgfbR2 becomes essentially endothelial, with higher expression in the posterior cardinal vein (PCV) and in the caudal plexus (Figure 1A). TGFβ ligands are also expressed in the region at the onset of HE formation: tgfb1a and tgfb1b are expressed in the endothelium, including the DA at 15 hpf, 24 hpf, and 27 hpf (Figures 1B, 1C, S1B, and S1C). At 27 hpf, tgfb1a expression is downregulated in the DA and PCV, whereas tgfb1b is still clearly present (Figures 1B and 1C). Tgfb2 is expressed in the notochord at 12 hpf, 20 hpf, and 24 hpf (Figures 1D and S1D), and tgfb3 is expressed in the notochord and in the 3–4 anterior-most somites from 12 hpf to 20 hpf and also in ECs in the head (Figures 1E and S1E). From 20 hpf onward, tgfb3 was found in the dorsal tip of the somites, the floorplate, and in the notochord (Figure 1E).
Figure 1.

TGFβ Signaling Components Are Expressed in and around the Embryonic Dorsal Aorta
(A) Expression of tgfbR2 at (i) 18 hpf and (ii–iv) 24 hpf, including the somites, dorsal aorta (DA), and gut. (v–vi) At 30 hpf, expression was confined to the DA, notochord, posterior cardinal vein (PCV), and some of the surrounding mesenchyme.
(B) Expression of tgfb1a in the DA at (i) 20 hpf and (ii, iii) in the DA, PCV, and intersomitic vessels (ISVs) at 24 hpf. At 27 hpf, there was very little expression of tgfb1a remaining in the DA.
(C) tgfb1b is also expressed in the DA (i) at 20 hpf and in the DA and PCV at (ii) 24 hpf and (iii) 27 hpf. (iv, v) Transversal sections show tgfb1b expression at 24 hpf in the DA and PCV. (vi) Tgfb1b was still apparent in the DA and PCV by 27 hpf.
(D) Expression of tgfb2 at (i) 20 hpf and (ii) 24 hpf. Notochord-specific expression was found throughout all the stages analyzed.
(E) Expression of tgfb3 at (i) 20 hpf, (ii) 24 hpf, and (iii) 27 hpf. (iv, v) Transversal section at 24 hpf, showing expression in the dorsal tip of the somites, notochord, and floorplate. (vi) Expression in the notochord and floorplate was maintained at 27 hpf. Note that tgfb3 is absent from the DA.
g, gut; dt, dorsal tip of the somite; fp, floorplate; isv, intersomitic vessel; n, notochord; nt, neural tube; som, somite. See also Figure S1.
TGFβ Signaling through TgfβR2 Is Required for the Specification of HSPCs
To investigate whether TGFβ signaling is required for the specification of HSPCs, we designed an antisense morpholino oligonucleotide (MO) targeting the start site of tgfbR2 translation (tgfβR2MO1; Figure S2A) and verified that it decreased TgfβR2 protein levels at 26 hpf (Figure S2B). TgfbR2 morphants showed a severe decrease in expression of runx1, gfi1aa, and gata2b, two other HE markers (Butko et al., 2015, Cooney et al., 2013), at 26–28 hpf (Figures 2A–2F), suggesting that HSPC emergence is impaired. Specification of the arterial program in the endothelium of the DA by Notch signaling is required for HSPC emergence (Burns et al., 2005, Gering and Patient, 2005). Therefore, we asked if either the endothelial or the arterial programs are affected by loss of TGFβ signaling. We found that the pan-endothelial kdrl and the arterial markers notch3, hey2, and efnb2a were unaffected in tgfβR2 morphants (Figures 2G–2N).
Figure 2.

TGFβ Signaling Is Required for Specification of HSCs
Expression of runx1 in (A) wild-type (wt) and (B) tgfbr2 morphants at 26 hpf. Expression of gfi1aa in (C) wild-type or (D) tgfbr2 morphants at 26 hpf. Expression of gata2b in (E) wild-type or (F) tgfbr2 morphants at 26 hpf.
Expression of the vascular marker kdrl (G, H) and the arterial markers notch3 (I, J), hey2 (K, L), and efnB2A (M, N) is unaffected in tgfbR2 morphants. Maximum projections of itga2b:GFP; Kdrl:HRas-mCherry transgenic embryos at 48 hpf in (O) uninjected and (P) tgfbr2 MO1-injected embryos. Region shown includes part of the DA and white arrowheads denote itga2b:GFP+(green), kdrl:HRas-mCherry+ (magenta) HSPCs.
(Q) HSPC counts in the entire trunk region of uninjected and tgfbR2 morphant itga2b:GFP; Kdrl:HRas-mCherry transgenic embryos at 48 hpf (p value is indicated on the graph, n = 12 (wild-type) and n = 11 (tgfbR2MO1).
itga2b-GFP+ cells are present in the CHT of itga2b:GFP embryos (R, yellow arrowheads) and greatly reduced in the CHT of tgfbR2 morphants at 5 dpf (S). Expression of rag1 in the thymus (red arrowheads) at 4 dpf in (T) wild-type and (U) tgfbR2 morphants. Expression of hbbe1 in the CHT at 4 dpf in (V) wild-type and (W) tgfbR2 morphants.
The numbers of embryos are shown in each panel as the number of embryos with phenotype/total number analyzed. See also Figure S2.
HSPCs emerging from the DA express kdrl and low levels of itga2b (also known as CD41) in itga2b:GFP;Kdrl:HsRas-mCherry transgenic embryos (Kissa et al., 2008). To quantitate the loss of HSPCs in tgfbR2 morphants, we counted the number of Kdrl-mCherry+;itga2b-GFPlow HSPCs in the DA of live itga2b:GFP;Kdrl:HsRas-mCherry transgenic embryos by confocal microscopy at 48 hpf (Figures 2O–2Q). In tgfbR2 morphants, the number of Kdrl-mCherry+;itga2b-GFPlow HSPCs was reduced more than 2-fold compared with uninjected embryos (Figure 2Q). The loss of itga2b-GFPlow cells in tgfbR2 morphants was still evident at 5 dpf (Figures 2R and 2S) and, consistent with this, we found that the expression of the HSPC markers runx1, cmyb, and ikzf1 was severely downregulated in tgfbR2 morphants at 48 hpf (Figure S2D). cmyb, ikzf1, and l-plastin (pan-leukocyte marker) were severely reduced in the CHT and in the thymus at 4 dpf (Figures S2E and S2F). Expression of the early T cell marker rag1 in the thymus (Figures 2T and 2U) and the erythroid marker hbbe1 in the CHT (Figures 2V and 2W) were also severely reduced. Taken together, these experiments indicate that TGFβ signaling is required for the specification of HSPCs.
We designed a second MO, tgfbR2MO2 that blocks splicing of exon 4 of tgfβR2 (Figure S2A), and confirmed the results obtained with tgfbR2MO1 (Figure S2G). Neither the pan-endothelial marker fli1 nor the arterial markers dll4 and dlC were affected in tgfbR2MO1 and tgfbR2MO2 morphants (Figure S2G). To examine whether TGFβ signaling is also required for primitive hematopoiesis, we performed in situ hybridization for scl, gata1, and pu.1 at 20 hpf (Figure S2H) and gata1 and pu.1 at 24 hpf (Figure S2I). TgfbR2 morphants showed no significant change in expression of these markers, suggesting that specification of primitive hematopoietic cells does not require TGFβ signaling through TgfβR2. However, maturation of primitive erythrocytes was slightly impaired, as suggested by a small decrease in o-dianisidine staining in tgfbR2 morphants at 36 hpf (Figure S2J).
Taken together, our data show that TGFβ signaling through TgfβR2 is required for the specification of HSPCs independently of arterial programming.
TGFβ1 in the Arterial Endothelium and TGFβ3 from the Notochord Are Required for HSPC Emergence
Tgfβ1−/− and TgfβR2−/− mouse mutants share a similar vasculogenic phenotype in the yolk sac (Dickson et al., 1995, Oshima et al., 1996); thus we reasoned that TGFβ1 was the likeliest ligand for TgfbR2 in HSPC emergence. To test this hypothesis, we knocked down tgfb1a or tgfb1b with at least two splice-blocking morpholinos for each (Figures S3A–S3F) and found partial loss of runx1 and cmyb in the DA without affecting expression of the arterial marker dll4 (Figure S3F and data not shown). Co-injection of half the amounts of tgfb1aMO2 and tgfb1bMO2 (7.5 + 10 ng, respectively, referred to as tgfb1MO2) induced a severe loss of runx1 and cmyb expression in a higher proportion of embryos at 28 hpf when compared with single tgfb1a or tgfb1b morphants (Figures 3A, S3E, and S3F; and results not shown), suggesting that, in single morphants, the TGFβ1 ligands can partially compensate for the other's absence and that both are required for HSPC emergence. Knocking down tgfb2 with a splice-blocking morpholino (tgfb2MO3; Figure S3G) had very little effect on runx1 expression (Figure 3A), whereas over half (28/50) of the tgfb3 morphants (tgfb3MO2, Figure S3H) showed a severe decrease in runx1 in the DA at 28 hpf (Figure 3A). Expression of kdrl in the endothelium and dll4 and dlC in the arterial endothelium was unaffected in tgfb1MO2, tgfb2MO3, or tgfb3MO2 morphant embryos (Figures 3B–3D), consistent with TGFβ signaling being required for HSPC specification but not for arterial programming. To quantitate the effect, we counted the number of Kdrl-mCherry+;itga2b-GFPlow HSPCs at 48 hpf (Figures 3E–3H). Both tgfb1MO2 and tgfb3MO2 morphants showed severely reduced numbers of HSPCs when compared with uninjected embryos. tgfb3MO2 morphants had fewer HSPCs than tgfb1MO2 morphants at 48 hpf (Figure 3H), which correlated with a stronger decrease in rag1 expression in the thymus of tgfb3MO2 morphants at 4 dpf (Figures 3I–3K). Further analysis revealed that expression of the arterial marker efnB2a was unaffected, whereas that of the HE marker gata2b was reduced in tgfb1MO2 and in half of the tgfb3MO2 embryos (Figures 3L and 3M). Next we investigated whether the milder phenotype in tgfb3 morphants was due to upregulation of Tgfb1. We found that tgfb3 was essentially absent in tgfb3MO2 morphants but tgfb1a or tgfb1b expression was unaffected (Figure S3I). Conversely, tgfb1 morphants showed increased tgfb3 expression in the notochord (Figure S3I). Knocking down tgfb1 in tgfb3 morphants increased the percentage of embryos with reduced runx1 expression from 50% to 85% (Figures S3J and S3K), suggesting that Tgfβ1 and Tgfβ3 have an additive effect on HSPC specification. Taken together, we conclude that Tgfβ1a/1b produced by the ECs of the DA are required for HSPC formation by programming the HE downstream or in parallel to arterial programming. In addition, there is a significant paracrine contribution by Tgfβ3, which becomes a more important regulator of HSPC generation between 28 and 48 hpf.
Figure 3.

TGFβ1 and TGFβ3 Are Required for Specification of HSCs
(A) Expression of runx1 in wild-type, tgfb1, tgfb2, and tgfb3 morphants.
(B) Expression of kdrl in wild-type, tgfb1, tgfb2, and tgfb3 morphants.
(C) Expression of dll4 in wild-type, tgfb1, tgfb2, and tgfb3 morphants.
(D) Expression of dlC in wild-type, tgfb1, tgfb2, and tgfb3 morphants. All samples were analyzed at 28 hpf.
(E–G) Maximum projections of itga2b:GFP; Kdrl:HRas-mCherry transgenic embryos in (E) uninjected, (F) tgfb1 morphants, and (G) tgfb3 morphants at 48 hpf. The images show part of the trunk DA and white arrowheads denote itga2b:GFP+ (green), kdrl:HRas-mCherry+ (magenta) HSPCs.
(H) HSPCs counts in the entire trunk region of uninjected, tgfb1, and tgfb3 morphant itga2b:GFP; Kdrl:HRas-mCherry transgenic embryos at 48 hpf (p value is indicated on the graph, n = 10 for each of the conditions).
(I–K) Expression of rag1 in the thymus at 4 dpf (red arrowheads) in (I) wild-type, (J) tgfb1 morphants, and (K) tgfb3 morphants.
(L) Expression of efnB2a in wild-type, tgfb1, and tgfb3 morphants.
(M) Expression of gata2b in wild-type, tgfb1, and tgfb3 morphants. The numbers of embryos are shown in each panel as the number of embryos with phenotype/total number analyzed.
See also Figure S3.
Vegf Signaling Regulates Expression of the tgfb1a and tgfb1b Ligands in the Dorsal Aorta
The sequential activity of VegfA and Notch is required for programming the DA endothelium to become arterial and give rise to HSPCs (Burns et al., 2005, Gering and Patient, 2005, Leung et al., 2013). Because our data suggest that the requirement for TGFβ lies downstream or parallel to arterial programming by Notch signaling (Figures 1, 2, and 3), we asked whether Vegf or Notch signaling might act as upstream transcriptional regulators of TGFβ ligands. To address this, we treated wild-type embryos after gastrulation with selective inhibitors for Vegf (DMH4, 20 μM) and Notch signaling (DAPM, 100 μM) (Hao et al., 2010, Walsh et al., 2002) and examined the expression of tgfb1a, tgfb1b, tgfb3, and tgfbR2 (Figure 4). DMH4-treated embryos failed to form intersomitic vessels as expected (Bahary et al., 2007) and showed diminished kdrl expression in the trunk vasculature when compared with DMSO-treated controls (Figure 4A). The DAPM treatment had no effect on kdrl expression (Figure 4A). Blocking either Vegf or Notch signaling led to loss of runx1 from the floor of the DA by 28 hpf, as described (Burns et al., 2005, Gering and Patient, 2005, Lam et al., 2010) (Figure 4B). To ask whether the loss of kdrl expression upon inhibition by DMH4 was due to transcriptional regulation by Vegf, we repeated the experiment in Tg(Fli1:EGFP) embryos. We confirmed that intersomitic vessels were absent but trunk ECs were still present in DMH4-treated embryos (Figure 4C). Analysis by qPCR showed that kdrl was decreased in DMH4-treated Fli-EGFP+ ECs (Figure 4D). Strikingly, inhibition by DMH4 led to decreased tgfb1a and tgfb1b in the endothelium, whereas DAPM treatment had no obvious effect (Figures 4D and 4E). Tgfb3 and tgfbR2 were unaffected by either treatment, suggesting that only tgfb1a and tgfb1b are Vegf-dependent. These results were confirmed by morpholino knockdown of the Vegf receptors, kdr and kdrl (Figure S4A). Next we asked whether Wnt16 and BMP4, which are required for HSPC formation independently of Vegf or Notch signaling in the endothelium (Clements et al., 2011, Wilkinson et al., 2009), could be upstream regulators of TGFβ. Knocking down either Wnt16 or BMP4 had no effect on TGFβ ligand or receptor expression (Figure S4B). Thus, we conclude that Vegf signaling is an upstream regulator of TGFβ signaling by positively regulating expression of tgfb1a and tgfb1b in ECs (Figure 4F) before HSPC specification.
Figure 4.

Vegf Signaling Is Required for tgfb1a and tgfb1b Expression in the Dorsal Aorta
(A and B) Wild-type embryos were treated from 10 hpf with DMSO (control), Vegf inhibitor DMH4 (20 μM), and Notch inhibitor DAPM (100 μM) and collected at 22 hpf or 28 hpf. Embryos were collected and analyzed for (A) kdrl expression at 22 hpf and (B) runx1 expression at 28 hpf.
(C) Tg(Fli1:EGFP) embryos were treated from 10 to 26 hpf with DMSO or DMH4 (20 μM). DMH4-treated embryos showed a severe loss of intersomitic vessels but ECs are still present in the trunk, and circulation was detected in a majority of embryos at 48 hpf (data not shown).
(D) Expression of kdrl, tgfb1a, tgfb1b by qPCR in 26 hpf sorted Fli1:EGFP+ ECs. All three genes were downregulated after DMH4 treatment. Results are shown as averages ± SD of 4–5 biological replicates.
(E) Wild-type embryos were treated from 10 hpf with DMSO (control), Vegf inhibitor DMH4 (20 μM), and Notch inhibitor DAPM (100 μM) and collected at 22 hpf for analysis of tgfb1a, tgfb1b, tgfb3, and tgfbR2 by in situ hybridization at 22 hpf.
(F) Schematic representation of the experimental results.
Black arrows indicate the location of the DA; yellow arrowheads indicate the location of runx1 expression in the floor of the DA. The numbers of embryos are shown in each panel as the number of embryos with phenotype/total number analyzed. Arterial EC, arterial endothelial cell.
See also Figure S4.
The Notch Ligand Jag1a Is a Downstream Target of TGFβ Signaling in Endothelial Cells
Formation of HSPCs requires many cell extrinsic and intrinsic factors (ligands, receptors, transcription factors, and chromatin modifiers). Thus, to investigate whether any of the known pathways required to specify HSPCs are regulated by TGFβ signaling, we used the NanoString gene quantitation system (Geiss et al., 2008). We designed a custom panel of 132 NanoString probes that included Vegf, Notch, BMP, Wnt, Hh, and TGFβ signaling pathway components or targets. The probe set also contained known blood and endothelial genes, cell-cycle and apoptosis genes, mediators of EMT, and six housekeeping genes for data normalization. To assess expression changes in the somites as well as in the endothelium, we dissected the trunks of wild-type and tgfbR2 morphant embryos at 26 hpf and isolated total RNA to hybridize against the NanoString probe set (Figure 5A). Only nine of the genes probed showed statistically significant differences in expression (p < 0.05 and an absolute logFC >0.5) between wild-type and tgfbR2 morphants, importantly including decreased runx1 expression in the morphants (Figure 5B and Table S1). Applying a more stringent filtering (false discovery rate <0.1) yielded a smaller high-confidence subset of differentially expressed genes in tgfbR2 morphants (Figure 5C). Five of six genes in this subset were upregulated and three of those, p53, cdkn1a, bax, are associated with apoptosis and cell-cycle arrest (Menendez et al., 2009). A fourth gene, rspo1, is an agonist of Wnt signaling that is required for sprouting angiogenesis (Gore et al., 2011) and is expressed at very low levels in wild-type embryos (Table S1). Taz, a Wnt signaling mediator (Azzolin et al., 2012), was also upregulated in our assay, suggesting a link between TGFβ and Wnt signaling. However, when we sorted kdrl:GFP+ ECs versus kdrl:GFP− cells from control embryos and tgfbR2 morphants (Figure 5D), we found no significant difference in rspo1 expression by qPCR in either population (Figures 5E and 5F). Analysis of p53, cdkn1a, and bax expression by qPCR showed that only p53 and cdkn1a were significantly upregulated in ECs (Figure 5E), whereas all three were upregulated in kdrl:GFP− cells (Figure 5F). These results suggested that tgfbR2 morphants might show increased apoptosis. Thus we performed a TUNEL assay for apoptotic cells in Kdrl:GFP transgenic embryos and found a marked increase in TUNEL+ (apoptotic) cells in the trunk and tail regions of 30 hpf tgfbR2 morphants compared with control embryos (Figures 5G and 5H). We found increased apoptosis in ECs in the tail vascular plexus (Figure 5H′, white arrows) but not in the trunk vasculature (Figure 5H) where HSPCs arise. Thus, if p53 and its targets cdkn1a and bax play a role in HSC specification downstream of TGFβ, it appears to be independent of their pro-apoptotic activity. The increase in p53 could have been non-specific due to the injection of MOs, as previously reported (Robu et al., 2007). However, knocking down runx1 also led to an increase in p53, cdkn1a, and baxa (Figure S5K). This raises the possibility that the increase in pro-apoptotic gene expression in tgfbR2 morphants could be indirect, acting downstream of Runx1.
Figure 5.

Multiplex Analysis of Gene Expression Shows that jag1a Is a Downstream Target of TGFβ Signaling
(A) Schematic representation of the trunk dissection experiment for isolation of mRNA for hybridization with the NanoString Probe CodeSet. Six groups of independent wild-type (wt1–6) and tgfbR2MO1-injected embryos (mo1-6) were used in this analysis.
(B) Volcano plot depicting differential gene expression between wild-type and tgfbR2 morphants in log2-fold change with a significance level of p < 0.05. Vertical broken lines limit the absolute logFC larger than 0.5-fold change range, whereas the horizontal broken line represents the false discovery rate (FDR) threshold set at FDR < 0.1. The genes where FDR < 0.1 are shown as orange dots. The size of the dots is proportional to mRNA expression levels.
(C) Hierarchical clustering of genes expressed with FDR < 0.1 in each of the six biological replicates analyzed (wild-type, wt1 to wt6; tgfbR2MO1, mo1 to mo6). Results are normalized and presented as Z scores from −2 (downregulated) to 2 (upregulated).
(D) Schematic representation of the sorting of kdrl:GFP+ cells in wild-type and tgfbR2 morphants (MO) by fluorescence-activated cell sorting to isolate mRNA and validate the NanoString results by qPCR.
(E and F) qPCR of p53, cdkn1a, rspo1, and bax in (E) kdrl:GFP+ cells and (F) kdrl:GFP− cells of wild-type and tgfbR2 morphants (MO) at 28 hpf. Taz was omitted from the analysis as its fold induction <2.
(G and G′) TUNEL-stained apoptotic cells in uninjected (control) kdrl:GFP embryos at 30 hpf.
(H and H′) Apoptotic cells in tgfbR2MO1-injected kdrl:GFP embryos at 30 hpf. White arrows, apoptotic endothelial cells; outline arrows, apoptotic non-endothelial cells.
(I and J) qPCR for jag1a in (I) kdrl:GFP− cells and (J) in kdrl:GFP+ cells at 28 hpf.
Strikingly, jag1a was the only gene besides runx1 that was significantly downregulated in tgfbR2 morphants (Figures 5B and 5C). Neither its paralog jag1b nor any of the other Notch ligands or receptors in the probe set were significantly affected by loss of TGFβ signaling (Figure S5A). To confirm that jag1a was downregulated in the absence of TGFβ signaling, we injected tgfbR2MO1 into Kdrl:GFP embryos, sorted GFP+ ECs and GFP− cells, and assayed jag1a expression by qPCR. jag1a was downregulated in both populations (Figures 5I and 5J). dll4 and gata2a expression was unaltered in ECs from tgfbR2 morphants (Figure S5L), confirming the NanoString results. To determine which TGFβ ligand regulates jag1a, we assayed its expression in tgfb1MO2 and tgfb3MO2 morphants compared with wild-type embryos at 26 hpf. Jag1a was downregulated in both tgfb1MO2 and tgfb3MO2 morphants (Figure S5M). Moreover, tgfb1MO2 and tgfb3MO2 morphants showed increased p53 and no effect on gata2a or dll4 expression (Figure S5N). Thus, our data indicate that jag1a is a TGFβ target in the endothelium at the onset of HSPC specification and suggest that both TGFβ1 and TGFβ3 contribute to the expression of jag1a.
Jag1a Is Required Downstream of TGFβ to Program the HE
To determine if Jag1a is required for arterial programming or HSPC specification in zebrafish, we knocked down jag1a with a specific morpholino (Yamamoto et al., 2010) and found no obvious defects in arterial programming compared with wild-type embryos (Figure 6A). However, expression of the HSPC markers runx1, cmyb, and gfi1aa was severely downregulated in jag1a morphants at 28 hpf (Figure 6B). Furthermore, itga2b:GFP+ HSPCs were nearly absent in the CHT of jag1a morphants by 48 hpf (Figure 6C) suggesting that the HE was mis-programmed and failed to give rise to HSPCs in the absence of Jag1a. A recent study showed that jag1a is regulated by TNFα through the TnfR2 receptor in ECs (Espin-Palazon et al., 2014). Expression of tnfR2 in ECs was unaffected in tgfbR2 morphants (Figure S6), suggesting that TGFβ does not regulate jag1a indirectly via regulation of tnfr2. To determine if Jag1a is the main target of TGFβ signaling in HSPC specification, we restored Jag1a expression specifically in the endothelium of tgfbr2MO1 morphants using a Kdrl:jag1a construct. Wild-type embryos overexpressing jag1a in ECs showed little effect on expression of runx1 or cmyb at 28 hpf (Figures 6D and 6E). However, forced expression of jag1a in the endothelium of tgfbR2 morphants rescued the loss of runx1 and cmyb expression (Figures 6D and 6E), confirming that the hematopoietic defects in tgfbR2 morphants are mainly due to loss of jag1a. We conclude that autocrine TGFβ1 and paracrine TGFβ3 signal to the endothelium through TgfβR2, inducing jag1a expression, which in turn induces HE programming and HSPC emergence.
Figure 6.

Jag1a Is Required Downstream of TGFβ Signaling for HSC Specification
(A) Expression of arterial markers in jag1aMO is unaffected when compared to wild-type embryos.
(B) Expression of runx1, cmyb, and gfi1aa in wild-type and jag1a morphants (MO) at 28 hpf. All the markers analyzed are reduced or absent in jag1a morphants. Red arrowheads indicate the remaining gene expression in the floor of the DA of jag1a morphants.
(C) HSPCs (yellow arrowheads) are severely reduced in the CHT of itga2b:GFP;Kdrl:HsRas-mCherry transgenic embryos at 48 hpf injected with the jag1aMO. Itga2b:GFP+ cells, magenta; Kdrl-HsRas:mCherry+ cells, green.
(D) Overexpression of jag1a with a Kdrl:jag1-V5 construct partially rescues the loss of runx1 and cmyb in the floor of the DA. 15 pg of the construct was used for this experiment. The numbers of embryos are shown in each panel as the number of embryos with phenotype/total number analyzed.
(E) Quantitation of the rescue effect observed in (D).
See also Figure S6.
Discussion
TGFβ Is a Regulator of HSPC Specification in the Embryo
We have demonstrated a critical role for TGFβ signaling in the specification of HSPCs. Our data show that knockdown of the type II receptor for TGFβ leads to the loss of HSPCs and their differentiated progeny. Cell-autonomous Notch signaling is required for the programming of arterial identity in the endothelium (Quillien et al., 2014) and failure to acquire this identity, through the absence of Notch signaling or Hey2, leads to loss of HSPCs (Gering and Patient, 2010, Kim et al., 2014, Rowlinson and Gering, 2010). However, recent publications suggest that arterial identity is not an absolute requirement for HE specification and HSPC emergence (Ditadi et al., 2015, Jang et al., 2015). Here we show that neither Hey2 nor the Notch pathway components that program the artery are affected by the absence of TGFβ signaling, whereas the HE markers gata2b, runx1, and gfi1aa are strongly downregulated. Thus, we propose that TGFβ functions independently of arterial development to program the arterial ECs to become hemogenic.
Parallel Activation of Notch and TGFβ Signaling by Vegf Programs the HE
Vegf and TGFβ are important regulators of vasculogenesis and angiogenesis in both embryonic development and cancer progression (Holderfield and Hughes, 2008), and crosstalk between them has been demonstrated, mainly through regulation of vegfA by TGFβ (Massague and Gomis, 2006). Here we show the opposite: expression of tgfb1a and tgfb1b ligands is dependent on VegfA signaling through its receptors Kdr and Kdrl. Vegf also regulates the expression of hey2, notch3, and notch1b, which are required for arterial programming (Gering and Patient, 2005, Lawson et al., 2002, Rowlinson and Gering, 2010). Thus, we propose that HSPC emergence requires parallel activation of both pathways by Vegf, where Notch signaling provides the arterial identity and TGFβ programs the endothelium to become hemogenic.
TGFβ and Notch Crosstalk in EHT: Similarities to Epithelial-to-Mesenchymal Transition
Because tgfbR2 is expressed in the DA prior to HSC specification (Figures S1 and S2), we propose that TGFβ ligands act directly on ECs, resulting in jag1a activation. Jag1a then activates the Notch receptor, presumably Notch1a (Espin-Palazon et al., 2014), and the signal-receiving cell becomes hemogenic by expressing specific markers such as gata2b, runx1, and gfi1aa. Loss of TGFβ signaling would therefore prevent HE from being specified by the Jag1a/Notch1a interaction. Thus, the concerted activities of TGFβ and Notch signaling explain how only some of the ECs in the floor of the aorta are programmed to become hemogenic. Interestingly, jag1 expression is also induced by TGFβ prior to EMT and is required for epithelial cells to progress to the mesenchymal fate in oncogenic transformation (Zavadil et al., 2004). In development, the cardiac cushion arises by an endothelial-to-mesenchymal transition (EndoMT) and this is also dependent on crosstalk between TGFβ and Notch signaling (Lamouille et al., 2014). Thus, this crosstalk between TGFβ and Notch signaling is a shared feature between EMT, EndoMT, and EHT. The similarity between these processes may guide future studies on the molecular and cellular basis of EHT.
TGFβ1a, TGFβ1b, and TGFβ3 Are Required Sequentially to Generate HSPCs
Genetic studies in mice suggested that paracrine TGFβ is primarily required to recruit smooth muscle cells to the endothelium (Pardali et al., 2010). In addition, autocrine signaling in ECs is important to regulate proliferation and migration (Pardali et al., 2010). Thus, TGFβ acts both in an autocrine and paracrine fashion in vivo. Similarly, here we describe two independent sources of TGFβ ligands that are required for HSPC specification: TGFβ1a and TGFβ1b in the endothelium, and TGFβ3 from the neighboring notochord. Our data suggest that TGFβ3 is less important for programming of HE but may instead play a more important role in the EHT process. In agreement with this, in situ hybridization for HSPC derivatives at 4 dpf showed a more severe phenotype in tgfb3 morphants than in tgfb1 morphants. That TGFβ3 has a role in hematopoiesis was surprising because mouse TGFβ3 mutants have no described hematopoietic phenotypes (Goumans and Mummery, 2000). However, TGFβ3−/− mouse embryos show loss of palatal fusion due to defective EMT (Kaartinen et al., 1995, Proetzel et al., 1995). TGFβ3 induces EMT in palate epithelial cells by downregulating E-cadherin and upregulating fibronectin and vimentin (Nawshad et al., 2007). This raises the possibility that TGFβ may be required sequentially to generate HSPCs: TGFβ1 is required for the initial HE programming, and then TGFβ3 modulates expression of extracellular matrix components to allow HE cells to undergo EHT.
Knowledge of how ECs are programmed to become HSCs is critical to inform attempts to generate these cells in vitro for therapeutic purposes. Our findings show that TGFβ signaling is required to program the HE that will give rise to HSPCs. By contrast, we have previously shown that in Xenopus laevis excessive TGFβ signaling blocks specification of the hemangioblast population that precedes the formation of HE (Nimmo et al., 2013). Similarly, adding TGFβ2 to Pre-HPCs, a population of primitive hematopoietic precursor cells (Ve-Cad+, CD41+), impairs the EHT process in vitro (Vargel et al., 2016). This suggests that primitive hematopoiesis is sensitive to elevated levels of TGFβ signaling. Whether excessive TGFβ hinders EHT from the embryonic HE that gives rise to definitive HSPCs remains to be determined. Our work highlights the importance of identifying the different spatial and temporal requirements for TGFβ signaling in the formation of HSCs and will help to realize the goal of generating HSCs in vitro for regenerative medicine.
Experimental Procedures
Ethics Statement
All animal experiments were performed under a Home Office Licence according to the Animals Scientific Procedures Act 1986, UK, and approved by the local ethics committee.
Fish Breeding and Maintenance
Wild-type, Tg(kdrl:GFP)s843 (Jin et al., 2005), Tg(itga2b:GFP)la2 (Lin et al., 2005), Tg(Kdrl-HsRas-mCherry)s896 (Bertrand et al., 2010), Tg(Fli1-GFP)y1Tg (Lawson and Weinstein, 2002), and Tg(cmyb:GFP)zf169Tg (North et al., 2007) fish were bred, maintained, and staged as described (Westerfield, 2000). Tg(itga2b:gfp; Kdrl-HsRas-mCherry) animals were generated by natural mating.
Morpholinos and RNA and DNA Injections
Antisense MOs (GeneTools) were used to target runx1 (Gering and Patient, 2005), tgfβ3 (tgfb3MO2) (Cheah et al., 2010), kdr + kdrl (Bahary et al., 2007), and jag1a (Yamamoto et al., 2010) at the amounts specified. The MOs selected for this study were tgfbR2MO1, tgfb1aMO2 + tgfb1bMO2 (referred to as tgfb1MO2), tgfb2MO2, and tgfb3MO2 at the amounts indicated (see Supplemental Experimental Procedures). Typically, 1 nl total volume of MO was injected in 1–4 cell stage embryos. MO design and validation is described in the Supplemental Experimental Procedures.
To rescue the loss of HSC markers in tgfbR2 morphants, we transiently expressed jag1a in ECs under the control of the Kdrl promoter (Jin et al., 2005) (see Supplemental Experimental Procedures). The amount of DNA used for the rescue experiment is shown in the figure legends.
Western Blotting
Protein extracts were prepare as described (Link et al., 2006). TgfβR2 protein was detected by a primary anti-tgfβR2 antibody (diluted 1:250 in blocking solution, sc-17792; Santa Cruz Biotechnology) followed by a goat anti-mouse horseradish peroxidase (HRP)-conjugated secondary antibody (1:1,000 in blocking solution, P044701-2, DAKO). An anti β-actin-HRP-conjugated antibody (1:35,000, A3854; Sigma) was used for loading control.
NanoString Expression Analysis
To quantitate the effects of tgfβR2 loss of function in and around the embryonic DA, trunks from anesthetized 26–28 hpf embryos were microdissected with a straight stab knife. Total RNA was isolated with the RNEasy Micro kit (QIAGEN) following the manufacturer's instructions and quantified in a Nanodrop spectrometer. We interrogated expression of a panel of 132 probes (see Supplemental Experimental Procedures) using the NanoString nCounter gene expression system.
mRNA Extraction, Flow Cytometry, cDNA Synthesis, and qPCR
Total RNA was isolated from wild-type or morpholino-injected embryos using TRI reagent (Sigma) and cleaned using the RNEasy Micro kit (QIAGEN) following the manufacturer's instructions. To interrogate gene expression in ECs of tgfβR2 morphants, uninjected and tgfβR2 MO1-injected Tg(kdrl:gfp) embryos were dissociated, and kdrl-GFP+ cells were isolated and processed for mRNA extraction with the RNEasy Micro kit (QIAGEN) as described (Monteiro et al., 2011). cDNA was synthesized from total RNA using a Superscript III RT-PCR enzyme (Invitrogen) following the manufacturer's instructions. The primers used for quantitative real-time PCR (qPCR) are shown in the Supplemental Experimental Procedures. Fold changes in gene expression were calculated using the 2−ΔΔCτ method (Livak and Schmittgen, 2001) and normalized to a geometric mean of bactin2 and ef1a.
In Situ Hybridization, Sections, and Image Acquisition
Whole-mount in situ hybridization was carried out as described (Jowett and Yan, 1996). cDNA fragments for tgfβR2, tgfβ1a, tgfβ1b, and tgfβ3 were PCR-amplified from 24 hpf embryo cDNA, cloned into pGEMT-Easy, and used as templates to generate in situ hybridization probes (see Supplemental Experimental Procedures). After in situ hybridization, embryos were processed and imaged as described (Gering and Patient, 2005, Monteiro et al., 2011).
Fluorescence Imaging and Image Processing
HSPCs express low levels of a GFP transgene under the control of the itga2b promoter (Kissa et al., 2008). Itga2b:GFPlow, kdrl:HsRas-mCherry+ HSPCs were imaged in uninjected and morpholino-injected Tg(itga2b:GFP; Kdrl:HsRas-mCherry) embryos at 48 hpf on a Zeiss LSM780 confocal microscope (Zen software). HSPCs were enumerated in maximum intensity projection images. GraphPad Prism software was used to generate scatterplots of cell counts and for statistical analysis. Alternatively, Tg(itga2b:GFP) embryos were imaged on a Zeiss Lumar V.12 stereomicroscope with an AxioCam MRm (Zeiss) and AxioVision software.
Apoptosis staining was performed with the Click-IT TUNEL Alexa 594 kit (C10246; Life Technologies) followed by immunostaining against GFP (see Supplemental Experimental Procedures).
Images were processed and figures and schemes were assembled in Adobe Photoshop CS5 and Adobe Illustrator CS5.
Author Contributions
R.M. performed most experiments and analyzed the data; T.P., P.P., J.K., N.J., F.B., and A.K. performed experiments and analyzed the data; E.R. analyzed the NanoString data and performed statistical analysis; R.M. and R.P. conceived experiments, wrote the manuscript and secured funding.
Acknowledgments
This research was funded by the British Heart Foundation (BHF Oxford CoRE Fellowship to R.M., BHF IBSR Fellowship FS/13/50/30436 to R.M., and a BHF Project Grant to J.K. and R.P. PG/14/39/30865), by the MRC (P.P., T.P., A.K., and R.P.), and by a Wolfson/Royal Society Merit Award (R.P.). We thank Maggie Walmsley for critical reading of the manuscript. We are very grateful to the staff of the Biomedical Services Unit for excellent fish husbandry. We thank Kevin Clark and Sally-Ann Clark for cell sorting. The flow cytometry facility is supported by the MRC HIU, MRC MHU (MC_UU_12009), NIHR Oxford BRC and John Fell Fund (131/030 and 101/517), the EPA fund (CF182 and CF170), and WIMM Strategic Alliance awards G0902418 and MC_UU_12025. We thank Christoffer Lagerholm for help with imaging. The Wolfson Imaging Centre Oxford is supported by the MRC via the WIMM Strategic Alliance (G0902418), the Molecular Haematology Unit (MC_UU_12009), the Human Immunology Unit (MC_UU_12010), the Wolfson Foundation (grant 18272), and an MRC/BBSRC/EPSRC grant (MR/K015777X/1) to MICA – Nanoscopy Oxford (NanO): Novel Super-resolution Imaging Applied to Biomedical Sciences, Micron (107457/Z/15Z). The facility was supported by WIMM Strategic Alliance awards G0902418 and MC_UU_12025.
Published: August 4, 2016
Footnotes
Supplemental Information includes Supplemental Experimental Procedures, six figures, and one table and can be found with this article online at http://dx.doi.org/10.1016/j.devcel.2016.06.024.
Contributor Information
Rui Monteiro, Email: rui.monteiro@imm.ox.ac.uk.
Roger Patient, Email: roger.patient@imm.ox.ac.uk.
Supplemental Information
References
- Azzolin L., Zanconato F., Bresolin S., Forcato M., Basso G., Bicciato S., Cordenonsi M., Piccolo S. Role of TAZ as mediator of Wnt signaling. Cell. 2012;151:1443–1456. doi: 10.1016/j.cell.2012.11.027. [DOI] [PubMed] [Google Scholar]
- Bahary N., Goishi K., Stuckenholz C., Weber G., Leblanc J., Schafer C.A., Berman S.S., Klagsbrun M., Zon L.I. Duplicate VegfA genes and orthologues of the KDR receptor tyrosine kinase family mediate vascular development in the zebrafish. Blood. 2007;110:3627–3636. doi: 10.1182/blood-2006-04-016378. [DOI] [PMC free article] [PubMed] [Google Scholar]
- Bertrand J.Y., Chi N.C., Santoso B., Teng S., Stainier D.Y., Traver D. Haematopoietic stem cells derive directly from aortic endothelium during development. Nature. 2010;464:108–111. doi: 10.1038/nature08738. [DOI] [PMC free article] [PubMed] [Google Scholar]
- Boisset J.C., van Cappellen W., Andrieu-Soler C., Galjart N., Dzierzak E., Robin C. In vivo imaging of haematopoietic cells emerging from the mouse aortic endothelium. Nature. 2010;464:116–120. doi: 10.1038/nature08764. [DOI] [PubMed] [Google Scholar]
- Burns C.E., Traver D., Mayhall E., Shepard J.L., Zon L.I. Hematopoietic stem cell fate is established by the Notch-Runx pathway. Genes Dev. 2005;19:2331–2342. doi: 10.1101/gad.1337005. [DOI] [PMC free article] [PubMed] [Google Scholar]
- Butko E., Distel M., Pouget C., Weijts B., Kobayashi I., Ng K., Mosimann C., Poulain F.E., McPherson A., Ni C.W. Gata2b is a restricted early regulator of hemogenic endothelium in the zebrafish embryo. Development. 2015;142:1050–1061. doi: 10.1242/dev.119180. [DOI] [PMC free article] [PubMed] [Google Scholar]
- Carvalho R.L., Jonker L., Goumans M.J., Larsson J., Bouwman P., Karlsson S., Dijke P.T., Arthur H.M., Mummery C.L. Defective paracrine signalling by TGFbeta in yolk sac vasculature of endoglin mutant mice: a paradigm for hereditary haemorrhagic telangiectasia. Development. 2004;131:6237–6247. doi: 10.1242/dev.01529. [DOI] [PubMed] [Google Scholar]
- Challen G.A., Boles N.C., Chambers S.M., Goodell M.A. Distinct hematopoietic stem cell subtypes are differentially regulated by TGF-beta1. Cell Stem Cell. 2010;6:265–278. doi: 10.1016/j.stem.2010.02.002. [DOI] [PMC free article] [PubMed] [Google Scholar]
- Cheah F.S., Winkler C., Jabs E.W., Chong S.S. Tgfbeta3 regulation of chondrogenesis and osteogenesis in zebrafish is mediated through formation and survival of a subpopulation of the cranial neural crest. Mech. Dev. 2010;127:329–344. doi: 10.1016/j.mod.2010.04.003. [DOI] [PubMed] [Google Scholar]
- Chen M.J., Yokomizo T., Zeigler B.M., Dzierzak E., Speck N.A. Runx1 is required for the endothelial to haematopoietic cell transition but not thereafter. Nature. 2009;457:887–891. doi: 10.1038/nature07619. [DOI] [PMC free article] [PubMed] [Google Scholar]
- Ciau-Uitz A., Monteiro R., Kirmizitas A., Patient R. Developmental hematopoiesis: ontogeny, genetic programming and conservation. Exp. Hematol. 2014;42:669–683. doi: 10.1016/j.exphem.2014.06.001. [DOI] [PubMed] [Google Scholar]
- Clements W.K., Kim A.D., Ong K.G., Moore J.C., Lawson N.D., Traver D. A somitic Wnt16/Notch pathway specifies haematopoietic stem cells. Nature. 2011;474:220–224. doi: 10.1038/nature10107. [DOI] [PMC free article] [PubMed] [Google Scholar]
- Cooney J.D., Hildick-Smith G.J., Shafizadeh E., McBride P.F., Carroll K.J., Anderson H., Shaw G.C., Tamplin O.J., Branco D.S., Dalton A.J. Teleost growth factor independence (gfi) genes differentially regulate successive waves of hematopoiesis. Dev. Biol. 2013;373:431–441. doi: 10.1016/j.ydbio.2012.08.015. [DOI] [PMC free article] [PubMed] [Google Scholar]
- de Bruijn M.F., Ma X., Robin C., Ottersbach K., Sanchez M.J., Dzierzak E. Hematopoietic stem cells localize to the endothelial cell layer in the midgestation mouse aorta. Immunity. 2002;16:673–683. doi: 10.1016/s1074-7613(02)00313-8. [DOI] [PubMed] [Google Scholar]
- Derynck R., Zhang Y.E. Smad-dependent and Smad-independent pathways in TGF-beta family signalling. Nature. 2003;425:577–584. doi: 10.1038/nature02006. [DOI] [PubMed] [Google Scholar]
- Dickson M.C., Martin J.S., Cousins F.M., Kulkarni A.B., Karlsson S., Akhurst R.J. Defective haematopoiesis and vasculogenesis in transforming growth factor-beta 1 knock out mice. Development. 1995;121:1845–1854. doi: 10.1242/dev.121.6.1845. [DOI] [PubMed] [Google Scholar]
- Ditadi A., Sturgeon C.M., Tober J., Awong G., Kennedy M., Yzaguirre A.D., Azzola L., Ng E.S., Stanley E.G., French D.L. Human definitive haemogenic endothelium and arterial vascular endothelium represent distinct lineages. Nat. Cell Biol. 2015;17:580–591. doi: 10.1038/ncb3161. [DOI] [PMC free article] [PubMed] [Google Scholar]
- Espin-Palazon R., Stachura D.L., Campbell C.A., Garcia-Moreno D., Del Cid N., Kim A.D., Candel S., Meseguer J., Mulero V., Traver D. Proinflammatory signaling regulates hematopoietic stem cell emergence. Cell. 2014;159:1070–1085. doi: 10.1016/j.cell.2014.10.031. [DOI] [PMC free article] [PubMed] [Google Scholar]
- Gama-Norton L., Ferrando E., Ruiz-Herguido C., Liu Z., Guiu J., Islam A.B., Lee S.-U.U., Yan M., Guidos C.J., López-Bigas N. Notch signal strength controls cell fate in the haemogenic endothelium. Nat. Commun. 2015;6:8510. doi: 10.1038/ncomms9510. [DOI] [PMC free article] [PubMed] [Google Scholar]
- Geiss G.K., Bumgarner R.E., Birditt B., Dahl T., Dowidar N., Dunaway D.L., Fell H.P., Ferree S., George R.D., Grogan T. Direct multiplexed measurement of gene expression with color-coded probe pairs. Nat. Biotechnol. 2008;26:317–325. doi: 10.1038/nbt1385. [DOI] [PubMed] [Google Scholar]
- Gering M., Patient R. Hedgehog signaling is required for adult blood stem cell formation in zebrafish embryos. Dev. Cell. 2005;8:389–400. doi: 10.1016/j.devcel.2005.01.010. [DOI] [PubMed] [Google Scholar]
- Gering M., Patient R. Notch signalling and haematopoietic stem cell formation during embryogenesis. J. Cell Physiol. 2010;222:11–16. doi: 10.1002/jcp.21905. [DOI] [PubMed] [Google Scholar]
- Gore A.V., Swift M.R., Cha Y.R., Lo B., McKinney M.C., Li W., Castranova D., Davis A., Mukouyama Y.S., Weinstein B.M. Rspo1/Wnt signaling promotes angiogenesis via Vegfc/Vegfr3. Development. 2011;138:4875–4886. doi: 10.1242/dev.068460. [DOI] [PMC free article] [PubMed] [Google Scholar]
- Goumans M.J., Mummery C. Functional analysis of the TGFbeta receptor/Smad pathway through gene ablation in mice. Int. J. Dev. Biol. 2000;44:253–265. [PubMed] [Google Scholar]
- Goumans M.J., Valdimarsdottir G., Itoh S., Rosendahl A., Sideras P., ten Dijke P. Balancing the activation state of the endothelium via two distinct TGF-beta type I receptors. EMBO J. 2002;21:1743–1753. doi: 10.1093/emboj/21.7.1743. [DOI] [PMC free article] [PubMed] [Google Scholar]
- Hadland B.K., Varnum-Finney B., Poulos M.G., Moon R.T., Butler J.M., Rafii S., Bernstein I.D. Endothelium and NOTCH specify and amplify aorta-gonad-mesonephros-derived hematopoietic stem cells. J. Clin. Invest. 2015;125:2032–2045. doi: 10.1172/JCI80137. [DOI] [PMC free article] [PubMed] [Google Scholar]
- Hao J., Ho J.N., Lewis J.A., Karim K.A., Daniels R.N., Gentry P.R., Hopkins C.R., Lindsley C.W., Hong C.C. In vivo structure-activity relationship study of dorsomorphin analogues identifies selective VEGF and BMP inhibitors. ACS Chem. Biol. 2010;5:245–253. doi: 10.1021/cb9002865. [DOI] [PMC free article] [PubMed] [Google Scholar]
- Holderfield M.T., Hughes C.C. Crosstalk between vascular endothelial growth factor, notch, and transforming growth factor-beta in vascular morphogenesis. Circ. Res. 2008;102:637–652. doi: 10.1161/CIRCRESAHA.107.167171. [DOI] [PubMed] [Google Scholar]
- Jang I.H., Lu Y.-F.F., Zhao L., Wenzel P.L., Kume T., Datta S.M., Arora N., Guiu J., Lagha M., Kim P.G. Notch1 acts via Foxc2 to promote definitive hematopoiesis via effects on hemogenic endothelium. Blood. 2015;125:1418–1426. doi: 10.1182/blood-2014-04-568170. [DOI] [PMC free article] [PubMed] [Google Scholar]
- Jin S.W., Beis D., Mitchell T., Chen J.N., Stainier D.Y. Cellular and molecular analyses of vascular tube and lumen formation in zebrafish. Development. 2005;132:5199–5209. doi: 10.1242/dev.02087. [DOI] [PubMed] [Google Scholar]
- Jowett T., Yan Y.L. Double fluorescent in situ hybridization to zebrafish embryos. Trends Genet. 1996;12:387–389. doi: 10.1016/s0168-9525(96)90091-8. [DOI] [PubMed] [Google Scholar]
- Kaartinen V., Voncken J.W., Shuler C., Warburton D., Bu D., Heisterkamp N., Groffen J. Abnormal lung development and cleft palate in mice lacking TGF-beta 3 indicates defects of epithelial-mesenchymal interaction. Nat. Genet. 1995;11:415–421. doi: 10.1038/ng1295-415. [DOI] [PubMed] [Google Scholar]
- Kim S.J., Letterio J. Transforming growth factor-beta signaling in normal and malignant hematopoiesis. Leukemia. 2003;17:1731–1737. doi: 10.1038/sj.leu.2403069. [DOI] [PubMed] [Google Scholar]
- Kim A.D., Melick C.H., Clements W.K., Stachura D.L., Distel M., Panakova D., MacRae C., Mork L.A., Crump J.G., Traver D. Discrete Notch signaling requirements in the specification of hematopoietic stem cells. EMBO J. 2014;33:2363–2373. doi: 10.15252/embj.201488784. [DOI] [PMC free article] [PubMed] [Google Scholar]
- Kissa K., Herbomel P. Blood stem cells emerge from aortic endothelium by a novel type of cell transition. Nature. 2010;464:112–115. doi: 10.1038/nature08761. [DOI] [PubMed] [Google Scholar]
- Kissa K., Murayama E., Zapata A., Cortes A., Perret E., Machu C., Herbomel P. Live imaging of emerging hematopoietic stem cells and early thymus colonization. Blood. 2008;111:1147–1156. doi: 10.1182/blood-2007-07-099499. [DOI] [PubMed] [Google Scholar]
- Lam E.Y., Hall C.J., Crosier P.S., Crosier K.E., Flores M.V. Live imaging of Runx1 expression in the dorsal aorta tracks the emergence of blood progenitors from endothelial cells. Blood. 2010;116:909–914. doi: 10.1182/blood-2010-01-264382. [DOI] [PubMed] [Google Scholar]
- Lamouille S., Xu J., Derynck R. Molecular mechanisms of epithelial-mesenchymal transition. Nat. Rev. Mol. Cell Biol. 2014;15:178–196. doi: 10.1038/nrm3758. [DOI] [PMC free article] [PubMed] [Google Scholar]
- Lawson N.D., Weinstein B.M. In vivo imaging of embryonic vascular development using transgenic zebrafish. Dev. Biol. 2002;248:307–318. doi: 10.1006/dbio.2002.0711. [DOI] [PubMed] [Google Scholar]
- Lawson N.D., Vogel A.M., Weinstein B.M. Sonic hedgehog and vascular endothelial growth factor act upstream of the notch pathway during arterial endothelial differentiation. Dev. Cell. 2002;3:127–136. doi: 10.1016/s1534-5807(02)00198-3. [DOI] [PubMed] [Google Scholar]
- Leung A., Ciau-Uitz A., Pinheiro P., Monteiro R., Zuo J., Vyas P., Patient R., Porcher C. Uncoupling VEGFA functions in arteriogenesis and hematopoietic stem cell specification. Dev. Cell. 2013;24:144–158. doi: 10.1016/j.devcel.2012.12.004. [DOI] [PMC free article] [PubMed] [Google Scholar]
- Lin H.F., Traver D., Zhu H., Dooley K., Paw B.H., Zon L.I., Handin R.I. Analysis of thrombocyte development in CD41-GFP transgenic zebrafish. Blood. 2005;106:3803–3810. doi: 10.1182/blood-2005-01-0179. [DOI] [PMC free article] [PubMed] [Google Scholar]
- Link V., Shevchenko A., Heisenberg C.P. Proteomics of early zebrafish embryos. BMC Dev. Biol. 2006;6:1. doi: 10.1186/1471-213X-6-1. [DOI] [PMC free article] [PubMed] [Google Scholar]
- Livak K.J., Schmittgen T.D. Analysis of relative gene expression data using real-time quantitative PCR and the 2(-Delta Delta C(T)) Method. Methods. 2001;25:402–408. doi: 10.1006/meth.2001.1262. [DOI] [PubMed] [Google Scholar]
- Massague J., Gomis R.R. The logic of TGFbeta signaling. FEBS Lett. 2006;580:2811–2820. doi: 10.1016/j.febslet.2006.04.033. [DOI] [PubMed] [Google Scholar]
- Menendez D., Inga A., Resnick M.A. The expanding universe of p53 targets. Nat. Rev. Cancer. 2009;9:724–737. doi: 10.1038/nrc2730. [DOI] [PubMed] [Google Scholar]
- Monteiro R., Pouget C., Patient R. The gata1/pu.1 lineage fate paradigm varies between blood populations and is modulated by tif1gamma. EMBO J. 2011;30:1093–1103. doi: 10.1038/emboj.2011.34. [DOI] [PMC free article] [PubMed] [Google Scholar]
- Murayama E., Kissa K., Zapata A., Mordelet E., Briolat V., Lin H.F., Handin R.I., Herbomel P. Tracing hematopoietic precursor migration to successive hematopoietic organs during zebrafish development. Immunity. 2006;25:963–975. doi: 10.1016/j.immuni.2006.10.015. [DOI] [PubMed] [Google Scholar]
- Nawshad A., Medici D., Liu C.C., Hay E.D. TGFbeta3 inhibits E-cadherin gene expression in palate medial-edge epithelial cells through a Smad2-Smad4-LEF1 transcription complex. J. Cell Sci. 2007;120:1646–1653. doi: 10.1242/jcs.003129. [DOI] [PMC free article] [PubMed] [Google Scholar]
- Nimmo R., Ciau-Uitz A., Ruiz-Herguido C., Soneji S., Bigas A., Patient R., Enver T. MiR-142-3p controls the specification of definitive hemangioblasts during ontogeny. Dev. Cell. 2013;26:237–249. doi: 10.1016/j.devcel.2013.06.023. [DOI] [PubMed] [Google Scholar]
- North T.E., Goessling W., Walkley C.R., Lengerke C., Kopani K.R., Lord A.M., Weber G.J., Bowman T.V., Jang I.H., Grosser T. Prostaglandin E2 regulates vertebrate haematopoietic stem cell homeostasis. Nature. 2007;447:1007–1011. doi: 10.1038/nature05883. [DOI] [PMC free article] [PubMed] [Google Scholar]
- Oh S.P., Seki T., Goss K.A., Imamura T., Yi Y., Donahoe P.K., Li L., Miyazono K., ten Dijke P., Kim S. Activin receptor-like kinase 1 modulates transforming growth factor-beta 1 signaling in the regulation of angiogenesis. Proc. Natl. Acad. Sci. USA. 2000;97:2626–2631. doi: 10.1073/pnas.97.6.2626. [DOI] [PMC free article] [PubMed] [Google Scholar]
- Oshima M., Oshima H., Taketo M.M. TGF-beta receptor type II deficiency results in defects of yolk sac hematopoiesis and vasculogenesis. Dev. Biol. 1996;179:297–302. doi: 10.1006/dbio.1996.0259. [DOI] [PubMed] [Google Scholar]
- Pardali E., Goumans M.-J.J., ten Dijke P. Signaling by members of the TGF-beta family in vascular morphogenesis and disease. Trends Cell Biol. 2010;20:556–567. doi: 10.1016/j.tcb.2010.06.006. [DOI] [PubMed] [Google Scholar]
- Proetzel G., Pawlowski S.A., Wiles M.V., Yin M., Boivin G.P., Howles P.N., Ding J., Ferguson M.W., Doetschman T. Transforming growth factor-beta 3 is required for secondary palate fusion. Nat. Genet. 1995;11:409–414. doi: 10.1038/ng1295-409. [DOI] [PMC free article] [PubMed] [Google Scholar]
- Quillien A., Moore J.C., Shin M., Siekmann A.F., Smith T., Pan L., Moens C.B., Parsons M.J., Lawson N.D. Distinct Notch signaling outputs pattern the developing arterial system. Development. 2014;141:1544–1552. doi: 10.1242/dev.099986. [DOI] [PMC free article] [PubMed] [Google Scholar]
- Robert-Moreno A., Espinosa L., de la Pompa J.L., Bigas A. RBPjkappa-dependent Notch function regulates Gata2 and is essential for the formation of intra-embryonic hematopoietic cells. Development. 2005;132:1117–1126. doi: 10.1242/dev.01660. [DOI] [PubMed] [Google Scholar]
- Robert-Moreno A., Guiu J., Ruiz-Herguido C., Lopez M.E., Ingles-Esteve J., Riera L., Tipping A., Enver T., Dzierzak E., Gridley T. Impaired embryonic haematopoiesis yet normal arterial development in the absence of the Notch ligand Jagged1. EMBO J. 2008;27:1886–1895. doi: 10.1038/emboj.2008.113. [DOI] [PMC free article] [PubMed] [Google Scholar]
- Robu M.E., Larson J.D., Nasevicius A., Beiraghi S., Brenner C., Farber S.A., Ekker S.C. p53 activation by knockdown technologies. PLoS Genet. 2007;3:e78. doi: 10.1371/journal.pgen.0030078. [DOI] [PMC free article] [PubMed] [Google Scholar]
- Rowlinson J.M., Gering M. Hey2 acts upstream of Notch in hematopoietic stem cell specification in zebrafish embryos. Blood. 2010;116:2046–2056. doi: 10.1182/blood-2009-11-252635. [DOI] [PubMed] [Google Scholar]
- Santoro M., Pesce G., Stainier D. Characterization of vascular mural cells during zebrafish development. Mech. Dev. 2009;126:638–649. doi: 10.1016/j.mod.2009.06.1080. [DOI] [PMC free article] [PubMed] [Google Scholar]
- Shi Y., Massague J. Mechanisms of TGF-beta signaling from cell membrane to the nucleus. Cell. 2003;113:685–700. doi: 10.1016/s0092-8674(03)00432-x. [DOI] [PubMed] [Google Scholar]
- Vargel Ö., Zhang Y., Kosim K., Ganter K., Foehr S., Mardenborough Y., Shvartsman M., Enright A.J., Krijgsveld J., Lancrin C. Activation of the TGFβ pathway impairs endothelial to haematopoietic transition. Sci. Rep. 2016;6:21518. doi: 10.1038/srep21518. [DOI] [PMC free article] [PubMed] [Google Scholar]
- Walsh D.M., Klyubin I., Fadeeva J.V., Cullen W.K., Anwyl R., Wolfe M.S., Rowan M.J., Selkoe D.J. Naturally secreted oligomers of amyloid beta protein potently inhibit hippocampal long-term potentiation in vivo. Nature. 2002;416:535–539. doi: 10.1038/416535a. [DOI] [PubMed] [Google Scholar]
- Westerfield M. University of Oregon Press; Eugene: 2000. The Zebrafish Book. A Guide for the Laboratory Use of Zebrafish (Danio rerio) [Google Scholar]
- Wilkinson R.N., Pouget C., Gering M., Russell A.J., Davies S.G., Kimelman D., Patient R. Hedgehog and Bmp polarize hematopoietic stem cell emergence in the zebrafish dorsal aorta. Dev. Cell. 2009;16:909–916. doi: 10.1016/j.devcel.2009.04.014. [DOI] [PMC free article] [PubMed] [Google Scholar]
- Yamamoto M., Morita R., Mizoguchi T., Matsuo H., Isoda M., Ishitani T., Chitnis A.B., Matsumoto K., Crump J.G., Hozumi K. Mib-Jag1-Notch signalling regulates patterning and structural roles of the notochord by controlling cell-fate decisions. Development. 2010;137:2527–2537. doi: 10.1242/dev.051011. [DOI] [PMC free article] [PubMed] [Google Scholar]
- Zavadil J., Cermak L., Soto-Nieves N., Bottinger E.P. Integration of TGF-beta/Smad and Jagged1/Notch signalling in epithelial-to-mesenchymal transition. EMBO J. 2004;23:1155–1165. doi: 10.1038/sj.emboj.7600069. [DOI] [PMC free article] [PubMed] [Google Scholar]
- Zhao M., Perry J.M., Marshall H., Venkatraman A., Qian P., He X.C., Ahamed J., Li L. Megakaryocytes maintain homeostatic quiescence and promote post-injury regeneration of hematopoietic stem cells. Nat. Med. 2014;20:1321–1326. doi: 10.1038/nm.3706. [DOI] [PubMed] [Google Scholar]
Associated Data
This section collects any data citations, data availability statements, or supplementary materials included in this article.