

Supplemental Digital Content is available in the text
Abstract
Essential hypertension is a complex disease involving multiple genetic and environmental factors. A human gene containing a sorbin homology domain and 3 SH3 domains in the C-terminal region, termed SORBS1, plays a significant role in insulin signaling. We previously found a significant association between the T228A polymorphism and insulin resistance, obesity, and type 2 diabetes. It has been hypothesized that a set of genes responsible for insulin resistance may be closely linked with genes susceptible to the development of hypertension. Identification of insulin resistance-related genetic factors may, therefore, enhance our understanding of essential hypertension. This study aimed to examine whether common SORBS1 genetic variations are associated with blood pressure and age at onset of hypertension in an ethnic Chinese cohort.
We genotyped 9 common tagged single nucleotide polymorphisms of the SORBS1 gene in 1136 subjects of Chinese origin from the Stanford Asia-Pacific Program for Hypertension and Insulin Resistance family study. Blood pressure was measured upon enrolment. The associations of the SORBS1 single nucleotide polymorphisms with blood pressure and the presence of hypertension were analyzed with a generalized estimating equation model. We used the false-discovery rate measure Q value with a cutoff <0.1 to adjust for multiple comparisons. In the Cox regression analysis for hypertension-free survival, a robust sandwich variance estimator was used to deal with the within-family correlations with age at onset of hypertension. Gender, body mass index, and antihypertension medication were adjustment covariates in the Cox regression analysis.
In this study, genetic variants of rs2281939 and rs2274490 were significantly associated with both systolic and diastolic blood pressure. A genetic variant of rs2274490 was also significantly associated with the presence of hypertension. Furthermore, genetic variants of rs2281939 and rs2274490 were associated with age at onset of hypertension after adjustment for gender, body mass index, and antihypertension medication.
In conclusion, we provide evidence for an association between common SORBS1 genetic variations and blood pressure, presence of hypertension, and age at onset of hypertension. The biological mechanism of genetic variation associated with blood pressure regulation needs further investigation.
INTRODUCTION
Hypertension, currently defined as systolic blood pressure (SBP) >140 mm Hg or diastolic blood pressure (DBP) >90 mm Hg, is the most common risk factor for cardiovascular diseases.1 Twenty-five percent of the world's adult population has hypertension, and this figure is likely to increase to 29% by 2025.2 As blood pressure (BP) is known to be regulated by a network of interacting complex systems, essential hypertension is considered a complex disease involving multiple genetic and environmental factors.3,4
According to the most recent evidence, genetic factors are estimated to explicate approximately 30% to 50% of the variability of BP.5 Although several specific causal genes have been demonstrated to be involved in the regulatory pathways of some rare familial forms of hypertension,6 many metabolic pathways are involved in the regulation of BP and development of hypertension, which are considered as polygenic traits.7 The progress of high-throughput genotyping assays has been expected to expedite the identification of susceptible loci of hypertension.8–11 Although thirty-eight loci have been identified to be robustly associated with BP regulation through large-scale genome-wide association study (GWAS) meta-analyses,8,12–14 the currently identified common variants were expected to explain only about 0.9% of the variability of BP, and a large proportion of unexplained heritability needs further exploration.8 The unexplained heritability of BP could be explained by the significant genetic and phenotypic heterogeneity among different populations and the modest effect size of risk alleles.15
Metabolic syndrome is characterized by the simultaneous existence of glucose intolerance, dyslipidemia, obesity, and hypertension, which leads to a significant increase in cardiovascular morbidity and mortality.16–18 Several experimental results have supported the role of impaired insulin signaling in the pathogenesis of essential hypertension. For example, patients with essential hypertension without antihypertensive medication have higher fasting and postprandial insulin levels than normotensive persons independent of body mass index.19 Plasma insulin levels were also positively correlated with BP.19,20 However, there is no significant association between plasma insulin levels and hypertension in individuals with secondary hypertension.19 Thus, hypertension per se is not the attributed factor of insulin resistance and hyperinsulinemia, but hypertension and insulin resistance may share a common genetic predisposition. This concept is also supported by one report that abnormal glucose metabolism was observed in the offspring of hypertensive parents.19,20 In biological studies, insulin induced vascular relaxation through stimulation of nitric oxide production, reduction of intracellular Ca2+ concentrations in vascular smooth muscle cell, and sensitization of Ca2+-myosin light chain.21–23In normal physiological condition, insulin mediates both glucose disposal and increased blood flow. The individuals with insulin resistance lose the normal response to insulin. The phenomenon implicated that the induction of NO vascular production and vascular relaxation caused by insulin in endothelial cells are impaired in the subjects with insulin resistance.24 Furthermore, it has been postulated that a set of genes account for insulin resistance may be closely linked with the susceptible genes of type 2 diabetes, dyslipidemia, obesity, and hypertension.25–27 Identification of the genetic factors related to insulin resistance may, therefore, enhance our understanding of BP regulation and development of essential hypertension.
We previously cloned a human gene containing a sorbin homology domain and 3 SH3 domains in the C-terminal region, termed SORBS1 [OMIM 605264, GenBank accession No. AF136380 and AF136381]. SORBS1 is a human homologue for c-Cbl-associated protein (CAP),28 which involves in the signaling pathway of insulin-stimulated glucose uptake in the mouse.29 Insulin stimulates phosphorylation of c-Cbl and leads to dissociation of c-Cbl–CAP complex from the insulin receptor and translocates to a lipid raft domain of the plasma membrane, and then the c-Cbl–CAP complex interacts with flotillin, Crka, C3G, and TC10, and results in the translocation of the vesicles containing glucose transporter 4 (GLUT4) from cytoplasm to the plasma membrane.29 Therefore, SORBS1 is an important adaptor protein in the insulin-signaling pathway, and its genetic polymorphism may be related to insulin resistance. A previous case-control study found a significant association between a polymorphism of the threonine/alanine amino acid substitution at codon 228, termed the T228A polymorphism, and insulin resistance, obesity, and type 2 diabetes.30 In the present study, we used a family-based study design to identify differences between siblings, allowing us to further examine the association of a larger number of single nucleotide polymorphism (SNP) genotypes of the SORBS1 gene with BP, prevalence of hypertension, and age at onset of hypertension in a cohort of ethnic Chinese family members from the Stanford Asia-Pacific Program for Hypertension and Insulin Resistance study.
METHODS
Study Design
This was a family-based observational multi-center study designed to examine the association of genetic variants of the SORBS1 gene with BP and age at onset of hypertension.
Subjects
Individuals were recruited as part of the Stanford Asia-Pacific Program for Hypertension and Insulin Resistance study; details of this study population have been published previously.31 In brief, index cases were recruited if they were aged 35 to 60 years at onset of hypertension or >60 years, but with available documentation of their hypertension status prior to age 60 years. Concordant sibling groups (all siblings with hypertension) and discordant sibling groups (≥1 hypertensive sibling) were recruited for this study. In the present study, 1136 siblings from 492 ethnic Chinese nuclear families were genotyped. The study was approved by institutional review boards at all participating sites, including National Taiwan University Hospital, Taipei Veterans General Hospital, Tri-Service General Hospital, and Taichung Veterans General Hospital. Written informed consent was obtained from all subjects prior to their enrollment in the study.
Measurement of Anthropometric Parameters and BP
Body height (BH), body weight (BW), and body mass index [BMI: BW (kg)/BH2 (m2)] were obtained at recruitment. Resting SBP and DBP were determined using an oscillometric device (Critikon Dinamap model 1846 SX V.S.M. BP Monitor from MFI Medical Equipment, Inc; San Diego, CA). Subjects were seated with legs uncrossed and were asked to refrain from talking for 5 minutes. BP was measured 3 times, with at least a 1-minute time lapse between each consecutive reading, and the average of the second and third readings was used in the analysis.31
Extraction of Genomic DNA and Genotyping
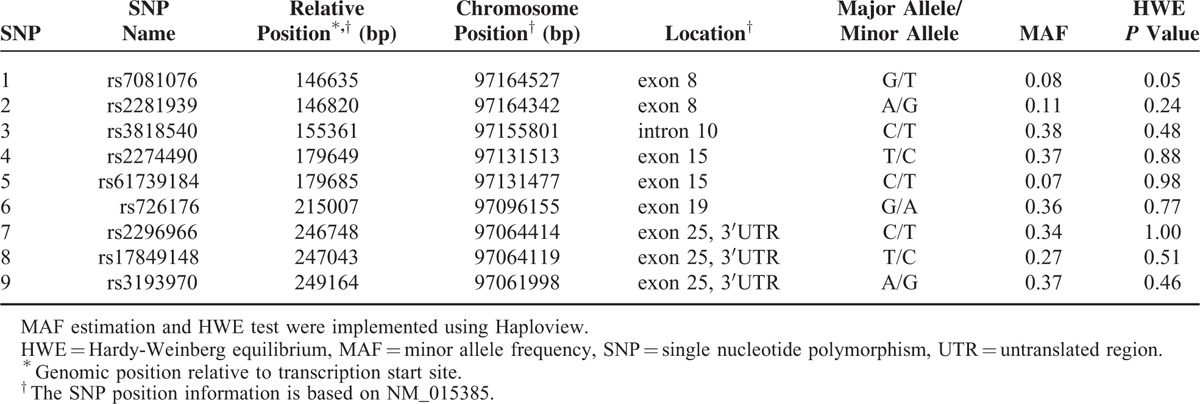
Total genomic DNA was purified from peripheral blood leukocytes using a Puregene DNA extraction kit (Minneapolis, MN), in accordance with the manufacturer's protocol. Nine tag SNPs were selected from the HapMap Chinese in Beijing (CHB) data bank (http://www.hapmap.org) using the Tagger program in Haploview 4.1 (http://www.broad.mit.edu/mpg/haploview/), with a minor allele frequency threshold of 5% and an r2 of 0.8 (Table 1). Genotyping was performed using Applied Biosystems SNPlex assays. All SNPs were in Hardy–Weinberg equilibrium in the controls (all P > 0.01), as determined by the Haploview program. All methods were carried out in accordance with the approved guidelines, and all experimental protocols were approved by committees at National Taiwan University Hospital, Taipei Veterans General Hospital, Taichung Veterans General Hospital, and Tri-Service General Hospital.
TABLE 1.
SORBS1 SNPs Information
Statistical Analysis
Continuous variables were summarized as mean values ± standard deviation (SD), and binary variables were summarized as count (percentage) of a specific category. Pairwise linkage disequilibrium (LD) measures D′ and r2 among assayed SORBS1 SNPs estimated by the Haploview program.32 We examined the association of each SORBS1 SNP with SBP, DBP, and the presence of hypertension using a generalized estimating equation (GEE) model,33 which accounted for the correlated data within families.34 Age, gender, and BMI were used as covariates for adjustment in all GEE analyses and use of antihypertension medication was also adjusted for BPs. The status of use of antihypertension medication was dichotomized as “yes” if the subject used at least 1 antihypertension drug and “no” if the subject did not use any antihypertension drug. For each test, the null hypothesis was rejected if the P < 0.05. The GEE analyses were implemented using IBM SPSS version 19.0. We also used QVALUE software35 to calculate Q, which is a false discovery rate (FDR)-based measure of significance adjusted for multiple comparisons. The Q represents the probability that a rejection of the null hypothesis is false. In this study, an association with a Q < 0.1 was considered statistically significant.35 This threshold of Q implicates 10% of the declared discoveries are expected to be false and it is therefore commonly employed in candidate gene studies nowadays.36,37
We used a Cox proportional hazard model38 to test for associations between specific SORBS1 SNPs and hypertension-free survival (namely age at onset of hypertension), which were adjusted for gender, BMI, and use of antihypertension medication. Cox regression analysis was implemented using the R package “survival” (version 2.38–3, downloaded from The Comprehensive R Archive Network (CRAN)), and the robust sandwich variance estimator39 was used to deal with the within-family correlation of age of onset of hypertension. Cox proportional hazard regression assumes that the hazard ratio is constant over time. Therefore, Schoenfeld residuals test was performed to examine the proportional hazards assumption essential for Cox regression analysis.40
RESULTS
Demographic and Anthropometric Characteristics of Study Participants at Baseline
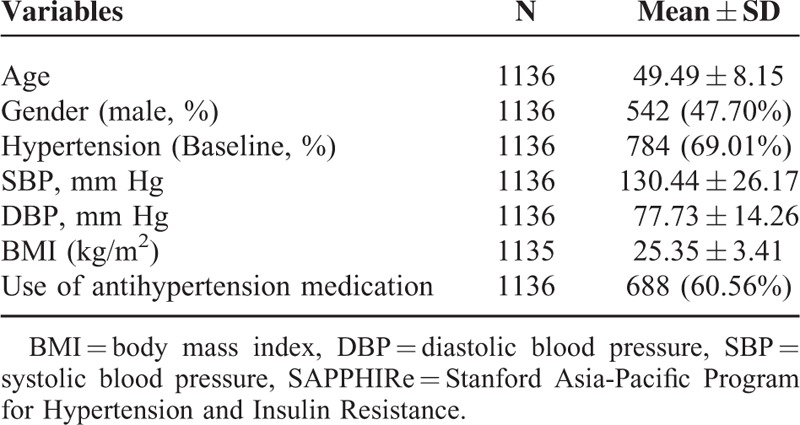
A total of 1136 participants were recruited for this study. Mean age of these participants was 49.49 ± 8.15 years, and 542 (47.70%) were male. The mean SBP was 130.44 ± 26.17 mm Hg, and the mean DBP was 77.73 ± 14.26 mm Hg. The mean BMI was 25.35 ± 3.41 kg/m2. Seven hundred and eighty-four subjects (69.01%) had hypertension at recruitment, and 688 (60.56%) used antihypertension medication (Table 2).
TABLE 2.
Characteristics of the Ethnic Chinese Participants in the SAPPHIRe Study
Association of SNPs of SORBS1 With SBP, DBP, and Presence of Hypertension
First, we explored the association of each SORBS1 SNP genotype with SBP, DBP, and the presence of hypertension using a GEE model. Subjects carrying 2 minor alleles (GG genotype) of rs2281939 had lower SBP and DBP than those carrying 2 major alleles (AA genotype). Similarly, individuals carrying 2 minor alleles (CC genotype) of rs2274490 had lower SBP and DBP than those carrying 2 major alleles (TT genotype) (Supplementary Table 1). We obtained the effects of the minor alleles of SORBS1 SNPs under recessive models in subsequent analyses, based on genotypic association.
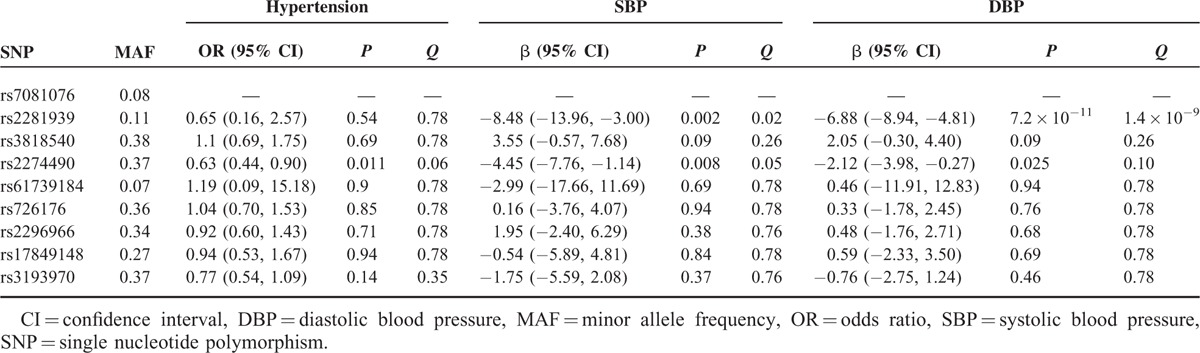
Individuals carrying 2 G alleles of rs2281939 had significantly lower SBP (β=−8.48, 95% CI 13.96 to −3.00, Q = 0.02) and DBP (β=−6.88, 95% CI −8.94 to −4.81, Q = 1.4 × 10⁻⁹) than those carrying the A allele. Individuals carrying 2 C alleles of rs2274490 had a significantly lower prevalence of hypertension (Odds ratio [OR] = 0.63, 95% CI 0.44–0.90, Q = 0.06), lower SBP (β=−4.45, 95% CI −7.76 to −1.14, Q = 0.05), and lower DBP (β=−2.12, 95% CI −3.98 to −0.27, Q = 0.10) than those carrying the T allele (Table 3).
TABLE 3.
Effect of the Minor Allele of SORBS1 on Each Trait Under the Recessive Model, Analyzed Using the GEE Approach
Association of rs2281939 and rs2274490 With Age at Onset of Hypertension
Based on the results of Table 3, we selected rs2281939 and rs2274490 to perform Cox regression analysis to explore the association of these 2 SNPs with age at onset of hypertension. Results of Schoenfeld residuals tests indicated that the proportional hazards assumption was not violated in our data (Supplementary Table 2). Individuals carrying the GG genotype of rs2281939 had a significantly older age at onset of hypertension than those carrying AA or AG genotypes (Table 4, Figure 1A). Individuals carrying the CC genotype of rs2274490 had a significantly older age at onset of hypertension than those carrying TT or TC genotypes (Table 4, Figure 1B).
TABLE 4.
Effect of the Minor Allele of rs2281939 and rs2274490 on Age at Onset of Hypertension Under a Recessive Model Analyzed Using Cox Regression Model
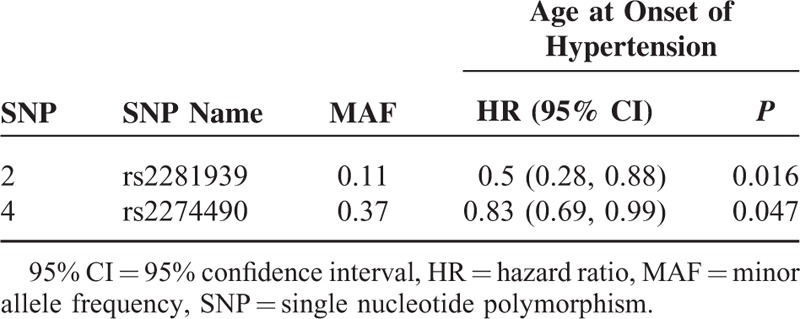
FIGURE 1.
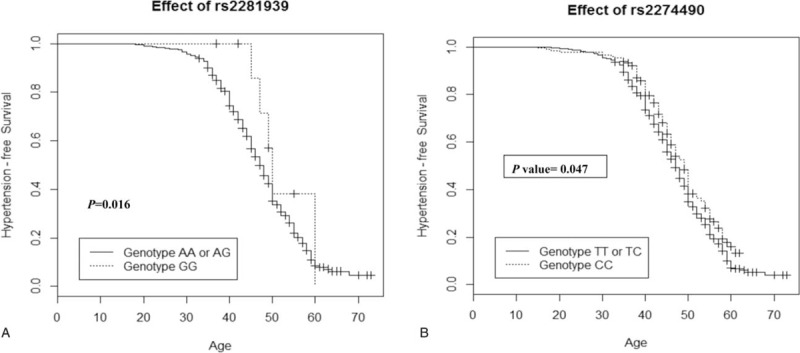
Probability of hypertension-free survival of participants carrying different genotypes of rs2281939 (A) and rs2274490 (B).
Investigating Whether rs2281939 and rs2274460 Are Independently Associated With SBP, DBP, and Age at Onset of Hypertension
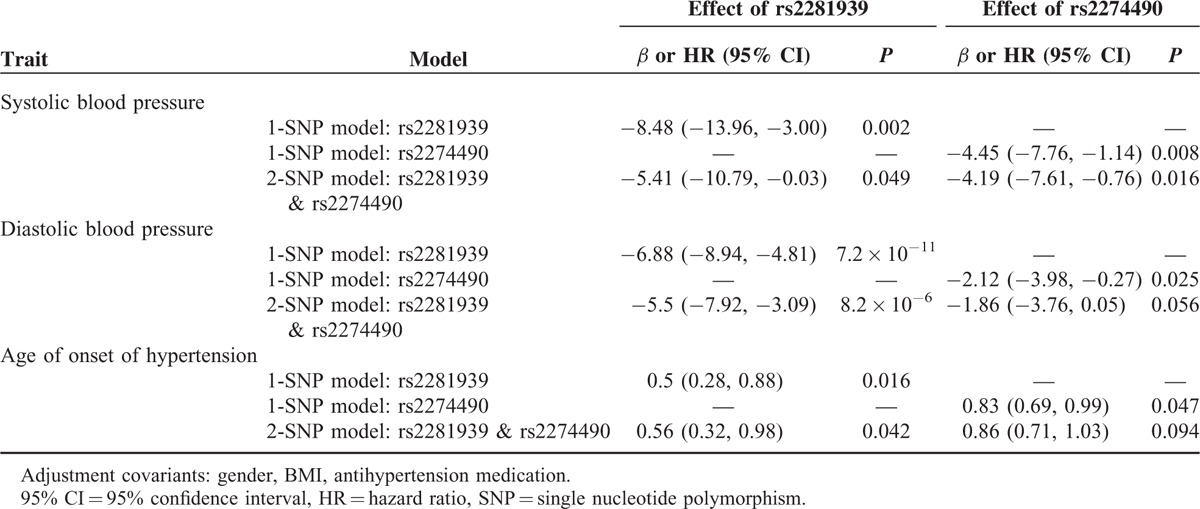
To investigate whether rs2281939 and rs2274490 are independently associated with SBP, DBP, and age at onset of hypertension, we reexamined the associations by incorporating these 2 SNPs into the models simultaneously (Table 5). For rs2281939, significant effects on SBP, DBP, and age at onset of hypertension remained in the 2-SNP models (P = 0.049, 8.2 × 10⁻⁶, and 0.042, respectively). For rs2274490, the effect on SBP was significant (P = 0.016), but the effects on DBP and age at onset of hypertension were borderline (P = 0.056 and 0.094, respectively) in the 2-SNP model. The D′ of LD between rs2281939 and rs2274490 was 0.83.
TABLE 5.
Effect of the Minor Allele of SORBS1 (rs2281939 and rs2274490) on SBP, DBP, and Age at Onset of Hypertension Under the 1-SNP and 2-SNP Models
DISCUSSION
We reported that 2 specific SNPs of SORBS1 were associated with the prevalence of hypertension, SBP, and DBP. Furthermore, the 2 specific SNPs were also associated with age at onset of hypertension. To the best of our knowledge, this is the first study on the association of genetic variants of SORBS1 with age at onset of hypertension.
It has been reported that deletion of the bone marrow-specific Cap gene protects against high-fat diet-induced insulin resistance.41 Ribon et al42 also reported that treatment with an insulin sensitizer may regulate the expression of this protein in insulin-target tissues. In addition, it has been shown that there is an inverse relationship between BMI and the expression level of the SORBS1 gene in the visceral adipose tissue of non-diabetic women.43 We previously reported that the G allele of rs2281939 (Ala allele of the T228A polymorphism) was associated with a leaner body build than that of subjects without this polymorphism. Furthermore, the G allele of this polymorphism was also associated with a lower insulin resistance index than the A allele of rs2281939 (Thr allele of T228A). We also found that the G allele of this polymorphism was protective for both obesity and diabetes.30 It has been reported that the GG genotype of the rs2281939 (Ala/Ala genotype of T228A) polymorphism may be a potential risk factor for lacunar infarction in a Japanese population.44 The G allele of rs2281939 (Ala allele of the T228A polymorphism) in the SORBS1 gene has also been reported to be a risk factor for hypertension in a Japanese population and to be associated with higher DBP in Japanese women.45 In the present study, we genotyped 9 tag SNPs of SORBS1 and found that the individuals carrying 2 G alleles of rs2281939 (Ala allele of the T228A polymorphism) had lower SBP, DBP and later age at onset of hypertension. This result is in contrast to findings in Japanese populations.44,45 The discrepancy may be due to ethnic differences and the younger age of the participants in our study than that of the Japanese study group (49.49 ± 8.15 years in our group; Japanese women with hypertension: 64.4 ± 0.5 years, Japanese women without hypertension: 56.6 ± 0.4 years; Japanese men with hypertension: 63.2 ± 0.6 years, Japanese men without hypertension: 57.3 ± 0.4 years), and different sampling methods (family-based design in our study, and case-control design in the Japanese study). The A to G polymorphism of rs2281939 corresponds to a predicted phosphorylation site for mitogen-activated protein kinase.30 However, the exact mechanism of this amino acid variant in influencing BP regulation needs further study.
In this study, we found individuals carrying two C alleles of rs2274490 also had lower SBP and DBP, lower prevalence of hypertension, and later age at onset of hypertension. The association of rs2274490 with the above phenotype was first reported in this study. The MAF of rs2274490 was 0.37, which was higher than that of rs2281939. Therefore, the genetic variant of rs2274490 may also contribute to BP regulation to some degree. However, this needs further replication in other independent populations and different ethnic groups. Because D′ of the LD between rs2281939 and rs2274490 was 0.83, we further analyzed the association of the 2 SNPs with SBP, DBP, and age at onset of hypertension, respectively, under a 2-SNP model (Table 5). We found the associations of rs2281939 with SBP, DBP, and age at onset of hypertension were still statistically significant under the 2-SNP model, indicating the associations of rs2281939 with these phenotypes were independent of the LD with rs2274490. On the other hand, the association of rs2274490 with SBP was also significant under the 2-SNP model, which indicated the association of rs2274490 with SBP was independent of the LD with rs2281939. In contrast, the associations of rs2274490 with DBP and age at onset of hypertension were borderline significant under the 2-SNP model, indicating the associations of rs2274490 with these 2 phenotypes were partially from the LD between rs2281939 and rs2274490, with some effects from rs2274490 itself.
We further searched the open GWAS Central Database,46 18 GWAS for hypertension and 37 GWAS for BP were found (https://www.gwascentral.org/, searched on 12.26.2015). Then we searched the association between genetic variants of SORBS1 and BP as well as hypertension based on the database of these GWAS. None of the associations attained genome-wide significance (5.0 × 10⁻⁸). This may be partially explained that the underlying rationale for GWAS is based on the “common disease, common variant” hypothesis, assuming that common diseases are attributable in part to the common variants (allelic frequency more than 1%–5%) of the population.47–49 However, most common variants individually or in combination confer relatively small odds ratio (1.1–1.5 fold) and explain only a small proportion of heritability.50 Another limitation of GWAS is that the rarer variants (possibly with larger effects) are hardly detected by available genotyping arrays in GWAS.51 Therefore, it is possible that the sample size of GWAS is not big enough to have the power to detect the effect of genetic variants in SORBS1 on BP regulation. Another plausible explanation is that almost all the GWAS were under the assumption of additive genetic model, but we obtained the effects of the minor alleles of SORBS1 SNPs under recessive models in this study based on genotypic association (Supplementary Table 1). We found several SNPs of SORBS1 associated with SBP, DBP, or hypertension with a P < 0.05 based on GWAS of SBP in a British population (HGVST307) or GWAS for BP and arterial stiffness of Framingham Heart Study 100K project (HGVST204) (Supplementary Table 3).52 We further searched the published SNPs of SORBS1 from 1000 Genomes Project phase 3 in Han Chinese South (https://www.1000genomes.org/, searched on 1.2.2016), and then estimated D′ of LD among assayed 9 SORBS1 SNPs in this study and 2 SNPs from British population and Framingham Heart Study (rs11188311 and rs10509693) using the Haploview program.32 D′ of the LD between rs2281939 and rs11188311, and D′ of the LD between rs2274490 and rs10509693 were 1.0 (Supplementary Figure 1). Therefore, the 2 significant SNPs rs2281939 and rs2274490 in this study were in strong linkage disequilibrium with the 2 previously GWAS published SNPs of SORBS1 rs11188311 and rs10509693, respectively.
This study has several strengths. First, we adopted Q values as our measure of significance to reduce false-positive results derived from multiple tests. The Q value is similar to the more widely used P value, but it is a measure of significance in terms of the FDR rather than the false-positive rate.35 The Q value provides a measure of each feature's significance, automatically controlling for the fact that multiple hypotheses are being simultaneously tested. This approach offers a sensible balance between the number of true and false positives, which is automatically calibrated and easily interpreted.35 Second, this study examined SNPs associated with age at onset of hypertension in addition to prevalence of hypertension. However, a limitation of this study should be noted. The probands recruited in this study also had hypertension. Therefore, the statistical power for associations with hypertension may be hampered due to ascertainment bias.
In conclusion, we provided evidence for the associations of 2 common SORBS1 genetic variants with SBP, DBP, and age at onset of hypertension. These findings, together with some earlier observations in different ethnic groups, support an involvement of the SORBS1 gene in the pathogenesis of hypertension and provide a possible link between insulin resistance and essential hypertension.
Supplementary Material
Acknowledgments
We thank Ms. Shan-Shan Kuo, Chia-Ling Chao, Kuan-Ching Lee, and the staff of the Eighth Core Lab, Department of Medical Research, National Taiwan University Hospital for their excellent technical assistance, and thank the subjects for participating in this study. We also thank Ms. Kuan-Yi Hung of the Division of Biostatistics and Bioinformatics, Institute of Population Health Sciences, National Health Research Institutes for her assistance in data management, and Mr. Yen-Lung Pan of the Ph.D. Program for Translational Medicine, Taipei Medical University, for his computing assistance. We would like to acknowledge the National Genotyping Center of the National Research Program for Genomic Medicine, Taiwan.
Footnotes
Abbreviations: BH = body height, BMI = body mass index, BW = body weight, CAP = c-Cbl-associated protein, CHB = Chinese in Beijing, CVD = cardiovascular diseases, DBP = diastolic blood pressure, FDR = false-discovery rate, GEE = generalized estimating equation, GWAS = genome-wide association study, LD = linkage disequilibrium, SAPPHIRe = Stanford Asia-Pacific Program for Hypertension and Insulin Resistance, SBP = systolic blood pressure, SORBS1 = sorbin homology domain and 3 SH3 domains in the C-terminal region
T-JC and W-CW contributed equally to the study.
This study was supported by grants (NSC-85–2331-B002–350Y, NSC-86–2314-B002–345Y, and NSC-87–2312-B002–021Y) from the National Science Council, a grant (BS-090-pp-01) from the National Health Research Institutes, a grant from the Ministry of Education (89-B-FA01–1–4), Taiwan, R.O.C., a grant (UO1 HL54527–0151) from the National Heart, Lung and Blood Institute (USA), and a grant from Taipei Medical University (TMU101-AE1-B67). The funders had no role in the study design, data collection and analysis, decision to publish, or preparation of the article.
The authors have no conflicts of interest to disclose.
Contributor Information
Collaborators: and the SAPPHIRe Study Group
REFERENCES
- 1.Ezzati M, Lopez AD, Rodgers A, et al. Selected major risk factors and global and regional burden of disease. Lancet 2000; 360:1347–1360. [DOI] [PubMed] [Google Scholar]
- 2.Kearney PM, Whelton M, Reynolds K, et al. Global burden of hypertension: analysis of worldwide data. Lancet 2005; 365:217–223. [DOI] [PubMed] [Google Scholar]
- 3.Lifton RP. Molecular genetics of human blood pressure variation. Science 1996; 272:676–680. [DOI] [PubMed] [Google Scholar]
- 4.Timberlake DS, O’Connor DT, Parmer RJ. Molecular genetics of essential hypertension: recent results and emerging strategies. Curr Opin Nephrol Hypertens 2001; 10:71–79. [DOI] [PubMed] [Google Scholar]
- 5.Tanira MO, Al Balushi KA. Genetic variations related to hypertension: a review. J Hum Hypertens 2005; 19:7–19. [DOI] [PubMed] [Google Scholar]
- 6.Lifton RP, Gharavi AG, Geller DS. Molecular mechanisms of human hypertension. Cell 2001; 104:545–556. [DOI] [PubMed] [Google Scholar]
- 7.Zhao Q, Kelly TN, Li C, et al. Progress and future aspects in genetics of human hypertension. Curr Hypertens Rep 2013; 15:676–686. [DOI] [PMC free article] [PubMed] [Google Scholar]
- 8.Ehret GB, Munroe PB, Rice KM, et al. Genetic variants in novel pathways influence blood pressure and cardiovascular disease risk. Nature 2011; 478:103–109. [DOI] [PMC free article] [PubMed] [Google Scholar]
- 9.Harrap SB. Blood pressure genetics: time to focus. J Am Soc Hypertens 2009; 3:231–237. [DOI] [PubMed] [Google Scholar]
- 10.Levy D, Ehret GB, Rice K, et al. Genome-wide association study of blood pressure and hypertension. Nat Genet 2009; 41:677–687. [DOI] [PMC free article] [PubMed] [Google Scholar]
- 11.Newton-Cheh C, Johnson T, Gateva V, et al. Genome-wide association study identifies eight loci associated with blood pressure. Nat Genet 2009; 41:666–676. [DOI] [PMC free article] [PubMed] [Google Scholar]
- 12.Kato N, Takeuchi F, Tabara Y, et al. Meta-analysis of genome-wide association studies identifies common variants associated with blood pressure variation in east Asians. Nat Genet 2011; 43:531–538. [DOI] [PMC free article] [PubMed] [Google Scholar]
- 13.Wain LV, Verwoert GC, O’Reilly PF, et al. Genome-wide association study identifies six new loci influencing pulse pressure and mean arterial pressure. Nat Genet 2011; 43:1005–1011. [DOI] [PMC free article] [PubMed] [Google Scholar]
- 14.Salvi E, Kutalik Z, Glorioso N, et al. Genomewide association study using a high-density single nucleotide polymorphism array and case-control design identifies a novel essential hypertension susceptibility locus in the promoter region of endothelial NO synthase. Hypertension 2012; 59:248–255. [DOI] [PMC free article] [PubMed] [Google Scholar]
- 15.Ding K, Kullo IJ. Genome-wide association studies for atherosclerotic vascular disease and its risk factors. Circ Cardiovasc Genet 2009; 2:63–72. [DOI] [PMC free article] [PubMed] [Google Scholar]
- 16.Expert Panel on Detection, Evaluation, and Treatment of High Blood Cholesterol in Adults. Executive Summary of the Third Report of the National Cholesterol Education Program (NCEP) Expert Panel on Detection, Evaluation, and Treatment of High Blood Cholesterol in Adults (Adult Treatment Panel III). JAMA 2001; 285:2486–2497. [DOI] [PubMed] [Google Scholar]
- 17.Saito I, Iso H, Kokubo Y, et al. Metabolic syndrome and all-cause and cardiovascular disease mortality. Circ J 2009; 73:878–884. [DOI] [PubMed] [Google Scholar]
- 18.Guerrero-Romero F, Rodriguez-Moran M. Concordance between the 2005 International Diabetes Federation definition for diagnosing metabolic syndrome with the National Cholesterol Education Program Adult Treatment Panel III and the World Health Organization definitions. Diabetes Care 2005; 28:2588–2589. [DOI] [PubMed] [Google Scholar]
- 19.Sechi LA, Melis A, Tedde R. Insulin hypersecretion: a distinctive feature between essential and secondary hypertension. Metabolism 1992; 4:1261–1266. [DOI] [PubMed] [Google Scholar]
- 20.Sowers JR, Epstein M, Frohlich ED. Diabetes, hypertension, and cardiovascular disease: an update. Hypertension 2001; 37:1053–1059. [DOI] [PubMed] [Google Scholar]
- 21.Gupta S, Phipps K, Ruderman NB. Differential stimulation of Na+ pump activity by insulin and nitric oxide in rabbit aorta. Am J Physiol Heart Circ Physiol 1996; 270:H1287–H1293. [DOI] [PubMed] [Google Scholar]
- 22.Standley PR, Ram JL, Sowers JR. Insulin attenuates vasopressin-induced calcium transients and a voltage dependent calcium response in rat vascular smooth muscle cells. J Clin Invest 1991; 88:1230–1236. [DOI] [PMC free article] [PubMed] [Google Scholar]
- 23.Montagnani M, Chen H, Bavi VA, et al. Insulin-stimulated activation of eNOS is independent of Ca2+ but requires phosphorylation by Akt at Ser(1179). J Biol Chem 2001; 276:30392–30398. [DOI] [PubMed] [Google Scholar]
- 24.Steinberg HO, Chaker H, Leaming R, et al. Obesity/insulin resistance is associated with endothelial dysfunction: implications for the syndrome of insulin resistance. J Clin Invest 1996; 97:2601–2610. [DOI] [PMC free article] [PubMed] [Google Scholar]
- 25.Mitchell BD, Kammerer CM, Mahaney MC, et al. Genetic analysis of the IRS: pleiotropic effects of genes influencing insulin levels on lipoprotein and obesity measures. Arterioscler Thromb Vasc Biol 1996; 16:281–288. [DOI] [PubMed] [Google Scholar]
- 26.Carmelli D, Cardon LR, Fabsitz R. Clustering of hypertension, diabetes, and obesity in adult male twins: same genes or same environments? Am J Hum Genet 1994; 55:566–573. [PMC free article] [PubMed] [Google Scholar]
- 27.Hong Y, Pedersen NL, Brismar K, et al. Genetic and environmental architecture of the features of the insulin-resistance syndrome. Am J Hum Genet 1997; 60:143–152. [PMC free article] [PubMed] [Google Scholar]
- 28.Lin WH, Huang CJ, Liu MW, et al. Cloning, mapping, and characterization of the human sorbin and SH3 domain containing 1 (SORBS1) gene: a protein associated with c-Abl during insulin signaling in the hepatoma cell line Hep3B. Genomics 2001; 74:12–20. [DOI] [PubMed] [Google Scholar]
- 29.Baumann CA, Ribon V, Kanzaki M, et al. CAP defines a second signaling pathway required for insulin-stimulated glucose transport. Nature 2000; 407:202–207. [DOI] [PubMed] [Google Scholar]
- 30.Lin WH, Chiu KC, Chang HM, et al. Molecular scanning for the human sorbin and SH3 domain containing 1 (SORBS1) gene: a positive association of the T228A polymorphism with obesity and type 2 diabetes. Hum Mol Genet 2001; 10:1753–1760. [DOI] [PubMed] [Google Scholar]
- 31.Chiu YF, Chuang LM, Hsiao CF, et al. An autosomal genome-wide scan for loci linked to pre-diabetic phenotypes in nondiabetic Chinese subjects from the Stanford Asia-Pacific Program of Hypertension and Insulin Resistance Family Study. Diabetes 2005; 54:1200–1206. [DOI] [PubMed] [Google Scholar]
- 32.Barrett JC, Fry B, Maller J, et al. Haploview: analysis and visualization of LD and haplotype maps. Bioinformatics 2005; 21:263–265. [DOI] [PubMed] [Google Scholar]
- 33.Zeger SL, Liang KY. Longitudinal data analysis for discrete and continuous outcomes. Biometrics 1986; 42:121–130. [PubMed] [Google Scholar]
- 34.Hancock DB, Scott WK. Population-based case-control association studies. Curr Protoc Hum Genet 2012; 74:1.17.1–1.17.20. [DOI] [PubMed] [Google Scholar]
- 35.Storey JD, Tibshirani R. Statistical significance for genomewide studies. Proc Natl Acad Sci USA 2003; 100:9440–9445. [DOI] [PMC free article] [PubMed] [Google Scholar]
- 36.Geybels MS, van den Brandt PA, van Schooten FJ, et al. Oxidative stress-related genetic variants, pro-and antioxidant intake and status, and advanced prostate cancer risk. Cancer Epidemiol Biomarkers Prev 2014; 24:178–186. [DOI] [PubMed] [Google Scholar]
- 37.Schutz FAB, Pomerantz MM, Gray KP, et al. Single nucleotide polymorphisms and risk of recurrence of renal-cell carcinoma: a cohort study. Lancet Oncol 2013; 14:81–87. [DOI] [PMC free article] [PubMed] [Google Scholar]
- 38.Cox DR. Regression models and life-tables. J R Stat Soc B 1972; 34:187–220. [Google Scholar]
- 39.Lin DY, Wei LJ. The robust inference for the Cox proportional hazards model. J Am Stat Assoc 1989; 84:1074–1078. [Google Scholar]
- 40.Grambsch PM, Therneau TM. Proportional hazards tests and diagnostics based on weighted residuals. Biometrika 1994; 81:515–526. [Google Scholar]
- 41.Lesniewski LA, Hosch SE, Neels JG, et al. Bone marrow-specific Cap gene deletion protects against high-fat diet-induced insulin resistance. Nat Med 2007; 13:455–462. [DOI] [PubMed] [Google Scholar]
- 42.Ribon V, Johnson JH, Camp HS, et al. Thiazolidinediones and insulin resistance: peroxisome proliferator-activated receptor gamma activation stimulates expression of the CAP gene. Proc Natl Acad Sci USA 1998; 95:14751–14756. [DOI] [PMC free article] [PubMed] [Google Scholar]
- 43.Yang WS, Lee WJ, Huang KC, et al. mRNA levels of the insulin-signaling molecule SORBS1 in the adipose depots of nondiabetic women. Obes Res 2003; 11:586–590. [DOI] [PubMed] [Google Scholar]
- 44.Hagiwara N, Kitazono T, Kamouchi M, et al. Polymorphism in the sorbin and SH3-domain-containing-1 (SORBS1) gene and the risk of brain infarction in the Japanese population: the Fukuoka Stroke Registry and the Hisayama study. Eur J Neurol 2008; 15:481–486. [DOI] [PubMed] [Google Scholar]
- 45.Yamada Y, Ando F, Shimokata H. Association of polymorphisms of SORBS1, GCK and WISP1 with hypertension in community-dwelling Japanese individuals. Hypertens Res 2009; 32:325–331. [DOI] [PubMed] [Google Scholar]
- 46.Thorisson GA, Lancaster O, Free RC, et al. HGVbaseG2P: a central genetic association database. Nucleic Acids Res 2009; 37:D797–D802. [DOI] [PMC free article] [PubMed] [Google Scholar]
- 47.Reich DE, Lander ES. On the allelic spectrum of human disease. Trends Genet 2001; 17:502–510. [DOI] [PubMed] [Google Scholar]
- 48.Collins FS, Guyer MS, Chakravarti A. Variations on a theme: cataloging human DNA sequence variation. Science 1997; 278:1580–1581. [DOI] [PubMed] [Google Scholar]
- 49.Pritchard JK. Are rare variants responsible for susceptibility to common diseases? Am J Hum Genet 2001; 69:124–137. [DOI] [PMC free article] [PubMed] [Google Scholar]
- 50.Hindorff LA, Sethupathy P, Junkins HA, et al. Potential etiologic and functional implications of genome-wide association loci for human diseases and traits. Proc Natl Acad Sci 2009; 106:9362–9367. [DOI] [PMC free article] [PubMed] [Google Scholar]
- 51.Manolio TA, Collins FS, Cox NJ, et al. Finding the missing heritability of complex diseases. Nature 2009; 461:747–753. [DOI] [PMC free article] [PubMed] [Google Scholar]
- 52.Levy D, Larson MG, Benjamin EJ, et al. Framingham Heart Study 100K Project: genome-wide associations for blood pressure and arterial stiffness. BMC Med Genet 2007; 8 (suppl I):S3. [DOI] [PMC free article] [PubMed] [Google Scholar]
Associated Data
This section collects any data citations, data availability statements, or supplementary materials included in this article.