


Abstract
Light-regulated modules offer unprecedented new ways to control cellular behavior in precise spatial and temporal resolution. The availability of such tools may dramatically accelerate the progression of synthetic biology applications. Nonetheless, current optogenetic toolbox of prokaryotes has potential issues such as lack of rapid and switchable control, less portable, low dynamic expression and limited parts. To address these shortcomings, we have engineered a novel bidirectional promoter system for Escherichia coli that can be induced or repressed rapidly and reversibly using the blue light dependent DNA-binding protein EL222. We demonstrated that by modulating the dosage of light pulses or intensity we could control the level of gene expression precisely. We show that both light-inducible and repressible system can function in parallel with high spatial precision in a single cell and can be switched stably between ON- and OFF-states by repetitive pulses of blue light. In addition, the light-inducible and repressible expression kinetics were quantitatively analysed using a mathematical model. We further apply the system, for the first time, to optogenetically synchronize two receiver cells performing different logic behaviors over time using blue light as a molecular clock signal. Overall, our modular approach layers a transformative platform for next-generation light-controllable synthetic biology systems in prokaryotes.
INTRODUCTION
In bacteria, fundamental processes such as gene expression and cell-cycle events are largely controlled by spatial and temporal oscillations (1). Precise spatial and temporal regulation of inducible and repressible gene expression systems would facilitate dynamic gene regulation for optimal production of bio-commodities circumventing the host cell burden effect. Ideally, biological devices that can rapidly and precisely be switched ‘ON’ or ‘OFF’ at will, would boost our ability to perturb and interrogate the complex biological gene networks (2–4). Typically, exogenous chemical inducers that bind to soluble transcription factors are used to achieve artificial control of gene expression (5). But their efficacy is limited due to their potential off-target effects (6), transport process delays (7), toxicity (8) and lack of reversibility of gene expression (9). For example, once induced it is very difficult to remove the residual chemical inducers from the growth medium, causing difficulties for studies that require precise temporal control of gene expression at desired levels (10,11). Alternatively, light stimulus is non-toxic and can be rapidly delivered to cells in any pattern with precise spatiotemporal control (9,10,12–15). Using light, gene expression levels can be easily tuned and reversed based on the light intensity and duration of illumination. To date, a number of light-switchable transcription factors have been engineered to regulate gene expression in Escherichia coli (16–19), mammalian cells (20–23) and yeast (6,24). Nevertheless, there are only limited numbers of light-controlled genetic devices in the current synthetic biology toolbox for prokaryotes (16,18). Moreover, most of these gene circuits have major shortcomings that include the dependence for non-endogenous chromophores (6,16,23), requirement for multiple protein components limiting their portability (16–18,24), low gene expression levels (16,17) and suffer potential crosstalk (20). An optimized version of the light-switchable E. coli two-component system was reported recently (25), yet the system exhibits low levels of gene expression and requires two expression plasmids. Besides, the blue light responsive one-plasmid, two-component system reported in E. coli is independent from non-native chromophores but it still requires two proteins YF1/FixJ (18). These drawbacks prevent their incorporation in larger biological systems to achieve more complex functions and thereby limiting its widespread applications. Nevertheless, no light-inducible promoter has been reported to rapidly and reversibly induce gene expression using a single transcription factor or one-component system in prokaryotes (16–18,25). In addition, no direct light-mediated repressible promoter with rapid ‘ON’ and ‘OFF’ kinetics has been reported for either prokaryotic or eukaryotic systems (6,16–18,20,22,24). An ideal optogenetic system requires both light-dependent inducible and repressible device able to function in parallel with rapid and reversible control of gene expression in space and time. The availability of such tools would nicely facilitate synthetic biologists to modulate multiple endogenous gene expression in a more controlled fashion (26).
To this end, we constructed a tunable blue light-inducible and repressible promoter system (bidirectional regulation) in E. coli, using a natural photosensitive DNA-binding protein (EL222) from the marine bacterium Erythrobacter litoralis HTCC2594. EL222 is a modular 222 amino acid photosensitive protein, composed of a N-terminal light-oxygen-voltage (LOV) domain and a C-terminal helix-turn-helix (HTH) DNA-binding domain characteristic of LuxR-type DNA-binding proteins (27). Upon blue light illumination (450 nm), the LOV-HTH interaction is released which allows EL222 to dimerize and bind to DNA. In the dark, EL222 spontaneously reverses as the N-terminal LOV domain represses DNA-binding C-terminal HTH domain thereby rapidly inactivating EL222 (28,29). Recently, a blue light-inducible promoter system is developed for mammalian cells using an engineered version of EL222 (21). It is shown to rapidly deactivate transcription in the dark state (non-inducing conditions) and activate transcription upon exposure to blue light in different eukaryotic systems (21). Here, we exploit the blue light-mediated DNA-binding activity of the natural EL222 protein [as earlier elucidated by (27)], to engineer a programmable transcriptional activator and repressor in prokaryotic E. coli. First, we converted the EL222 into a transcriptional activator by replacing the lux box (LuxR and 3-oxo-C6-HSL complex binding region), a 20-bp inverted repeat from the luxI promoter (σ70 RNA polymerase (RNAP) dependent promoter) (30), with the 18-bp EL222 binding region. Upon illumination with the blue light, EL222 dimer presumably overlaps the −35 region of the luxI promoter thereby recruiting RNAP and activates transcription. This resulted in a synthetic blue light-inducible promoter. With this method, we demonstrated a minimal leakiness in the dark state and a 5-fold dynamic range upon stimulation with blue light. Next, we created a synthetic blue light repressible promoter by positioning the EL222 binding region between −35 (TTGACA) and −10 (TATAAT) hexamers of E. coli consensus promoter sequence (31). We show that upon blue light illumination EL222 functions as the repressor of the synthetic promoter, presumably by impeding the binding of RNAP. In contrast, the synthetic promoter expresses constitutively in the dark state. We further show that dose-dependent blue light illumination pulses or intensity can precisely control the extent of induction or repression. Furthermore, the two systems are shown to be able to operate in parallel with negligible interference. Finally, we demonstrate that the EL222 controlled by blue light can be used as a molecular clock to synchronize two different receiver cells, which perform different logic functions over time. Taken together, rapidly reversible, tunable and spatiotemporally inducible and repressible endogenous gene expression characteristics from our blue light-dependent EL222 based system in E. coli will prove useful for a diverse range of synthetic biology applications.
MATERIALS AND METHODS
Plasmid construction
For all plasmid construction, Gibson assembly was performed following standard molecular biology techniques. All the plasmid designs were performed using Benchling (https://benchling.com) and DNA assembly was carried out using NEBuilder HiFi DNA assembly reaction, following manufacturer's recommendations. rrnBp1 promoter with EL222 gene (Gene ID: 3868928), PBLind-v1, PBLind-v2, PBLrep-v1 and PBLrep-v2 promoters with RFP/GFPmut3b were synthesized as gblocks from Integrated DNA Technologies (IDT) with rbs34 (BBa_B0034) (http://partsregistry.org) unless otherwise stated. Double terminator BBa_B0015 (http://partsregistry.org) was used to terminate gene transcription in all cases. Plasmid pBbE8k (JBEI Part ID: JPUB_000036, colE1 ori, Kanr) (32) was used for harbouring PBlind-v1/PBLrep-v1 promoter driving either RFP/GFPmut3b reporter gene. pBbE8k-PBlind-v1-rbs34-RFP (pBLind) and pBbE8k-PBLrep-v1-rbs34-RFP (pBLrep) was generated by inserting the PCR amplified sequence (promoter PBlind-v1/PBLrep-v1-rbs34-RFP) and pBbE8K-PBLind-v2-rbs34-RFP (pBLindv2) and pBbE8K-PBLrep-v2-rbs34-RFP (pBLrepv2) was generated by inserting the PCR amplified sequence (promoter PBLind-v2/PBLrep-v2-rbs34-RFP) using Gibson assembly. Plasmid pBbA8c (JBEI Part ID: JPUB_000038, p15A ori, Cmr) (32) was used to clone rrnBp1 promoter driving EL222 gene. Promoter rrnBp1-rbs34-EL222 gene was PCR amplified and assembled into pBbA8c vector using Gibson assembly to create pBbA8c-rrnBp1-rbs34-EL222 (pEL222). For light switchable activation and repression characterization in a single cell module, promoter PBLrep-v1-rbs34-GFPmut3b-BBa_B0015 was PCR amplified and cloned next to pBbE8k-PBLind-v1-RFP-BBa_B0015 using Gibson assembly creating pBbE8k-PBLind-v1-RFP-BBa_B0015-PBLrep-v1-rbs34-GFPmut3b-BBa_B0015 (pBPar). The N-imply gate module (pQSBLrep) was cloned using LasRLVA (destabilised version) gene under the PBLrep-v1 promoter. Similarly, the AND gate module (pQSBLind) comprises of PBLind-v1 promoter driving the expression of LasRLVA (destabilised version) gene. Both the modules comprise of the rbs34 upstream of the LasRLVA gene. Both these plasmids also encode the reporter RFPLVA (destabilized version) gene with the default RBS (rbsD) of the pBbE8K backbone under the lasI promoter (PlasI). The LVA peptide-tag sequence (AANDENYALVA) was used for the rapid degradation of the proteins. PCR products run from 1% agarose were purified individually using QIAquick gel extraction kit (Qiagen) and the concentration determined with a NanoDrop 2000 (Thermo Fisher Scientific, Waltham, MA, USA). Plasmids were isolated (QIAprep Spin Miniprep Kit, Qiagen) and were verified by DNA sequencing (first BASE). The complete sequences of the promoters and RBSs used in this study are listed in the Supplementary Table S1.
Strains and growth conditions
Escherichia coli Top10 (Invitrogen) strain was used for cloning and testing. All characterization experiments were carried out using supplemented minimal media (in 1 l) comprising: M9 salts (12.8 g Na2HPO4·7H2O, 3 g KH2PO4, 0.5 g NaCl, 1 g NH4Cl), 1 M MgSO4, 1 M CaCl2, 0.2% (w/v) casamino acids and 20 mM glucose as a sole carbon source. As appropriate, antibiotics (50 μg/ml kanamycin and 25 μg/ml chloramphenicol) were added to the medium. Seed cultures from freshly transformed plates were grown overnight in 5 ml of LB medium supplemented with appropriate antibiotics at 37°C with shaking (225 rpm). Glycerol stocks of all the cultures were made by adding 500 μl of the overnight culture and 500 μl of 100% glycerol and stored in -80°C. Where specified, N-(3-oxo-hexanoyl)-l-HSL was added to the cultures at the indicated concentrations. Overnight cultures were diluted into 5 ml of fresh pre-warmed M9 medium with the appropriate antibiotics for 2–3 h exponential outgrowth at 37°C with shaking (225 rpm). Cultures were aliquoted (0.5 ml) into 0.5 ml of pre-warmed M9 medium in triplicates of total 1 ml volume in a flat-bottom 12-well microplate (Nunc™). The microplate was incubated at 37°C with shaking (120 rpm) in a mini shaker incubator (NB-205, N-BIOTEK) with illumination (mounted on top of our custom built 3 × 4 LED panel dock) or kept in dark (wrapped in black cloth covering all edges) between each cycle of measurements. Time series OD (600 nm) and fluorescence (GFP: excitation 485 nm, emission 528 nm and RFP: excitation 540 nm, emission 600 nm) were read using Synergy™ HTX Multi-Mode Microplate Reader (BioTek). In all experiments, auto-fluorescence was measured using a negative control strain lacking the fluorescence reporter. The fluorescence/OD600 (Fluo/OD600) at a specific time for a sample culture was determined after subtracting from each of the technical triplicate readings of the negative control cultures (fluorescence free) at the same time. The fluorescence synthesis rate (Fluo.OD600−1/min) of any sample at time t, was calculated by taking the difference of Fluo/OD600 values from two time points and dividing the result by the time interval δt. Normalization of Fluo/OD600 values was calculated into a new arbitrary range (min = 0) to (max = 1) with the observed original dataset min and max values.
Illumination
Cells were illuminated using a custom built 3 × 4 LED blue light panel (465 nm) with adjustable ON/OFF pulsing and intensity for individual wells. This design incorporates a sandwich structure, where light & circuit enclosure sits at the bottom, followed by a white spacer in the middle, and a 12-well culture plate on top. The spacer holds and aligns the light & circuit enclosure with the culture in position. The tube structure inside the spacer helps to diffuse and isolate the 12 light channels for individual wells on the plate. Micro controller and LED driver circuit sit inside the bottom casing, with through-hole LEDs mounted directly on top. The 3D structures were printed by Makerbot Replicator 2 using PLA material, under settings of 0.2mm layer thickness, two shells, 230°C temperature on acrylic build plate. The blue light is generated by 16 MULTICOMP OVL-5523 LEDs. The dominant wavelength of OVL-5523 LED is 465nm, with luminous intensity of 4300 mcd at 20 mA current. The LED has 5mm diameter and 15° viewing angle, fixed 20 mm away to the bottom of the wells, resulting a 5.4 mm blue spot at the bottom of each well. The electronic circuit of the light source consists of two parts: Pre-programmed microcontroller board and LED driver circuit. In this design, microcontroller ATmega328 based Arduino nano serves as the control circuit. Pin 3, 9, 10 11 and 13 of Arduino nano communicate with Texas Instruments TLC5940 LED driver IC to set ON/OFF timing and intensity of the LEDs. TLC5940, together with peripheral components, powers the 12 LEDs using channel 1 to channel 12 to get individual control simultaneously. A standard AC-DC 5 V 1 A wall adapter is used as power supply here, which supplies VCC to Arduino, and feeds TLC5940 to power the LEDs. Illustrations of the panel and its devices are shown in the Supplementary Figure S1.
Imaging of agarose plates
We built a custom projector to project onto a 90 mm petri dish. The design incorporates a modified car door projection light and a 3D printed holder. The white LED inside the original projection light is replaced by Cree® XLamp® XP-E LED (royal blue) with a dominating wavelength of 460 nm. The LED is powered by 1W constant current driver module at 350 mA, stepped down from 5 V 1 A power adapter. The holder positions the projector to get a clear image on the surface of the plate (Supplementary Figure S2). Briefly, overnight cultures co-transformed with pBPar and pEL222 plasmids were homogeneously mixed with the soft agar solution (10 g/l tryptone, 5 g/l yeast extract, 10 g/l sodium chloride and 7 g/l agar) with appropriate antibiotics were poured onto a pre-warmed (37°C) agar plate. A photomask (each separate for the two irradiation pattern) was placed on the bottom-side of the prepared agar plate and was sealed using a tape. The agar plate was mounted on the projector with the lid facing the bottom and illuminated through the photomask. The whole setup was kept inside the incubator at 37°C and photographs were taken under UV illumination after 18–20 h of incubation.
Statistics
Data is shown as mean ± S.D. Statistical significance was determined by performing a two-way ANOVA test. P-value <0.0001 were considered statistically significant. Statistical analysis was performed using Prism 6 (GraphPad Software, Inc., CA, USA).
RESULTS
Blue light as an activator
It is evident from earlier studies that binding of LuxR-autoinducer complex functions as an transcriptional activator at the luxI promoter, by establishing contacts with both the alpha and sigma subunits of RNAP (33). Also, previous works have established that activation of EL222 is similar to LuxR class of DNA binding proteins (27). Therefore, to construct an EL222-based transcriptional activation system, we converted the LuxR-autoinducer inducible luxI promoter into a EL222-based blue light inducible promoter by replacing the LuxR binding region (lux box) with EL222-binding region overlapping the −35 region of the luxI promoter (Figure 1A). We made two different blue light inducible promoters by using two different −35 regions (TTAGCG (34)/TTACGC (30)) of the luxI promoter. We thus expected that upon blue light exposure, EL222 dimerizes and binds DNA and consequently RNAP is recruited to activate gene expression. In the absence of blue light, EL222 is inactive (27) and thus should decrease transcription. To investigate our hypothesis, we placed the blue light inducible promoter PBLind-v1 (−35 region TTAGCG)/PBLind-v2 (−35 region TTACGC) upstream of RFP reporter protein. We co-transformed E. coli cells with pBLind/pBLindv2 and pEL222 plasmids individually. We also transformed E. coli cells only with pBLind/pBLindv2 plasmid as a control, and measured RFP fluorescence as a reporter of gene expression. As expected, both the versions co-transformed with pEL222 plasmid showed strong levels of gene activation in the presence of blue light (12 W/m2) compared to the cells incubated in the dark (Figure 1B, Supplementary Figure S3A). The version 1 promoter (PBLind-v1) when exposed to blue light has ∼5-fold increase in expression compared to the dark state (Figure 1B). However, the version 2 promoter (PBLind-v2) showed only ∼ 2-fold increase in activation when exposed to blue light. Further, compared to version 1 promoter, the level of leakiness of expression (∼3.5-fold) in the dark was seen to be higher for version 2 (Supplementary Figure S3A). In the control study lacking the pEL222 plasmid, version 1 promoter showed minimal expression of RFP (Figure 1B). Hence, based on the experimental results, we chose the less leaky version 1 promoter for further study. Overall, these data suggest that in the presence of blue light EL222 can bind to the blue light inducible promoter and induce gene expression, presumably by recruiting RNA polymerase similar to LuxR-type transcriptional activators.
Figure 1.

Design and characterization of the blue light inducible and repressible gene expression system. (A) The blue light inducible promoter (PBLind-v1) consists of EL222 binding region fused to the luxI promoter. In the dark state (OFF), EL222 is unable to bind DNA and the transcription of the PBLind promoter is turned on only when exposed to blue light which triggers the EL222 transcription factor to bind to the upstream binding region and presumably recruits RNAP similar to LuxR-based transcriptional activators. (B) For the inducible promoter characterization experiments, cells were transformed with pBLind (reporter) and pEL222 (constitutively expressing EL222 protein) plasmids. As a control, we transformed cells only with pBLind plasmid. (C) The blue light repressible promoter (PBLrep-v1) consists of the EL222 binding region positioned between consensus −35 and −10 regions of RNAP binding site. The promoter is constitutive in dark and upon exposure to blue light, EL222 binds to the promoter region presumably causing steric hindrance to RNAP binding thereby repressing the RFP transcription. (D) For the repressible promoter characterization experiments, cells were transformed with pBLrep (reporter) and pEL222 (constitutively expressing EL222 protein) plasmids. As a control, we transformed cells only with pBLrep plasmid. For both the promoters, rbs34 is placed downstream of the promoter driving the RFP reporter as the output. For both (B) and (D), cells were kept in the dark or exposed to blue light (465 nm; 12 W/m2 intensity) for 6 h. Data are represented as mean ± S.D. (n = 3). Statistical significance of ****P < 0.0001 was calculated based on two-way ANOVA test.
Blue light as a repressor
We relied on previous work that demonstrated LuxR can be converted into a transcriptional repressor by positioning the lux box between and partially overlapping the consensus −35 and −10 regions (35). In line with this, we created a blue light repressible promoter (PBLrep-v1) by positioning the 18-bp EL222-binding region between E. coli consensus −35 and −10 hexamers of RNAP binding site (Figure 1C). This promoter was placed upstream of RFP reporter protein on pBLrep backbone. To evaluate the performance of the blue light repressible promoter in E. coli, we co-transformed the pBLrep plasmid along with pEL222. A greater than 3-fold reduction in fluorescence was observed when the engineered E. coli was exposed to blue light (12 W/m2) compared to the control cells incubated in the dark (Figure 1D). To verify that repression is due to EL222 binding to the promoter DNA, we performed a control experiment in the absence of EL222 plasmid. In both the cases tested (illumination or dark), the fluorescence levels were similar (Figure 1D). Further, the fluorescence levels were also comparable to that of E. coli with EL222 in the dark state, implying EL222 does not repress the promoter in the dark state. These data suggest that upon blue light exposure EL222 binds to the promoter region and prevents transcription initiation presumably through steric hindrance of RNAP binding. However, in the dark (‘OFF’) state, which is the unbinding conditions of EL222, the blue light repressible promoter is constitutively active.
Next, we tried to determine whether EL222 binding to DNA could inhibit transcription elongation. For this, we placed the EL222 binding region 17-bp downstream of the −10 hexamer of the constitutive promoter BBa_J23100 (PBLrep-v2). We chose this promoter because it is from the same E. coli consensus promoter family (36) with a relative promoter unit (RPU) of 1. We co-transformed the pBLrepv2 and pEL222 plasmids and measured the RFP fluorescence under dark and illumination (12 W/m2) conditions. Compared to the dark state, a >1.5-fold reduction in fluorescence was observed when exposed to blue light (Supplementary Figure S3B). Altogether, these results demonstrate that EL222 can serve as a blue light based repressor of transcription initiation and elongation.
Dose-dependent activation and repression
Precise tuning of gene expression levels is important for designing optimal synthetic devices. Transfer functions provide the relationship between input and output components of the genetic circuit (37). To determine the transfer functions for both the systems under different blue light illumination conditions as input, we performed two sets of experiments (Figure 2A and B). First, we varied the illumination pulse ON–OFF cycle within a constant 60 s period (OFF (0%), 5 s ON; 55 s OFF (8.33%), 15 s ON; 45 s OFF (25%), 30 s ON; 30 s OFF (50%), 45 s ON; 15 s OFF (75%) and ON (100%)) and we fixed the light intensity at 12 W/m2. Second, we varied the intensity of blue light (OFF—0, 2, 5, 9 and 12 W/m2) by fixing the illumination pulse to 100% (‘ON’). For both the experiments, we monitored the fluorescence expression output for 6 h and the values shown are normalized to the highest fluorescence observed within each experimental dataset. We observed dose-dependent increase in fluorescence expression with increasing duration of illumination pulse (Figure 2A) or intensity (Figure 2B). A rapid increase in expression of the blue light inducible system is seen when the blue light pulse ON–OFF cycle increases from 0 to 8.33% (5 s ON; 55 s OFF). The activation then saturates gradually when the pulse cycle further increases from 25% to 100%. However, the blue light repressible system shows strong exponential decrease in expression levels with maximum response observed at 50–100% range. Likewise, when blue light intensity is varied both the inducible and repressible system shows strongest transcriptional activation or repression between 5 and 12 W/m2. Very little change in induction was observed between 2 and 9 W/m2 intensity levels, as the response seems to have saturated. Interestingly, the magnitude of response of both transcriptional activation and repression increases significantly at 2 W/m2 intensity as compared to the dark state. Both transcriptional activation and repression showed maximum response at 100% illumination pulse (‘ON’) or 12 W/m2 intensity relative to the dark exposed cells. The experimental data were fitted to a Hill function model for the blue light inducible and repressible promoter transfer functions (see Supplementary Table S2). From the curve-fit model, the switch point for induction is shown as 6.5% pulse illumination or ∼1 W/m2 intensity and ∼28% pulse illumination or ∼3% intensity for repression. Overall, these data suggests that short illumination times or low intensity are sufficient for inducible response, while a longer illumination time or low intensity is required for repression.
Figure 2.

Dose-response curves of blue light inducible and repressible promoters. (A) Varying blue light illumination pulse (%), 0% (OFF), 8.33% (5 s ON; 55 s OFF), 25% (15 s ON; 45 s OFF), 50% (30 s ON; 30 s OFF), 75% (45 s ON; 15 s OFF) and 100% (ON). (B) Varying blue light intensity levels (2, 5, 9 and 12 W/m2). The curve-fits are shown as solid lines to the promoter transfer function. All data (RFP/OD600) were normalized to the highest value obtained. The error bars indicate S.D. (n = 3).
Light-switchable spatiotemporal activation and repression in a single cell
To corroborate the broad applicability of the approach, we tested whether the two promoters can function in parallel in a single cell and whether both the systems could be bidirectionally regulated (repress and activate different genes simultaneously) in a time-course and subsequently reversed through simple removal of illumination. To do this, a plasmid expressing RFP under the control of the blue light inducible promoter and GFP under the control of the blue light repressible promoter was constructed (pBPar, Figure 3A). First, we investigated whether our blue light based bidirectional regulatory system can spatially control gene expression. For this, we applied blue light through a photomask to the cells (stably transformed with pBPar and pEL222 plasmids) layered on an agar plate (Figure 3B). It is clearly evident that the areas covered by the photomask blocking the light exposure (first irradiation pattern) produce green arrow and the light exposed area turns red. Conversely, when the irradiation pattern is reversed (second irradiation pattern), the blue light exposed area of the photomask turns red and the covered area turns green. The expression pattern precisely reproduces the shape of the photomask, thus showing that our system can produce spatially resolved gene expression profile. We have also reproduced an even more complex pattern shown in Supplementary Figure S2.
Figure 3.

Light-switchable activation and repression in a single cell. (A) Design and mode of action of the biregulatory promoter system (pBPar). The blue light inducible promoter (PBLind-v1) drives the expression of RFP reporter, which is placed in series with the blue light repressible promoter (PBLrep-v1) that controls the GFP expression. rbs34 was used downstream of both PBlind and PBLrep. In the presence of blue light (12 W/m2) transcription of the PBLind-v1 is activated expressing RFP, while the PBLrep-v1 is repressed. Conversely in the dark state, RFP expression is de-activated at the PBlind, while PBlrep constitutively expresses GFP. (B) Spatial control of gene expression. Cells transformed with pBPar and pEL222 plasmids, plated on an agar plate were illuminated with blue light through a photomask with two different spatial irradiation patterns for 18–20 h at 37°C. Images were taken under UV illumination. The width of the arrow is 1.8 cm.
Next, to study the temporal behavior of our system, E. coli Top10 cells co-transformed with pBPar and pEL222 were characterized for fluorescence expression over 8 h duration in a 2 h OFF–ON–OFF–ON cycle (Figure 4). Each ‘ON’ (100% illumination pulse) cycle has a 2 h blue light illumination at intensity (12 W/m2). At time zero, early exponential phase cell culture grown without illumination was transferred into a 12-well plate mounted on our in-house blue light 3 × 4 LED panel system incubated at 37°C shaking at 120 rpm. For the first period of 2 h illumination ‘OFF’ cycle, our data indicated that the GFP reporter protein under the blue light repressible promoter system started to increase to 2-fold expression level and the RFP reporter protein under the blue light inducible promoter exhibited low basal activity (Figure 4A). In the subsequent 2 h illumination ‘ON’ cycle period the blue light inducible promoter exhibited a 2-fold increase in the RFP expression while the GFP expression decreased 2-fold. Followed by the next 2 h illumination ‘OFF’ cycle, GFP expression was restored, resulting in an increase to ∼ 2.5-fold while the RFP expression from the activated level was slowing down (evident from the synthesis rate curve, Figure 4B). Re-illumination of blue light in the final 2 h ‘ON’ cycle period, increased RFP expression ∼ 1-fold and decreased GFP expression ∼1.5-fold. Next, we attempted to confirm whether RFP expression from the blue light inducible promoter once activated by blue light illumination, can slow down and sustain the expression level for longer periods when illumination is turned ‘OFF’. We exposed the cells with blue light for the first cycle and post 2 h after the first illumination regimen, we turned ‘OFF’ the blue light for the subsequent 6 h period. Consistent with our earlier fluorescence measurement, RFP expression increased ∼ 1.5-fold while GFP expression decreased ∼2-fold during first illumination on-cycle and in the following 6 h ‘OFF’ cycle RFP expression slowed down and sustained the expression level throughout (Supplementary Figure S4).
Figure 4.

Temporal control of gene expression by blue light based bidirectional promoter system in a single cell. Cells transformed with pBPar and pEL222 plasmids were exposed to blue light repeatably and reversibly in (A) OFF–ON–OFF–ON cycle for every 2 h over a period of 8 h and (E) OFF–ON cycle for every 3 h over a period of 6 h. The data (Fluo/OD600) were normalized to the highest value obtained. (B) and (F) are calculated synthesis rates (min−1) based on the normalized Fluo/OD600 values obtained. Error bars indicate S.D. (n = 3). The solid lines represent the model predicted temporal behavior. Model predicted (C) and (G) mRNA synthesis rates (min−1) and (D) and (H) mRNA abundance (μM). Grey areas represent dark state (‘OFF’) while the blue regions (illumination ‘ON’, 12 W/m2).
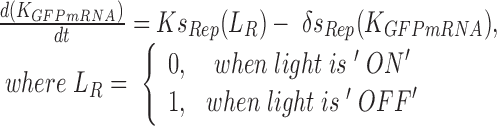
To have quantitative insights of the blue light-inducible/repressible system behavior, a kinetic model based on ordinary differential equations were developed. The model was developed and simulated using MATLAB Simulink to investigate the mRNA synthesis rate of the two light-dependant promoter systems, mRNA abundance and fluorescent protein production as a function of time and illumination conditions. The experiment data in Figure 4 together with literature data was first used to parameterize the model. The ODE equations and the detailed derivation of the model are described below:
 |
(1) |
 |
(2) |
 |
(3) |
 |
(4) |
 |
(5) |
 |
(6) |
The above ODE equations approximate the behavior of the gene circuit in bacteria, where Equations (1) and (2) define the blue light-mediated transcriptional synthesis rates of the inducible and repressible systems respectively. The parameter ‘LI’ or ‘LR’ represents the light activation coefficient, whose value depends on the type of promoter activated, and parameters Ks and δs determine the steepness of the light activation and deactivation kinetics. For the light-inducible system, Equations (3) and (5) describe the transcriptional and translational activity for RFP production. Whereas for the light-repressible system, Equations (4) and (6) describe the transcriptional and translational activity for GFP production. Parameter estimation was performed for the terms Ks, δs and δGFP. using non-linear least squares fitting algorithm (lsqnonlin function) with Simulink to obtain the best curve-fit for the 2 h OFF–ON–OFF–ON light time period experiment (Figure 4). The basal expressions of mRNA were derived from the initial pulse width illumination response experiment. The parameters derived for the model and initial conditions are shown in Supplementary Table S3.
Subsequently, the model was then used to validate the system behavior in an independent experiment when the illumination time was changed to 3 h OFF–ON cycle over 6 h duration (Figure 4E and F). The model shows very good correlation with the experiments (r2 > 0.9), which validates that our model can approximate the system behavior closely. For the case of the inducible system, it can be seen that for activation (blue light ‘ON’), there is an observed initial lag in the RFP expression. The model shows that this is due to the gradual increase in the mRNA synthesis rate. This could be due to the time delay in EL222 binding DNA and initiating transcription. On deactivation (blue light ‘OFF’), our simulations show gradual decay of the mRNA synthesis rates. Presumably, this could be due to the unavailability of the transcription machineries caused by the unbinding of EL222, resulting in a reduced mRNA abundance level (Figure 4D and H). For the case of repressible system, when the illumination is turned ‘OFF’, our model exhibits an immediate rise in mRNA synthesis rate before reaching its maximum steady state. Thus, GFP mRNA level increases rapidly which leads to an increase in GFP production. And when the illumination is turned ‘ON’, the mRNA synthesis rate decays rapidly, resulting in a reduction of the total mRNA level. This could be due to fast blockage of transcriptional initiation (Figure 4D and H). From the model, it shows that the increase in synthesis rate of the repressible system is >1.5-fold faster than that of the inducible system. The model also reveals that the bidirectional promoter system's synchronous oscillatory behavior can be further optimized with faster degradation rates of proteins (Based on the sensitivity analysis performed, data not shown).
Further, prediction of the oscillatory behavior for the system was performed over 48 h duration (assuming constant growth conditions) for varying time period durations (4, 8, 12, 16 and 20 h respectively) and duty cycles of light ON and OFF (from 10% to 90%) for each of the time period (see Supplementary Figure S5 for more information). The simulations show that for short time period (e.g. 4 h), the oscillatory behavior is poorly defined whereas for longer time period (e.g. 12–20 h), oscillatory behavior is better defined with larger peak-to-base fluctuation. Interestingly, the model predicts that the two systems can have a synchronous oscillatory behavior for time period (>12 h) when the duty cycle of light ON and OFF is maintained at 50% or 60%. Taken together, the results suggest that the change in duty cycles for a time period can produce varied amplitudes and time-evolution patterns of fluorescence oscillations. Overall, these results recapitulates that both the blue light activation and repression systems can function coherently in a single cell and can achieve rapid reversible and repeatable gene expression.
Optogenetic synchronization of a modular AND gate and N-Imply gate
Recently, synthetic biology community is moving towards engineering multi-cell microbial consortia instead of single-cell populations because of their ability to perform complex functions and different tasks enabling division of overall metabolic workload (38–40). One intriguing application of spatially and temporally controlling different cells would open up new avenues in various biomedical applications (2). We sought to achieve multicellular synchronization using the blue light as a clock signal, to optogenetically control and synchronize two receiver cells performing different logic functions (AND and N-imply logic gate) in the presence of AHL (3-oxo-C12-HSL) input signal (Figure 5A). Each logic gate is encoded into two separate E. coli receiver strains. Receiver cell[1] which functions as the N-imply gate logic circuit (Figure 5B) has a plasmid (pQSBLrep) carrying LasRLVA gene downstream of the PBLrep-v1 promoter and RFPLVA under the control of the lasI promoter (PLasI). Transcription of LasRLVA is constitutive under dark state (blue light turned ‘OFF’) and repressible when exposed to blue light. Fluorescence reporter RFPLVA is activated only in the presence of AHL input signal by the LasR-AHL dimer binding the las box of PLasI. Similarly, we created the AND gate logic in receiver cell[2] (Figure 5C) with a plasmid (pQSBLind) comprising of LasRLVA gene downstream of the PBLind-v1 promoter and RFPLVA under the control of PLasI. Transcription of LasRLVA is inducible under blue light illumination and uninduced during ‘OFF’ state. Only in the presence of AHL input signal, RFPLVA transcription is activated.
Figure 5.

Optogenetic synchronization of two receiver cells performing a modular AND gate and a modular N-imply gate respectively. (A) Schematic representation of the optogenetic synchronization of both receiver cell[1], performing N-imply logic and receiver cell[2] performing AND gate logic using blue light as the clock signal. The input to both the receivers is AHL signal. The output signal is the RFP fluorescence. Receiver cell[1], produces the output signal only when the blue light (clock) is turned ‘OFF’ and AHL (input) is present (N-imply logic) while the receiver cell[2] output signal is produced only when both blue light (clock) is turned ‘ON’ and AHL (input) is present (AND logic). (B) Top, mode of action of N-imply logic in receiver cell[1]. pQSBLrep: LasRLVA is expressed under PBLrep-v1 promoter, while the output RFPLVA signal is under PLasI promoter. Bottom, characterization results of N-imply gate logic in receiver cell[1] co-transformed with pQSBLrep and pEL222 plasmids. (C) Top, mode of action of AND logic in receiver cell[2]. pQSBLind: LasRLVA is expressed under PBLind-v1 promoter, while the output RFPLVA signal is under PLasI promoter. Bottom, characterization results of AND gate logic in receiver cell[2] co-transformed with pQSBLrep and pEL222 plasmids. In both the receivers, LasR and RFP are destabilized version of the proteins with LVA degradation tag, denoted by *. rbs34 and rbsD are used downstream of PBLrep-v1/PBlind-v1 and PLasI respectively. The blue light clock signals used were, pulse[1]: 1 h ON, 5 h OFF; and pulse[2]: 1 h OFF, 5 h ON. The input signal AHL (5 μM) was added at the end of third hour of the experiment. The data (RFP/OD600) were normalized to the highest value obtained. Error bars indicate S.D. (n = 3).
To verify the coordinated behavior of the two logic gates, we characterized the two E. coli strains: receiver cell[1] carrying pQSBLrep and pEL222, and receiver cell[2] carrying pQSBLind and pEL222 with two clock signal pulses (pulse[1]: 1 h ON, 5 h OFF; and pulse[2]: 1 h OFF, 5 h ON) and the quorum input signal (5 μM AHL) supplied exogeneously (Figure 5B and C). Briefly, the exponentially growing receiver cells[1] and [2] were transferred in triplicates into column A and C respectively separated by the blank media (column B) in two 12-well plates. One of the plates were maintained in the dark and the other was placed onto our custom built 3 × 4 LED panel and the illumination was turned ‘ON’ for a period of 1 h. Next, the plates were switched places and were allowed to grow for a period of 2 h ON/OFF based on the clock signal pulse. At 180 min, we supplemented the cultures with 5 μM AHL. We measured the output RFP fluorescence every 30 min for the total study period of 6 h. Our data suggests that receiver cell[1] exhibited the desired response of a digital logic N-imply gate (Figure 5B). A greater than 5-fold increase in the output RFP was observed only when the blue light is ‘OFF’ in clock pulse[1] and AHL is present. Also, the response to clock pulse[2] is very sharp repressing the expression of RFP even in the presence of AHL. In the case of receiver cell[2], the AND gate system showed a leaky response probably due to the leakiness of the PBLind-v1 promoter. Compared to the pulse[1] expression, the output RFP was >1.5-fold in the pulse[2] only when blue light is turned ‘ON’ and AHL is added (Figure 5C). Overall, we demonstrated for the first time that multiple cells performing different logic functions can be controlled and synchronized by the periodic pulses of the blue light clock signal.
DISCUSSION
In this paper, we exploited the natural EL222 protein which is a ‘one-component’ signalling system (28) containing both the LOV sensor and a LuxR-type HTH DNA-binding domain, to either activate or repress gene expression in E. coli. For this aim, we constructed two novel EL222-based synthetic promoters that can function as blue light inducible (pBLind) and blue light repressible (pBLrep) systems respectively (Figure 1). First, EL222-dependent activation of gene expression in E. coli was achieved by replacing the lux-box with EL222-binding region in the luxI promoter (PBLind-v1). In the presence of blue light, EL222 protein dimerizes and binds to EL222-binding region in PBLind-v1 providing recruitment of RNAP to the luxI promoter, activating transcription initiation. In the dark state, EL222 adopts an inactive monomeric conformation and gene expression remains silent with minimal background expression. Upon illumination, a maximum of 5-fold induction was achieved compared to the dark state. These findings suggest that, similar to autoinducer based LuxR-type transcriptional activation (30), EL222 acts as a σ70 dependent transcriptional activator that controls the expression of genes from the modified luxI promoter (PBLind-v1) in response to blue light signal. It is quite evident that, the minimal background levels from reporter vector pBLind alone and dark state (non-inducing condition) cells co-transformed with (pBLind and pEL222) are almost the same. Suggesting that, the basal leakiness is from the pBLind vector itself. We believe, that activation and basal expression could be further optimized with further engineering of the PBLind-v1 promoter, thereby increase the accuracy of gene expression control (41,42).
Likewise, EL222 functioned as a blue light-dependent repressor when the EL222-binding region was positioned between −35 and −10 regions of E. coli consensus promoter sequence (PBLrep-v1) (Figure 1). Upon exposure to blue light, a greater than 3-fold tight repression was achieved due to the high affinity and specificity of EL222 for EL222-binding region in the modified synthetic promoter (PBLrep-v1), presumably by preventing the binding of RNAP. In contrast, PBLrep-v1 promoter is constitutively expressed due to the low affinity of EL222 for DNA in the dark. We also observed that, when we moved the EL222-binding region downstream of the −10 hexamer (PBLrep-v2 promoter), EL222 repression upon blue light illumination was also evident. This goes to suggest that, EL222 based repression is flexible and is dependent on the presence of the EL222-binding region and blue light stimulus. These findings are consistent with other transcriptional activators reported to function as repressors when the activator binding site is placed at the core (between -35 and -10 regions) or proximal (downstream of −10 hexamer) region of a promoter (43–45).
Overall, this EL222-based blue light switchable gene expression system proposed here has several advantages compared with previously described light-based gene expression methods in E. coli. First, the system is very simple and compact, as it requires only the modified promoter sequence, constitutively expressing native EL222 protein and blue light stimulus to directly regulate its DNA-binding activity (Figure 1). Second, fine-tuning of desired expression levels can be achieved by varying the dosage of either blue light pulses or intensity (Figure 2). Third, both the light inducible and repressible systems can operate in parallel in a single cell with negligible interference (Figure 3). To the best of our knowledge, this is the first demonstration that a single transcription factor can positively and negatively regulate target genes in a single cell depending on light illumination. This would prove useful for synthetic biologists, who are currently limited by this lack of interoperable parts to control multiple genes in parallel (46,47). Fourth, an important feature is that gene activation or repression is rapidly reversible through simple removal of illumination (Figure 4). This rapid ON and OFF kinetics of this system can be a valuable tool for applications that require precise control in gene expression profiles. For example, our tools could be used to control dynamic expression of enzymes in an engineered metabolic pathway, wherein timing and desired expression levels are critical for efficient yield. Perhaps the most striking feature of this bidirectional promoter system is its ability to spatiotemporally oscillate with desired period and amplitude. This tunable oscillatory promoter system clearly overcomes the chemical oscillatory process (48,49), transforming our ability to systematically investigate the dynamic processes that orchestrate in a cell. Finally, we have demonstrated the utility of the approach for the first time to achieve synchronous dynamic logic behavior over time in two-different receiver cells using blue light pulses as a clock signal (Figure 5). Previously, it was shown that quorum sensing can be used to synchronize oscillations in a population of cells (50). We have gone a step forward in this feat by synchronizing the communication between growing population of cells using light as a molecular clock signal. Although our demonstration is only based on a single pulse, the basic design principle shown here has the potential to further facilitate microbial consortium synchronization in dividing their labour to perform complex tasks (38).
Another key advantage of this EL222-based system is its specificity in its binding (27,28), which is one of the major factors in building genetic circuits (51) as it circumvents the off-target effects. Notably, the methodology described here by modifying existing promoters to incorporate light-based regulation by replacing binding sequences of transcription factors is a modular concept. Meaning, EL222 binding region can be swapped with LuxR-type HTH binding transcription factors (52) like LasR, RhlR and TraR binding regions of their respective regulatory promoters to achieve distinct light-regulated modular activation. In addition, modular EL222-based repression approach shown here represents a starting point for a systematic exploration of the repository of functional prokaryotic promoters (53). We anticipate that this scalability approach would pave a new way to generate more modular and orthogonal EL222-based genetic devices and parts. The availability of such diverse suite of optogenetic toolbox combined with its superior spatiotemporal resolution would be highly beneficial to expedite our ability to solve complex biological problems. Taken together, the generic workflow presented here would facilitate rapid and reliable incorporation of light-regulated tools into various bacterial hosts expanding the synthetic biology toolbox.
Supplementary Material
SUPPLEMENTARY DATA
Supplementary Data are available at NAR Online.
FUNDING
Ministry of Education [MoE AcRF Tier 2 grant, AcRF ARC43/13], Singapore. Funding for open access charge: Ministry of Education [MoE AcRF Tier 2 grant, AcRF ARC43/13], Singapore.
Conflict of interest statement. None declared.
REFERENCES
- 1.Lenz P., Søgaard-Andersen L. Temporal and spatial oscillations in bacteria. Nat. Rev. Micro. 2011;9:565–577. doi: 10.1038/nrmicro2612. [DOI] [PubMed] [Google Scholar]
- 2.Toettcher J.E., Voigt C.A., Weiner O.D., Lim W.A. The promise of optogenetics in cell biology: interrogating molecular circuits in space and time. Nat. Methods. 2011;8:35–38. doi: 10.1038/nmeth.f.326. [DOI] [PMC free article] [PubMed] [Google Scholar]
- 3.Bacchus W., Fussenegger M. The use of light for engineered control and reprogramming of cellular functions. Curr. Opin. Biotechnol. 2012;23:695–702. doi: 10.1016/j.copbio.2011.12.004. [DOI] [PubMed] [Google Scholar]
- 4.Muller K., Weber W. Optogenetic tools for mammalian systems. Mol. Biosyst. 2013;9:596–608. doi: 10.1039/c3mb25590e. [DOI] [PubMed] [Google Scholar]
- 5.Lutz R., Bujard H. Independent and tight regulation of transcriptional units in Escherichia coli via the LacR/O, the TetR/O and AraC/I1-I2 regulatory elements. Nucleic Acids Res. 1997;25:1203–1210. doi: 10.1093/nar/25.6.1203. [DOI] [PMC free article] [PubMed] [Google Scholar]
- 6.Shimizu-Sato S., Huq E., Tepperman J.M., Quail P.H. A light-switchable gene promoter system. Nat. Biotechnol. 2002;20:1041–1044. doi: 10.1038/nbt734. [DOI] [PubMed] [Google Scholar]
- 7.Bennett M.R., Pang W.F., Ostroff N.A., Baumgartner B.L., Nayak S., Tsimring L.S., Hasty J. Metabolic gene regulation in a dynamically changing environment. Nature. 2008;454:1119–1122. doi: 10.1038/nature07211. [DOI] [PMC free article] [PubMed] [Google Scholar]
- 8.Xie J., Nair A., Hermiston T.W. A comparative study examining the cytotoxicity of inducible gene expression system ligands in different cell types. Toxicol. In Vitro. 2008;22:261–266. doi: 10.1016/j.tiv.2007.08.019. [DOI] [PubMed] [Google Scholar]
- 9.Mendelsohn A.R. An enlightened genetic switch. Nat. Biotechnol. 2002;20:985–987. doi: 10.1038/nbt1002-985. [DOI] [PubMed] [Google Scholar]
- 10.Dunlap J.C. Molecular bases for circadian clocks. Cell. 1999;96:271–290. doi: 10.1016/s0092-8674(00)80566-8. [DOI] [PubMed] [Google Scholar]
- 11.Lee T.I., Rinaldi N.J., Robert F., Odom D.T., Bar-Joseph Z., Gerber G.K., Hannett N.M., Harbison C.T., Thompson C.M., Simon I., et al. Transcriptional regulatory networks in Saccharomyces cerevisiae. Science. 2002;298:799–804. doi: 10.1126/science.1075090. [DOI] [PubMed] [Google Scholar]
- 12.Zhang K., Cui B. Optogenetic control of intracellular signaling pathways. Trends Biotechnol. 2015;33:92–100. doi: 10.1016/j.tibtech.2014.11.007. [DOI] [PMC free article] [PubMed] [Google Scholar]
- 13.Müller K., Naumann S., Weber W., Zurbriggen M.D. Optogenetics for gene expression in mammalian cells. Biol. Chem. 2015;396:145–152. doi: 10.1515/hsz-2014-0199. [DOI] [PubMed] [Google Scholar]
- 14.Dance A. Micromanagement with light. Nature. 2015;528:291–294. doi: 10.1038/528291a. [DOI] [PubMed] [Google Scholar]
- 15.Tischer D., Weiner O.D. Illuminating cell signalling with optogenetic tools. Nat. Rev. Mol. Cell. Biol. 2014;15:551–558. doi: 10.1038/nrm3837. [DOI] [PMC free article] [PubMed] [Google Scholar]
- 16.Levskaya A., Chevalier A.A., Tabor J.J., Simpson Z.B., Simpson Z.B., Lavery L.A., Levy M., Davidson E.A., Scouras A., Ellington A.D., et al. Synthetic biology: engineering Escherichia coli to see light. Nature. 2005;438:441–442. doi: 10.1038/nature04405. [DOI] [PubMed] [Google Scholar]
- 17.Tabor J.J., Levskaya A., Voigt C.A. Multichromatic control of gene expression in Escherichia coli. J. Mol. Biol. 2011;405:315–324. doi: 10.1016/j.jmb.2010.10.038. [DOI] [PMC free article] [PubMed] [Google Scholar]
- 18.Ohlendorf R., Vidavski R.R., Eldar A., Moffat K., Moglich A. From dusk till dawn: one-plasmid systems for light-regulated gene expression. J. Mol. Biol. 2012;416:534–542. doi: 10.1016/j.jmb.2012.01.001. [DOI] [PubMed] [Google Scholar]
- 19.Olson E.J., Tabor J.J. Optogenetic characterization methods overcome key challenges in synthetic and systems biology. Nat. Chem. Biol. 2014;10:502–511. doi: 10.1038/nchembio.1559. [DOI] [PubMed] [Google Scholar]
- 20.Ye H., Baba M.D.-E., Peng R.-W., Fussenegger M. A synthetic optogenetic transcription device enhances blood-glucose homeostasis in mice. Science. 2011;332:1565–1568. doi: 10.1126/science.1203535. [DOI] [PubMed] [Google Scholar]
- 21.Motta-Mena L.B., Reade A., Mallory M.J., Glantz S., Weiner O.D., Lynch K.W., Gardner K.A.-O. An optogenetic gene expression system with rapid activation and deactivation kinetics. Nat. Chem. Biol. 2014;10:196–202. doi: 10.1038/nchembio.1430. [DOI] [PMC free article] [PubMed] [Google Scholar]
- 22.Polstein L.R., Gersbach C.A. A light-inducible CRISPR-Cas9 system for control of endogenous gene activation. Nat. Chem. Biol. 2015;11:198–200. doi: 10.1038/nchembio.1753. [DOI] [PMC free article] [PubMed] [Google Scholar]
- 23.Müller K., Engesser R., Metzger S., Schulz S., Kampf M.M., Busacker M., Steinberg T., Tomakidi P., Ehrbar M., Nagy F., et al. A red/far-red light-responsive bi-stable toggle switch to control gene expression in mammalian cells. Nucleic Acids Res. 2013;41:e77. doi: 10.1093/nar/gkt002. [DOI] [PMC free article] [PubMed] [Google Scholar]
- 24.Kennedy M.J., Hughes R.M., Peteya L.A., Schwartz J.W., Ehlers M.D., Tucker C.L. Rapid blue-light-mediated induction of protein interactions in living cells. Nat. Methods. 2010;7:973–975. doi: 10.1038/nmeth.1524. [DOI] [PMC free article] [PubMed] [Google Scholar]
- 25.Schmidl S.R., Sheth R.U., Wu A., Tabor J.J. Refactoring and optimization of light-switchable Escherichia coli two-component systems. ACS Synth. Biol. 2014;3:820–831. doi: 10.1021/sb500273n. [DOI] [PubMed] [Google Scholar]
- 26.Ang J., Harris E., Hussey B.J., Kil R., McMillen D.R. Tuning Response Curves for Synthetic Biology. ACS Synth. Biol. 2013;2:547–567. doi: 10.1021/sb4000564. [DOI] [PMC free article] [PubMed] [Google Scholar]
- 27.Zoltowski B.D., Motta-Mena L.B., Gardner K.H. Blue light-induced dimerization of a bacterial LOV-HTH DNA-binding protein. Biochemistry. 2013;52:6653–6661. doi: 10.1021/bi401040m. [DOI] [PMC free article] [PubMed] [Google Scholar]
- 28.Rivera-Cancel G., Motta-Mena L.B., Gardner K.H. Identification of natural and artificial DNA substrates for light-activated LOV-HTH transcription factor EL222. Biochemistry. 2012;51:10024–10034. doi: 10.1021/bi301306t. [DOI] [PMC free article] [PubMed] [Google Scholar]
- 29.Nash A.I., McNulty R., Shillito M.E., Swartz T.E., Bogomolni R.A., Luecke H., Gardner K.H. Structural basis of photosensitivity in a bacterial light-oxygen-voltage/helix-turn-helix (LOV-HTH) DNA-binding protein. Proc. Natl. Acad. Sci. U.S.A. 2011;108:9449–9454. doi: 10.1073/pnas.1100262108. [DOI] [PMC free article] [PubMed] [Google Scholar]
- 30.Johnson D.C., Ishihama A., Stevens A.M. Involvement of region 4 of the sigma70 subunit of RNA polymerase in transcriptional activation of the lux operon during quorum sensing. FEMS Microbiol. Lett. 2003;228:193–201. doi: 10.1016/S0378-1097(03)00750-X. [DOI] [PubMed] [Google Scholar]
- 31.Harley C.B., Reynolds R.P. Analysis of E. coli promoter sequences. Nucleic Acids Res. 1987;15:2343–2361. doi: 10.1093/nar/15.5.2343. [DOI] [PMC free article] [PubMed] [Google Scholar]
- 32.Lee T.S., Krupa R.A., Zhang F., Hajimorad M., Holtz W.J., Prasad N., Lee S.K., Keasling J.D. BglBrick vectors and datasheets: A synthetic biology platform for gene expression. J. Biol. Eng. 2011;5 doi: 10.1186/1754-1611-5-12. doi:10.1186/1754-1611-5-12. [DOI] [PMC free article] [PubMed] [Google Scholar]
- 33.Qin N., Callahan S.M., Dunlap P.V., Stevens A.M. Analysis of LuxR regulon gene expression during quorum sensing in Vibrio fischeri. J. Bacteriol. 2007;189:4127–4134. doi: 10.1128/JB.01779-06. [DOI] [PMC free article] [PubMed] [Google Scholar]
- 34.Egland K.A., Greenberg E.P. Quorum sensing in Vibrio fischeri: elements of the luxl promoter. Mol. Microbiol. 1999;31:1197–1204. doi: 10.1046/j.1365-2958.1999.01261.x. [DOI] [PubMed] [Google Scholar]
- 35.Egland K.A., Greenberg E.P. Conversion of the Vibrio fischeri transcriptional activator, LuxR, to a repressor. J. Bacteriol. 2000;182:805–811. doi: 10.1128/jb.182.3.805-811.2000. [DOI] [PMC free article] [PubMed] [Google Scholar]
- 36.Kelly J.R., Rubin A.J., Davis J.H., Ajo-Franklin C.M., Cumbers J., Czar M.J., de Mora K., Glieberman A.L., Monie D.D., Endy D. Measuring the activity of BioBrick promoters using an in vivo reference standard. J. Biol. Eng. 2009;3 doi: 10.1186/1754-1611-3-4. doi:10.1186/1754-1611-3-4. [DOI] [PMC free article] [PubMed] [Google Scholar]
- 37.Canton B., Labno A., Endy D. Refinement and standardization of synthetic biological parts and devices. Nat. Biotechnol. 2008;26:787–793. doi: 10.1038/nbt1413. [DOI] [PubMed] [Google Scholar]
- 38.Brenner K., You L., Arnold F.H. Engineering microbial consortia: a new frontier in synthetic biology. Trends Biotechnol. 2008;26:483–489. doi: 10.1016/j.tibtech.2008.05.004. [DOI] [PubMed] [Google Scholar]
- 39.Hennig S., Rodel G., Ostermann K. Artificial cell-cell communication as an emerging tool in synthetic biology applications. J. Biol. Eng. 2015;9 doi: 10.1186/s13036-015-0011-2. [DOI] [PMC free article] [PubMed] [Google Scholar]
- 40.Bacchus W., Fussenegger M. Engineering of synthetic intercellular communication systems. Metab. Eng. 2013;16:33–41. doi: 10.1016/j.ymben.2012.12.001. [DOI] [PubMed] [Google Scholar]
- 41.Loew R., Heinz N., Hampf M., Bujard H., Gossen M. Improved Tet-responsive promoters with minimized background expression. BMC Biotechnol. 2010;10 doi: 10.1186/1472-6750-10-81. doi:10.1186/1472-6750-10-81. [DOI] [PMC free article] [PubMed] [Google Scholar]
- 42.Murphy K.F., Balazsi G., Collins J.J. Combinatorial promoter design for engineering noisy gene expression. Proc. Natl. Acad. Sci. U.S.A. 2007;104:12726–12731. doi: 10.1073/pnas.0608451104. [DOI] [PMC free article] [PubMed] [Google Scholar]
- 43.Benson N., Sugiono P., Youderian P. DNA sequence determinants of lambda repressor binding in vivo. Genetics. 1988;118:21–29. doi: 10.1093/genetics/118.1.21. [DOI] [PMC free article] [PubMed] [Google Scholar]
- 44.Saviola B., Seabold R.R., Schleif R.F. DNA bending by AraC: a negative mutant. J. Bacteriol. 1998;180:4227–4232. doi: 10.1128/jb.180.16.4227-4232.1998. [DOI] [PMC free article] [PubMed] [Google Scholar]
- 45.Cox R.S., 3rd, Surette M.G., Elowitz M.B. Programming gene expression with combinatorial promoters. Mol. Syst. Biol. 2011;3:145. doi: 10.1038/msb4100187. [DOI] [PMC free article] [PubMed] [Google Scholar]
- 46.Rao C.V. Expanding the synthetic biology toolbox: engineering orthogonal regulators of gene expression. Curr. Opin. Biotechnol. 2012;23:689–694. doi: 10.1016/j.copbio.2011.12.015. [DOI] [PubMed] [Google Scholar]
- 47.Lu T.K., Khalil A.S., Collins J.J. Next-generation synthetic gene networks. Nat. Biotechnol. 2009;27:1139–1150. doi: 10.1038/nbt.1591. [DOI] [PMC free article] [PubMed] [Google Scholar]
- 48.Novak B., Tyson J.J. Design principles of biochemical oscillators. Nat. Rev. Mol. Cell. Biol. 2008;9:981–991. doi: 10.1038/nrm2530. [DOI] [PMC free article] [PubMed] [Google Scholar]
- 49.Mukherji S., van Oudenaarden A. Synthetic biology: understanding biological design from synthetic circuits. Nat. Rev. Genet. 2009;10:859–871. doi: 10.1038/nrg2697. [DOI] [PMC free article] [PubMed] [Google Scholar]
- 50.Danino T., Mondragon-Palomino O., Tsimring L., Hasty J. A synchronized quorum of genetic clocks. Nature. 2010;463:326–330. doi: 10.1038/nature08753. [DOI] [PMC free article] [PubMed] [Google Scholar]
- 51.Slusarczyk A.L., Lin A., Weiss R. Foundations for the design and implementation of synthetic genetic circuits. Nat. Rev. Genet. 2012;13:406–420. doi: 10.1038/nrg3227. [DOI] [PubMed] [Google Scholar]
- 52.Withers H., Swift S., Williams P. Quorum sensing as an integral component of gene regulatory networks in Gram-negative bacteria. Curr. Opin. Microbiol. 2001;4:186–193. doi: 10.1016/s1369-5274(00)00187-9. [DOI] [PubMed] [Google Scholar]
- 53.Kanhere A., Bansal M. Structural properties of promoters: similarities and differences between prokaryotes and eukaryotes. Nucleic Acids Res. 2005;33:3165–3175. doi: 10.1093/nar/gki627. [DOI] [PMC free article] [PubMed] [Google Scholar]
Associated Data
This section collects any data citations, data availability statements, or supplementary materials included in this article.