

Abstract
BACKGROUND
The aim of this study was to investigate the associations between ambient air pollution and emergency department (ED) visits for depression.
METHODS
Health data were retrieved from the National Ambulatory Care Reporting System. ED visits for depression were retrieved from the National Ambulatory Care Reporting System using the International Classification of Diseases (ICD-10), Tenth revision codes; ICD-10: F32 (mild depressive episode) and ICD-10: F33 (recurrent depressive disorder). A case-crossover design was employed for this study. Conditional logistic regression models were used to estimate odds ratios.
RESULTS
For females, exposure to ozone was associated with increased risk of an ED visit for depression between 1 and 7 days after exposure, for males, between 1 and 5, and 8 days after exposure, with odds ratios ranging between 1.02 and 1.03.
CONCLUSIONS
These findings suggest that, as hypothesized, there is a positive association between exposure to air pollution and ED visits for depression.
Keywords: air pollution, case-crossover, emergency department visit, depression, multicity study, suicide attempt, substance abuse
Introduction
Depression is one of the most common mental health problems and is a significant cause of morbidity. Depression interferes with daily functioning and quality of life and places significant burden on the health care system.1 Depression is also an important risk factor for suicide.2 Many factors contribute to the etiology of depression, including stressful life events,3,4 medical treatments, nonpsychiatric illnesses, such as neurological conditions,5 stroke,6 diabetes,7 and cancer,8 and psychological factors. Recent studies have demonstrated an association between air pollution and depressive symptoms in humans.9–18
Gaseous ambient air pollutants such as ozone are known to behave as harmful agents.19 Fine particulate matter are associated with increased mortality due to respiratory disease, heart disease, and stroke.20 Ozone exposure is known to affect health19,21–28 and is mainly a risk factor for respiratory conditions such as asthma.29–31 Several studies have also linked ambient ozone to nonrespiratory conditions such as cardiac disease,31,32 appendicitis,33 headaches and migraines,34 and skin conditions.35–39 Moreover, because of its oxidative properties, ozone may induce oxidative stress, affecting the central nervous system (CNS), which is a potential cause of depression.40 Indeed, some studies have demonstrated links between ozone levels and depression9,10,16 and suicide attempts.11,40,41
A study conducted in Edmonton, Canada, suggested that emergency department (ED) visits for depression are associated with exposure to ambient air pollution.9 This time series study analyzed 15,556 ED visits for depression between 1992 and 2002. In another Canadian study, a hierarchical clusters design was used to examine 27,047 ED visits for depression in 6 Canadian cities. Results showed a correlation between ED visits for depression and ambient air pollution, most of which results from the combustion of fossil fuels, such as from motor vehicles.10 A study of 537 participants in Seoul, Korea, reported that an increase in ambient air pollution, specifically PM2.5, NO2, and O3, was associated with an increase in depressive symptoms among elderly adults. These results add to the growing body of literature, suggesting an association between ambient air pollution and emotional symptoms.16
Suicide attempts as a result of depression have also been linked to air pollution exposure. In a study in Vancouver, Canada, ambient air pollution was associated with ED visits for suicide attempts.11 A study in Taipei city, Taiwan, examined 4,857 deaths by suicide, demonstrating a temporal relation between suicide and air pollution.41
Results from several studies suggest that exposure to air pollutants may affect men and women differently.42 For example, sex hormones estradiol and testosterone are known to influence transportation and accumulation of toxic chemicals to the brain and other organs. It is not yet known how these sex differences might bear on depression and suicide risk.42
Only limited number of studies have been reported on the relations between air pollution and depression, and most of these studies were done in a single city with small sample size. This might be as a result of the fact that depression is not a conventional disease that has been biologically linked to air pollution. The aim of this multicity study was to investigate the association between ambient air pollution, especially ozone exposure, and ED visits for depression during the period from April 2004 to December 2011 in nine urban areas across Ontario, Canada: Algoma, Halton, Hamilton, London, Ottawa, Peel, Toronto, Windsor, and York. We also examined the relations between air pollution exposure and risk of suicide attempts among patients admitted to the ED for depression. We conducted this multicity study to see whether the results would corroborate past findings on air pollution and depression.
Materials and Methods
A case-crossover (CC) design was used to evaluate the potential association between ED visits for depression and ambient air pollution.43 ED visits were used to represent health outcomes and were analyzed as separate individual cases. We have expressed air pollutant concentrations, temperature, and relative humidity as daily mean values. Analyses were conducted separately for males and females.
Health data
Data were retrieved from the National Ambulatory Care Reporting System (NACRS). The NACRS contains data for all hospital and community-based ambulatory care such as day and night surgery, outpatient clinics, and ED visits, which are reported from Ontario’s hospitals and have been collected at the time of services in participating hospitals (for more information, see Canadian Institute for Health Information website: www.cihi.ca). ED visits for depression were retrieved from the NACRS using the International Classification of Diseases, Tenth revision (ICD-10) codes ICD-10: F32 (mild depressive episode) and ICD-10: F33 (recurrent depressive disorder), during the period of April 2004 to December 2011. ICD-10 codes with prefix “F” (mental and behavioral disorders) were also retrieved for the second part of the study.
Environmental data
The environmental data were obtained from Environment Canada (see NAPS website: http://www.etc-cte.ec.gc.ca/NapsData). To obtain data on ambient air pollution, NAPS stations within 35 km of each patient’s three digit postal codes were identified. The daily average values of ozone (O3), nitrogen dioxide (NO2), fine particulate matter with a median aerodynamic diameter no greater than 2.5 µm (PM2.5), and sulfur dioxide (SO2) were calculated by averaging over all the stations within this 35 km radius. Data on carbon monoxide levels were eliminated from the study due to large amounts of missing data in most of the cities. Hourly data for relative humidity and temperature for all cities were also retrieved from Environment Canada. We calculated the daily levels for these weather parameters by averaging hourly data over 24-hour periods. Only stations within 100 km of each patient were considered. If more than one station was available for a patient, the daily values of all stations were averaged.
Statistical analysis
Two stages of statistical analysis were performed. First, a time-stratified CC design was applied.44 This method is an adaptation of the case–control design in which cases act as their own controls on a set of predefined control days proximate to the time of admission to hospital. This method has become very popular in studies of air pollution as it avoids confounding by individual characteristics and longer time-varying covariates such as seasonal effects.45
A P-value less than 0.05 was considered statistically significant in all presented statistical results. Results are reported as odds ratios (ORs) and 95% confidence intervals (CIs) associated with an increase in interquartile range (IQR) of the air pollutants, after controlling for daily temperature and humidity. ORs for O3, NO2, PM2.5, and SO2 were calculated separately for each city by using the PROC PHREG procedure in SAS (Enterprise Guide, version 4.2). Several different time lags for air pollutants and meteorological factors were modeled, from same-day exposure (ie, 0 day lag) to exposure 8 days before admission (ie, 0–8 day lag). In order to reduce bias, the control periods were selected from the same day of the week as the case’s hospital visit, in the same month and year; for each case, three or four controls were selected.
The second stage involved a meta-analysis of the estimates and their standard errors to achieve a pooled effect estimate. To test the assumption that individual effect sizes represent the same underlying parameter for all cities, both fixed- and random-effects models were calculated.46 Meta-analysis and meta-regression were performed using R.47
Results
The total number of ED visits for depression identified in this study was 118,602. Figure 1 shows frequency (counts) of ED visits for depression by sex and age from 0 to 100 years. The patients aged 100 years and older are represented on the graph as 100 years (ie, by one point). The highest number of visits occurred in the group between 16 and 25 years. The highest frequency of ED visits was at the age of 17 years for females (n = 1,803) and 43 years for males (n = 1,182). Females made more ED visits for depression (58%) than did males (42%). Table 1 shows the frequency of visits by age group, sex, city, and season: cold months (October–March) and warm months (April–September). Table 2 shows the frequency of visits by type (mild depressive episode or recurrent depressive episode). The majority (95%) of visits were for mild depressive episode (ICD-10 code F32) versus recurrent depressive disorder (ICD-10 code F33).
Figure 1.
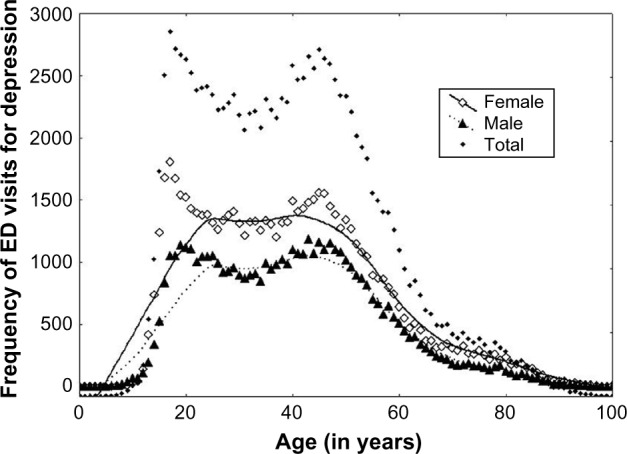
Frequency of ED visits for depression by sex and age (April 2004–December 2011).
Table 1.
Frequency of visits by sex, age group, season (cold: October–March, warm: April–September), and city (April 2004–December 2011; n = 118,602).
| CATEGORY | FREQUENCY (%) |
|---|---|
| Sex | |
| Female | 69,132 (58) |
| Male | 49,462 (42) |
| Age group | |
| [0,15] | 3,971 (3) |
| [16,25] | 25,543 (22) |
| [26,35] | 22,320 (19) |
| [36,45] | 24,567 (21) |
| [46,55] | 22,110 (19) |
| [56,65] | 11,100 (9) |
| 66+ | 8,991 (7) |
| Season | |
| Cold | 58,145 (49) |
| Warm | 60,457 (51) |
| City/Region | |
| Algoma | 5,392 (5) |
| Halton | 7,813 (7) |
| Hamilton | 10,054 (8) |
| London | 8,190 (7) |
| Ottawa | 13,860 (12) |
| Peel | 13,077 (11) |
| Toronto | 41,535 (35) |
| Windsor | 9,927 (8) |
| York | 8,754 (7) |
Note: Some cases do not have specified sex, by a consequence the total number of males and females are not equal to the total number of ED visits for depression.
Table 2.
Frequency of visits by type (mild depressive episode – recurrent depressive).
| ICD10 | SHORT DESCRIPTION | FREQUENCY (%) |
|---|---|---|
| F320 | Mild depressive episode | 337 (0.3) |
| F321 | Moderate depressive episode | 357 (0.3) |
| F322 | Severe depressive episode without psychotic symptoms | 16,902 (14.3) |
| F323 | Severe depressive episode with psychotic symptoms | 2,889 (2.4) |
| F328 | Other depressive episodes | 1,093 (0.9) |
| F329 | Depressive episode, unspecified | 91,210 (76.9) |
| F330 | Recurrent depressive disorder, current episode mild | 50 (0.0) |
| F331 | Recurrent depressive disorder, current episode moderate | 137 (0.1) |
| F332 | Recurrent depressive disorder, current episode severe without psychotic symptoms | 1,997 (1.7) |
| F333 | Recurrent depressive disorder, current episode severe with psychotic symptoms | 330 (0.3) |
| F334 | Recurrent depressive disorder, currently in remission | 22 (0.0) |
| F338 | Other recurrent depressive disorders | 116 (0.1) |
| F339 | Recurrent depressive disorder, unspecified | 3,162 (2.7) |
Descriptive statistics for relative humidity and temperature of each city are presented in Table 3. Descriptive statistics for air pollutants by city are presented in Table 4.
Table 3.
Descriptive statistics for relative humidity and temperature during the period of April 2004–December 2011 in nine cities.
| CITY | VARIABLE | MINIMUM | MEAN | MAXIMUM | IQR |
|---|---|---|---|---|---|
| Algoma | H | 29.0 | 75.1 | 100.0 | 14.7 |
| T | −26.2 | 6.2 | 26.4 | 16.4 | |
| Halton | H | 35.7 | 70.5 | 95.5 | 15.9 |
| T | −17.9 | 9.7 | 31.0 | 16.1 | |
| Hamilton | H | 36.2 | 76.2 | 100.0 | 15.7 |
| T | −19.8 | 9.0 | 30.0 | 16.8 | |
| London | H | 33.2 | 73.5 | 98.9 | 14.5 |
| T | −19.7 | 9.1 | 30.6 | 16.9 | |
| Ottawa | H | 26.7 | 72.2 | 100.0 | 18.4 |
| T | −26.6 | 7.9 | 29.6 | 17.7 | |
| Peel | H | 27.6 | 70.2 | 99.8 | 16.1 |
| T | −20.3 | 9.7 | 31.7 | 16.9 | |
| Toronto | H | 24.6 | 72.5 | 99.7 | 16.8 |
| T | −19.3 | 10.1 | 31.5 | 16.2 | |
| Windsor | H | 32.4 | 69.5 | 97.4 | 16.3 |
| T | −19.5 | 11.0 | 30.4 | 17.3 | |
| York | H | 30.1 | 70.1 | 100.0 | 16.2 |
| T | −20.0 | 9.0 | 32.0 | 16.9 |
Abbreviations: IQR, interquartile range; H, humidity (in %); T, temperature (in Celsius).
Table 4.
Descriptive air pollution statistics in nine cities (April 2004–December 2011).
| CITY | POLLUTANTS | MINIMUM | MEAN | MAXIMUM | IQR |
|---|---|---|---|---|---|
| Algoma | NO2 | 0.0 | 5.1 | 24.0 | 4.0 |
| O3 | 2.0 | 28.5 | 80.0 | 14.0 | |
| PM2.5 | 0.0 | 5.3 | 29.0 | 4.3 | |
| SO2 | 0.0 | 1.1 | 17.0 | 2.0 | |
| Halton | NO2 | 1.0 | 12.9 | 51.2 | 7.7 |
| O3 | 2.0 | 25.8 | 67.7 | 14.0 | |
| PM2.5 | 0.5 | 7.7 | 34.2 | 5.8 | |
| SO2 | 0.0 | 2.3 | 14.0 | 2.0 | |
| Hamilton | NO2 | 1.7 | 13.9 | 63.0 | 9.5 |
| O3 | 1.5 | 26.3 | 70.0 | 13.5 | |
| PM2.5 | 0.0 | 9.8 | 64.2 | 7.6 | |
| SO2 | 0.0 | 4.1 | 35.5 | 4.1 | |
| London | NO2 | 0.0 | 10.9 | 51.0 | 7.0 |
| O3 | 1.0 | 26.3 | 66.0 | 14.0 | |
| PM2.5 | 0.0 | 9.5 | 66.3 | 7.2 | |
| SO2 | 0.0 | 1.7 | 15.0 | 1.0 | |
| Ottawa | NO2 | 1.0 | 8.7 | 47.0 | 7.0 |
| O3 | 1.0 | 24.1 | 66.5 | 13.0 | |
| PM2.5 | 0.0 | 7.0 | 67.7 | 6.3 | |
| SO2 | 0.0 | 0.8 | 13.0 | 1.0 | |
| Peel | NO2 | 2.0 | 13.2 | 54.0 | 9.5 |
| O3 | 1.0 | 25.0 | 69.5 | 13.5 | |
| PM2.5 | 0.0 | 8.5 | 64.9 | 6.8 | |
| SO2 | 0.0 | 1.4 | 12.0 | 1.5 | |
| Toronto | NO2 | 4.5 | 18.5 | 62.1 | 9.4 |
| O3 | 1.5 | 22.5 | 60.7 | 13.4 | |
| PM2.5 | 0.0 | 9.3 | 66.8 | 7.4 | |
| SO2 | 0.0 | 1.8 | 13.7 | 1.8 | |
| York | NO2 | 0.0 | 8.2 | 47.0 | 7.0 |
| O3 | 3.0 | 29.2 | 71.0 | 14.0 | |
| PM2.5 | 0.0 | 6.7 | 27.0 | 6.0 | |
| SO2 | 0.0 | 1.2 | 8.0 | 2.0 | |
| Windsor | NO2 | 2.4 | 15.6 | 55.5 | 8.1 |
| O3 | 1.0 | 25.7 | 68.5 | 16.1 | |
| PM2.5 | 0.8 | 9.5 | 33.6 | 7.4 | |
| SO2 | 0.0 | 4.3 | 24.3 | 4.5 |
Abbreviations: IQR, interquartile range; NO2, nitrogen dioxide; O3, ozone; PM2.5, particulate matter with a median aerodynamic diameter no greater than 2.5 µm. NO2, O3, and SO2 in ppb, PM2.5 in micrograms per cubic meter.
The results of pooling estimates (fixed effects) for depression across all cities were calculated for warm months (April–September) and cold months (October–March), as well as collapsed across all months. ORs and their 95% CI were calculated for a one unit increase in IQR = 75th percentile–25th percentile of air pollutants. The IQR values are 9 ppb, 14.5 ppb, 7.12 µg/m3, and 2.5 ppb, respectively, for daily means of NO2, O3, PM2.5, and SO2. When all months were considered together, exposure to O3 was associated with increased risk of an ED visit for depression in both females and males at multiple time lags (see Table 5). Increased SO2 was also associated with increased risk for females seven days after exposure, OR = 1.013 (1.001, 1.025). For males, exposure to PM2.5 was associated with increased risk one day after exposure, OR = 1.014 (1.000, 1.028).
Table 5.
Results of pooled estimates predicting ED visits for depression from exposure to ozone across nine cities, all months considered together.
| LAG | MALES OR (95% CI) | FEMALES OR (95% CI) |
|---|---|---|
| 0 | 1.003 (0.981, 1.025) | 1.012 (0.993, 1.030) |
| 1 | 1.016 (0.994, 1.038) | 1.021 (1.003, 1.040)* |
| 2 | 1.022 (1.000, 1.044)* | 1.028 (1.010, 1.046)* |
| 3 | 1.030 (1.008, 1.051)* | 1.030 (1.012, 1.048)* |
| 4 | 1.024 (1.002, 1.046)* | 1.020 (1.002, 1.038)* |
| 5 | 1.022 (1.000, 1.044)* | 1.027 (1.008, 1.045)* |
| 6 | 1.018 (0.996, 1.040) | 1.027 (1.009, 1.046)* |
| 7 | 1.015 (0.992, 1.037) | 1.023 (1.005, 1.042)* |
| 8 | 1.034 (1.012, 1.056)* | 1.016 (0.998, 1.035) |
Note:
P-value < 0.05.
Analyses were also conducted considering cold and warm months separately. Results for the warm months are presented in Figure 2 for males (left panel) and females (right panel). The pattern of results was similar to the pattern reported for all months together. In contrast, when only cold months were considered, few significant effects emerged. During the cold months, exposure to O3 was associated with increased risk of ED visit for depression 2, 3, 5, 6, 7, and 8 days after exposure for females only. No other statistically significant results were observed for the cold months.
Figure 2.

Results of pooling estimates (fixed effect) for depression among the nine cities during the warm season (April–September). Extracted from the period April 2004–December 2011.
Random-effects estimates
Random-effects estimates allow the possibility that the estimates from different cities may be estimates of different parameters. Results of a Q-statistic test indicated that for the majority of estimates (92%), the fixed-effects model was a good fit for the data. Approximately 8% of the estimates violated this assumption. Effects were calculated using random-effects meta-analysis (data not shown), and patterns of results were similar to those obtained using fixed-effects analysis.
Comorbidity of depression and suicide attempt
In order to examine comorbidity of depression with suicide attempts, we identified patients who in addition to a primary diagnosis of depression had also attempted suicide. For this purpose, among all 118,602 visits for depression during the study period, we identified the patients whose secondary ICD-10 code starts with X6 (suicide by cause of poisoning), X7 (suicide by cause of hanging, strangulation, suffocation, drowning, cutting, and/or piercing with sharp object), or X80-3 (suicide by cause of jumping from a high place, jumping, or lying before a moving object). Because of the small sample size of this study, we considered both genders for all the cities together (N = 4,131 patients; 67% females, 33% males). The most visits occurred in the age group between 16 and 25 years. The highest frequency occurred at the age of 19 years among both females (4.63%) and males (3.59%). Analyses did not reveal a significant association between exposure to air pollutants and risk of suicide attempts.
Discussion
This study investigated the effect of short-term exposure to ambient air pollution on ED visits for depression. To this end, we examined records from 118,602 ED visits for depression by patients across nine major urban areas in the province of Ontario, Canada. To our knowledge, this is among the largest multisite studies of ED visits for depression. Multisite studies have the advantage of generating more reliable results and tend to be less vulnerable to bias when compared to small studies conducted at individual centers.48 Overall, results indicated that short-term exposure to increased levels of several common pollutants is significantly associated with increased risk of an ED visit for depression.
Several studies suggest that outdoor air pollution, especially ozone, particulate matter, and carbon monoxide may have a significant impact on CNS health and disease.49–52 Ozone, because of its oxidative properties, may induce oxidative stress in the CNS, which is a potential cause of depression.40 Several previous studies have linked ozone levels to depression9,10,16,53 and suicide attempts.11,40,41 In this study, higher ozone levels were associated with increased risk of hospital visits for depression, for both males and females, at multiple time points within the eight days immediately following exposure. The effect of ozone seemed more pronounced during the warm months (April–September) than the cold months (October–March). These results are supported by previously published studies of the effects of ozone on depression.9,10,16 The levels of ozone are also higher in warm seasons. Results of the current study also suggest an association between ED visits for depression and levels of PM2.5, NO2, and SO2.
There is a growing body of literature linking depression with exposure to air pollution. A large epidemiological study of 15,556 ED visits in Edmonton, Canada, found similar evidence for an association between ozone exposure and depression, reporting that higher daily ozone levels were associated with more ED visits for depression one day post exposure.9 This study also reported effects of increased levels of carbon monoxide, nitrogen oxide, sulfur dioxide, and airborne particulate matter on emergency visits for depression. Similarly, a study of 537 participants in Seoul, Korea, reported that an increase in ambient air pollution, PM2.5, NO2, and O3 may increase depressive symptoms among elderly adults. These results support the hypothesis that ambient air pollution is associated with emotional symptoms.
In further support of this hypothesis, studies using postmortem sampling have identified particulate matter in the human brain, albeit of unknown composition and origin.54 Some authors have suggested that ambient particulate matter, such as that originating from diesel exhaust, may have toxic effects on dopaminergic neurons in the brain. This neurotoxicity may be a result of oxidative stress and has been hypothesized to affect depressive moods.55–57 Other authors have suggested a link between air pollutant exposure and levels of serotonin,58 a neurotransmitter that has also been implicated in depression.59 Rat studies have demonstrated a near immediate effect of exposure to ozone on metabolism of both dopamine and serotonin.60 It is not yet known whether ozone may contribute to imbalances in these neurotransmitters in humans.
Suicide attempts as a result of depression have also been linked to air pollution exposure.11,40,41 In this study, we examined data from patients who in addition to a primary diagnosis of depression had also attempted suicide. We did not find any significant associations between suicide attempt and exposure to the air pollutants studied. These results are in contrast to results of other studies linking ambient air pollution to suicide risk.11,40,41 A study from Vancouver, Canada, showed a potential link between the effects of ambient air pollution on ED visits for suicide attempts.11 A study in Middle Franconia of 1,008 suicides and 917 suicide attempts from 2004 to 2007 reported that days on which two or more suicides occurred had higher ambient ozone levels than those days on which one or zero suicides were observed.40 This study also reported a seasonal effect on suicide, with higher than usual suicide rates observed from July to September, when ozone levels are typically highest. A study of 4,857 deaths by suicide in Taipei City, Taiwan, assessed the temporal relation between suicide and air pollution.41 The authors reported that higher levels of gaseous air pollutants such as O3 and SO2 were associated with an increased risk of suicide at longer time delays. Their findings also suggested a seasonal pattern of increased suicide occurring in early summer. A seasonal variation in suicide with a peak in March–April and August, respectively, and with a decrease in December–January was also reported in Belgium for the period 1979–1987.61
Disparities in sampling strategies may contribute to the conflicting findings between studies. The present study examined the link between exposure to air pollutants and suicide risk only among patients with an ED visit for depression. The previously reported link between ambient air pollution and suicide may therefore be explained by the increased risk of depression conferred by exposure to pollutants.
In addition, many studies reporting associations between air pollution exposure and suicide have not accounted for meteorological variables such as ambient temperature, which may explain the previously reported link between summer months and suicide risk.40 Ozone levels tend to be higher on warmer days, and results of the present study suggest that the association between ozone levels and suicide is not statistically significant. Some authors have suggested that seasonal trends in suicide may be due in part to higher ambient temperatures during the summer months, rather than due to high ozone levels. Psychological factors, such as aggression and impulsivity, may be influenced by higher temperatures and may account for increases in suicide risk in the summer months.62 However, results of the present study indicated that even when meteorological factors were controlled for, associations between ambient air pollution and ED visits for depression were more pronounced during the summer months. This suggests that additional factors may be at play in the potentially complex relationship between season, air pollution, and depression.
Conclusions
Results of this study suggest that ED visits for depression are associated with short-term exposure to ambient air pollutants and that this pattern of association differs for warm vs. cold months in Canada. Nonetheless, these findings should be interpreted in light of certain limitations. The cases of depression assessed by this study were only those in which individuals sought ED treatment. Presumably, these represent more severe depressive episodes, but future research assessing associations between pollutant exposure and depression in a community sample would lend more confidence to our conclusions. The results from this study agree with the recently reported conclusions from observation in rodents that short-term exposure to ozone or particulate matter activates the stress response axis and increases stress hormone levels.63,64 Efforts to reduce ozone levels in the atmosphere may mitigate ED presentations to EDs for depressions.
Footnotes
ACADEMIC EDITOR: Timothy Kelley, Editor in Chief
PEER REVIEW: Four peer reviewers contributed to the peer review report. Reviewers’ reports totaled 965 words, excluding any confidential comments to the academic editor.
FUNDING: Authors disclose no external funding sources.
COMPETING INTERESTS: Authors disclose no potential conflicts of interest.
Author Contributions
Conceived and designed the experiments: MS, TK, IC. Analyzed the data: TK. Wrote the first draft of the manuscript: TK, MS. Contributed to the writing of the manuscript: IC, MK. Agree with manuscript results and conclusions: MS, TK, IC, MK. Jointly developed the structure and arguments for the paper: MS, TK, IC, MK. Made critical revisions and approved final version: MS, MK, IC. All authors reviewed and approved of the final manuscript.
Paper subject to independent expert blind peer review. All editorial decisions made by independent academic editor. Upon submission manuscript was subject to anti-plagiarism scanning. Prior to publication all authors have given signed confirmation of agreement to article publication and compliance with all applicable ethical and legal requirements, including the accuracy of author and contributor information, disclosure of competing interests and funding sources, compliance with ethical requirements relating to human and animal study participants, and compliance with any copyright requirements of third parties. This journal is a member of the Committee on Publication Ethics (COPE).
REFERENCES
- 1.Simon GE. Social and economic burden of mood disorders. Biol Psychiatry. 2003;54:208–15. doi: 10.1016/s0006-3223(03)00420-7. [DOI] [PubMed] [Google Scholar]
- 2.Moscicki EK. Epidemiology of completed and attempted suicide: toward a framework for prevention. Clin Neurosci Res. 2001;1(5):310–23. [Google Scholar]
- 3.Schmidt P. Mood, depression, and reproductive hormones in the menopausal transition. Am J Med. 2005;118(Suppl 12B):54–8. doi: 10.1016/j.amjmed.2005.09.033. [DOI] [PubMed] [Google Scholar]
- 4.Rashid T, Heider I. Life events and depression. Ann Punjab Med Coll. 2008;2(1):128–49. [Google Scholar]
- 5.Murray ED, Buttner N, Price BH. Depression and psychosis in neurological practice. In: Bradley WG, Daroff RB, Fenichel GM, Jankovic J, editors. Neurology in Clinical Practice. 6th ed. Butterworth Heinemann; Philadelphia, PA: 2012. [Google Scholar]
- 6.Saravane D, Feve B, Frances Y, et al. Drawing up guidelines for the attendance of physical health of patients with severe mental illness. Encephale. 2009;35(4):330–9. doi: 10.1016/j.encep.2008.10.014. [DOI] [PubMed] [Google Scholar]
- 7.Rustad JK, Musselman DL, Nemeroff CB. The relationship of depression and diabetes: pathophysiological and treatment implications. Psychoneuroendocrinology. 2011;36(9):1276–86. doi: 10.1016/j.psyneuen.2011.03.005. [DOI] [PubMed] [Google Scholar]
- 8.Li M, Fitzgerald P, Rodin G. Evidence-based treatment of depression in patients with cancer. J Clin Oncol. 2012;30(11):1187–96. doi: 10.1200/JCO.2011.39.7372. [DOI] [PubMed] [Google Scholar]
- 9.Szyszkowicz M. Air pollution and emergency department visits for depression in Edmonton, Canada. Int J Occup Med Environ Health. 2007;20(3):241–5. doi: 10.2478/v10001-007-0024-2. [DOI] [PubMed] [Google Scholar]
- 10.Szyszkowicz M, Rowe BH, Colman I. Air pollution and daily emergency department visits for depression. Int J Occup Med Environ Health. 2009;22(4):355–62. doi: 10.2478/v10001-009-0031-6. [DOI] [PubMed] [Google Scholar]
- 11.Szyszkowicz M, Willey JB, Grafstein E, Rowe BH, Colman I. Air pollution and emergency department visits for suicide attempts in Vancouver, Canada. Environ Health Insights. 2010;4:79–86. doi: 10.4137/EHI.S5662. [DOI] [PMC free article] [PubMed] [Google Scholar]
- 12.Valvanne J, Juva K, Erkinjuntti T, Tilvis R. Major depression in the elderly: a population study in Helsinki. Int Psychogeriatr. 1996;8(3):437–43. doi: 10.1017/s1041610296002797. [DOI] [PubMed] [Google Scholar]
- 13.Lyness JM, Heo M, Datto CJ, et al. Outcomes of minor and subsyndromal depression among elderly patients in primary care settings. Ann Intern Med. 2006;144(7):496–504. doi: 10.7326/0003-4819-144-7-200604040-00008. [DOI] [PubMed] [Google Scholar]
- 14.Pope CA. Epidemiology of fine particulate air pollution and human health: biologic mechanisms and who’s at risk? Environ Health Perspect. 2000;108(Suppl 4):S713–23. doi: 10.1289/ehp.108-1637679. [DOI] [PMC free article] [PubMed] [Google Scholar]
- 15.Evans GW, Catalano R, Dooley D. Air pollution and depressive symptomatology: exploratory analyses of intervening psychosocial factors. Popul Environ. 1984;7:260–72. [Google Scholar]
- 16.Lim YH, Kim H, Kim JH, Bae S, Park HY, Hong YC. Air pollution and symptoms of depression in elderly adults. Environ Health Perspect. 2012;120(7):1023–8. doi: 10.1289/ehp.1104100. [DOI] [PMC free article] [PubMed] [Google Scholar]
- 17.Raub JA, Benignus VA. Carbon monoxide and the nervous system. Neurosci Biobehav Rev. 2002;26:925–40. doi: 10.1016/s0149-7634(03)00002-2. [DOI] [PubMed] [Google Scholar]
- 18.Mangone CA, Genovese O, Abel C. Behavioural-cognitive disorders due to chronic exposure to industrial and environmental toxic substances. Vertex. 2006;17:16–22. [PubMed] [Google Scholar]
- 19.Bell ML, Zabonetti A, Dominici F. Who is more affected by ozone pollution? A systematic review and meta-analysis. Am J Epidemiol. 2014;180:15–28. doi: 10.1093/aje/kwu115. [DOI] [PMC free article] [PubMed] [Google Scholar]
- 20.Szyszkowicz M, Rowe B. Respiratory health conditions and ambient ozone: a case-crossover study. Insights Chest Dis. 2016;1:10. [Google Scholar]
- 21.Fridovich I. The biology of oxygen radicals. Science. 1978;201:875–80. doi: 10.1126/science.210504. [DOI] [PubMed] [Google Scholar]
- 22.Aris RM, Christian D, Hearne PQ, Kerr K, Finkbeiner WE, Balmes JR. Ozone-induced airway inflammation in human subjects as determined by airway lavage and biopsy. Am Rev Respir Dis. 1993;148:1363–72. doi: 10.1164/ajrccm/148.5.1363. [DOI] [PubMed] [Google Scholar]
- 23.Pryor WA. Ozone in all its reactive splendor. J Lab Clin Med. 1993;122:483–6. [PubMed] [Google Scholar]
- 24.Camhi SL, Lee P, Choi AM. The oxidative stress response. New Horiz. 1995;3:170–82. [PubMed] [Google Scholar]
- 25.Devlin RB, Raub JA, Folinsbee LJ. Health effects of ozone. Sci Med. 1997;4(3):8–17. [Google Scholar]
- 26.Devlin RB, McDonnell WF, Mann R, et al. Exposure of human to ambient levels of ozone for 6.6 hours causes cellular and biochemical changes in the lung. Am J Respir Cell Mol Biol. 1991;4:72–81. doi: 10.1165/ajrcmb/4.1.72. [DOI] [PubMed] [Google Scholar]
- 27.Devlin RB, McKinnon KR, Noah T, Becker S, Koren HS. Ozone-induced release of cytokines and fibronectin by alveolar macrophages and airway epithelial cells. Am J Physiol. 1994;266:L612–9. doi: 10.1152/ajplung.1994.266.6.L612. [DOI] [PubMed] [Google Scholar]
- 28.Morrison D, Rahman I, Macnee W. Permeability, inflammation and oxidant status in airspace epithelium exposed to ozone. Respir Med. 2006;100:2227–34. doi: 10.1016/j.rmed.2005.10.005. [DOI] [PubMed] [Google Scholar]
- 29.Burnett RT, Smith-Doiron M, Stieb D, et al. Association between ozone and hospitalization for acute respiratory diseases in children less than 2 years of age. Am J Epidemiol. 2001;153:444–52. doi: 10.1093/aje/153.5.444. [DOI] [PubMed] [Google Scholar]
- 30.Villeneuve PJ, Chen L, Rowe BH, Coates F. Outdoor air pollution and emergency department visits for asthma among children and adults: a case-crossover study in northern Alberta, Canada. Environ Health. 2007;6:40. doi: 10.1186/1476-069X-6-40. [DOI] [PMC free article] [PubMed] [Google Scholar]
- 31.Stieb DM, Szyszkowicz M, Rowe BH, Leech JA. Air pollution and emergency department visits for cardiac and respiratory conditions: a multi-city time-series analysis. Environ Health. 2009;8:25. doi: 10.1186/1476-069X-8-25. [DOI] [PMC free article] [PubMed] [Google Scholar]
- 32.Wong TW, Lau TS, Yu TS, et al. Air pollution and hospital admissions for respiratory and cardiovascular diseases in Hong Kong. Occup Environ Med. 1999;56:679–83. doi: 10.1136/oem.56.10.679. [DOI] [PMC free article] [PubMed] [Google Scholar]
- 33.Kaplan GG, Dixon E, Panaccione R, et al. Effect of ambient air pollution on the incidence of appendicitis. CMAJ. 2009;181:591–7. doi: 10.1503/cmaj.082068. [DOI] [PMC free article] [PubMed] [Google Scholar]
- 34.Szyszkowicz M, Kaplan GG, Grafstein E, Rowe BH. Emergency department visits for migraine and headache: a multi-city study. Int J Occup Med Environ Health. 2009;22:235–42. doi: 10.2478/v10001-009-0024-5. [DOI] [PubMed] [Google Scholar]
- 35.Larrieu S, Lefranc A, Gault G, et al. Are the short-term effects of air pollution restricted to cardiorespiratory diseases? Am J Epidemiol. 2009;169:1201–8. doi: 10.1093/aje/kwp032. [DOI] [PubMed] [Google Scholar]
- 36.Szyszkowicz M, Porada E, Searles G, Rowe BH. Ambient ozone and emergency department visits for skin conditions. Air Qual Atmos Health. 2012;5:303–9. [Google Scholar]
- 37.Xu F, Yan S, Wu M, et al. Ambient ozone pollution as a risk factor for skin disorders. Br J Dermatol. 2011;165:224–5. doi: 10.1111/j.1365-2133.2011.10349.x. [DOI] [PubMed] [Google Scholar]
- 38.Szyszkowicz M, Porada E, Kaplan GG, Rowe BH. Ambient ozone and emergency department visits for cellulitis. Int J Environ Res Public Health. 2010;7(11):4078–88. doi: 10.3390/ijerph7114078. [DOI] [PMC free article] [PubMed] [Google Scholar]
- 39.Szyszkowicz M, Porada E, Kaplan GG, Grafstein E. Ambient ozone as a risk factor for ED visits for cellulitis. Environ Pollut. 2012;1(2):105–11. [Google Scholar]
- 40.Biermann T, Stilianakis N, Bleich S, Thürauf N, Kornhuber J, Reulbach U. The hypothesis of an impact of ozone on the occurrence of completed and attempted suicides. Med Hypotheses. 2009;72(3):338–41. doi: 10.1016/j.mehy.2008.09.042. [DOI] [PubMed] [Google Scholar]
- 41.Yang AC, Tsai SJ, Huang NE. Decomposing the association of completed suicide with air pollution, weather, and unemployment data at different time scales. J Affect Disord. 2010;129:275–81. doi: 10.1016/j.jad.2010.08.010. [DOI] [PubMed] [Google Scholar]
- 42.Clougherty JE. A growing role for gender analysis in air pollution epidemiology. Environ Health Perspect. 2010;118(2):167–76. doi: 10.1289/ehp.0900994. [DOI] [PMC free article] [PubMed] [Google Scholar]
- 43.Maclure M. The case-crossover design: a method for studying transient effects on the risk of acute events. Am J Epidemiol. 1991;133(2):144–53. doi: 10.1093/oxfordjournals.aje.a115853. [DOI] [PubMed] [Google Scholar]
- 44.Janes H, Sheppard L, Lumley T. Case-crossover analyses of air pollution exposure data. Referent selection strategies and their implications for bias. Epidemiology. 2005;16(6):717–26. doi: 10.1097/01.ede.0000181315.18836.9d. [DOI] [PubMed] [Google Scholar]
- 45.Bateson TF, Schwartz J. Control for seasonal variation and time trend in case-crossover studies of acute effects of environmental exposures. Epidemiology. 1999;10:539–44. [PubMed] [Google Scholar]
- 46.DerSimonian R, Laird N. Meta-analysis in clinical trials. Control Clin Trials. 1986;7:177–88. doi: 10.1016/0197-2456(86)90046-2. [DOI] [PubMed] [Google Scholar]
- 47.Core Team R . R: A Language and Environment for Statistical Computing. Vienna, Austria: R Foundation for Statistical Computing; 2013. Available at: http://www.R-project.org/ [Google Scholar]
- 48.Dominici F, Zeger SL, Samet JM. Combining evidence on air pollution and daily mortality from the largest 20 US cities: a hierarchical modeling strategy. J R Stat Soc Series A. 2000;163:263–302. [Google Scholar]
- 49.Committee of the Environmental and Occupational Health Assembly of the American Thoracic Society (CEOHA-ATS) Health effects of outdoor air pollution. Am J Respir Crit Care Med. 1996;153:3–50. doi: 10.1164/ajrccm.153.1.8542133. [DOI] [PubMed] [Google Scholar]
- 50.Block ML, Elder A, Auten RL, et al. The outdoor air pollution and brain health workshop. Neurotoxicology. 2012;33(5):972–84. doi: 10.1016/j.neuro.2012.08.014. [DOI] [PMC free article] [PubMed] [Google Scholar]
- 51.Block ML, Calderon-Garciduenas L. Air pollution: mechanisms of neuroinflammation and CNS disease. Trends Neurosci. 2009;32:506–16. doi: 10.1016/j.tins.2009.05.009. [DOI] [PMC free article] [PubMed] [Google Scholar]
- 52.Lucchini RG, Dorman DC, Elder A, Veronesi B. Neurological impacts from inhalation of pollutants and the nose-brain connection. Neurotoxicology. 2011;33:838–41. doi: 10.1016/j.neuro.2011.12.001. [DOI] [PMC free article] [PubMed] [Google Scholar]
- 53.Thomson EM, Pal S, Guénette J, et al. Ozone inhalation provokes glucocorticoid-dependent and independent effects on inflammatory and metabolic pathways. Toxicol Sci. 2016;152(1):17–28. doi: 10.1093/toxsci/kfw061. [DOI] [PubMed] [Google Scholar]
- 54.Calderón-Garcidueñas L, Solt AC, Henríquez-Roldán C, et al. Long-term air pollution exposure is associated with neuro inflammation, an altered innate immune response, disruption of the blood-brain barrier, ultrafine particulate deposition, and accumulation of amyloid beta-42 and alpha-synuclein in children and young adults. Toxicol Pathol. 2008;36:289–310. doi: 10.1177/0192623307313011. [DOI] [PubMed] [Google Scholar]
- 55.Campbell A, Oldham M, Becaria A, et al. Particulate matter in polluted air may increase biomarkers of inflammation in mouse brain. Neurotoxicology. 2005;26:133–40. doi: 10.1016/j.neuro.2004.08.003. [DOI] [PubMed] [Google Scholar]
- 56.Block ML, Wu X, Pei Z, et al. Nanometer size diesel exhaust particles are selectively toxic to dopaminergic neurons: the role of microglia, phagocytosis, and NADPH oxidase. FASEB J. 2004;18:1618–20. doi: 10.1096/fj.04-1945fje. [DOI] [PubMed] [Google Scholar]
- 57.Veronesi B, Makwana O, Pooler M, Chen LC. Effects of subchronic exposures to concentrated ambient particles. VII. Degeneration of dopaminergic neurons in Apo E−/− mice. Inhal Toxicol. 2005;17:235–41. doi: 10.1080/08958370590912888. [DOI] [PubMed] [Google Scholar]
- 58.Mann JJ. The neurobiology of suicide. Nat Med. 1998;4(1):25–30. doi: 10.1038/nm0198-025. [DOI] [PubMed] [Google Scholar]
- 59.Bach-Mizrachi H, Underwood MD, Tin A, Ellis SP, Mann JJ, Arango V. Elevated expression of tryptophan hydroxylase-2 mRNA at the neuronal level in the dorsal and median raphe nuclei of depressed suicides. Mol Psychiatry. 2008;13(5):507–13. doi: 10.1038/sj.mp.4002143. Comparative Study Research support, N.I.H., Extramural Research Support, Non-U.S. Gov’t. [DOI] [PMC free article] [PubMed] [Google Scholar]
- 60.Gonzalez-Pina R, Paz C. Brain monoamine changes in rats after short periods of ozone exposure. Neurochem Res. 1997;22(1):63–6. doi: 10.1023/a:1027329405112. Research Support, Non-U.S. Gov’t. [DOI] [PubMed] [Google Scholar]
- 61.Maes M, Cosyns P, Meltzer HY, De Meyer F, Peeters D. Seasonality in violent suicide but not in nonviolent suicide or homicide. Am J Psychiatry. 1993;150(9):1380–5. doi: 10.1176/ajp.150.9.1380. [DOI] [PubMed] [Google Scholar]
- 62.Anderson CA. Temperature and aggression: ubiquitous effects of heat on occurrence of human violence. Psychol Bull. 1989;106(1):74–96. doi: 10.1037/0033-2909.106.1.74. [DOI] [PubMed] [Google Scholar]
- 63.Thomson E. Neurobehavioral and metabolic impacts of inhaled pollutants a role for the hypothalamic-pituitary-adrenal axis? Endocr Disruptors. 2013;1(1):e27489. [Google Scholar]
- 64.Miller BE, Tal-Singer R, Rennard SI, et al. Plasma Fibrinogen Qualification as a Drug Development Tool in Chronic Obstructive Pulmonary Disease. Perspective of the Chronic Obstructive Pulmonary Disease Biomarker Qualification Consortium. Am J Respir Crit Care Med. 2016;193:607–13. doi: 10.1164/rccm.201509-1722PP. [DOI] [PubMed] [Google Scholar]