

Abstract
Infrared matrix-assisted laser desorption electrospray ionization (IR-MALDESI) mass spectrometry imaging (MSI) is a technique well suited for analysis of biological specimens. This tutorial review focuses on recent advancements and applications of IR-MALDESI MSI to better understand key biological questions. Through optimization of user-defined source parameters, comprehensive and quantitative MSI data can be obtained for a variety of analytes. The effect of an ice matrix layer is well defined in the context of desorption dynamics and resulting ion abundance. Optimized parameters and careful control of conditions affords quantitative MSI data which provides valuable information for targeted, label-free drug distribution studies and untargeted metabolomic datasets. Challenges and limitations of MSI using IR-MALDESI are addressed in the context of the bioimaging field.
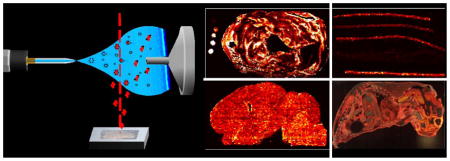
Graphical Abstract
Introduction
Mass spectrometry imaging (MSI) is a rapidly evolving technique applied to a wide variety of applications from proteins1, pharmaceuticals2, endogenous metabolites3, and –omic level analysis4. In MSI, there are two general modes of operation - microscope and microprobe5. MSI data collected in a point-by-point manner where the analysis is performed sequentially across the sample is referred to as microprobe mode. MSI instruments that acquire data in microscope mode desorb ions from the sample and use a spatially resolved detector. Microprobe mode analysis is the most common and is the method by which IR-MALDESI collects MSI data. By mapping m/z abundances and the positions from which they were acquired, unique ion maps of analytes can be generated, showing the spatial distribution within the sample. Heat maps depicting ion abundance generated with careful consideration of factors affecting analyte detection provide important visual representations of analyte distribution and relative concentration.
The concept of spatially resolved MSI using secondary ion mass spectrometry was originally proposed by Castaing and Slodzian in the 1960’s6, but its utility for biological mapping was not realized until the mid-1990’s with Spengler’s report of spatial distribution of biomolecules7 and subsequent application of matrix assisted laser desorption ionization (MALDI) MSI for biomolecules by Caprioli et al in 19978. Since then, MALDI has become the most commonly used MSI technique9 as it provides sensitive detection for a wide variety of compounds and commercial MSI instruments are now available. However, MALDI requires the careful selection of matrix/analyte pair, matrix application protocol and typically requires analysis under vacuum.
Ambient ionization techniques are desirable for MSI as they do not require the sample to be placed under high vacuum and represent analysis of biological samples closer to in vivo conditions. A number of ambient ionization techniques have been successfully applied to MSI and were the subject of a recent review10. Each technique has its advantages and disadvantages, allowing researcher to choose the technique best suited for the analysis.
Hybrid ionization methods offer unique advantages of two or more ionization methods. Laser-based desorption methods with post ionization allow the spatial information of analytes to be retained. Techniques such as electrospray laser desorption ionization (ELDI)11, matrix assisted laser desorption electrospray ionization (MALDESI)12, laser ablation electrospray ionization (LAESI)13, laser electrospray mass spectrometry (LEMS)14, or infrared laser ablation desorption electrospray ionization (IR-LADESI)15 combine resonant or nonresonant laser desorption of the substrate with postionization by electrospray ionization (ESI)16. Resonant desorption requires absorption of laser energy by a matrix. The term matrix referring to any substance that can resonantly absorb energy from a laser radiation source, be it an organic matrix for UV excitation or water, which is commonly used in IR laser excitation.
MALDESI was introduced by Muddiman and co-workers in 2006 as the first hybrid ionization technique combining resonant laser desorption with electrospray postionization12. The constant evolution of the MALDESI source has involved numerous optimizations of geometry17–19, source design12, 20–22, and chemical compositions23 based on the target analyte. MALDESI employing an IR laser with endogenous and exogenous ice matrix is particularly advantageous for fresh-frozen biological tissue analysis24. The higher fluence of an IR laser compared to a UV laser allows the complete ablation of material within the focal volume of the laser.
MSI microprobe analysis requires MS analysis at each rastered position, which needs to be performed sequentially and rapidly; therefore, it precludes the use of chromatographic separation prior to MS acquisition. The complex chemical composition of a biological tissue in conjunction with tissue heterogeneity places high demand on the instruments spectral resolving power to separate all compounds based on m/z. Additional structural information may be obtained from MSI using MSn methods in the case of isobaric species. IR-MALDESI has been developed using Fourier transform (FT) based MS instruments to obtain high resolving power MSI data.
This review summarizes the latest developments of IR-MALDESI imaging of biological tissues, highlighting its capabilities while identifying areas of improvement and future work. Parameters affecting imaging quality are optimized and applications in drug distribution studies and untargeted metabolomics are presented. The development of absolute quantification MSI demonstrates the analytical capabilities of IR-MALDESI for biological samples.
Methods
The main steps to an IR-MALDESI MSI experiment are the same as any MSI experiment25 which can include collection, storage, and sectioning of the specimen along with instrument or ionization specific variables. Each of these components can be and tailored to the analyzed material for optimal results. Collection, storage and sectioning are highly dependent on the sample and analyte in the investigation. Analysis of animal tissue, plant tissue, materials research substrates and neat or buffered solutions all require sample specific collection and storage procedures to ensure sample integrity throughout the analysis process. Sectioning of a sample is required for some specimens to produce a flat 2 dimensional plane for laser ablation and to control the amount of material being sampled, which is the case for tissue analysis. Aqueous solutions can be analyzed by placing the liquid surface at the focal point of the laser or creating a dried droplet of the solution and deposition of an ice matrix on the surface prior to analysis. Other samples that are roughly planar can be analysed without the need for sectioning, such as fabric26, fibers27 and hair28. Tissues are the most commonly analyzed biomaterial to date and tissue sample preparation steps will be discussed in detail.
IR-MALDESI MSI tissue preparation
Biological tissues are harvested and immediately immersed in an isopentane/dry ice bath to prevent tissue fracturing during freezing as experienced with liquid nitrogen submersion25. Fresh frozen tissues are stored at −80°C until time of analysis. Tissues are mounted on a cryostat specimen disc using a thin layer of embedding media. The embedding media is used to only adhere the tissue to the cryostat specimen disc, such that the tissue is not completely embedded in the media.. The tissue is faced down to the desired plane for analysis using a cryomicrotome (Leica CM1950, Buffalo Grove, IL, USA) with section thicknesses of ≤50 μm prior to thaw mounting onto precleaned glass microscope slides. A comparison of serial tissue sections with thicknesses of 50, 25, and 10 μm showed complete ablation of the tissue and similar ion abundance for 3 pharmaceutical compounds and endogenous analytes for each thickness29.
Quantitative IR-MALDESI imaging preparation
In experiments where quantitative information is desired, additional steps are required for IR-MALDESI MSI analysis. A normalization compound is incorporated at a spatially uniform concentration using an automated pneumatic sprayer (TM Sprayer, LEAP technologies, Carrboro, NC) to account for variability. Prior optimization of the spray conditions are needed to ensure the uniformity of the coating. The normalization compound may be a stable isotope labelled (SIL) version of the analyte or carefully selected structural analogue of the quantified analyte given that it has a similar ionization efficiency. A precleaned microscope slide is uniformly coated with this normalization compound prior to sectioning of the tissue at a concentration sufficiently above the limit of detection for the tissue imaging experiment. The 10 μm tissue section is then thaw mounted onto the coated slide. A calibration curve may be constructed using SIL version of the analyte which allows the calibration curve to be placed directly on the analysed tissue30. Alternatively, natural isotope abundance standards may be placed on a blank tissue mounted and analysed in parallel to the tissue to be quantified31. Both calibration curve methods require the generation of a calibration series in solution prior to spotting on tissue. A constant volume of each calibration solution is pipetted on top of the thaw mounted tissue without spatial overlap to convert the liquid concentrations to a spatial concentration. Both methods have proven effective for calibration in MSI in good agreement with LC-MS/MS analysis of serial sections30, 31. Others have proposed spiked tissue homogenate cores as calibration points for quantitative MALDI MSI, but we have demonstrated this is not essential in IR-MALDESI because there is complete ablation of the tissue at each rastered position and IR-MALDESI does not require the extraction of analytes into an organic matrix like MALDI MSI does32.
IR-MALDESI Tissue Imaging
The IR-MALDESI source and operation have been described in more detail elsewhere18, 24, 33, 34. Briefly, the IR-MALDESI source is enclosed within an acrylic box, effectively isolating the sampled environment from the laboratory. The slide-mounted tissue section is placed on a Peltier cooled sample plate within the source enclosure. The sample plate is located on a computer controlled XY translational stage with manual Z-axis height adjustment which allows the tissue section to be moved in an array of discrete positions under the fixed position of the laser. By translating the stage by less than the desorption diameter in an oversampling method35, in combination with complete desorption of the tissue, voxels smaller than the focal volume of the laser can be sampled18, 36. A voxel refers to the three dimensional tissue volume desorbed by the laser. This ensures the complete ablation of the entire tissue during the analysis, providing reproducible volumes of tissue sampled.
Formation of ice matrix layer
The enclosure is purged with dry nitrogen to a relative humidity (RH) less than 3% prior to bringing the Peltier stage to −9°C. This is done in order to prevent condensation of water on the tissue, which could potentially delocalize analytes in or on the tissue if droplets form prior to freezing. The tissue is maintained at −9°C for approximately 10 minutes prior to exposure to the ambient RH in the lab (>10% RH), causing the rapid formation of an ice layer on the sample plate. This exogenous ice layer serves as an energy absorbing matrix in addition to endogenous water present within the biological tissue. Resonant excitation of OH stretching mode of water by a tunable mid-IR (2700–3100 nm) laser (Opolette, Opotek, Carlsbad, CA, USA) is used to desorb tissue material at each rastered position with a user-defined number of laser pulses. Recently, it was found that two pulses at 2940 nm provides complete, reproducible ablation of a 10 μm thick tissue section within the focal volume of the laser29. The desorbed tissue volume is ejected normal to the surface where the ablation plume overlaps with an orthogonal electrospray plume as depicted in Figure 1. Analytes from the desorbed tissue material partition into the electrospray droplets where they undergo desolvation and charge transfer in a manner similar to ESI. The ions are then sampled by a high resolving power mass analyser (FT-ICR24, Q Exactive29, Q Exactive Plus33).
Figure 1.
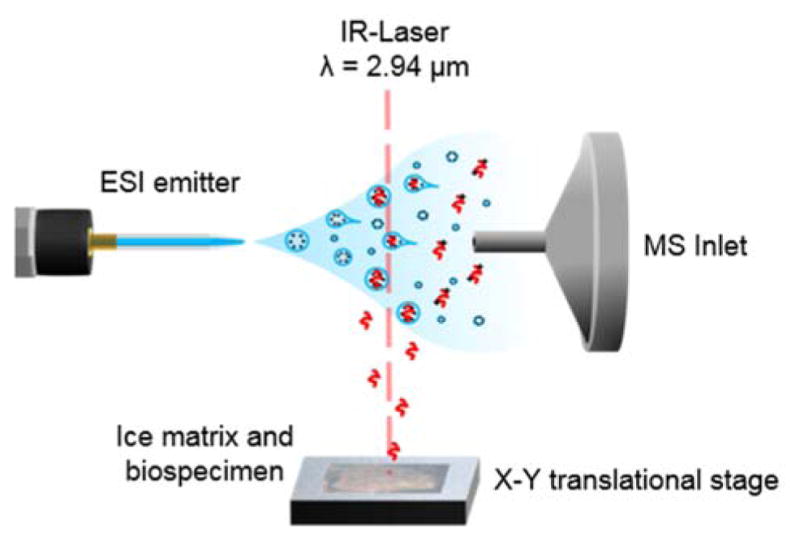
Schematic of IR-MALDESI source. The sample is placed on a Peltier cooled X-Y translational stage where an exogenous ice matrix layer may be formed. A 2.94 μm laser is used to desorb material from the sample. The desorption plume interacts with an orthogonal electrospray plume where analytes partition into the charged droplets and ionization occurs in an ESI-like manner.
The geometry of the source will have a direct effect on the laser desorption and electrospray plume overlap, and therefore on ion formation. Statistical design of experiments (DoE) was used in several studies to explore the experimental space with distinct optimized parameters for direct analysis of liquid droplets, solid state sample and tissue imaging17–19. All tissue imaging experiments discussed here were performed with the same geometric configuration as determined by DoE for tissue imaging18.
Data Analysis and Visualization in MSiReader
Thermo .raw data files were converted to mzML format using MSConvert tool from ProteoWizard37. These mzML data files were subsequently converted to imzML file format38 using imzML converter39. Individual imzML files may be then concatenated into a single MSI file for MSI analysis in MSiReader40.
All IR-MALDESI images presented were analysed in MSiReader. MSiReader is an open-source, vendor-neutral software created for visualization analysis of high resolving power MSI data40. Since its initial publication and public release in 2013, more than 20 new features have been added to the software package. Five subsequent public updates include normalization strategies, peak export, customizable heat maps, colocalization, batch processing, optical image overlay, and a standalone version that does not require a MATLAB license. These features have been developed to better visualize MSI data and understand the complex data sets, such as those presented here.
Discussion
Effects of Ice Matrix on IR-MALDESI Analysis
The positive effects of the formation of an exogenous ice matrix layer were discovered when an ion abundance increase was observed when ice from ambient RH formed on the Peltier sample stage18. An investigation of the effects on desorption plume dynamics was subsequently undertaken using a novel shadowgraphy imaging system18. This system allowed images of the desorption plumb to be taken using UV-laser excitation of a fluorophore behind the desorption event. The short (~10 ns) fluorescence emission of the fluorophore allowed images to be captured of the desorption plume at the nanosecond timescale. Comparison of no ice and ice matrix desorption plumes showed distinct difference in the tissue desorption processes. The mass spectra measured from each laser pulse shows nearly all material is desorbed in the first pulse without ice matrix while ion abundance actually increases with increasing number of laser pulses with an ice matrix. Note this analysis is performed on a 50 μm thick fresh frozen tissue section. Subsequent evaluation of the ice layer effects in a targeted manner is presented in Figure 2B–D. The average abundance (χ̄) and detection frequency (f) of three antiretroviral drugs incubated in cervical tissue were used as a metric to evaluate ice layer effects. As shown in Figure 2, ice matrix results in higher abundance and more frequent detection for all three compounds29.
Figure 2.

Influence of ice as a matrix for a 2940 nm IR laser. Targeted analysis of three antiretroviral (ARV) drugs in tissue from tissue with and without ice matrix. Ice matrix increased the frequency of detection and the average ion abundance for all three analytes of interest. Reproduced from Ref 29 with permission from Springer.
Comparison of IR-MALDESI to MALDI MSI
MSI allows for the multiplexed analysis of analytes in a single experiment, having the potential to show the distribution of drug, metabolite, and endogenous species in a single experiment. The capabilities of IR-MALDESI for drugs and metabolites in an imaging experiment were compared to that of MALDI MSI41. The spatial distribution of lapatinib and metabolites were used as a comparison of serial sections of a dosed liver between the two MSI ionization methods. Figure 3 shows (top to bottom) optical image of the tissue, matrix application, distribution of parent drug, heme b indicating vasculature, and a colocalization plot of drug and heme b. The main differences between the two MSI techniques stem from matrix preparation and the laser used. MALDI requires the uniform deposition of an organic acid matrix while IR-MALDESI uses an ice matrix. The difference in matrix has major effects on the resulting mass spectra as organic acid matrices create many matrix related peaks in the low m/z range potentially obscuring an analyte ion whereas an ice matrix does not. Additionally, the IR laser used in IR-MALDESI completely ablates the ice matrix and tissue at each rastered position compared to the UV laser used in MALDI, which excites and ablates a much smaller volume of matrix and cocrystallized analytes. Nonetheless, the targeted analyte(s) can be detected with either method after some amount of method development. Lapatinib and metabolites were detected using both ionization methods, with 24 and 11 metabolites being imaged using MALDI and IR-MALDESI, respectfully. This work showcases the similarity and complementary data that can be obtained from using two different ionization methods that rely on separate mechanisms for the ionization of analytes. It should be noted that both analyses used an FT-ICR detector, though these were from different manufacturers. For a more accurate comparison of ionization methods the data should be collected on the same MS platform, although, this is often not experimentally feasible.
Figure 3.
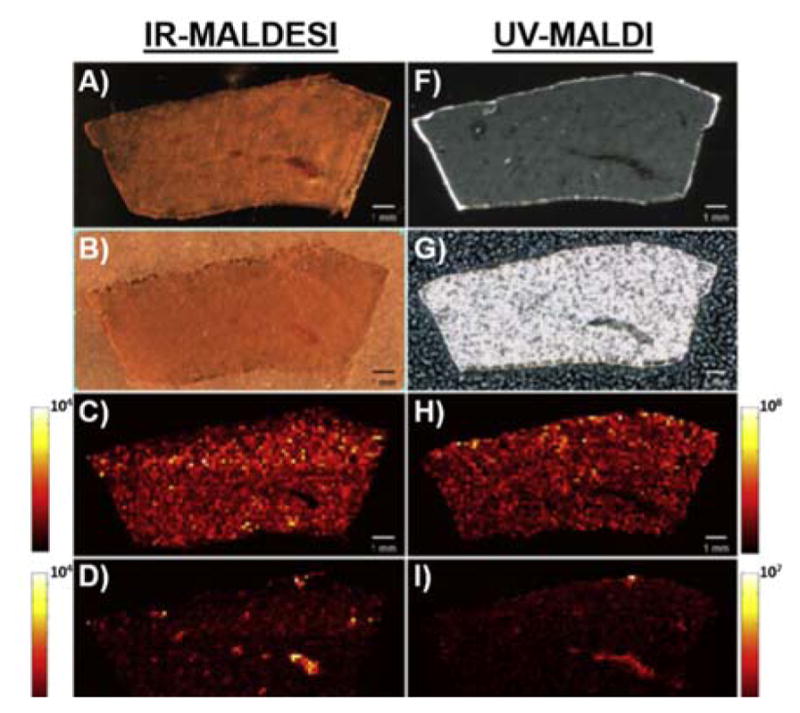
Comparison of MALDI and IR-MALDESI MSI analysis of serial sections from a lapatinib dosed liver. A,F) optical images of the analysed tissue, B,G) image of tissue with matrix applied C,H) lapatinib D,I) heme b E,J) colocalization of lapatinib (blue) and heme b (red) in a single MS image. Reproduced from Ref. 41 with permission from Elsevier.
Electrospray Ionization Agent
MALDI uses the careful pairing of organic matrix and analyte for sensitive and selective detection. Additionally, metal salts may be used to preferentially form adducts to the analyte. In IR-MALDESI, the matrix only facilitates desorption of material and ionization is achieved by electrospray. This allows for easy adjustment of ionization characteristics by changing ESI conditions. This permits selection of aqueous and organic solvent system to be optimized for particular class of compounds41, although to date, only binary solvent systems have been investigated. Additionally, the ionization agent can be adjusted for operation in positive or negative ionization mode42 using typical ionization agents such as formic acid or ammonium hydroxide. Some instruments, like the Q Exactive, allow rapid change of polarity such that a polarity switching imaging experiment may be performed on the same sample42–44. In this case, the electrospray solvent system must be selected as a compromise in performance between the polarities. As previously demonstrated for LC ESI analysis, weak acids can actually increase negative ion formation45 and are often most suitable for polarity switching experiments. Because the laser completely desorbs the material at each rastered position in IR-MALDESI, an image consists of spectra of alternating polarity and does not allow the collection of spectra in both polarities from the same spatial location.
Metal Adduct Formation
Additionally, changing the traditional ionization agents (acid, base) by doping the electrospray with a constant concentration of metal adduct has proven to be useful. Meier et al doped the electrospray solvent with silver nitrate to selectively form Ag+ adducts, which have an affinity toward double bonds46. Silver is not found biologically, so there is complete control over adduct formation. Using its unique isotopic distribution, roughly 1:1 for 107Ag and 109Ag, multivariate analysis of spectra and selection of mass spectra peak pairs with this ratio allow facile identification of unsaturated compounds. This work is exemplified by the confident identification of 43 olefinic lipids in human serum. Also in this work, the high affinity of Ag+ for double bonds was used to lower limits of detection of cholecalciferol by 2 orders of magnitude. This, however, is still above physiological serum levels.
Increases in ion abundance and reproducibility may be obtained using cationization agents in a targeted manner depending on the analyte. Bokhart et al doped electrospray solvent with sodium chloride to preferentially form a sodium adduct of antiretroviral drugs30. This afforded differences in ionization efficiency per-spectrum to be accounted for as demonstrated by the reproducibility of normalization to the protonated and sodiated forms of a normalization compound. The increased reproducibility allowed quantitative MSI data to be obtained from emtricitabine in a human cervical tissue model30.
Drug Distribution Studies
Quantitative IR-MALDESI imaging
A major research area in MSI is obtaining reproducible and accurate quantitative information from a MSI experiment. This is not trivial due to tissue heterogeneity, careful incorporation of a calibration curve and the minute volume of tissue sampled at each voxel. IR-MALDESI is inherently quantitative with the complete ablation of tissue within the focal volume of the laser and employ of oversampling. MALDI, on the other hand, relies on extraction and cocrystallization of analytes with the matrix and ablation depths of approximately 100 nm. Ionization in MALDI is dependent on the organic acid matrix chosen, crystal size, and sample preparation steps. Ionization in IR-MALDESI is independent of the matrix as it relies on ionization through an electrospray like mechanism.
In a proof of concept quantitative experiment, 5 sequential sections of a single human cervical tissue incubated in 100 μg/mL antiretroviral (ARV) drug solution were quantified using IR-MALDESI and serial sections to each were quantified using a validated LC-MS/MS method on the homogenate to evaluate the accuracy of quantitative MSI. The incorporation of a structural analogue normalization compound allowed for the ratio of analyte/normalization compound response to be taken at each voxel, corresponding to one orbitrap mass spectrum, to help account for tissue specific ablation, ionization efficiency, and ion loss through the MS. The incorporation of a calibration curve consisting of SIL analogue of the drug allows the calibration curve to be placed directly on top of the analysed tissue.
The quantification of ARV in a tissue section in a MSI experiment is summarized in Figure 4. The SIL-calibration curve has A+3 m/z shift, where the natural abundance of the A+3 isotope peak will have negligible contribution to the abundance. Data extraction is easily performed in MSiReader software with automated quantification procedure being available within the software in MSiReader v0.8+. Briefly, the analyte and calibration curve abundances are normalized to the normalization compound response at a per-voxel level (Figure 4A,B). Data is extracted for regions of interest – specifically for calibration spots and tissue areas to be quantified. The tissue concentration for each ROI is calculated using the average normalized response and the volume from which it has been detected to give a spatial concentration. The resulting calibration curve (Figure 4C) can then be used to calculate the concentration of analyte in tissue (Figure 4D). IR-MALDESI analysis is typically performed on 10 μm thick sections and the IR laser completely ablates the material within the focal volume of the laser, truly sampling a volume of tissue and therefore yielding accurate tissue concentrations of analyte. Using this method, IR-MALDESI gave a similar result to a validated LC-MS/MS method for the 5 replicates of a model tissue system designed to define the quantitative analytical capabilities of IR-MALDESI with a concentration of 17.2±1.8 μg/g tissue compared to 28.4±2.8 μg/g tissue determined by LC-MS/MS homogenate. These values represent the average concentration for the five tissue sections with a 95% confidence interval. The similar absolute concentration by the two methods indicates great potential for IR-MALDESI to be applied to quantify drug concentrations within tissue microenvironments where concentration may reach therapeutic or potentially toxic levels – information that is lost in the homogenization process required for LC-MS/MS analysis. The IR-MALDESI MSI quantification was compared to LC-MS/MS of an adjacent tissue section, since both IR-MALDESI and LC-MS/MS are destructive techniques. By comparing MSI to LC-MS/MS, it is assumed that the LC-MS/MS data is the true concentration of analyte in tissue based on LC-MS/MS acceptance in the literature and by regulatory agencies. Differences between the two methods could be attributed to the sample preparation steps for the two quantification methods as they are necessarily different at nearly every step, with an amount of error associated with each deviation. LC-MS/MS requires homogenization of the tissue to aid extraction of analytes into the solvent and removal of tissue debris. LC-MS/MS quantification is based on area under a chromatographic peak where ionization suppressing compounds such as lipids are chromatographically resolved from the antiretroviral drug. The extracted analyte in LC-MS/MS of a tissue homogenate represents the average concentration of the drug in the tissue section with the loss of all spatial information in the homogenization process. In IR-MALDESI MSI quantification, the tissue is carefully prepared with a normalization compound present uniformly across the analyzed area and a calibration curve spatially integrated with the analyzed tissue. In MSI, the spatial concentration of the analyte is preserved by analyzing the tissue at many locations across the tissue, with each location essentially a separate MS analysis but without chromatographic separation. Additionally, the calibration curve is based on MS peak height for each voxel of a calibration spot instead of the area under the chromatographic peak for individual calibration standards in LC-MS/MS.
Figure 4.
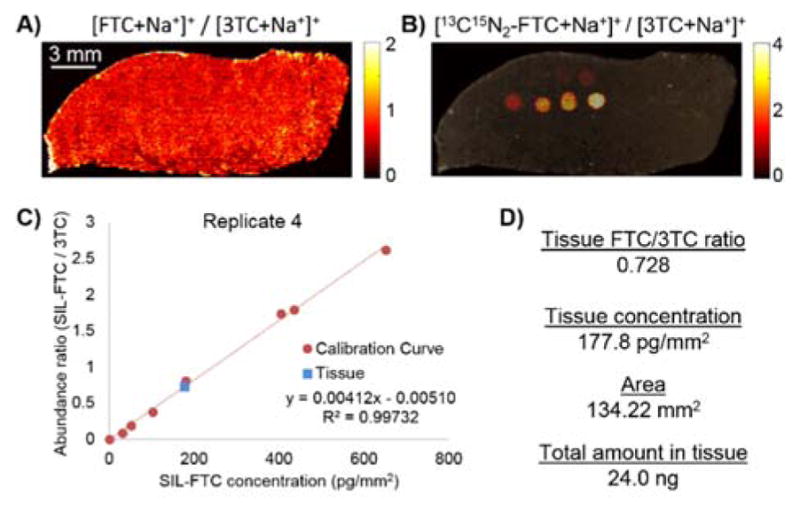
Summary of a quantitative MSI experiment using IR-MALDESI. A) Emtricitabine (FTC) was quantified in a cervical tissue model system using a B) stable isotope labeled (SIL) calibration curve on the same tissue. C) MSI calibration curve showed good linearity and D) summary of calculated FTC in the model tissue. Reproduced from Ref. 30 with permission from Springer.
IR-MALDESI MSI is ideally suited for drug distribution studies, specifically ARVs because they are often administered in a multidrug regimen referred to as highly active antiretroviral therapy (HAART) requiring the analysis of numerous drugs and metabolites in a single analysis. This is in comparison to the industry standard quantitative whole body autoradiography which requires synthesis and administration of radiolabelled compounds, which has significant cost and safety concerns associated with it. Additionally, this method only detects the radiolabel and is unable to differentiate parent and metabolites.
Multi-organ Pharmaceutical Distribution
The developed quantitative IR-MALDESI was utilized for a multi-organ drug distribution study of HIV integrase inhibitor efavirenz (EFV) within a rhesus macaque dosed to steady state31. The quantitative MSI method was applied to a tissue set identified as putative HIV reservoirs where latent virus may be dormant and current ARV regimens may not penetrate. MSI allows vital inter- and intraorgan assessment of drug penetration needed to eradicate HIV from an infected individual.
Eleven putative HIV reservoirs were analysed by IR-MALDESI MSI and distributions of EFV were quantified using a calibration curve on organ-matched, non-dosed tissue. The quantification process was performed in parallel to absolute concentration determination by LC-MS/MS, hematoxylin and eosin (H & E) staining, and immunohistochemistry (IHC) staining of CD3+ cells. Representative MS and IHC images for 5 tissues are shown in Figure 5. Interpretation of the three imaging modalities allowed for comprehensive determination of drug distribution into specific regions of an organ and its corresponding immune response by CD3. Heterogeneous EFV distribution was observed in the tissues, with the most heterogeneity observed in the gastrointestinal tract, specifically the colon (Figure 5A). Combining information gained from MSI, H&E, and IHC, it was determined that EFV had the highest concentration in the colon mucosa and lamina propria.
Figure 5.
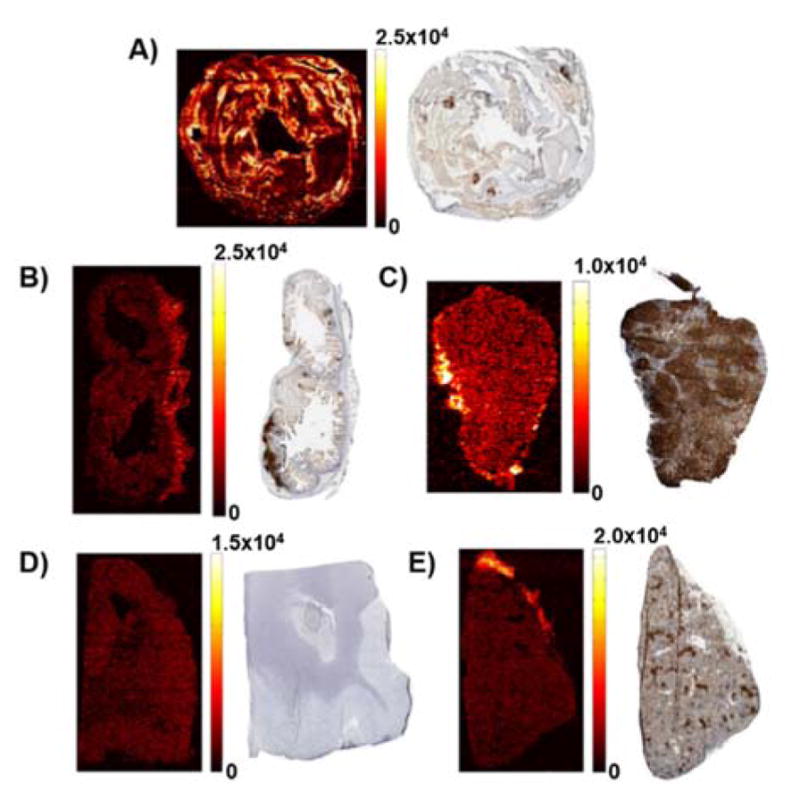
MSI of efavirenz and CD3+ IHC imaging of A) colon B) ileum C) inguinal lymph node D) cerebellum E) spleen. Reproduced from Ref. 31 with permission from American Society for Microbiology. Copywrite 2015.
MSI Imaging of Antiretroviral Drugs in Hair
Hair has long been used as a temporal record for determining use of drugs of abuse. However, this is typically performed using a thatch of hair which will represent the average incorporation over a long period of time. IR-MALDESI MSI was used to analyse single hair strands at a spatial resolution of 100 μm, which based on an average growth rate of 1 cm/month, gives a temporal resolution of approximately 7 hours28. This analysis is of particular interest to HIV research in patients receiving pre-exposure prophylaxis where consistent dosing is vital to the programs efficacy. IR-MALDESI proved to be a useful technique for the spatial analysis of hair without the need for sample preparation steps required for MALDI MSI, such as analyte extraction and/or longitudinal slicing of the individual hair strands47. Microscopy images of a hair after IR-MALDESI clearly showed ablation of the cuticle and into the cortex of the hair strands.
Many factors influence the incorporation of drug into hair including the drug basicity, lipophilicity, and melanin content of the hair. The authors present a method of normalization based on the oxidation of 5,6-dihydroxyindole-2-carboxylic acid, the monomeric unit of eumelanin, to pyrrole-2,3,5-tricarboxylic acid. This was performed by spraying the individual hair strands with 15% hydrogen peroxide and 1 M ammonium hydroxide using a thermally-assisted pneumatic sprayer. Figure 6A shows the distribution of EFV before and after treating the hair with H2O2. The sample preparation step does not delocalize or extract EFV significantly. Normalizing the response of incorporated EFV to the oxidized eumelanin product reduced variability between patients with different hair colour indicating IR-MALDESI could be broadly applicable method for drug adherence evaluation (Figure 6B).
Figure 6.

IR-MALDESI analysis of ARVs in hair. A) EFV distribution before and after H2O2 sample preparation for the normalization of drug incorporation to melanin content. MSI images show that incorporated EFV does not delocalize during sample preparation B) Normalization of EFV to monomeric eumelanin unit potential for broad application of IR-MALDESI MSI analysis to hair analysis of drug incorporation. Reprinted with permission from Ref. 28. Copywrite 2016 American Chemical Society.
Untargeted Metabolomic MSI Analyses
Polarity switching MSI of Cancerous vs Healthy Ovarian Tissue
IR-MALDESI is well suited for untargeted metabolite and lipid analysis of biospecimens, allowing researchers to better understand underlying biological factors in health and disease46, 48. Ionization by electrospray allows facile acquisition in either positive or negative mode. A strategy for repeated acquisition of both polarities in a spatially resolved manner was originally applied to the forensic analysis of fibres and dyes. In this polarity switching MSI method, positive and negative ionization was performed on alternating voxels of the image27. Interpretation of the data requires parsing of the data file by polarity prior to MSI interpretation. This allows for analysis by both polarities on the same tissue with minimal loss in spatial resolution. This acquisition method was optimized and applied to sections of cancer and control ovarian tissue from a chicken model of ovarian cancer (OVC)42. Prior to analysis, the authors investigated the influence of several electrospray compositions and their effects on lipid response in both polarities. The optimized conditions were applied to the untargeted analysis of healthy and cancerous chicken ovary tissue, with fold differences in ion abundance being compared in MSiReader. Spatial interrogation of OVC is important in characterizing alterations in lipid metabolism, which has been linked to the disease49. Figure 7 shows MS images of selected lipids in a healthy (left) and cancerous (right) chicken ovary tissue. The dashed line indicates maturing follicles in the healthy tissue while the solid white line indicates the cancerous regions in an ovary tissue. The untargeted method revealed compounds up and down regulated in the two tissues, indicating potential for IR-MALDESI to discover potential biomarkers of disease (Figure 7).
Figure 7.

Control (left) and cancer (right) ovarian tissue was analysed using IR-MALDESI MSI. The two tissue types showed significant changes in lipid and metabolite profiles especially in maturing follicles (dashed line) and within cancerous regions (solid line). Reproduced from Ref. 42 with permission from The Royal Society of Chemistry
Fundamental mass spectrometry principles of spectral accuracy and sulfur counting were used in the identification of lipid and metabolites from full scan MS1 data. For example, glutathione was identified using accurate mass (<1 ppm) and the concept of sulfur counting to eliminate other possible isobaric species from MS1 data.
Limitations
The utility of IR-MALDESI has been demonstrated but there are several inherent limitations of the technique. Nearly every MSI technique requires cryosectioning of tissues, which does not allow analysis at multiple time points from a single biological experiment. Instead, analysis of several time points must be carried out using separate subjects, increasing time and cost while introducing biological variability. MSI is primarily used as a destructive ex vivo imaging technique and is not typically applied to in vivo imaging. However, recent publication of in vivo analysis using laser desorption with secondary ionization was recently reported50, describing a new way of performing MSI for in vivo imaging. Quantification using IR-MALDESI is method development intensive, requiring careful selection of a normalization compound and creation of a calibration curve for each compound. Typically, quantitative MSI experiments are run in parallel to a validated LC/MS assay for comparison of total amount of analyte in the tissue. Analysis of tissue in microprobe mode requires the sequential analysis of thousands of tissue desorption events, thereby effectively diluting the amount of tissue sampled by several orders of magnitude. In addition to the minute amount of tissue sampled per spectrum, no pre-concentration or chromatographic separation steps may be performed due to the repetitive, sequential acquisition in MSI. This repeated acquisition of MSI results in analysis times of several hours for a modest-sized tissue. Additionally, IR-MALDESI MSI shows preference for compounds that are highly abundant and easily ionisable and most applications are towards small molecules and lipids. To date, large biomolecules such as proteins have not been observed from tissue, however, they are easily detected from purified protein solutions for concentrations as low as 10 pM17. Detection of intact or tryptic peptides from tissue will require extensive method development that differs significantly from our current protocols presented here and are an ongoing research focus.
Conclusions
IR-MALDESI has proven to be a robust MSI technique for the analysis of biospecimens. Significant improvements have been made in analysis from a breadth of sample types and analytes while retaining the spatial location. There is still opportunity in the MSI field for improvement, in comprehensiveness of analysis, exhaustively defining quantification abilities, reducing spatial resolution, and validation of and application to real biological questions. The application of IR-MALDESI MSI to targeted, quantitative drug distribution studies and untargeted metabolomics studies demonstrates the versatility of the IR-MALDESI imaging platform for a variety of analytes and applications.
Supplementary Material
Acknowledgments
The authors thank Milad Nazari and Brian Cartiff for their assistance in preparing this manuscript. The authors gratefully acknowledge financial support from the National Institutes of Health (R01GM087964), the W.M. Keck Foundation, and North Carolina State University.
Footnotes
Footnotes relating to the title and/or authors should appear here. Electronic Supplementary Information (ESI) available: [details of any supplementary information available should be included here]. See DOI: 10.1039/x0xx00000x
References
- 1.Groseclose MR, Andersson M, Hardesty WM, Caprioli RM. Journal of Mass Spectrometry. 2007;42:254–262. doi: 10.1002/jms.1177. [DOI] [PubMed] [Google Scholar]
- 2.Prideaux B, Stoeckli M. Journal of proteomics. 2012;75:4999–5013. doi: 10.1016/j.jprot.2012.07.028. [DOI] [PubMed] [Google Scholar]
- 3.Miura D, Fujimura Y, Wariishi H. Journal of proteomics. 2012;75:5052–5060. doi: 10.1016/j.jprot.2012.02.011. [DOI] [PubMed] [Google Scholar]
- 4.Crecelius AC, Schubert US, von Eggeling F. The Analyst. 2015;140:5806–5820. doi: 10.1039/c5an00990a. [DOI] [PubMed] [Google Scholar]
- 5.Rubakhin SS, Jurchen JC, Monroe EB, Sweedler JV. Drug Discovery Today. 2005;10:823–837. doi: 10.1016/S1359-6446(05)03458-6. [DOI] [PubMed] [Google Scholar]
- 6.Castaing R, Slodzain G. J Microscopie. 1962;1:395–410. [Google Scholar]
- 7.Spengler B, Hubert M, Kaufmann R. Chicago, Illinois, USA: 1994. [Google Scholar]
- 8.Caprioli RM, Farmer TB, Gile J. Analytical chemistry. 1997;69:4751–4760. doi: 10.1021/ac970888i. [DOI] [PubMed] [Google Scholar]
- 9.Palmer A, Trede D, Alexandrov T. Metabolomics. 2016;12:1–3. [Google Scholar]
- 10.Robichaud G, Barry JA, Muddiman DC. Encyclopedia of Analytical Chemistry. John Wiley & Sons, Ltd; 2006. [DOI] [Google Scholar]
- 11.Shiea J, Huang MZ, Hsu HJ, Lee CY, Yuan CH, Beech I, Sunner J. Rapid Communications in Mass Spectrometry. 2005;19:3701–3704. doi: 10.1002/rcm.2243. [DOI] [PubMed] [Google Scholar]
- 12.Sampson JS, Hawkridge AM, Muddiman DC. Journal of the American Society for Mass Spectrometry. 2006;17:1712–1716. doi: 10.1016/j.jasms.2006.08.003. [DOI] [PubMed] [Google Scholar]
- 13.Nemes P, Vertes A. Analytical chemistry. 2007;79:8098–8106. doi: 10.1021/ac071181r. [DOI] [PubMed] [Google Scholar]
- 14.Brady JJ, Judge EJ, Levis RJ. Rapid communications in mass spectrometry : RCM. 2009;23:3151–3157. doi: 10.1002/rcm.4226. [DOI] [PubMed] [Google Scholar]
- 15.Rezenom YH, Dong J, Murray KK. The Analyst. 2008;133:226–232. doi: 10.1039/b715146b. [DOI] [PubMed] [Google Scholar]
- 16.Fenn JB, Mann M, Meng CK, Wong SF, Whitehouse CM. Science. 1989;246:64–71. doi: 10.1126/science.2675315. [DOI] [PubMed] [Google Scholar]
- 17.Barry JA, Muddiman DC. Rapid Communications in Mass Spectrometry. 2011;25:3527–3536. doi: 10.1002/rcm.5262. [DOI] [PMC free article] [PubMed] [Google Scholar]
- 18.Robichaud G, Barry JA, Muddiman DC. Journal of the American Society for Mass Spectrometry. 2014;25:319–328. doi: 10.1007/s13361-013-0787-6. [DOI] [PMC free article] [PubMed] [Google Scholar]
- 19.Rosen E, Bokhart M, Ghashghaei HT, Muddiman D. Journal of the American Society for Mass Spectrometry. 2015;26:899–910. doi: 10.1007/s13361-015-1114-1. [DOI] [PMC free article] [PubMed] [Google Scholar]
- 20.Sampson JS, Hawkridge AM, Muddiman DC. Journal of the American Society for Mass Spectrometry. 2008;19:1527–1534. doi: 10.1016/j.jasms.2008.06.013. [DOI] [PMC free article] [PubMed] [Google Scholar]
- 21.Sampson JS, Muddiman DC. Rapid Communications in Mass Spectrometry. 2009;23:1989–1992. doi: 10.1002/rcm.4113. [DOI] [PubMed] [Google Scholar]
- 22.Sampson JS, Murray KK, Muddiman DC. Journal of the American Society for Mass Spectrometry. 2009;20:667–673. doi: 10.1016/j.jasms.2008.12.003. [DOI] [PMC free article] [PubMed] [Google Scholar]
- 23.Sampson JS, Hawkridge AM, Muddiman DC. Analytical chemistry. 2008;80:6773–6778. doi: 10.1021/ac8001935. [DOI] [PMC free article] [PubMed] [Google Scholar]
- 24.Robichaud G, Barry JA, Garrard KP, Muddiman DC. Journal of the American Society for Mass Spectrometry. 2013;24:92–100. doi: 10.1007/s13361-012-0505-9. [DOI] [PMC free article] [PubMed] [Google Scholar]
- 25.Goodwin RJA. Journal of proteomics. 2012;75:4893–4911. doi: 10.1016/j.jprot.2012.04.012. [DOI] [PubMed] [Google Scholar]
- 26.Cochran KH, Barry JA, Muddiman DC, Hinks D. Analytical chemistry. 2012;85:831–836. doi: 10.1021/ac302519n. [DOI] [PMC free article] [PubMed] [Google Scholar]
- 27.Cochran KH, Barry JA, Robichaud G, Muddiman DC. Analytical and bioanalytical chemistry. 2015;407:813–820. doi: 10.1007/s00216-014-8042-y. [DOI] [PMC free article] [PubMed] [Google Scholar]
- 28.Rosen EP, Thompson CG, Bokhart MT, Prince HMA, Sykes C, Muddiman DC, Kashuba ADM. Analytical chemistry. 2016;88:1336–1344. doi: 10.1021/acs.analchem.5b03794. [DOI] [PMC free article] [PubMed] [Google Scholar]
- 29.Barry J, Robichaud G, Bokhart M, Thompson C, Sykes C, Kashuba AM, Muddiman D. Journal of the American Society for Mass Spectrometry. 2014;25:2038–2047. doi: 10.1007/s13361-014-0884-1. [DOI] [PMC free article] [PubMed] [Google Scholar]
- 30.Bokhart M, Rosen E, Thompson C, Sykes C, Kashuba AM, Muddiman D. Analytical and bioanalytical chemistry. 2015;407:2073–2084. doi: 10.1007/s00216-014-8220-y. [DOI] [PMC free article] [PubMed] [Google Scholar]
- 31.Thompson CG, Bokhart MT, Sykes C, Adamson L, Fedoriw Y, Luciw PA, Muddiman DC, Kashuba ADM, Rosen EP. Antimicrobial Agents and Chemotherapy. 2015;59:2944–2948. doi: 10.1128/AAC.04952-14. [DOI] [PMC free article] [PubMed] [Google Scholar]
- 32.Groseclose MR, Castellino S. Analytical chemistry. 2013;85:10099–10106. doi: 10.1021/ac400892z. [DOI] [PubMed] [Google Scholar]
- 33.Rosen EP, Bokhart MT, Nazari M, Muddiman DC. Analytical chemistry. 2015;87:10483–10490. doi: 10.1021/acs.analchem.5b02641. [DOI] [PMC free article] [PubMed] [Google Scholar]
- 34.Nazari M, Bokhart MT, Muddiman DC. 2016:e53942. doi: 10.3791/53942. [DOI] [PMC free article] [PubMed] [Google Scholar]
- 35.Jurchen JC, Rubakhin SS, Sweedler JV. Journal of the American Society for Mass Spectrometry. 2005;16:1654–1659. doi: 10.1016/j.jasms.2005.06.006. [DOI] [PubMed] [Google Scholar]
- 36.Nazari M, Muddiman D. Analytical and bioanalytical chemistry. 2015;407:2265–2271. doi: 10.1007/s00216-014-8376-5. [DOI] [PMC free article] [PubMed] [Google Scholar]
- 37.Kessner D, Chambers M, Burke R, Agus D, Mallick P. Bioinformatics. 2008;24:2534–2536. doi: 10.1093/bioinformatics/btn323. [DOI] [PMC free article] [PubMed] [Google Scholar]
- 38.Schramm T, Hester A, Klinkert I, Both JP, Heeren RM, Brunelle A, Laprevote O, Desbenoit N, Robbe MF, Stoeckli M, Spengler B, Rompp A. Journal of proteomics. 2012;75:5106–5110. doi: 10.1016/j.jprot.2012.07.026. [DOI] [PubMed] [Google Scholar]
- 39.Race AM, Styles IB, Bunch J. Journal of proteomics. 2012;75:5111–5112. doi: 10.1016/j.jprot.2012.05.035. [DOI] [PubMed] [Google Scholar]
- 40.Robichaud G, Garrard KP, Barry JA, Muddiman DC. Journal of the American Society for Mass Spectrometry. 2013;24:718–721. doi: 10.1007/s13361-013-0607-z. [DOI] [PMC free article] [PubMed] [Google Scholar]
- 41.Barry JA, Groseclose MR, Robichaud G, Castellino S, Muddiman DC. International Journal of Mass Spectrometry. 2015;377:448–455. doi: 10.1016/j.ijms.2014.05.012. [DOI] [PMC free article] [PubMed] [Google Scholar]
- 42.Nazari M, Muddiman DC. The Analyst. 2016;141:595–605. doi: 10.1039/c5an01513h. [DOI] [PMC free article] [PubMed] [Google Scholar]
- 43.Schuhmann K, Almeida R, Baumert M, Herzog R, Bornstein SR, Shevchenko A. Journal of Mass Spectrometry. 2012;47:96–104. doi: 10.1002/jms.2031. [DOI] [PubMed] [Google Scholar]
- 44.Korte AR, Lee YJ. Journal of the American Society for Mass Spectrometry. 2013;24:949–955. doi: 10.1007/s13361-013-0613-1. [DOI] [PubMed] [Google Scholar]
- 45.Wu Z, Gao W, Phelps MA, Wu D, Miller DD, Dalton JT. Analytical chemistry. 2004;76:839–847. doi: 10.1021/ac0351670. [DOI] [PMC free article] [PubMed] [Google Scholar]
- 46.Meier F, Garrard KP, Muddiman DC. Rapid Communications in Mass Spectrometry. 2014;28:2461–2470. doi: 10.1002/rcm.7041. [DOI] [PMC free article] [PubMed] [Google Scholar]
- 47.Nakanishi T, Nirasawa T, Takubo T. Journal of Analytical Toxicology. 2014;38:349–353. doi: 10.1093/jat/bku032. [DOI] [PubMed] [Google Scholar]
- 48.Loziuk P, Meier F, Johnson C, Ghashghaei HT, Muddiman DC. Analytical and bioanalytical chemistry. 2016;408:3453–3474. doi: 10.1007/s00216-016-9421-3. [DOI] [PMC free article] [PubMed] [Google Scholar]
- 49.Menendez JA, Lupu R. Nature Reviews Cancer. 2007;7:763–777. doi: 10.1038/nrc2222. [DOI] [PubMed] [Google Scholar]
- 50.Lee JK, Jansson ET, Nam HG, Zare RN. Analytical chemistry. 2016;88:5453–5461. doi: 10.1021/acs.analchem.6b00881. [DOI] [PMC free article] [PubMed] [Google Scholar]
Associated Data
This section collects any data citations, data availability statements, or supplementary materials included in this article.