

Abstract
The liver circadian clock is reprogrammed by nutritional challenge through the rewiring of specific transcriptional pathways. As the gut microbiota is tightly connected to host metabolism, whose coordination is governed by the circadian clock, we explored whether gut microbes influence circadian homeostasis and how they distally control the peripheral clock in the liver. Using fecal transplant procedures we reveal that, in response to high‐fat diet, the gut microbiota drives PPARγ‐mediated activation of newly oscillatory transcriptional programs in the liver. Moreover, antibiotics treatment prevents PPARγ‐driven transcription in the liver, underscoring the essential role of gut microbes in clock reprogramming and hepatic circadian homeostasis. Thus, a specific molecular signature characterizes the influence of the gut microbiome in the liver, leading to the transcriptional rewiring of hepatic metabolism.
Keywords: circadian clock, liver, microbiota, PPARγ
Subject Categories: Metabolism; Transcription; Microbiology, Virology & Host Pathogen Interaction
Introduction
Circadian rhythms are intimately linked to a large array of physiological processes, metabolic control, immune responses, hormonal regulations, and behavior 1, 2. The mammalian central pacemaker is localized in the hypothalamus, in a paired neuronal structure called the suprachiasmatic nucleus (SCN). The discovery that all tissues and virtually all cells contain an intrinsic circadian clock revolutionized the field, providing a conceptual framework toward the understanding of organismal homeostasis and physiological tissue‐to‐tissue communication 3, 4, 5, 6, 7, 8, 9, 10. It has been recently demonstrated that misalignment of the peripheral clocks with the SCN may contribute to a variety of pathological conditions 11. Indeed, disruption of the circadian clock has been shown to lead to imbalance in metabolic homeostasis, contributing to a number of pathologies 12, 13, 14, 15.
Accumulating evidence reveals that changes in nutritional regimes, including time‐restricted feeding and challenge by high‐fat diet (HFD), extensively influence liver circadian metabolism 16, 17, 18. Importantly, the clock system undergoes a metabolic and transcriptional reprogramming in response to nutritional challenge, which involves the cyclic activation of otherwise non‐circadian transcription factors. Specifically, oscillation of peroxisome proliferative activated receptor‐γ (PPARγ) and its recruitment to chromatin drives a significant fraction of the HFD‐induced liver clock reprogramming 19.
As dietary intake drastically affects the microbial community structure residing in the gut 20, 21, 22, 23, we sought to explore whether gut microbes might be responsible for the reprogramming of hepatic circadian rhythmicity. Indeed, while it has been demonstrated that HFD‐induced adiposity is transmissible via microbiota transfer 20, 24 and that the gut microbiota contributes to circadian clock function 25, 26, little is known about the molecular signatures through which gut microbes regulate clock function in a distal tissue. This question has unique relevance with respect to circadian biology as gut bacteria are considered to constitute an additional host organ, and it has been shown that they have important influences on host developmental and physiological processes 27, 28, 29, 30. Here, we show that a significant fraction of HFD‐induced transcriptional reprogramming of the liver clock by PPARγ 19 is mediated by the gut microbial communities. This finding provides new insights into the connection between gut microbiome and the host's circadian metabolism. Indeed, we describe a specific molecular mechanism within the liver clock that interprets gut microbiota‐driven signals to serve the interplay between the gut and hepatic metabolism.
Results and Discussion
Microbial transfer mimics HFD‐induced changes in liver metabolism
To determine whether the HFD‐induced metabolic phenotype is transmissible through microbial transfer, we colonized control chow (CC)‐fed recipient mice with microbial communities freshly harvested from donors fed CC or HFD (weighed 25.82 ± 0.36 g and 40.15 ± 1.55 g, respectively; for details see Materials and Methods). Consistent with previous reports 20, 31, the gut microbiome derived from HFD‐fed donors (HF‐D) contained an increased fraction of Firmicutes and lower levels of Bacteroidetes as compared to CC‐fed donors (CC‐D) (Fig EV1A).
Figure EV1. Features of donors and recipients.
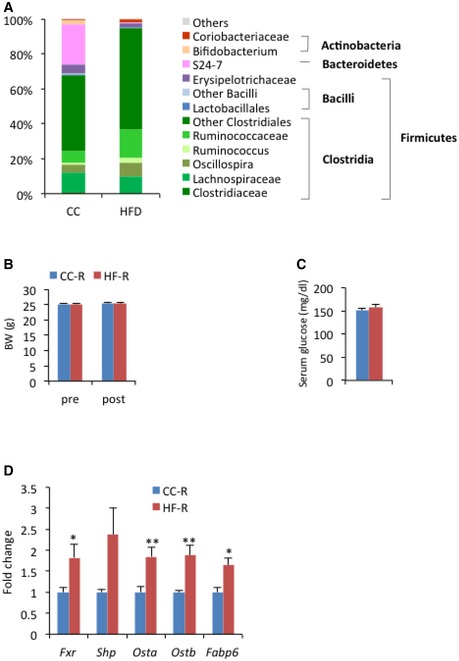
- 16S rRNA analysis of fecal DNA in donors. Average abundance of each bacterial genus by DNA sequencing shows the expected differences induced by the HFD in comparison to CC. n = 4 per group.
- Body weight of recipients before (pre) and after (post) transplantation (n = 35 per group, unpaired, two‐tailed Student's t‐test, not significant). Error bars represent SEM.
- Blood glucose levels of recipients. Blood was collected from tail vein at ZT4 (n = 11 per group, unpaired, two‐tailed Student's t‐test, not significant). Error bars represent SEM.
- Ileal gene expression of recipients related to bile acid metabolism at ZT12 (n = 6–7 per each group, unpaired, two‐tailed Student's t‐test, *P < 0.05, **P < 0.01.). Error bars represent SEM.
Ten days following the final fecal transplantation, HF‐D feces recipient (HF‐R) had significantly more epididymal (2.52 ± 0.08% versus 1.97 ± 0.10%) and mesenteric (1.32 ± 0.04% versus 1.19 ± 0.04%) fat pad mass than CC‐D feces recipient (CC‐R) (Fig 1A), whereas body weight and blood glucose levels were not affected (Fig EV1B and C). Also, an increase in lipid abundance in the liver was evident in HF‐R compared to CC‐R, which paralleled hepatic histology of HFD‐fed animals (Fig 1B and C). This metabolic profile strongly suggests that transmission of the HFD‐induced phenotype depends directly on microbiota transplantation. As expected, CC‐R and HF‐R mice displayed a significant difference in their microbiota composition (Fig 1D). There was an increase in the levels of Actinobacteria in HF‐R compared with CC‐R as well as in Coriobacteriaceae, which have been previously associated with obesity 32. Moreover, HF‐R microbiota was enriched in Mollicutes, in line with observations indicating that this class of bacteria is involved in diet‐induced obesity in mice 24, 33.
Figure 1. Metabolic phenotype induced by fecal transplantation.
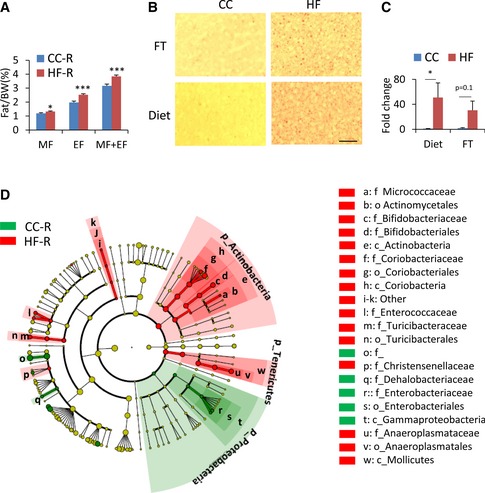
- % fat mass/body weight of recipient mice (n = 34 per group, Student's t‐test, *P < 0.05, ***P < 0.001). Error bars represent SEM. MF: mesenteric fat, EF: epididymal fat. CC‐R: control chow‐feces recipients, HF‐R: high‐fat diet‐feces recipients.
- Oil Red O staining of livers after 2 weeks of diet challenge (Diet) or fecal transplantation (FT). Fat vesicles were photographed at 100× magnification. CC: control chow, HF: high‐fat diet. Scale bar, 0.1 mm.
- Fold change in lipid droplet area (n = 3–5 each group, diet: Mann–Whitney rank‐sum test *P < 0.05; fecal transplantation: unpaired, two‐tailed Student's t‐test P = 0.1). Error bars represent SEM.
- Cladogram generated from LEfSe analysis showing the differentially abundant microbiota from CC‐R and HF‐R.
Interestingly, in accordance with the notion that the gut microbiota elicits a profound effect on bile acid metabolism and on gut Farnesoid X receptor (FXR) signaling 34, 35, we found that expression of Fxr and FXR target genes fatty acid binding protein‐6 (Fabp6), organic solute transporter‐α (Osta) and organic solute transporter‐β (Ostb) to be significantly upregulated in the HF‐R ileum (Fig EV1D), confirming the remodeling of the gut microbiome by fecal transplantation in recipient mice. As previous studies demonstrated that gut microbiota is able to promote an obesity phenotype through FXR 36, it is conceivable that phenotypic differences between HF‐R and CC‐R were at least in part attributable to FXR signaling alteration.
Rewiring of the hepatic circadian clock by HFD and HFD‐derived gut microbiome
Circadian regulation plays an important role in liver functions, as bile acids, lipids, cholesterol, and glucose are all subject to diurnal control 37. In order to investigate how gut microbial remodeling affects the circadian clock machinery in the liver, we examined hepatic gene expression in mice receiving fecal transplants from CC‐ or HFD‐fed mice. Livers were collected at 4‐h intervals along the circadian cycle, starting at 10 days following the final fecal transplantation (FT). It has been previously described that HFD, while inducing an extensive reprogramming of alternative transcription pathways, does not significantly influence the rhythmicity of the core clock genes, causing modest changes in the phase and amplitude of transcript oscillation 17, 18, 19. Livers from CC‐R and HF‐R followed the same pattern, with clock genes such as Bmal1, Per2, Rev‐erba, and the CLOCK:BMAL1‐driven gene albumin D‐box binding protein (Dbp) robustly rhythmic and slightly phase advanced in HF‐R (Fig 2A). These profiles perfectly mirrored the ones of the corresponding transcripts in HFD‐fed mice, as shown by the difference between HF and CC expression profiles (delta (HF‐CC)) in each condition (diet and FT) (Fig 2B). This analysis underscores that the effect of HF fecal transplant on the liver clock parallels the one of HFD. Finally, BMAL1 phosphorylation, known to contribute to BMAL1‐driven circadian activity 38, 39, was virtually unaltered between CC‐R and HF‐R (Fig 2C), showing a mild phase advance in BMAL1 phosphorylation in HF‐R compared to CC‐R, in keeping with the phase advance of BMAL1 targets observed in HF‐R mice (Fig 2A). Our data demonstrate that the liver core clock is only slightly modulated by HFD‐dependent alteration in gut microbiota composition. On the other hand, metabolic changes triggered by the microbiota affect liver functions that in turn can influence clock‐driven circadian physiology.
Figure 2. Core clock genes and BMAL1 protein expression.
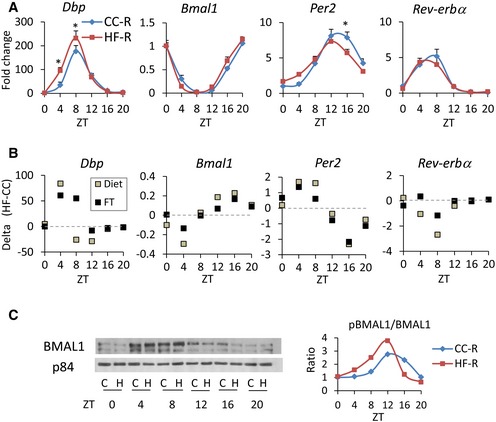
- qPCR of core clock genes (n = 5–6 each group, two‐way ANOVA, post hoc Holm–Sidak comparisons, *P < 0.05). Error bars represent SEM.
- Clock gene expression comparison between HFD‐fed and HFD‐R mice. Every square in the graphs represents the difference between HF and CC qPCR values (delta (HF‐CC)) in each condition (Diet or FT) at each time point.
- Representative image of immunoblot analysis of BMAL1 in nuclear fraction throughout the circadian cycle. C: CC‐R, H: HF‐R. On the right, ratio between phosphorylated BMAL1 and non‐phosphorylated BMAL1 is shown.
HFD and HFD‐induced dysbiosis share a specific transcriptional program
To assess the impact of dysbiosis on the liver of fecal‐transplanted animals, we performed transcriptome analysis by studying genes differentially expressed at ZT0 and ZT12 (the end and the beginning of the mouse active phase). At ZT0, 367 transcripts were downregulated and 871 were upregulated in HF‐R compared to CC‐R. On the other hand, 416 transcripts were downregulated and 2,071 were upregulated in HF‐R compared to CC‐R at ZT12. These results were then compared to our previous liver transcriptome data from 10‐weeks HFD‐fed animals 19 to identify common regulatory pathways. We performed pathway analyses both for genes shared by HF feeding and FT (Fig 3C and D) and for genes exclusively regulated by either HFD feeding or HF‐FT with respect to their CC group (Fig EV2). Of all transcripts found to be upregulated in both HFD‐fed mice and HF‐R compared to CC‐fed and CC‐R respectively at ZT12, 133 transcripts were shared (Fig 3A, Source Data). Singular enrichment analysis of KEGG pathways of the overlapping genes revealed several categories related to lipid metabolism, such as “biosynthesis of unsaturated fatty acids” and “PPAR signaling pathway” (Fig 3D). On the other hand, 109 genes appeared in the group of transcripts that were downregulated in both HFD‐fed animals and HF‐R at ZT12 (Fig 3A). In contrast to “up in both high‐fat groups” at ZT12, we found unique annotations including “protein processing in endoplasmic reticulum”, “RNA transport”, and “protein transport” (Fig 3C). At ZT0 (Fig 3A, Source Data), “steroid hormone biosynthesis pathway” was found “down in both high‐fat groups” while no liver‐associated annotations were enriched in “up in both high‐fat groups” (see Table EV1 for details). The comparative analyses between high‐fat feeding and HF‐R transcriptome data revealed that lipid metabolism is the principal biological process, which is influenced by both high‐fat feeding and HFD‐induced dysbiosis. Moreover, the categories related to lipid metabolism present in our gene ontology analysis suggest ZT12 as the most relevant ZT involved in the transcriptional modifications induced by both HFD and HF‐R conditions.
Figure 3. PPARγ‐driven transcriptional reprogramming induced by microbial transplantation.
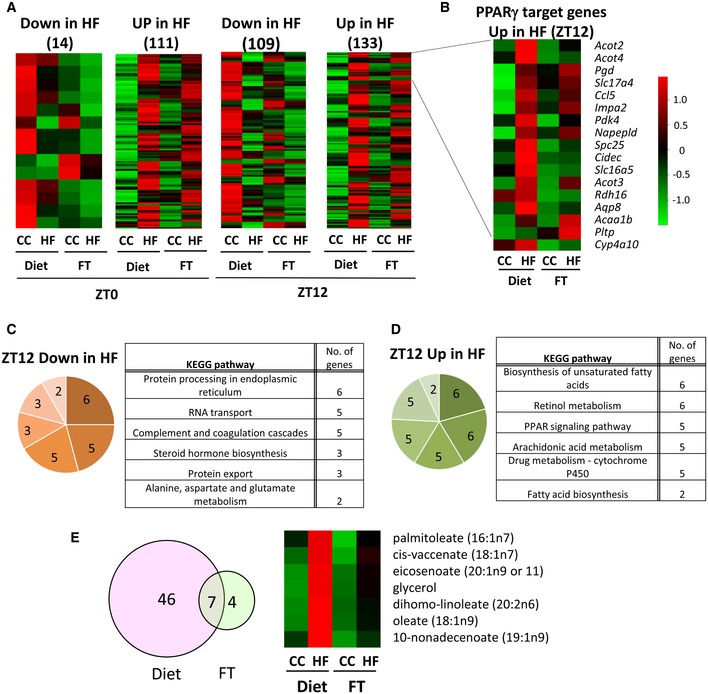
- Heat maps representing the genes significantly downregulated or upregulated in HF feeding and HF fecal transplantation at ZT0 and ZT12 (n = 4, Cyber t‐test P < 0.05).
- Heat map of PPARγ target genes upregulated in both HFD feeding and HF‐R at ZT12 (n = 4, Cyber t‐test P < 0.05).
- KEGG pathway analysis of genes downregulated at ZT12 in both HF feeding and HF‐R.
- KEGG pathway analysis of genes upregulated at ZT12 in both HFD feeding and HF‐R.
- Venn diagram and heat map of metabolites whose expression increased in both HFD feeding and HF‐R at ZT12 (n = 5, Cyber t‐test P < 0.05).
Source data are available online for this figure.
Figure EV2. KEGG pathways of the gene clusters exclusively upregulated or downregulated in HFD or HF‐FT.

Gut microbial remodeling induces circadian PPARγ recruitment in HF‐R
A prominent pathway through which high‐fat feeding induces remodeling of the liver clock is the de novo cyclic activation of PPARγ 19. PPARγ is abundantly expressed in adipose tissue and it is less abundant in the liver under physiological conditions, however it is induced in hepatic steatosis or in obesity 40, 41. Based on the signatures of transcriptome analyses, we speculated that PPARγ‐driven reprogramming induced by high‐fat feeding might be mediated by microbial alteration. Thus, to address this issue, we crossed 133 genes “up in both high‐fat groups” with previously established PPARγ‐ChIP Seq analysis data 42, 43. Notably, we found that 17 out of the 133 (12.8%; P = 0.006) genes, including DFFA‐like effector c (Cidec), acyl‐CoA thioesterase 2 (Acot2), and phospholipid transfer protein (Pltp) (Fig 3B), were PPARγ targets. Notably, comparative analysis of the liver metabolome at ZT12 (Source Data) revealed that 6 out of 7 metabolites, which were significantly increased in both HFD‐fed animals and HF‐R at ZT12, were long‐chain fatty acids, and some of them, such as palmitoleate and oleate, are possible ligands of PPARγ 44, 45 (Figs 3E and EV3C). Indeed, gene expression of lipogenic enzymes catalyzing the synthesis of these long‐chain fatty acids such as acetyl‐CoA carboxylase 1 (Acc1), fatty acid elongase 6 (Elovl6), and stearoyl‐CoA desaturase 1 (Scd1) and its transcription factor SREBP1 were significantly upregulated in HF‐R compared to CC‐R (Fig EV3A–C). Furthermore, it is reported that PPARγ enhances lipogenic gene expression in the liver and induces hepatic lipid accumulation 40, 41. Taken together, our comprehensive analyses confirm that microbial remodeling induces ZT‐dependent PPARγ pathway activation at a global transcriptional level in the liver accompanied by hepatic metabolites alteration.
Figure EV3. Lipogenic genes and SREBP1 protein are upregulated in HF‐R.
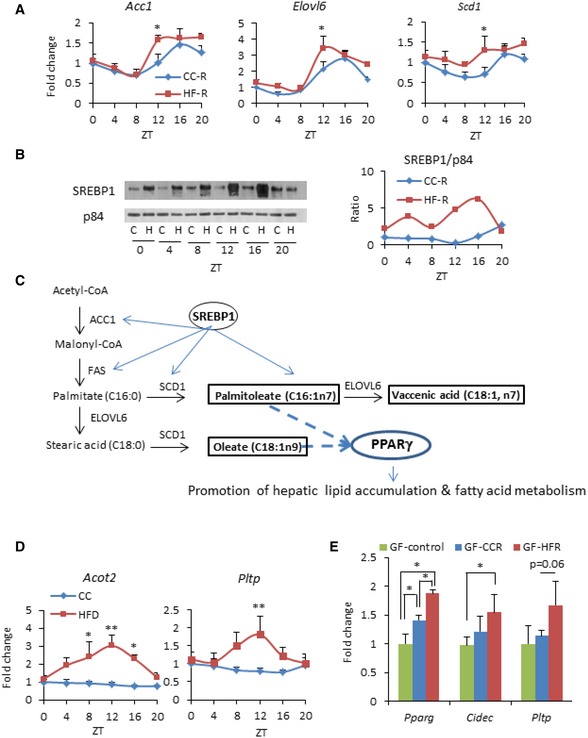
- Hepatic expression of lipogenic genes in recipients (n = 5–12 per group, per time point, two‐way ANOVA, post hoc Holm–Sidak comparisons, *P < 0.05). Error bars represent SEM.
- Immunoblot analysis of cleaved SREBP1 in the nuclear fraction. Representative image of two different sets of samples. On the right, quantification of SREBP1 normalized to p84.
- An example of connection between fatty acid synthesis pathway and metabolites depicted in Fig 2E.
- Hepatic gene expression in HFD‐fed animals. Hepatic Acot2 and Pltp transcript levels in mice fed HFD or CC for 10 weeks (n = 5 per group, per ZT, two‐way ANOVA, post hoc Holm–Sidak comparisons, *P < 0.05, **P < 0.01). Error bars represent SEM.
- Hepatic gene expression of PPARγ target genes in germ‐free mice fecal transplanted with microbiota from CC‐fed donor (GF‐CCR), HFD‐fed donor (GF‐HFR), and non‐treated germ‐free mice (n = 4–5 per each group, unpaired, two‐tailed Student's t‐test, *P < 0.05). Error bars represent SEM.
Based on these results, we next analyzed the PPARγ transcriptional pathway along the circadian cycle. Gene expression of Pparg and its target genes Cidec, Pltp, Acot2 and pyruvate carboxylase (Pcx) all displayed rhythmic profiles, which peaked at ZT12 in the HF‐R mice (Fig 4A). The expression of Cidec and Pcx genes has been previously demonstrated to become cyclic upon high‐fat feeding 19. Interestingly, Cidec is a lipid‐binding protein induced in the steatotic liver and contributes to lipid accumulation 46, 47. Also, the expression of both Acot2, the enzyme that hydrolyses long‐chain fatty acyl‐CoA and facilitates fatty acid oxidation 48, and Pltp, a lipid transfer protein that drives lipoprotein production 49, showed rhythmic expression with a zenith at ZT12 in HFD‐fed animals, in contrast to the expression of these genes in the CC‐fed animals (Fig EV3D). Again, Pparg and its target genes oscillated with striking amplitude in HF‐R as compared to CC‐R, peaking at ZT12 (Fig 4A). Similar results were confirmed in germ‐free (GF) mice transplanted with feces from HF‐D or CC‐D (Fig EV3E). Importantly, nuclear‐ and chromatin‐bound PPARγ (Fig 4B and C) drastically oscillated in HF‐R with a zenith at ZT12. This profile is remarkably reminiscent of the previously reported effect of HFD on liver PPARγ nuclear protein 19 (Fig 4B). Moreover, PPARγ recruitment to PPARγ‐binding sites (PPRE) in Cidec and Pcx promoters was significantly increased at ZT12, in line with gene and protein expression profiles (Fig 4D) and paralleled by a tendency to increase in trimethylation of Lys4 on the histone H3 (H3K4Me3) at the same genomic regions (Fig 4D). Finally, to verify that PPARγ activation is one of the central molecular mechanisms underlying HF‐R liver reprogramming, we treated fecal‐transplanted mice with the selective PPARγ antagonist GW9662 50. As expected, HF‐R injected with the vehicle (+ vehicle) displayed an increase in the epididymal fat with respect to CC‐R + vehicle. On the contrary, HF‐R injected with GW9662 (+ GW9662) showed no difference with respect to CC‐R mice + vehicle (Fig 4F). Strikingly, the increase in Pparg and Cidec liver gene expression at ZT12 was completely prevented in HF‐R + GW9662 (Fig 4E). Thus, a significant fraction of the HF microbiota‐dependent liver diurnal reprogramming relies on the induction and activation of the transcription factor PPARγ.
Figure 4. Microbial transplantation induces PPARγ pathway activation in HF‐R mice liver.
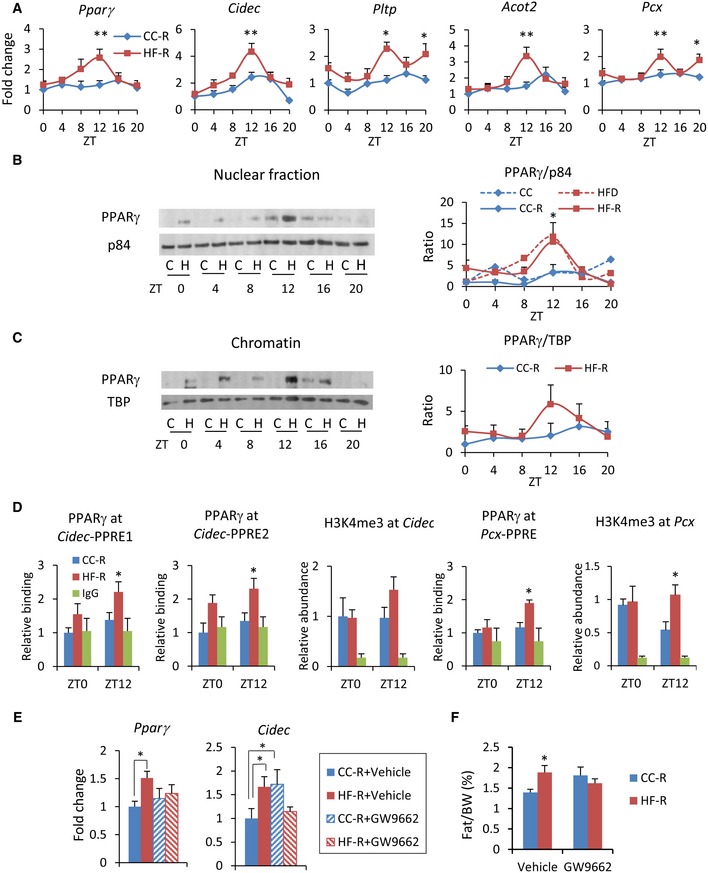
- PPARγ target genes expression measured by qPCR (n = 5–12 each group, two‐way ANOVA, post hoc Holm–Sidak comparisons, *P < 0.05, **P < 0.01). Error bars represent SEM.
- Immunoblot analysis of PPARγ in nuclear fraction. On the right, quantification of PPARγ normalized to p84 is shown. Average of donor mice (ref. 19) and four experimental replicates per time point, per group of recipient mice (two‐way ANOVA, post hoc Holm–Sidak comparisons, *P < 0.05). Error bars represent SEM.
- Immunoblot analysis of PPARγ in chromatin fraction. On the right, quantification of PPARγ normalized to the TBP is shown. Average of 4 experimental replicates, per time point, per group (two‐way ANOVA, no significant difference). Error bars represent SEM.
- Chromatin recruitment of PPARγ at PPAR binding site contained in Cidec and Pcx promoters (n = 3–5 per group, per ZT, two‐way ANOVA, post hoc Holm–Sidak comparisons, *P < 0.05). H3K4me3 abundance at Cidec and Pcx promoters (n = 4–7, per group, per ZT, unpaired, two‐tailed Student's t‐test, *P < 0.05). Error bars represent SEM.
- Pparg and Cidec gene expression at ZT12 in the liver of fecal‐transplanted animals treated with GW9662 or vehicle (n = 6–9 per group, two‐way ANOVA, post hoc Holm–Sidak comparisons, *P < 0.05). Error bars represent SEM.
- % epididymal fat mass/body weight of fecal‐transplanted animals treated with GW9662 or vehicle (n = 6–9 per group, unpaired, two‐tailed Student's t‐test, *P < 0.05). Error bars represent SEM.
HFD‐induced reprogramming is neutralized by antibiotic treatment
To validate that gut microbiota contributes to the HFD‐induced reprogramming, we treated HFD‐fed mice with an antibiotic cocktail for 6 weeks 51. Following antibiotic treatment, a remarkable enlargement of the cecum was observed (Fig 5A), a distinctive feature of germ‐free mice. The body weight of antibiotic‐treated animals on HFD showed a significantly smaller increase with respect to HFD‐fed control mice, but it was still significantly higher than that of CC‐fed control animals. On the contrary, there was no difference in body weight between CC‐fed animals treated or not treated with antibiotics (Fig 5B). Moreover, the high levels of serum glucose induced by high‐fat feeding were significantly decreased to control levels by antibiotic treatment (Fig EV4). The expression of Pparg and its targets were significantly higher in HFD‐fed control mice compared to CC‐fed control mice at ZT12, whereas there was no difference between the groups at ZT0. Strikingly, antibiotic treatment reversed the effect of HFD on Pparg and its target genes, significantly decreasing their expression at ZT12, the peak time point of Pparg in HFD‐fed animals (Fig 5C). It is worth noting that HFD‐induced reprogramming is dissociable from obesity 19. In fact, the expression of PPARγ target genes was not different between antibiotic‐treated HFD‐fed and CC‐fed animals even though the former weighed significantly more than the latter (Fig 5B). Thus, the reversible effects shown in the antibiotic‐treated HFD‐fed animals were induced by the depletion of microbiota, rather than the loss of body weight. These results confirm that the microbial alteration plays an important role in PPARγ‐driven diurnal transcriptional remodeling in HFD‐fed animals.
Figure 5. HFD‐induced reprogramming is counteracted by antibiotic treatment.
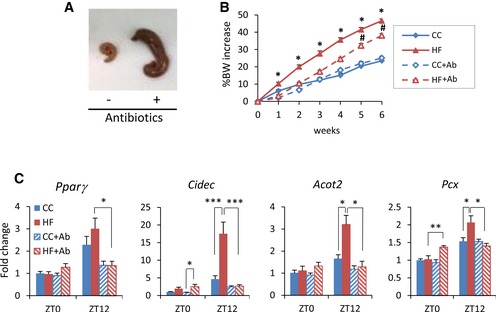
- Cecum of mice treated with or without antibiotics for 6 weeks.
- Body weight of animals fed CC or HFD and treated with or without antibiotics for 6 weeks. Animals were fed CC or HFD during the experiment (n = 8 HF and CC control, n = 18 HF and CC + antibiotic; HFD control versus HF antibiotic: Student's t‐test, *P < 0.05; HF antibiotic versus CC antibiotic: unpaired, two‐tailed Student's t‐test, # P < 0.05). Error bars represent SEM.
- Gene expression of Pparg and PPARγ target genes in the liver of mice fed CC or HFD for 6 weeks and simultaneously treated with an antibiotic cocktail (n = 4 for each antibiotic‐untreated group, n = 9 for each antibiotic‐treated group, per ZT; ZT0 and ZT12 two‐way ANOVA, post hoc Holm–Sidak comparisons, *P < 0.05, **P < 0.01, ***P < 0.001). Error bars represent SEM.
Figure EV4. Serum glucose in antibiotic‐treated mice.
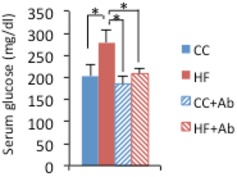
Serum glucose level of CC‐ and HFD‐fed mice treated or not treated with antibiotics for 6 weeks (n = 8 HF and CC control, n = 18 HF and CC + antibiotic, two‐way ANOVA, post hoc Holm–Sidak comparisons, *P < 0.05). Error bars represent SEM.
Accumulating evidence reveals that the gut microbiota is involved in maintaining the host metabolic homeostasis. Since metabolic networks and the circadian clock are intimately intertwined, the impact of the gut microbiota in regulating host peripheral clocks is significant 25, 52. Evidence is emerging that feeding rhythms induce diurnal fluctuations of gut microbiome 53, 54, 55 while disruption of the rhythmic microbial population in HFD‐fed animals leads to an alteration of hepatic circadian transcripts 25. However, the molecular mechanisms through which gut microbes regulate liver homeostasis by rewiring the circadian transcriptome have been unexplored.
Nuclear receptors play crucial roles in connecting the circadian network and metabolism 56 by sensing oscillatory metabolites and integrating them into host energy balance 57, 58. Among them, PPARγ, a master player in adipogenesis and a direct regulator of genes involved in lipid and glucose metabolism 59, is at the heart of this network 60, 61, 62. Notably, high‐fat feeding was shown to amplify the expression of Pparg 60 and its target genes by inducing de novo cyclic recruitment of PPARγ to chromatin 19. Our results show that gut microbial remodeling under high‐fat feeding induces rhythmic activation of PPARγ that in turn leads to transcriptional reprogramming in the liver. Circadian activation of PPARγ and SREBP1 expression coordinately contributes to the regulation of hepatic lipid metabolism in HF‐R mice and previous evidence demonstrates that metabolites produced by gut microbes regulate host liver lipogenesis 63, 64, 65. Indeed, we observed an increase in the levels of hepatic long‐chain fatty acids that are involved in both signaling pathways and in lipid accumulation in the liver. Furthermore, short‐chain fatty acids (SCFA) produced by bacterial fermentation are modulators of PPARγ 66, and PPARγ signaling might be altered by different SCFA profiles depending on dietary changes. Thus, we speculate that gut microbe‐derived metabolites modulate PPARγ activity in HF‐R liver either through direct activation or indirectly via SREBP1. Interestingly, HFD‐driven dysbiosis is implicated in hematopoietic stem cell differentiation through PPARγ activation 67, further supporting a PPARγ‐mediated effect of gut microbiota on distal tissues.
The circadian clock is fundamental to maintain liver tissue physiology and contributes to whole‐body metabolic homeostasis. Our results demonstrate that HFD‐induced gut dysbiosis affected hepatic diurnal rhythmicity and induced hepatosteatosis and an increase in fat depots. GW9662 treatment, blocking the microbiota‐driven PPARγ diurnal reprogramming, reverted the fat depot phenotype in HF‐R mice. The change in circadian gene expression subsequent to HFD microbiome remodeling might exacerbate more severe metabolic diseases.
In conclusion, we have demonstrated that the HFD‐induced remodeling in gut microbiome mediates PPARγ‐driven reprogramming of the host liver clock, leading to specific rewiring of circadian transcription. This effect was reversible by depletion of gut microbiota, confirming the importance of intestinal microbes' contribution to cellular plasticity in response to nutritional stress. The elucidation of the molecular mechanisms underlying the powerful effect of diet‐induced gut microbial alteration on the host liver circadian clock paves the way for pharmaceutical strategies to target metabolic diseases.
Materials and Methods
Animals
Age‐matched male C57BL/6J mice (Jackson Laboratory) were maintained on a 12‐h light/12‐h dark cycle with ad libitum access of food and water. Animals' care and use was in accordance with guidelines of the Institutional Animal Care and Use Committee at the University of California, Irvine. Male C57BL/6J germ‐free mice were kindly provided by Dr. Sarkis Mazmanian (California Institute of Technology).
Microbiota transplantation experiments
Six‐week‐old donor mice were fed CC or HFD for 6–11 weeks before their feces were harvested. Recipient mice were fed CC from the age of 6 weeks old, and they were pretreated with a combination of vancomycin 0.5 g/l and neomycin 1 g/l in drinking water for 1 week followed by intraperitoneal injection of clindamycin at 10 mg/kg body weight for two consecutive days before fecal transplantation. At the time of fecal transplantation, freshly harvested donor feces were suspended in PBS and mixed with a vortex for 10 min. Recipients at 12 weeks of age were colonized with microbiota by gavaging freshly prepared donor fecal suspension (0.8–1.0 mg feces/g BW/day) for 5 days, once a day. All recipients were kept on CC throughout the experimental period and sacrificed 10 days after the final transplantation. For fecal transplantation into germ‐free mice, 8‐week‐old male germ‐free mice were colonized only once. Recipient mice were sacrificed 14 days after fecal transplantation.
Microarray analysis
RNA was extracted using TRIzol reagent (GIBCO BRL Life Technologies) and cleaned up with RNeasy spin columns (Qiagen). Quality of purified RNA was checked with an Agilent Bioanalyzer (Agilent Technologies). Microarrays were performed at the UCI Genomics High‐throughput Facility, University of California, Irvine, as described in a previous study 19. Data sets can be found in the NCBI gene expression omnibus (GEO), GSE 82250 for FT and GSE 52333 for Diet experiment.
GW9662 treatment
GW9662 (Cayman Chemical) dissolved in DMSO was diluted in PBS and intraperitoneally injected to fecal‐transplanted mice (CC‐R and HF‐R) at a dose of 4 mg/kg at ZT12 for 15 days, once a day, from the second day of microbial transplantation. Animals were sacrificed at ZT12, and liver tissue was harvested for gene expression 24 h after the final injection.
Antibiotic treatment
Six‐week‐old mice were given vancomycin 0.5 g/l, ampicillin 1 g/l, neomycin 1 g/l, and metronidazole 1 g/l in drinking water ad libitum following previously published protocol to deplete commensals 51 and they were fed CC or HFD during this period. Mice were sacrificed after 6 weeks of antibiotic treatment.
Diets
Mice were fed a control chow (CC) (Harlan Laboratories, TD. 110870) or HFD (60% kcal fat, Research Diets, D12492) with ad libitum access to both diets. 2020X (Harlan Laboratories) was used as a CC for antibiotics treatment experiment. All diets used in this study were irradiated or autoclaved to avoid contamination.
Histological analysis
Freshly isolated liver was embedded in OCT, immediately snap frozen in liquid nitrogen and stored in −80°C until they were used for the analysis. Sections were sliced into 10 μm and stained with Oil Red O. Area of lipid droplets was calculated by ImageJ.
16S rRNA gene sequencing analysis
Feces collected from donors and recipients were immediately frozen in liquid nitrogen. Fecal DNA was extracted with QIAamp Fast DNA Stool Mini kit (Qiagen) according to the manufacturer's protocol. 16S rRNA gene sequencing was performed by Zymo Research (Irvine, CA, USA). DNA samples were quantified, followed by PCR amplification of V3 and V4 regions of the 16S rRNA gene. A second PCR was performed to add barcodes to each sample. The final amplicon libraries were quantified and then sequenced on MiSeq. Paired‐end raw reads in 2 × 250 bp length went through quality check steps including adaptor removal and trimming 3′ bases with quality score q < 20. Reads shorter than 20 bp were discarded. The data were analyzed using the program QIIME release 1.8.0 (www.qiime.org) and the latest Greengenes 16S rRNA gene database (gg_13_8).
Quantitative RT–PCR
Liver and intestine samples were homogenized in TRIzol lysis reagent. Chloroform was added and the samples were shaken for 15 s. The samples were left at RT for 3 min and then centrifuged (12,000 g, 15 min, 4°C). The upper phase aqueous solution, containing RNA, was collected in a fresh tube, and the RNA was precipitated by adding isopropanol. Samples were mixed by vortexing, left at RT for 10 min and then centrifuged (12,000 g, 10 min, 4°C). Supernatant was discarded and the RNA pellet was washed in 75% ethanol by centrifugation (7,500 g, 5 min, 4°C). Supernatant was discarded and the pellet was resuspended in DEPC water. Total RNA concentrations were determined by Nanodrop spectrophotometer (ThermoScientific). Total RNA was reverse transcribed using iScript Reverse Transcription Supermix (Bio‐Rad). Gene expression was analyzed by Real‐Time PCR (Bio‐Rad) using SsoAdvanced Universal SYBR Green Supermix (Bio‐Rad). See Table EV2 for the primer sequence list.
Nuclear and chromatin fraction extraction
Approximately 250 mg of liver was homogenized in 4 ml buffer A (10 mM HEPES, pH 7.8, 25 mM KCl, 0.5 mM spermidine, 1 mM EGTA, 1 mM EDTA, 0.32 M sucrose, and 0.3% Triton) with protease inhibitors. Samples were centrifuged at 1,000 g for 10 min at 4°C. Pellets were resuspended in 4 ml buffer A and centrifuged again at 1,000 g for 10 min at 4°C. Pellets were then resuspended in 4 ml low‐salt buffer (10 mM HEPES, pH 7.8, 25 mM KCl, 0.5 mM spermidine, 1 mM EGTA, 1 mM EDTA, and 20% glycerol) and then centrifuged again at 1,000 g for 10 min at 4°C. Nuclear pellets were resuspended in 1 ml low‐salt buffer, centrifuged, and resuspended in 1× volume low‐salt buffer and 2× high‐salt buffer (10 mM HEPES, pH 7.8, 25 mM KCl, 0.5 mM spermidine, 1 mM EGTA, 1 mM EDTA, 20% glycerol, and 0.5 M KCl). Suspensions were nutated for 1 h at 4°C and then centrifuged at 12,000 g for 20 min. The resulting supernatant is used as the soluble nuclear fraction. The pellet was resuspended in modified RIPA buffer, sonicated, centrifuged at 12,000 g for 20 min at 4°C, and used as chromatin fraction for subsequent immunoblot analysis.
Immunoblot analysis
Approximately 3–10 μg of nuclear or chromatin extract from liver samples was loaded on 8% polyacrylamide gels. The blots were blocked in 5% milk in TBST and incubated overnight at 4°C with a specific primary antibody. BMAL1 antibody (abcam # 93806) was diluted 1:2,000, PPARγ (1+2) antibody (abcam # 41928) 1:1,000, SREBP1 antibody (Santa Cruz # 13551) 1:100, and p84 antibody (GeneTex # 70220) 1:3,000. Blots were then washed three times in TBST for 20 min, incubated in HRP‐conjugated anti‐mouse or anti‐rabbit diluted (1:8,000) in 2.5% milk in TBST 1 h at RT. The membranes were then rinsed three times in TBST and incubated in enhanced chemiluminescent substrate and exposed to films. Films were scanned and densitometry was analyzed through ImageJ software.
Chromatin immunoprecipitation
Approximately 100 mg of liver tissue was minced and double crosslinked with DSG for 40 min and 1% formaldehyde for 10 min followed by adding glycine (0.125 M final concentration) at room temperature for 10 min. After homogenizing tissue pellet in PBS, 1 ml of lysis buffer was added. Samples were sonicated by Bioruptor to generate 200–500‐bp fragments and centrifuged at 10,000 g at 4°C. Supernatant was diluted in dilution buffer (1.1% Triton X‐100, 1.2 mM EDTA, 16.7 mM Tris–HCl, 167 mM NaCl), precleared with protein‐G beads blocked with salmon sperm DNA and BSA for 2 h. Precleared supernatant was incubated with 2 μg of PPARγ (1+2) antibody (abcam # 41928) or 3 μg of histone H3K4me3 (Active Motif #39159) primary antibodies overnight at 4°C. Protein‐G beads were added to the supernatant and incubated for 2 h at 4°C and centrifuged. Beads were recovered and washed in low‐salt buffer, high‐salt buffer, and LiCl buffer, followed by washing in TE for three times. Elution buffer (300 mM NaCl, 0.5% SDS, 10 mM Tris–HCl, 5 mM EDTA) was added to the washed beads and treated with RNase at 37°C for 2 h and proteinase K at 65°C overnight. Equal amount of PCI was added to the samples and the aqueous phase was recovered. DNA was precipitated by adding 100% ethanol, NaOAc, and glycogen and kept at −80°C overnight. Samples were centrifuged at 12,000 g for 30 min at 4°C and washed with 70% ethanol followed by centrifugation at 12,000 g for 30 min at 4°C. Quantitative PCR was done using SYBRGreen reagent.
Metabolite analysis
Liver metabolite analysis was performed by Metabolon, Inc. (Durham, NC, USA) based on ultrahigh‐performance liquid chromatography–tandem mass spectroscopy (UPLC‐MS/MS) and gas chromatography–mass spectroscopy (GC‐MS).
Statistical analysis
Data are expressed as mean ± SEM. The significance of differences was analyzed by Student's t‐test or ANOVA and post hoc analysis for multiple group comparison. When the data were not distributed normally, we used Mann–Whitney rank‐sum test. For microarray data, at each time point of interest, CyberT, a differential analysis program using a Bayesian‐regularized t‐test 68, 69 was performed between experimental group and control group (i.e. HFD versus CC, HF‐R versus CC‐R) and P‐values were calculated. Transcripts/metabolites passing P‐value < 0.05 were considered differential at that time point. Sets of differential transcripts/metabolites from diet or fecal transplantation data were further intersected to produce the list of commonly differential transcripts/metabolites. To cross our data with ChIP‐Seq databases, ChIP‐Seq peaks were extracted from previously published data 42, 43. Genes with peaks that are close to transcription start sites (from 10,000 bp upstream to 2,000 bp downstream) from any of the data sets were considered potential targets.
Gene annotation analysis
Gene annotation was performed using Genecodis 70. Data presented in the manuscript was obtained using KEGG as knowledge base and pathways were ranked by number of genes (hits) with pathway annotations.
Author contributions
MM and PT performed and analyzed all the experiments. YL and PB performed bioinformatics analysis. KE‐M provided HFD samples and data. MM, PT, and PS‐C designed the experiments and wrote the manuscript.
Conflict of interest
The authors declare that they have no conflict of interest.
Supporting information
Expanded View Figures PDF
Table EV1
Table EV2
Review Process File
Source Data for Figure 3
Acknowledgements
We thank members of the Sassone‐Corsi laboratory for constructive comments and Sherry Dilag‐Penilla, Manuela Raffatellu, Stefan Jellbauer, Fei Teng, Christina Klinger, Sara McBride, Taren Thron, and Sarkis Mazmanian. We thank Melanie Oakes, Seung‐Ah Chung, and Valentina Ciobanu at the UCI Genomics High‐Throughput Facility. This work was supported by NIH grant DA036408 and the Institut National de la Sante et de la Recherche Medicale (INSERM, France) (P.S‐C.) and the Mishima Kaiun Memorial Foundation (M.M.). M.M was supported by Sumitomo Life Welfare and Culture Foundation; P. T. is supported by EMBO ALTF 1510‐2012 and Human Frontier Science Program LT 000576/2013.
EMBO Reports (2016) 17: 1292–1303
References
- 1. Bass J, Takahashi JS (2010) Circadian integration of metabolism and energetics. Science 330: 1349–1354 [DOI] [PMC free article] [PubMed] [Google Scholar]
- 2. Eckel‐Mahan K, Sassone‐Corsi P (2013) Metabolism and the circadian clock converge. Physiol Rev 93: 107–135 [DOI] [PMC free article] [PubMed] [Google Scholar]
- 3. Balsalobre A, Damiola F, Schibler U (1998) A serum shock induces circadian gene expression in mammalian tissue culture cells. Cell 93: 929–937 [DOI] [PubMed] [Google Scholar]
- 4. Giebultowicz JM, Stanewsky R, Hall JC, Hege DM (2000) Transplanted Drosophila excretory tubules maintain circadian clock cycling out of phase with the host. Curr Biol 10: 107–110 [DOI] [PubMed] [Google Scholar]
- 5. Krishnan B, Dryer SE, Hardin PE (1999) Circadian rhythms in olfactory responses of Drosophila melanogaster . Nature 400: 375–378 [DOI] [PubMed] [Google Scholar]
- 6. Schibler U, Sassone‐Corsi P (2002) A web of circadian pacemakers. Cell 111: 919–922 [DOI] [PubMed] [Google Scholar]
- 7. Stokkan KA, Yamazaki S, Tei H, Sakaki Y, Menaker M (2001) Entrainment of the circadian clock in the liver by feeding. Science 291: 490–493 [DOI] [PubMed] [Google Scholar]
- 8. Whitmore D, Foulkes NS, Strahle U, Sassone‐Corsi P (1998) Zebrafish clock rhythmic expression reveals independent peripheral circadian oscillators. Nat Neurosci 1: 701–707 [DOI] [PubMed] [Google Scholar]
- 9. Crane BR, Young MW (2014) Interactive features of proteins composing eukaryotic circadian clocks. Annu Rev Biochem 83: 191–219 [DOI] [PubMed] [Google Scholar]
- 10. Dunlap JC (1999) Molecular bases for circadian clocks. Cell 96: 271–290 [DOI] [PubMed] [Google Scholar]
- 11. Mukherji A, Kobiita A, Damara M, Misra N, Meziane H, Champy MF, Chambon P (2015) Shifting eating to the circadian rest phase misaligns the peripheral clocks with the master SCN clock and leads to a metabolic syndrome. Proc Natl Acad Sci USA 112: E6691–E6698 [DOI] [PMC free article] [PubMed] [Google Scholar]
- 12. Marcheva B, Ramsey KM, Buhr ED, Kobayashi Y, Su H, Ko CH, Ivanova G, Omura C, Mo S, Vitaterna MH et al (2010) Disruption of the clock components CLOCK and BMAL1 leads to hypoinsulinaemia and diabetes. Nature 466: 627–631 [DOI] [PMC free article] [PubMed] [Google Scholar]
- 13. Paschos GK, Ibrahim S, Song WL, Kunieda T, Grant G, Reyes TM, Bradfield CA, Vaughan CH, Eiden M, Masoodi M et al (2012) Obesity in mice with adipocyte‐specific deletion of clock component Arntl. Nat Med 18: 1768–1777 [DOI] [PMC free article] [PubMed] [Google Scholar]
- 14. Turek FW, Joshu C, Kohsaka A, Lin E, Ivanova G, McDearmon E, Laposky A, Losee‐Olson S, Easton A, Jensen DR et al (2005) Obesity and metabolic syndrome in circadian Clock mutant mice. Science 308: 1043–1045 [DOI] [PMC free article] [PubMed] [Google Scholar]
- 15. Sahar S, Sassone‐Corsi P (2009) Metabolism and cancer: the circadian clock connection. Nat Rev Cancer 9: 886–896 [DOI] [PubMed] [Google Scholar]
- 16. Asher G, Sassone‐Corsi P (2015) Time for food: the intimate interplay between nutrition, metabolism, and the circadian clock. Cell 161: 84–92 [DOI] [PubMed] [Google Scholar]
- 17. Hatori M, Vollmers C, Zarrinpar A, DiTacchio L, Bushong EA, Gill S, Leblanc M, Chaix A, Joens M, Fitzpatrick JA et al (2012) Time‐restricted feeding without reducing caloric intake prevents metabolic diseases in mice fed a high‐fat diet. Cell Metab 15: 848–860 [DOI] [PMC free article] [PubMed] [Google Scholar]
- 18. Kohsaka A, Laposky AD, Ramsey KM, Estrada C, Joshu C, Kobayashi Y, Turek FW, Bass J (2007) High‐fat diet disrupts behavioral and molecular circadian rhythms in mice. Cell Metab 6: 414–421 [DOI] [PubMed] [Google Scholar]
- 19. Eckel‐Mahan KL, Patel VR, de Mateo S, Orozco‐Solis R, Ceglia NJ, Sahar S, Dilag‐Penilla SA, Dyar KA, Baldi P, Sassone‐Corsi P (2013) Reprogramming of the circadian clock by nutritional challenge. Cell 155: 1464–1478 [DOI] [PMC free article] [PubMed] [Google Scholar]
- 20. Turnbaugh PJ, Ridaura VK, Faith JJ, Rey FE, Knight R, Gordon JI (2009) The effect of diet on the human gut microbiome: a metagenomic analysis in humanized gnotobiotic mice. Sci Transl Med 1: 6ra14 [DOI] [PMC free article] [PubMed] [Google Scholar]
- 21. Carmody RN, Gerber GK, Luevano JM Jr, Gatti DM, Somes L, Svenson KL, Turnbaugh PJ (2015) Diet dominates host genotype in shaping the murine gut microbiota. Cell Host Microbe 17: 72–84 [DOI] [PMC free article] [PubMed] [Google Scholar]
- 22. David LA, Maurice CF, Carmody RN, Gootenberg DB, Button JE, Wolfe BE, Ling AV, Devlin AS, Varma Y, Fischbach MA et al (2014) Diet rapidly and reproducibly alters the human gut microbiome. Nature 505: 559–563 [DOI] [PMC free article] [PubMed] [Google Scholar]
- 23. Wu M, McNulty NP, Rodionov DA, Khoroshkin MS, Griffin NW, Cheng J, Latreille P, Kerstetter RA, Terrapon N, Henrissat B et al (2015) Genetic determinants of in vivo fitness and diet responsiveness in multiple human gut Bacteroides. Science 350: aac5992 [DOI] [PMC free article] [PubMed] [Google Scholar]
- 24. Turnbaugh PJ, Backhed F, Fulton L, Gordon JI (2008) Diet‐induced obesity is linked to marked but reversible alterations in the mouse distal gut microbiome. Cell Host Microbe 3: 213–223 [DOI] [PMC free article] [PubMed] [Google Scholar]
- 25. Leone V, Gibbons SM, Martinez K, Hutchison AL, Huang EY, Cham CM, Pierre JF, Heneghan AF, Nadimpalli A, Hubert N et al (2015) Effects of diurnal variation of gut microbes and high‐fat feeding on host circadian clock function and metabolism. Cell Host Microbe 17: 681–689 [DOI] [PMC free article] [PubMed] [Google Scholar]
- 26. Montagner A, Korecka A, Polizzi A, Lippi Y, Blum Y, Canlet C, Tremblay‐Franco M, Gautier‐Stein A, Burcelin R, Yen YC et al (2016) Hepatic circadian clock oscillators and nuclear receptors integrate microbiome‐derived signals. Sci Rep 6: 20127 [DOI] [PMC free article] [PubMed] [Google Scholar]
- 27. Garidou L, Pomie C, Klopp P, Waget A, Charpentier J, Aloulou M, Giry A, Serino M, Stenman L, Lahtinen S et al (2015) The gut microbiota regulates intestinal CD4 T cells expressing RORgammat and controls metabolic disease. Cell Metab 22: 100–112 [DOI] [PubMed] [Google Scholar]
- 28. Selkrig J, Wong P, Zhang X, Pettersson S (2014) Metabolic tinkering by the gut microbiome: implications for brain development and function. Gut Microbes 5: 369–380 [DOI] [PMC free article] [PubMed] [Google Scholar]
- 29. Sharon G, Garg N, Debelius J, Knight R, Dorrestein PC, Mazmanian SK (2014) Specialized metabolites from the microbiome in health and disease. Cell Metab 20: 719–730 [DOI] [PMC free article] [PubMed] [Google Scholar]
- 30. Ohnmacht C, Park JH, Cording S, Wing JB, Atarashi K, Obata Y, Gaboriau‐Routhiau V, Marques R, Dulauroy S, Fedoseeva M et al (2015) Mucosal Immunology. The microbiota regulates type 2 immunity through RORgammat(+) T cells. Science 349: 989–993 [DOI] [PubMed] [Google Scholar]
- 31. Hildebrandt MA, Hoffmann C, Sherrill‐Mix SA, Keilbaugh SA, Hamady M, Chen YY, Knight R, Ahima RS, Bushman F, Wu GD (2009) High‐fat diet determines the composition of the murine gut microbiome independently of obesity. Gastroenterology 137: 1716–1724.e2 [DOI] [PMC free article] [PubMed] [Google Scholar]
- 32. Zhang H, DiBaise JK, Zuccolo A, Kudrna D, Braidotti M, Yu Y, Parameswaran P, Crowell MD, Wing R, Rittmann BE et al (2009) Human gut microbiota in obesity and after gastric bypass. Proc Natl Acad Sci USA 106: 2365–2370 [DOI] [PMC free article] [PubMed] [Google Scholar]
- 33. Clarke SF, Murphy EF, Nilaweera K, Ross PR, Shanahan F, O'Toole PW, Cotter PD (2012) The gut microbiota and its relationship to diet and obesity: new insights. Gut Microbes 3: 186–202 [DOI] [PMC free article] [PubMed] [Google Scholar]
- 34. Li F, Jiang C, Krausz KW, Li Y, Albert I, Hao H, Fabre KM, Mitchell JB, Patterson AD, Gonzalez FJ (2013) Microbiome remodelling leads to inhibition of intestinal farnesoid X receptor signalling and decreased obesity. Nat Commun 4: 2384 [DOI] [PMC free article] [PubMed] [Google Scholar]
- 35. Sayin SI, Wahlstrom A, Felin J, Jantti S, Marschall HU, Bamberg K, Angelin B, Hyotylainen T, Oresic M, Backhed F (2013) Gut microbiota regulates bile acid metabolism by reducing the levels of tauro‐beta‐muricholic acid, a naturally occurring FXR antagonist. Cell Metab 17: 225–235 [DOI] [PubMed] [Google Scholar]
- 36. Parseus A, Sommer N, Sommer F, Caesar R, Molinaro A, Stahlman M, Greiner TU, Perkins R, Backhed F (2016) Microbiota‐induced obesity requires farnesoid X receptor. Gut doi:10.1136/gutjnl‐2015‐310283 [DOI] [PMC free article] [PubMed] [Google Scholar]
- 37. Reinke H, Asher G (2016) Circadian clock control of liver metabolic functions. Gastroenterology 150: 574–580 [DOI] [PubMed] [Google Scholar]
- 38. Tamaru T, Hirayama J, Isojima Y, Nagai K, Norioka S, Takamatsu K, Sassone‐Corsi P (2009) CK2alpha phosphorylates BMAL1 to regulate the mammalian clock. Nat Struct Mol Biol 16: 446–448 [DOI] [PMC free article] [PubMed] [Google Scholar]
- 39. Sahar S, Zocchi L, Kinoshita C, Borrelli E, Sassone‐Corsi P (2010) Regulation of BMAL1 protein stability and circadian function by GSK3beta‐mediated phosphorylation. PLoS ONE 5: e8561 [DOI] [PMC free article] [PubMed] [Google Scholar]
- 40. Schadinger SE, Bucher NL, Schreiber BM, Farmer SR (2005) PPARgamma2 regulates lipogenesis and lipid accumulation in steatotic hepatocytes. Am J Physiol Endocrinol Metab 288: E1195–E1205 [DOI] [PubMed] [Google Scholar]
- 41. Uno K, Katagiri H, Yamada T, Ishigaki Y, Ogihara T, Imai J, Hasegawa Y, Gao J, Kaneko K, Iwasaki H et al (2006) Neuronal pathway from the liver modulates energy expenditure and systemic insulin sensitivity. Science 312: 1656–1659 [DOI] [PubMed] [Google Scholar]
- 42. Nielsen R, Pedersen TA, Hagenbeek D, Moulos P, Siersbaek R, Megens E, Denissov S, Borgesen M, Francoijs KJ, Mandrup S et al (2008) Genome‐wide profiling of PPARgamma:RXR and RNA polymerase II occupancy reveals temporal activation of distinct metabolic pathways and changes in RXR dimer composition during adipogenesis. Genes Dev 22: 2953–2967 [DOI] [PMC free article] [PubMed] [Google Scholar]
- 43. Siersbaek MS, Loft A, Aagaard MM, Nielsen R, Schmidt SF, Petrovic N, Nedergaard J, Mandrup S (2012) Genome‐wide profiling of peroxisome proliferator‐activated receptor gamma in primary epididymal, inguinal, and brown adipocytes reveals depot‐selective binding correlated with gene expression. Mol Cell Biol 32: 3452–3463 [DOI] [PMC free article] [PubMed] [Google Scholar]
- 44. Kliewer SA, Sundseth SS, Jones SA, Brown PJ, Wisely GB, Koble CS, Devchand P, Wahli W, Willson TM, Lenhard JM et al (1997) Fatty acids and eicosanoids regulate gene expression through direct interactions with peroxisome proliferator‐activated receptors alpha and gamma. Proc Natl Acad Sci USA 94: 4318–4323 [DOI] [PMC free article] [PubMed] [Google Scholar]
- 45. Sauma L, Stenkula KG, Kjolhede P, Stralfors P, Soderstrom M, Nystrom FH (2006) PPAR‐gamma response element activity in intact primary human adipocytes: effects of fatty acids. Nutrition 22: 60–68 [DOI] [PubMed] [Google Scholar]
- 46. Matsusue K, Kusakabe T, Noguchi T, Takiguchi S, Suzuki T, Yamano S, Gonzalez FJ (2008) Hepatic steatosis in leptin‐deficient mice is promoted by the PPARgamma target gene Fsp27. Cell Metab 7: 302–311 [DOI] [PMC free article] [PubMed] [Google Scholar]
- 47. Xu X, Park JG, So JS, Lee AH (2015) Transcriptional activation of Fsp27 by the liver‐enriched transcription factor CREBH promotes lipid droplet growth and hepatic steatosis. Hepatology 61: 857–869 [DOI] [PMC free article] [PubMed] [Google Scholar]
- 48. Moffat C, Bhatia L, Nguyen T, Lynch P, Wang M, Wang D, Ilkayeva OR, Han X, Hirschey MD, Claypool SM et al (2014) Acyl‐CoA thioesterase‐2 facilitates mitochondrial fatty acid oxidation in the liver. J Lipid Res 55: 2458–2470 [DOI] [PMC free article] [PubMed] [Google Scholar]
- 49. Yazdanyar A, Jiang XC (2012) Liver phospholipid transfer protein (PLTP) expression with a PLTP‐null background promotes very low‐density lipoprotein production in mice. Hepatology 56: 576–584 [DOI] [PMC free article] [PubMed] [Google Scholar]
- 50. Leesnitzer LM, Parks DJ, Bledsoe RK, Cobb JE, Collins JL, Consler TG, Davis RG, Hull‐Ryde EA, Lenhard JM, Patel L et al (2002) Functional consequences of cysteine modification in the ligand binding sites of peroxisome proliferator activated receptors by GW9662. Biochemistry 41: 6640–6650 [DOI] [PubMed] [Google Scholar]
- 51. Rakoff‐Nahoum S, Paglino J, Eslami‐Varzaneh F, Edberg S, Medzhitov R (2004) Recognition of commensal microflora by toll‐like receptors is required for intestinal homeostasis. Cell 118: 229–241 [DOI] [PubMed] [Google Scholar]
- 52. Mukherji A, Kobiita A, Ye T, Chambon P (2013) Homeostasis in intestinal epithelium is orchestrated by the circadian clock and microbiota cues transduced by TLRs. Cell 153: 812–827 [DOI] [PubMed] [Google Scholar]
- 53. Thaiss CA, Zeevi D, Levy M, Zilberman‐Schapira G, Suez J, Tengeler AC, Abramson L, Katz MN, Korem T, Zmora N et al (2014) Transkingdom control of microbiota diurnal oscillations promotes metabolic homeostasis. Cell 159: 514–529 [DOI] [PubMed] [Google Scholar]
- 54. Voigt RM, Forsyth CB, Green SJ, Mutlu E, Engen P, Vitaterna MH, Turek FW, Keshavarzian A (2014) Circadian disorganization alters intestinal microbiota. PLoS ONE 9: e97500 [DOI] [PMC free article] [PubMed] [Google Scholar]
- 55. Zarrinpar A, Chaix A, Yooseph S, Panda S (2014) Diet and feeding pattern affect the diurnal dynamics of the gut microbiome. Cell Metab 20: 1006–1017 [DOI] [PMC free article] [PubMed] [Google Scholar]
- 56. Yang X, Downes M, Yu RT, Bookout AL, He W, Straume M, Mangelsdorf DJ, Evans RM (2006) Nuclear receptor expression links the circadian clock to metabolism. Cell 126: 801–810 [DOI] [PubMed] [Google Scholar]
- 57. Eckel‐Mahan KL, Patel VR, Mohney RP, Vignola KS, Baldi P, Sassone‐Corsi P (2012) Coordination of the transcriptome and metabolome by the circadian clock. Proc Natl Acad Sci USA 109: 5541–5546 [DOI] [PMC free article] [PubMed] [Google Scholar]
- 58. Sahar S, Sassone‐Corsi P (2012) Regulation of metabolism: the circadian clock dictates the time. Trends Endocrinol Metab 23: 1–8 [DOI] [PMC free article] [PubMed] [Google Scholar]
- 59. Tontonoz P, Spiegelman BM (2008) Fat and beyond: the diverse biology of PPARgamma. Annu Rev Biochem 77: 289–312 [DOI] [PubMed] [Google Scholar]
- 60. Green CB, Douris N, Kojima S, Strayer CA, Fogerty J, Lourim D, Keller SR, Besharse JC (2007) Loss of Nocturnin, a circadian deadenylase, confers resistance to hepatic steatosis and diet‐induced obesity. Proc Natl Acad Sci USA 104: 9888–9893 [DOI] [PMC free article] [PubMed] [Google Scholar]
- 61. Grimaldi B, Bellet MM, Katada S, Astarita G, Hirayama J, Amin RH, Granneman JG, Piomelli D, Leff T, Sassone‐Corsi P (2010) PER2 controls lipid metabolism by direct regulation of PPARgamma. Cell Metab 12: 509–520 [DOI] [PMC free article] [PubMed] [Google Scholar]
- 62. Kawai M, Rosen CJ (2010) PPARgamma: a circadian transcription factor in adipogenesis and osteogenesis. Nat Rev Endocrinol 6: 629–636 [DOI] [PMC free article] [PubMed] [Google Scholar]
- 63. Backhed F, Ding H, Wang T, Hooper LV, Koh GY, Nagy A, Semenkovich CF, Gordon JI (2004) The gut microbiota as an environmental factor that regulates fat storage. Proc Natl Acad Sci USA 101: 15718–15723 [DOI] [PMC free article] [PubMed] [Google Scholar]
- 64. Singh V, Chassaing B, Zhang L, San Yeoh B, Xiao X, Kumar M, Baker MT, Cai J, Walker R, Borkowski K et al (2015) Microbiota‐dependent hepatic lipogenesis mediated by stearoyl CoA desaturase 1 (SCD1) promotes metabolic syndrome in TLR5‐deficient mice. Cell Metab 22: 983–996 [DOI] [PMC free article] [PubMed] [Google Scholar]
- 65. den Besten G, Lange K, Havinga R, van Dijk TH, Gerding A, van Eunen K, Muller M, Groen AK, Hooiveld GJ, Bakker BM et al (2013) Gut‐derived short‐chain fatty acids are vividly assimilated into host carbohydrates and lipids. Am J Physiol Gastrointest Liver Physiol 305: G900–G910 [DOI] [PubMed] [Google Scholar]
- 66. den Besten G, Bleeker A, Gerding A, van Eunen K, Havinga R, van Dijk TH, Oosterveer MH, Jonker JW, Groen AK, Reijngoud DJ et al (2015) Short‐chain fatty acids protect against high‐fat diet‐induced obesity via a PPARgamma‐dependent switch from lipogenesis to fat oxidation. Diabetes 64: 2398–2408 [DOI] [PubMed] [Google Scholar]
- 67. Luo Y, Chen GL, Hannemann N, Ipseiz N, Kronke G, Bauerle T, Munos L, Wirtz S, Schett G, Bozec A (2015) Microbiota from obese mice regulate hematopoietic stem cell differentiation by altering the bone niche. Cell Metab 22: 886–894 [DOI] [PubMed] [Google Scholar]
- 68. Baldi P, Long AD (2001) A Bayesian framework for the analysis of microarray expression data: regularized t‐test and statistical inferences of gene changes. Bioinformatics 17: 509–519 [DOI] [PubMed] [Google Scholar]
- 69. Kayala MA, Baldi P (2012) Cyber‐T web server: differential analysis of high‐throughput data. Nucleic Acids Res 40: W553–W559 [DOI] [PMC free article] [PubMed] [Google Scholar]
- 70. Carmona‐Saez P, Chagoyen M, Tirado F, Carazo JM, Pascual‐Montano A (2007) GENECODIS: a web‐based tool for finding significant concurrent annotations in gene lists. Genome Biol 8: R3 [DOI] [PMC free article] [PubMed] [Google Scholar]
Associated Data
This section collects any data citations, data availability statements, or supplementary materials included in this article.
Supplementary Materials
Expanded View Figures PDF
Table EV1
Table EV2
Review Process File
Source Data for Figure 3