Supplemental Digital Content is available in the text
Keywords: cardiovascular risk, diabetes, length of time in the US, obesity
Abstract
Obesity prevalence remains high in the United States (US), and is rising in most other countries. This is a repeated cross-sectional study using a nationally representative sample of the National Health and Nutrition Examination Survey 1999 to 2012. Multivariate logistic regression analyses were separately performed for adults (n = 37,639) and children/adolescents (n = 28,282) to assess the associations between the length of time in the US, and the prevalences of obesity and diabetes. In foreign-born adults, the prevalences of both obesity and diabetes increased with the length of time in the US, and ≥20 years in the US was associated with significantly higher rates of obesity (adjusted odds ratio [aOR] 2.32, 95% confidence interval [CI] 1.22–4.40, P = 0.01) and diabetes (aOR 4.22, 95% CI 1.04–17.08, P = 0.04) compared with <1 year in the US. In children/adolescents, obesity prevalence was significantly higher in those born in the US than those who had been in the US for <1 year (aOR 3.15, 95% CI 1.51–6.56, P = 0.002). When analyzed by year, obesity prevalence was significantly higher in US-born than in foreign-born adults from 1999 to 2012. On the other hand, the gap in obesity prevalence between US-born and foreign-born children/adolescents decreased from 1999 to 2011 due to a rapid increase in obesity prevalence among the foreign-born population, until there was no significant difference in 2011 to 2012. This study revealed that the risks of obesity and diabetes have increased in foreign-born US residents with time living in the US. However, the obesity gap between US-born and foreign-born populations is closing.
1. Introduction
The global prevalence of overweight and obesity has increased markedly over the past three decades, and the incidence continues to accelerate.[1,2] In the United States (US), 16.9% of children and 34.9% of adults were obese in 2011 to 2012, rates higher than most other countries.[1,3] Although the US consists of US-born and foreign-born populations, it remains unclear whether obesity prevalence is different between the US-born and foreign-born populations and how strongly living in the US influences the risks of obesity and diabetes. Thus, the aim of this study was to assess whether the risks of obesity and diabetes increased with the length of time living in the US. Furthermore, we also investigated trends of obesity prevalence by birthplace from 1999 to 2012.
2. Methods
2.1. Data sources and study population
This is a cross-sectional study using data from the National Health and Nutrition Examination Survey (NHANES).[4] The NHANES is a program of studies designed to assess the health and nutritional status of adults and children in the US. Written informed consent was obtained from all participants. The National Center for Health Statistics (NCHS) Research Ethics Review Board approved the NHANES protocols.[5] NHANES is conducted by the NCHS at the Centers for Disease Control and Prevention (CDC). It uses a stratified, multistage probability sampling design to obtain a representative sample of the US civilian noninstitutionalized population.[4] Data are collected at homes and mobile examination centers (MECs). Blood specimens are collected during the MEC examination. Among those asked to participate in the NHANES survey during the 1999 to 2012 period, the unweighted response rate for household interviews was 79.5% and that for MEC examinations was 76.0%.[6] We focused on participants ≥2 years of age who were born and citizens in the US (n = 54,073) and who were born outside the US (n = 12,280). Length of time in the US among foreign-born participants was confirmed by trained interviewers, and was categorized into 4 groups for the adult participants (less than 1, 1–9, 10–19, and 20 years or more) and 2 groups for the children/adolescents (<1 and ≥1 year). We excluded participants with missing information on the length of time in the US (n = 432), yielding a final sample of 65,921.
2.2. Overweight, obesity, severe obesity, and abdominal obesity
We extracted information on body mass index (BMI, calculated as measured weight in kilograms divided by measured height in meters squared) from MEC measurements in the 1999 to 2012 NHANES survey. In adults (≥20 years old), overweight was defined as BMI 25 to 30 kg/m2, obesity as BMI ≥30 kg/m2, and severe obesity as BMI ≥35 kg/m2.[3] In children and adolescents (2–19 years old), overweight, obesity, and severe obesity were defined using the 2000 CDC Growth Chart[7] as follows: overweight as BMI in the 85th to 95th percentile, obesity as BMI ≥95th percentile, and severe obesity as BMI ≥120% of the 95th percentile or ≥35 kg/m2.[8] Waist circumference was also measured during the MEC examination. Abdominal obesity was defined as a waist circumference ≥102 cm in men and ≥88 cm in women.[9] In addition, we calculated the BMI at age 25 using the self-reported weight at that age and current height measured at the MEC.
2.3. Diabetes, dyslipidemia, and hypertension
Diabetes was defined by 1 of the following: previous diagnosis of diabetes as evidenced by documentation that the participant was taking antidiabetic medications or insulin, glycated hemoglobin ≥6.5%, fasting glucose levels ≥126 mg/dL, or 2-hour glucose ≥200 mg/dL on the oral glucose tolerance test.[10] Dyslipidemia was defined as previous diagnosis of hyperlipidemia, low-density lipoprotein cholesterol ≥160 mg/dL, high-density lipoprotein cholesterol <40 mg/dL, or triglycerides ≥200 mg/dL.[11] Low-density lipoprotein cholesterol was calculated using the Friedewald equation (total cholesterol − high-density lipoprotein cholesterol − triglycerides/5) for participants examined in the morning in the fasting state who had triglyceride levels ≤400 mg/dL (to convert triglycerides to millimoles per liter, multiply by 0.0113).[12] Hypertension was defined as either previous diagnosis of hypertension or taking antihypertensive medications.
2.4. Food intake
We also assessed the total daily energy and nutrient intakes of US-born and foreign-born adults. The publicly available NHANES 1999 to 2002 dataset includes only 1-day dietary information, so we used diet information from the NHANES 2003 to 2012 for daily estimates. Participants were eligible for two, 24-hour dietary recall interviews. The dietary intake data were used to estimate the type and amount of foods and beverages consumed during the previous 24 h, and the daily total energy and nutrient intakes. The first dietary recall interview was conducted in person during the MEC examination and the second over the telephone 3 to 10 days later by trained interviewers. Averages of the first and second interviews were used as estimated daily intakes for each participant. The dietary interview component was conducted as a partnership between the US Department of Agriculture (USDA) and the US Department of Health and Human Services (DHHS). Interview data files were sent electronically from the field and were imported into Survey Net, a computer-assisted food coding and data management system developed by the USDA.[13] The USDA dietary data collection instrument, Automated Multiple-Pass Method (AMPM),[14] was designed to provide an efficient and accurate means of collecting intake values for large-scale national surveys.
2.5. Statistical analysis
All statistical analyses were conducted using Stata software (version 11.1, Stata Corp, College Station, TX), accounting for the complex survey design. We used an appropriate weight for each analysis selected, based on the variables included in the analysis. These weights accounted for unequal probabilities of selection and nonresponses to make unbiased national estimates. Demographic variables and the proportions in each body weight category (“overweight or more” including overweight and obesity, “obesity,” and “severe obesity”) were compared between US-born and foreign-born participants subgrouped according to age (adult or child/adolescent) and years living in the US. Demographic statistics are presented as a number, percent of total, or mean (standard deviation). Continuous variables were compared using t tests and categorical variables using chi-square tests.
To assess the associations between length of time in the US and body weight (overweight or more, obesity, severe obesity, abdominal obesity), multivariate logistic regression analyses were performed for adults, as compared with foreign-born adults who had been in the US for less than 1 year. We performed the same analyses to assess whether duration of time living in the US was associated with weight status in children/adolescents. In addition, we assessed the association between length of time in the US and the obesity-related comorbidities such as diabetes, dyslipidemia, and hypertension. For analysis of adults, we extracted data on potential confounders (age, sex, race and ethnicity, smoking status, alcohol consumption, educational attainment, annual household income, and presence of health insurance) for adjustment. For analysis of children/adolescents, we included age, sex, race and ethnicity, annual household income, and health insurance for adjustment. We categorized age into 3 groups for both adults (20–39 years, 40–59 years, and 60 years or older) and children/adolescents (2–5 years, 5–11 years, and 12–19 years).[15,16] Race/ethnicity was classified as non-Hispanic white, non-Hispanic black, Mexican American, and “Others,” which included other Hispanics, non-Hispanic Asian, and multiracial participants. Additionally, we performed sensitivity analyses using a narrower age categorization of 5-year spans for adults and 1-year spans for children/adolescents. Moreover, we also analyzed data separately for each race/ethnicity. Participants were also divided into 3 groups for alcohol drinking according to average alcoholic drinks per day: 1 or less, 2 to 4, and 5 or more. We classified educational attainment as more than high school, high school graduation or General Education Development (GED) certificate, or less than high school. Annual household income (in dollars) was divided into less than 20,000, 20,000 to 74,999, and 75,000 or more. Health insurance was confirmed by the questionnaire, and we categorized study participants as insured or uninsured.
We performed multiple regression analyses to evaluate whether total daily energy intake and intake of carbohydrate, sugar, protein, and fat differed between US-born and foreign-born participants. P values <0.05 were considered statistically significant for all tests.
3. Results
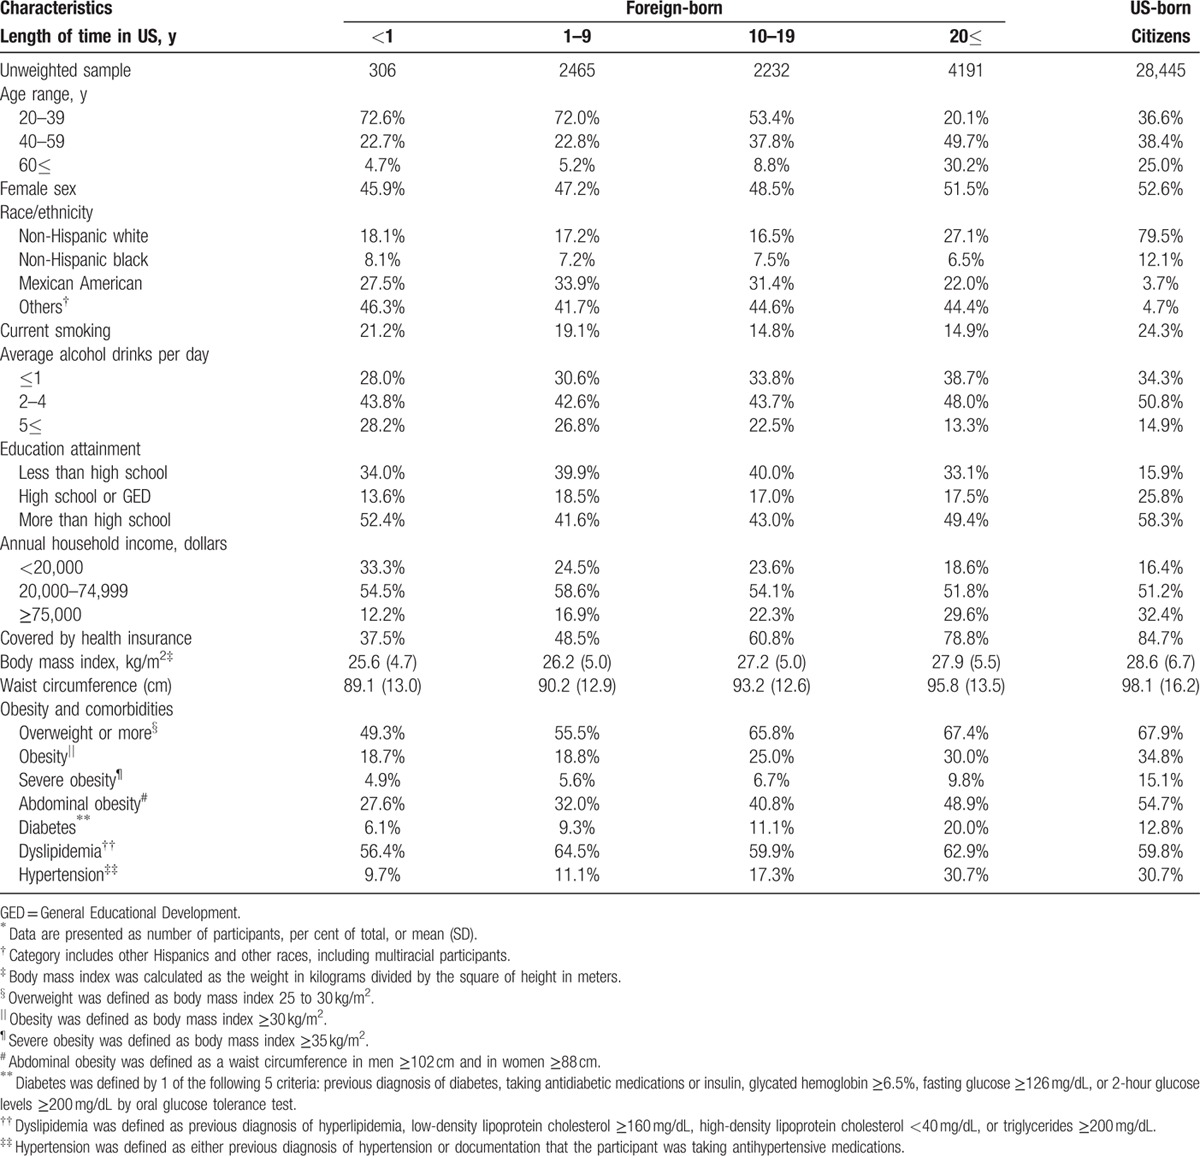
The characteristics of the adult participants (≥20 years) in the NHANES are presented in Table 1. Of the total, 9194 (24.4%) were foreign-born and 28,445 (75.6%) were US-born. About 80% of the US-born adults were non-Hispanic white, whereas the foreign-born participants included a lower proportion of non-Hispanic whites. About 35% of foreign-born adults did not graduate from high school, compared with only 15% of US-born adults. The proportion of annual household incomes >75,000 dollars was lowest in the foreign-born group who had been in the US for less than 1 year (12.2% vs 32.4% of US-born adults). BMI and waist circumference increased with residency time in the foreign-born adults. Prevalences of overweight, obesity, severe obesity, and abdominal obesity were lowest in the adults who had been in the US for less than 1 year and highest in US-born adults (overweight or more: 49.3% vs 67.9%, obesity: 18.7% vs 34.8%, severe obesity: 4.9% vs 15.1%, abdominal obesity: 27.6% vs 54.7%). In addition, prevalences of diabetes, dyslipidemia, and hypertension were also lowest in adults who had been in the US for less than 1 year and highest in those who were not US-born, but had been in the US for more than 20 years (diabetes: 6.1% vs 20.0%, dyslipidemia: 56.4% vs 62.9%, hypertension: 9.7% vs 30.7%).
Table 1.
Characteristics of US-born and foreign-born adult participants∗.
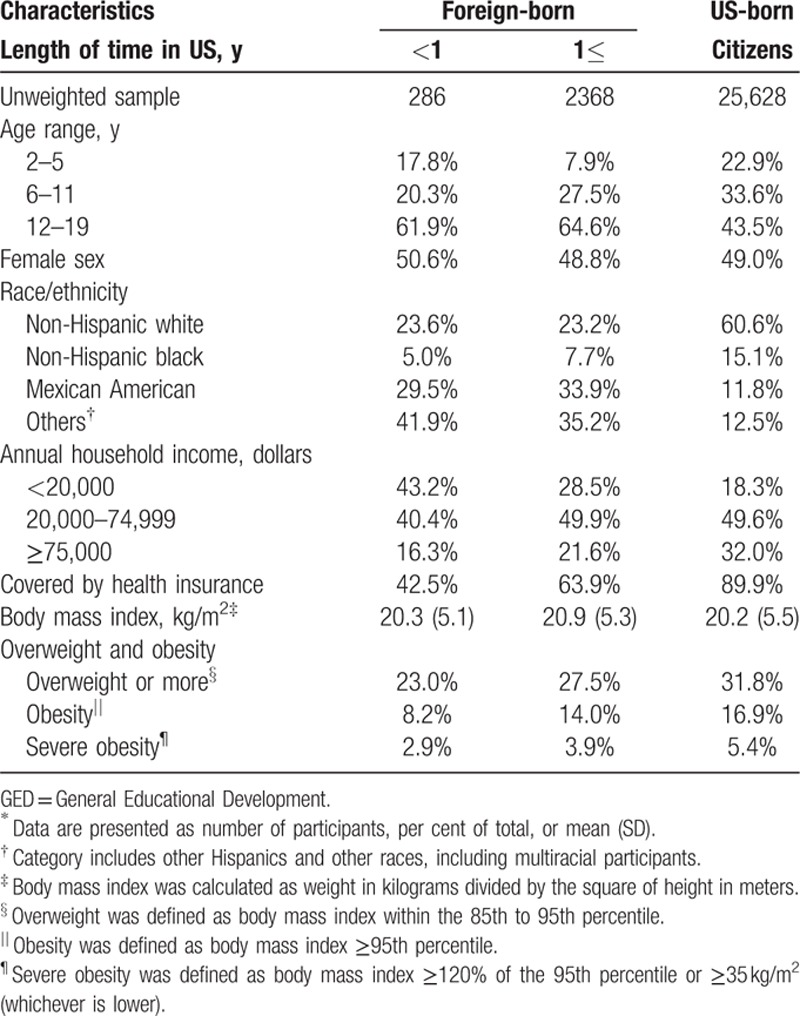
The characteristics of children and adolescents aged 2 to 19 years are presented in Table 2. Of the total, 2654 (9.4%) were foreign-born and 25,628 (90.6%) were US-born. Prevalences of overweight or more, obesity, and severe obesity were lowest in the children/adolescents who had been in the US for less than 1 year, and highest in those born in the US (overweight or more: 23% vs 31.8%, obesity: 8.2% vs16.9%, severe obesity: 2.9% vs 5.4%).
Table 2.
Characteristics of US-born and foreign-born child/adolescent participants∗.
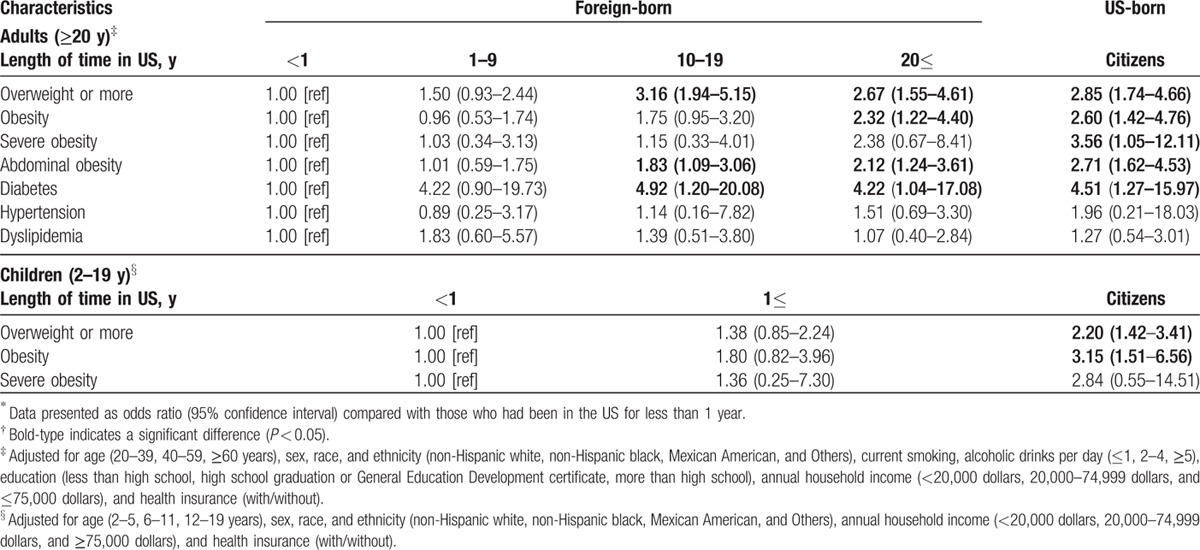
Adjusted associations between length of time in the US and obesity and obesity-related complications are presented in Table 3. Compared with adults who had been in the US for less than 1 year, adjusted odds ratios (aORs) for overweight or more, obesity, severe obesity, and abdominal obesity increased with length of time in the US. Among foreign-born adults, 10 years or more in the US was associated with significantly higher prevalences of overweight and abdominal obesity, whereas both 20 years or more in the US (aOR 2.32, 95% confidence interval [CI] 1.22–4.40, P = 0.01) and birth in the US (aOR 2.60, 95% CI 1.42–4.76, P = 0.002) were associated with a significantly higher prevalence of obesity. Prevalence of diabetes was significantly higher in adults who had been in the US for 10 years or more compared with those who had been in the US for less than 1 year, whereas rates of dyslipidemia and hypertension were not significantly associated with length of time in the US. In children/adolescents, aORs for overweight or more, obesity, and severe obesity were higher in those who had been in the US for ≥1 year than those who had been in the US for <1 year. In addition, prevalences of overweight or more and obesity were significantly higher in US-born children/adolescents than those who had been in the US for <1 year (overweight or more: aOR 2.20, 95% CI 1.42–3.41, P < 0.001; obesity: aOR 3.15, 95% CI 1.51–6.56, P = 0.002). These results did not change using a narrower age categorization of 5-year spans for adults and 1-year spans for children/adolescents (Supplemental Table 1).
Table 3.
Adjusted associations between length of time in the US and obesity and obesity-related complications∗,†.
Adjusted associations of overweight or more, obesity, and severe obesity in US-born participants compared with those not born in the US are shown in Table 4. In the total adult population, prevalences of overweight or more, obesity, severe obesity, and abdominal obesity were significantly higher in those born in the US than those not born in the US. Similarly, prevalences of obesity were higher in US-born Mexican American, non-Hispanic White, non-Hispanic Black, and other race/ethnicity participants than the corresponding foreign-born populations. In addition, prevalences of overweight or more and severe obesity were significantly higher in US-born than foreign-born participants at age 25 years.
Table 4.
Adjusted associations for overweight, obesity, and severe obesity in US-born compared with foreign-born participants in the US∗,†.
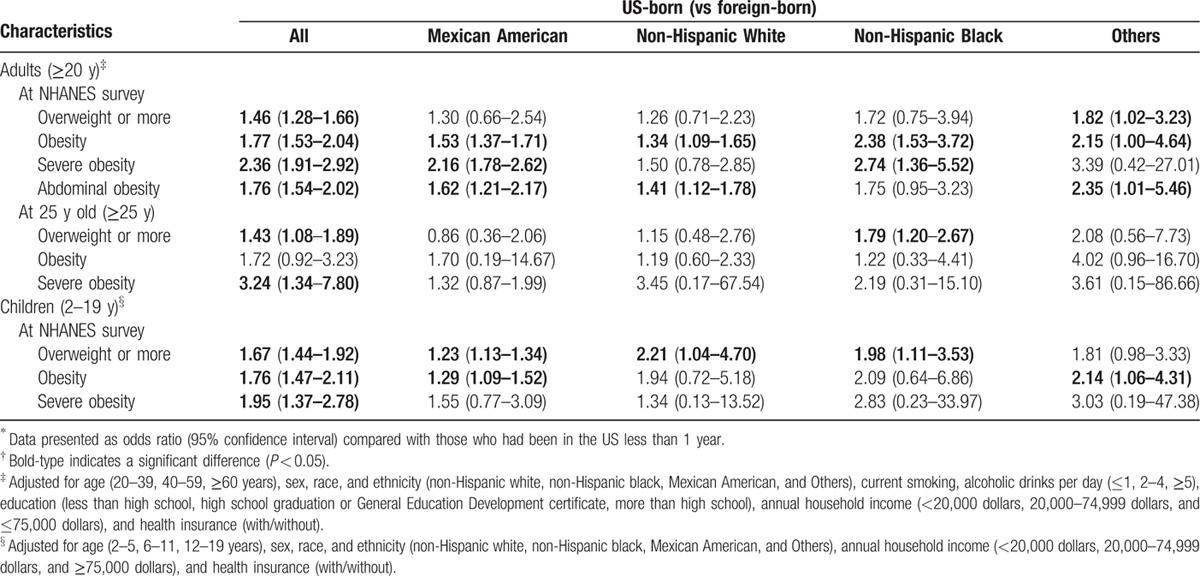
In children/adolescents, prevalences of overweight or more, obesity, and severe obesity were significantly higher in the US-born participants. Moreover, overweight prevalences were significantly higher in US-born Mexican American, non-Hispanic White, and non-Hispanic Black children/adolescents than in the corresponding foreign-born populations. These results were not changed even when we used a narrower age categorization of 5-year spans for adults and 1-year spans for children/adolescents (Supplemental Table 2).
Intakes of total daily energy and nutrients in US-born and foreign-born adults are presented in Table 5. Total daily intakes of carbohydrate and protein did not differ significantly between groups, but total daily energy, sugar, and fat intakes were significantly higher in US-born adults than foreign-born adults.
Table 5.
Total daily energy and nutrient intakes by adult participants∗.

Trends of crude prevalences of obesity and severe obesity from 1999 to 2012 are presented in Fig. 1. The trend in obesity prevalence for foreign-born adults was similar to that of US-born adults from 1999 to 2012 (Fig. 1A). Obesity prevalence was still significantly higher in US-born adults than foreign-born adults in 2011 to 2012 (36.7% vs 27.4%; aOR 1.87, 95% CI 1.33–2.62, P = 0.001). On the contrary, although obesity prevalence in US-born children/adolescents has leveled off in recent years, that in foreign-born children/adolescents has continued to increase (from 8.8% in 1999–2000 to 16.9% in 2011–2012) (Fig. 1B). Compared with foreign-born children/adolescents, US-born children/adolescents demonstrated a significantly higher prevalence of obesity in 1999 to 2000 (aOR 2.36, 95% CI 1.31–4.24, P = 0.007), but the difference was no longer significantly different in 2011 to 2012 (aOR 1.52, 95% CI 0.80–2.88, P = 0.18). Similar trends were observed for severe obesity prevalence in both adults and children/adolescents (Fig. 1C and D). Severe obesity prevalence was significantly higher in US-born than in foreign-born children/adolescents in 1999 to 2000 (4.4% vs 1.4%; aOR 3.61, 95% CI 1.06–12.25, P = 0.04), but was 6.1% in both groups by 2011 to 2012 (aOR 1.15, 95% CI 0.44–3.02, P = 0.75).
Figure 1.
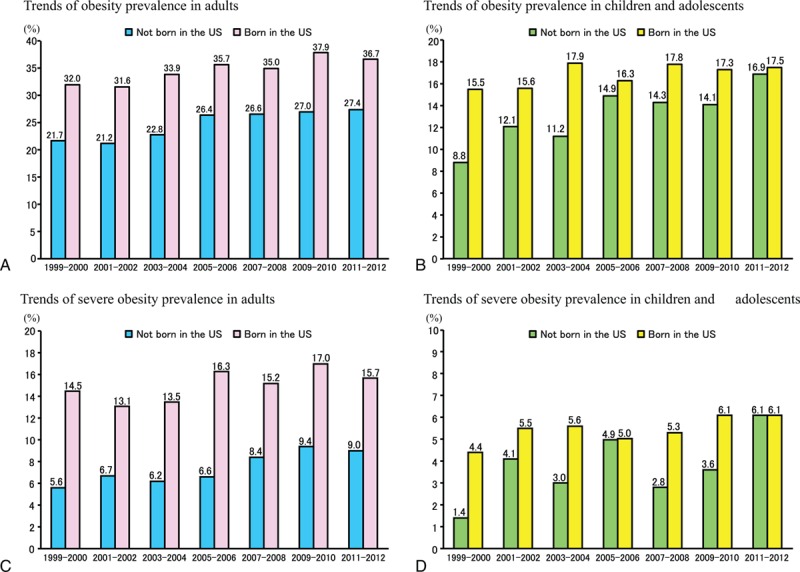
Trends in obesity and severe obesity among US-born and foreign-born participants from 1999 to 2012. Trends in obesity among adults (panel A) and children/adolescents (panel B). Trends in severe obesity among adults (panel C) and children/adolescents (panel D).
4. Discussion
Previous studies have reported associations between length of time in the US and prevalence of obesity in Puerto Rican women,[17] and prevalence of overweight or more (BMI ≥25 kg/m2) in foreign-born populations.[18] However, small sample sizes and the types of data collected limited more detailed analyses. This large-scale study, including nationally representative data from 1999 to 2012, allowed us to analyze the associations between length of time living in the US, and obesity and obesity-related comorbidities. This is, to our knowledge, the first large-scale study to reveal increased risks of obesity and diabetes with length of time in the US. Moreover, progressively increased obesity risk was observed in both adults (≥20 years) and children/adolescents (2–19 years). In the analyses by year, obesity prevalence was consistently higher in US-born adults from 1999 to 2012, but the obesity prevalence gap between US-born and foreign-born children/adolescents decreased over this period due to the rapid increase in obesity prevalence among those not born in the US.
Obesity prevalence in the US remains high, and there were no significant changes among adults between 2003 to 2004 and 2011 to 2012.[3] In addition, obesity prevalence in children and adolescents remains similarly high.[8] The high prevalence of obesity is strongly associated with dietary habits in the US. This study has shown that total daily energy, sugar, and fat intakes were significantly higher in US-born adults than foreign-born adults. Based on these results, the increased risk of obesity with length of time in the US may be due to that total daily energy, sugar, and fat intakes in foreign-born population increase with length of time in the US. Additionally, because the increased risk of obesity was observed in different age groups, the obesogenic environment in the US may be a problem in every generation. Although mean energy intake and consumption of sugar-sweetened beverages and added sugars have decreased in the US over the past few years,[15,19,20] energy intake and consumption of sugar and fat may still be excessive in the US. In addition, the high prevalence of obesity in US adults over the past several decades may be partially attributed to the increase of no leisure-time physical activity,[21] as body weight reflects the balance between energy intake and expenditure.[22]
However, a more troubling trend may be the increased prevalences of obesity and severe obesity in foreign-born children/adolescents. Most importantly, the present study revealed that prevalences of obesity and severe obesity in US-born children/adolescents have leveled off and those in foreign-born children/adolescents have continued to increase, and these differences did not significantly differ between US-born and foreign-born children/adolescents in recent years. A possible explanation in this trend is that foreign-born children/adolescents may be more susceptible to the recent obesogenic environment in the US than US-born children/adolescents. Additionally, the results may reflect a global problem, because the prevalences of obesity and severe obesity among children/adolescents are increasing worldwide.[1] In either case, further antiobesity initiatives may be essential for foreign-born children/adolescents in the US.
This study has several limitations. First, the NHANES surveys do not follow a cohort of participants prospectively, so any proposed causal associations with length of time in the US must be interpreted with caution. However, our results are derived from a large nationally representative sample of the US population, with various subgroup analyses among generations and races/ethnicities. Second, we could not investigate the association between length of time in the US and physical activity. Regarding physical activity, NHANES measured it; however, the contents of activity changed between 2005 to 2006 and 2007 to 2008. Therefore, we did not include it in the analyses. However, physical activity in the US is still low,[23] and the proportion of individuals employed in occupations that require moderate to intense physical activity is progressively decreasing.[24] Third, “Others” in the race/ethnicity could not be classified in more detail. However, additional analyses for each race/ethnicity showed that obesity prevalence was higher in each race/ethnicity group than the corresponding foreign-born populations. Based on these results, the risk of obesity and diabetes may increase with the length of time living in the US, regardless of race/ethnicity.
In conclusion, this study revealed that the risks of obesity and diabetes have increased in foreign-born US residents with time living in the US. However, the obesity gap between US-born and foreign-born populations is closing.
Supplementary Material
Footnotes
Abbreviations: AMPM = automated multiple-pass method, BMI = body mass index, CDC = Centers for Disease Control and Prevention, DHHS = Department of Health and Human Services, GED = General Education Development, MEC = mobile examination centers, NCHS = National Center for Health Statistics, NHANES = National Health and Nutrition Examination Survey, USDA = US Department of Agriculture.
Authors’ contributions: study concept and design: TT; acquisition of data: TT and TS; analysis and interpretation of data: TT and TS; drafting of the manuscript: TT, HK, and TS; statistical analysis: TT and TS.
Funding: This research received the Grant of National Center for Global Health and Medicine.
Conflicts of interest: All authors have completed and submitted the ICMJE Form for Disclosure of Potential Conflicts of Interest. No financial disclosures were reported.
There are no conflicts of interest to disclose with regard to the publication of this manuscript. None of the authors has any financial interest related to this manuscript.
Ethics approval: The National Center for Health Statistics (NCHS) Research Ethics Review Board approved the National Health and Nutrition Examination Survey (NHANES) protocols.
Supplemental Digital Content is available for this article.
References
- 1.Ng M, Fleming T, Robinson M, et al. Global, regional, and national prevalence of overweight and obesity in children and adults during 1980–2013: a systematic analysis for the Global Burden of Disease Study 2013. Lancet 2014; 384:766–781. [DOI] [PMC free article] [PubMed] [Google Scholar]
- 2.Stevens GA, Singh GM, Lu Y, et al. National, regional, and global trends in adult overweight and obesity prevalences. Popul Health Metr 2012; 10:22. [DOI] [PMC free article] [PubMed] [Google Scholar]
- 3.Ogden CL, Carroll MD, Kit BK, et al. Prevalence of childhood and adult obesity in the United States, 2011-2012. JAMA 2014; 311:806–814. [DOI] [PMC free article] [PubMed] [Google Scholar]
- 4.Centers for Disease Control and Prevention. National Health and Nutrition Examination Survey. Available at: http://www.cdc.gov/nchs/nhanes.htm Accessed March 30, 2015. [Google Scholar]
- 5.Centers for Disease Control and Prevention. NCHS Research Ethics Review Board (ERB) Approval. Available at: http://www.cdc.gov/nchs/nhanes/irba98.htm Accessed March 30, 2015. [Google Scholar]
- 6.Centers for Disease Control and Prevention. NHANES Response Rates and CPS Totals. Available at: http://www.cdc.gov/nchs/nhanes/response_rates_cps.htm Accessed March 30, 2015. [Google Scholar]
- 7.Zoungas S, Chalmers J, Neal B, et al. Follow-up of blood-pressure lowering and glucose control in type 2 diabetes. N Engl J Med 2014; 371:1392–1406. [DOI] [PubMed] [Google Scholar]
- 8.Skinner AC, Skelton JA. Prevalence and trends in obesity and severe obesity among children in the United States, 1999–2012. JAMA Pediatr 2014; 168:561–566. [DOI] [PubMed] [Google Scholar]
- 9.Grundy SM, Cleeman JI, Daniels SR, et al. Diagnosis and management of the metabolic syndrome: an American Heart Association/National Heart, Lung, and Blood Institute Scientific Statement. Circulation 2005; 112:2735–2752. [DOI] [PubMed] [Google Scholar]
- 10.American Diabetes A. Standards of medical care in diabetes: 2014. Diabetes Care 2014; 37 suppl 1:S14–S80. [DOI] [PubMed] [Google Scholar]
- 11.National Cholesterol Education Program Expert Panel on Detection E, Treatment of High Blood Cholesterol in A. Third Report of the National Cholesterol Education Program (NCEP) Expert Panel on Detection, Evaluation, and Treatment of High Blood Cholesterol in Adults (Adult Treatment Panel III) final report. Circulation 2002; 106:3143–3421. [PubMed] [Google Scholar]
- 12.Fukuyama N, Homma K, Wakana N, et al. Validation of the Friedewald equation for evaluation of plasma LDL-cholesterol. J Clin Biochem Nutr 2008; 43:1–5. [DOI] [PMC free article] [PubMed] [Google Scholar]
- 13.Raper N, Perloff B, Ingwersen L, et al. An overview of USDA's dietary intake data system. J Food Compos Anal 2004; 17:545–555. [Google Scholar]
- 14.Agricultural Research Service, United States Department of Agriculture. USDA Automated Multiple-Pass Method. Available at: http://www.ars.usda.gov/Services/docs.htm?docid=7710 Accessed March 30, 2015. [Google Scholar]
- 15.Kit BK, Fakhouri TH, Park S, et al. Trends in sugar-sweetened beverage consumption among youth and adults in the United States: 1999–2010. Am J Clin Nutr 2013; 98:180–188. [DOI] [PMC free article] [PubMed] [Google Scholar]
- 16.Curtin LR, Mohadjer LK, Dohrmann SM, et al. The National Health and Nutrition Examination Survey: Sample Design, 1999–2006. Vital Health Stat 2 2012; May:1–39. [PubMed] [Google Scholar]
- 17.Himmelgreen DA, Perez-Escamilla R, Martinez D, et al. The longer you stay, the bigger you get: length of time and language use in the U.S. are associated with obesity in Puerto Rican women. Am J Phys Anthropol 2004; 125:90–96. [DOI] [PubMed] [Google Scholar]
- 18.Koya DL, Egede LE. Association between length of residence and cardiovascular disease risk factors among an ethnically diverse group of United States immigrants. J Gen Intern Med 2007; 22:841–846. [DOI] [PMC free article] [PubMed] [Google Scholar]
- 19.Ford ES, Dietz WH. Trends in energy intake among adults in the United States: findings from NHANES. Am J Clin Nutr 2013; 97:848–853. [DOI] [PMC free article] [PubMed] [Google Scholar]
- 20.Welsh JA, Sharma AJ, Grellinger L, et al. Consumption of added sugars is decreasing in the United States. Am J Clin Nutr 2011; 94:726–734. [DOI] [PMC free article] [PubMed] [Google Scholar]
- 21.Ladabaum U, Mannalithara A, Myer PA, et al. Obesity, abdominal obesity, physical activity, and caloric intake in US adults: 1988 to 2010. Am J Med 2014; 127:717–727.e712. [DOI] [PMC free article] [PubMed] [Google Scholar]
- 22.Mozaffarian D, Hao T, Rimm EB, et al. Changes in diet and lifestyle and long-term weight gain in women and men. N Engl J Med 2011; 364:2392–2404. [DOI] [PMC free article] [PubMed] [Google Scholar]
- 23.Hallal PC, Andersen LB, Bull FC, et al. Global physical activity levels: surveillance progress, pitfalls, and prospects. Lancet 2012; 380:247–257. [DOI] [PubMed] [Google Scholar]
- 24.Church TS, Thomas DM, Tudor-Locke C, et al. Trends over 5 decades in U.S. occupation-related physical activity and their associations with obesity. PLoS One 2011; 6:e19657. [DOI] [PMC free article] [PubMed] [Google Scholar]
Associated Data
This section collects any data citations, data availability statements, or supplementary materials included in this article.


