

Abstract
Context:
Osteoarthritis (OA) is a common, worldwide disorder. Magnetic resonance (MR) imaging can directly and noninvasively evaluate articular cartilage and has emerged as an essential tool in the study of OA.
Evidence Acquisition:
A PubMed search was performed using the keywords quantitative MRI and cartilage. No limits were set on the range of years searched. Articles were reviewed for relevance with an emphasis on in vivo studies performed at 3 tesla.
Study Design:
Clinical review.
Level of Evidence:
Level 4.
Results:
T2, T2*, T1 (particularly when measured after exogenous contrast administration, such as with the delayed gadolinium-enhanced MR imaging of cartilage [dGEMRIC] technique), and T1ρ are among the most widely utilized quantitative MR imaging techniques to evaluate cartilage and have been implemented in various patient cohorts. Existing challenges include reproducibility of results, insufficient consensus regarding optimal sequences and parameters, and interpretation of values.
Conclusion:
Quantitative assessment of cartilage using MR imaging techniques likely represents the best opportunity to identify early cartilage degeneration and to follow patients after treatment. Despite existing challenges, ongoing work and unique approaches have shown exciting and promising results.
Keywords: quantitative MRI, cartilage, osteoarthritis, parametric mapping
Osteoarthritis (OA) is a common worldwide disorder, with prevalence ranging from 12.3% to 21.6%.53 Impact on the individual is large, but societal impact is staggering, with approximately $185.5 billion in annual insurer expenditures attributable to medical care for patients with OA in the United States alone.28 Productivity losses (indirect costs) are even greater, estimated to be almost twice that of direct health care costs.24 The high costs of OA are typically seen in the setting of advanced, symptomatic disease. For instance, the direct cost of joint replacement procedures alone is between $15 billion and $23 billion annually.24,53 These numbers are expected to increase because of the aging population and an associated increase in the number of revision procedures.
A great deal of research is focused on the goal of detecting preclinical signs of OA, potentially allowing for the implementation of lifestyle, medical, or surgical interventions to prevent the disease from breaching the symptomatic threshold.8 If OA can be detected at an early stage, disease modification therapies may potentially prevent the morbidities and high cost expenditures associated with the end stages of the disease. Since magnetic resonance (MR) imaging is a tool that can directly and noninvasively evaluate articular cartilage, it has emerged as an essential tool in the study of OA. With more advanced MR imaging techniques, evaluation of the efficacy of treatment and comparison between the various therapies is now possible.
MR imaging sequences used to study OA can be divided into 2 categories: morphological and quantitative. Morphological sequences are the mainstay of currently utilized clinical MR imaging protocols.71 With regard to cartilage, assessment using morphological techniques is usually qualitative and focused on the detection of gross cartilage lesions, including fissures or defects, and characterization of advanced, diffuse changes such as thinning or complete loss. Quantitative MR imaging techniques involve MR measurements that are associated with a physical phenomenon, such as alteration or disruption of the extracellular matrix (ECM). The most widely utilized quantitative MR imaging techniques to evaluate cartilage involve measures of proton relaxation, including T2, T2*, T1 (particularly when measured after exogenous contrast administration, such as with the delayed gadolinium-enhanced MR imaging of cartilage [dGEMRIC] technique), and T1ρ. Although several studies have now shown that some of these relaxation parameters are not highly specific to a particular macromolecule, it is still useful to consider them in broad terms of “collagen-sensitive” or “proteoglycan-sensitive” techniques. Many of these quantitative MR imaging measures have shown promise as biomarkers for early joint degeneration. This article provides an overview of these quantitative imaging techniques, including rationale, clinical uses, challenges, and future directions.
Anatomic Considerations
Hyaline articular cartilage provides a low-friction, wear-resistant, force-distributing surface that lines the bones in diarthrodial joints. Of the total weight, approximately three-quarters is water and one-quarter is the ECM, composed of mostly collagen and proteoglycans.57 Approximately 10% to 30% of the wet weight of cartilage is collagen (90%-95% of which is type II) and 3% to 10% is proteoglycans.13,57 Aggrecan is the major proteoglycan in articular cartilage, containing chondroitin sulfate and keratin sulfate glycosaminoglycan (GAG) side chains. The GAG side chains are negatively changed, fixed in the matrix, and attract positive counterions and water molecules.19 A strong electrostatic repulsive force is created, and the swelling pressure of cartilage is the result.6 Articular cartilage demonstrates varying composition and structure depending on depth, with collagen fibrils oriented perpendicularly at the deep zone and parallel at the superficial zone relative to the surface (Figure 1).2 Proteoglycans also demonstrate depth-wise variation, decreasing in concentration toward the surface.49 With degeneration and early osteoarthritic changes, proteoglycans are lost, collagen microstructure is disrupted, and water content is increased.7
Figure 1.
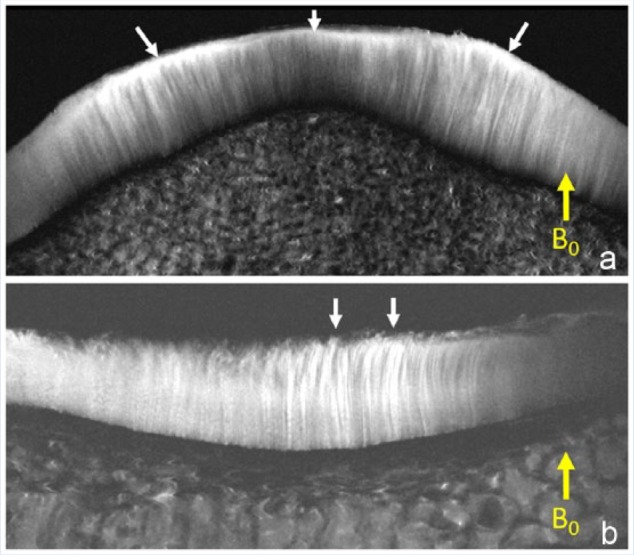
Magnetic resonance (MR) images (11.7 T) with 20-µm in-plane resolution. (A) The patella shows the perpendicular orientation of the deep and intermediate layers of cartilage. Note the high signal intensity superficial layer (arrows), which is due to the magic angle effect as the fibrils parallel the surface. (B) Tibial plateau with chondral fraying shows the orientation change at the superficial layer (arrows).
MR Imaging and Basic Relaxation Theory
In brief, when a patient enters an MR imaging machine, the protons in their body will spin (or resonate) at a particular frequency and tend to align along the main magnetic axis, or z-direction (Figure 2). A net positive magnetization vector is created. External radiofrequency (RF) waves tuned to the resonant frequency are introduced to disturb these protons into the transverse, or x-y, plane and the net transverse magnetization vector is detected using specially positioned coils. As time progresses after the RF pulse delivery, the transverse magnetization will decay and longitudinal magnetization will regrow. T2 and T2* relaxation times are defined as the time required for the transverse magnetization to lose 63% of its original value (Figure 3a), depending on whether a refocusing pulse is used in the acquisition sequence. T1 relaxation time is the time required for longitudinal magnetization to reach 63% of its maximum value (Figure 3b). Pathologic tissues will typically, but not always, show longer T2, T2*, and T1 values compared with healthy tissues.
Figure 2.
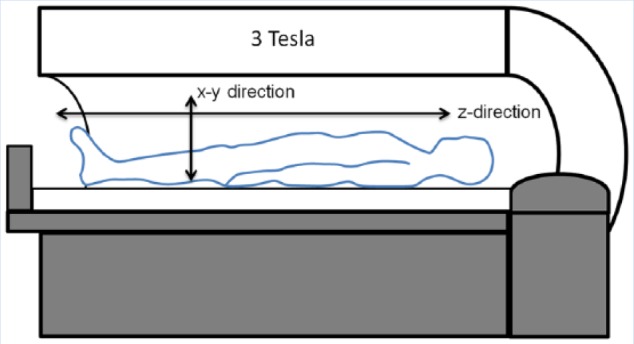
Schematic of a magnetic resonance (MR) imaging machine. When inside the magnet, protons in the patient’s body will tend to align with the main magnetic axis, or z-direction in an exponential manner (characterized by T1). After radiofrequency waves are introduced, there is a net transverse magnetization vector in the x-y direction, which can be detected with specially positioned coils, decreasing in an exponential manner (characterized by T2 or T2*).
Figure 3.

T2 and T1 relaxation. (a) Illustrative magnetization decay curves in the x-y plane (Mxy) for diseased tissue (red curve) compared with normal tissue (black curve), with T2 times defined as the time required for 63% loss of magnetization. (b) Illustrative magnetization growth curve (MZ) for diseased tissue (red curve) compared with normal tissue (black curve), with T1 times defined as the time required for magnetization to reach 63% of its maximum value.
T1ρ is similar in concept to T2 and T2* in that it is a measure of relaxation in the transverse plane; however, it utilizes a unique condition where relaxation occurs in the presence of a continuous RF wave, referred to as the spin-lock (SL) RF pulse. The SL RF pulse is relatively low in frequency and coincides with the frequency of the molecular processes of interest, namely macromolecules such as proteogylcans. Higher T1ρ values have been associated with decreased proteoglycan content in cartilage.
While protons are tiny (10−15 m), the signals coming from them reflect phenomena on a much larger scale, on the order of submicrometer to micrometer sizes (in the range of light microscopic resolution). The differences in proton T2 and T1 relaxation times are used to create contrast between different tissues and disease states on conventional morphological MRI. Individual tissue relaxation times can also be measured by acquiring multiple images with varying user-defined parameters. The signal of each pixel on each individual image is used to fit the relaxation curve, and a visual map is generated. More detailed and technical information on proton relaxation has been published previously.12,16,18 A summary of individual quantitative MR relaxation techniques is provided below (Supplementary Table 1, available online at sph.sagepub.com/supplemental).
Collagen-Sensitive Techniques
T2 and T2* Mapping
Since the earliest days of MR imaging, differences in T2 relaxation have been used to differentiate between normal and abnormal tissues. A large number of publications show that, in cartilage, T2 is sensitive to water content, collagen content, and collagen fibril orientation.30,44,45,75 Most but not all studies have found that T2 is insensitive to change in proteoglycan concentration.46,70 T2* reflects inhomogeneities in the main magnetic field in addition to the variables affecting T2, and thus is always less than or equal to T2. The orientation dependence of T2 and T2* is referred to as the “magic angle effect” and is caused by a quantum mechanical phenomena (changes in dipole-dipole interactions75). These interactions are minimized when tissue fiber orientation approaches 55° relative to the main magnetic field, and the result is that T2 and T2* in collagen-rich tissues will increase as the general orientation approaches 55°. With regard to hyaline articular cartilage, the magic angle effect is most pronounced in the regions of greatest anisotropy, such as the superficial layer (approximately 20% of total depth).5,21,47 Although the interpretation of T2 and T2* values and visual maps are confounded by the magic angle effect, they remain useful in clinical practice.
Several in vivo uses of T2 and T2* maps have shown promise. Kijowski et al26 demonstrated that the addition of T2 mapping to a routine clinical knee MR protocol improved sensitivity in the detection of cartilage lesions in the knee joint from 75% to 89%, with only a small reduction in specificity. The greatest improvement was in the identification of early cartilage degeneration, such as cartilage softening, with sensitivities of 4.2% using the routine MR protocol alone and 62% using the routine MR protocol with T2 maps (P < 0.001).26 Quantitative signal variation (texture) analysis of T2 maps using various algorithms has also shown promise. Normal cartilage demonstrates relatively gradual variation among neighboring pixels, although there is expected depth-wise spatial variation. Alteration of textures has been used to detect differences between control and OA groups and can be used to longitudinally evaluate arthritis progression.9,30 Zhong et al76 found that T2 map signal variation could predict symptomatic knee OA progression in asymptomatic individuals with an overall accuracy rate of 84%. T2 maps have also been used to evaluate cartilage repair tissue.14,40 In particular, longitudinal evaluation can be performed with T2 maps to assess maturation of repair tissue and presence of chondral zonal variation (differences between superficial and deep layers), which is more indicative of hyaline-like cartilage (Figure 4).63
Figure 4.

A 52-year-old woman with International Cartilage Repair Society (ICRS) grade 4 lesions measuring 2.5 × 3.5 cm at the medial femoral condyle and 2.0 × 2.5 cm at the medial tibial plateau who underwent arthroscopic subchondral drilling followed by postoperative intra-articular injections of bone marrow aspirate concentrate, platelet-rich plasma, and hyaluronic acid. (a and d) Coronal and sagittal fluid-sensitive magnetic resonance (MR) images show grade 4 lesions 2 days after surgery. (b and e) Coronal fluid-sensitive and sagittal intermediate-weighted MR images 18 months after surgery show impressive volume of cartilage repair tissue at both sites. (c and f) Coronal and sagittal T2 maps show that the repair tissue does not demonstrate normal stratification expected of hyaline cartilage. Case courtesy of Jeb Broyles, MD (Bone & Joint Clinic of Baton Rouge, Louisiana).
Proteoglycan-Sensitive Techniques
T1 Mapping and dGEMRIC
T1 relaxation has been shown to be sensitive to water content in cartilage.4 Some studies have also shown that T1 is an excellent discriminator between normal and degenerated cartilage in ex vivo specimens, performing better than several other measures including T2.36,39 At this time, however, native unenhanced T1 maps are not typically used in practice. Rather, T1 maps are more often obtained in the setting of exogenously administrated contrast agents as part of the delayed gadolinium-enhanced magnetic resonance imaging of cartilage (dGEMRIC) technique. With the dGEMRIC technique, a double dose of gadolinium diethylenetriamine penta-acetic acid (Gd-DTPA2−) is administered intravenously. Joint range of motion is performed for approximately 10 minutes, during which time there is slow diffusion of contrast agent into the synovial fluid with subsequent penetration and equalization within articular cartilage.3 As described, GAG side chains on proteoglycans are negatively charged and therefore preserved cartilage will repel the anionic molecules whereas GAG-depleted regions will accumulate contrast agent. Imaging is performed after a delay of approximately 90 minutes. Regions of accumulated contrast agent will demonstrate shortened T1 values, with a post-contrast T1 map reflecting quantitative GAG concentration.64 Several validation studies of dGEMRIC have been performed, nearly all showing strong correlation with GAG content.17,51,66
Several in vivo uses of dGEMRIC have shown promise.72 Increased Gd-DTPA2− concentration has been seen in patients with preradiographic degenerative cartilage lesions (Figure 5).60,73 dGEMRIC measures have been shown to correlate with pain and severity of disease in patients with hip dysplasia.27 This technique has also been used to evaluate cartilage in the setting of acute injury.61 In vivo cartilage adaptive responses to exercise can be detected with the dGEMRIC technique.62 dGEMRIC can also be used to evaluate cartilage after therapy, including after intra-articular viscosupplementation67 or cartilage repair tissue after surgery.65,69
Figure 5.

dGEMRIC color overlays representing cartilage glycosaminoglycan (GAG) content. (a) Healthy, nonosteoarthritic knee with preserved GAG content and resultant reference T1 values in the mid to upper range of the scale (green arrows). (b) In a patient with medial compartment pain but without radiographic osteoarthritis (OA), contrast agent accumulates in cartilage resulting in decreased T1 values (red arrows) compared with the healthy control. This is due to decreased GAG content and is consistent with early OA. Case courtesy of Jasper van Tiel, MD, PhD, and Edwin Oei, MD, PhD (Erasmus MC Rotterdam, The Netherlands).
T1ρ Mapping
T1ρ measurements have been shown to be sensitive to changes in proteoglycan content using enzymatically degraded bovine cartilage.1,15 T1ρ has also been shown to be sensitive to early cartilage degeneration in vivo32 (Figure 6) and may be more sensitive than T2 for this purpose.32,55 Similar to T2, quantitative signal variation (texture) analysis of T1ρ maps have shown promise for the detection of early OA in patients. Carballido-Gamio et al10 found that T1ρ discriminated between healthy controls and mild OA cases better than T2 using a specific texture and laminar analysis algorithm. In patients who underwent arthroscopy, Witschey et al74 found that quantitative evaluation of T1ρ relaxation times in regions of interest could detect most cases of cartilage softening and early superficial fibrillation, but all cases qualitatively demonstrated abnormalities on T1ρ maps. T1ρ imaging has also been applied after both microfracture and mosaicplasty and can be used to follow the maturation status of the cartilage repair tissue.22,59
Figure 6.

A 30-year-old woman with anterior knee pain and surgically confirmed chondromalacia involving the entire lateral facet of the patella. (a) T1ρ map shows diffusely abnormal lateral facet, including an area of elevated values at the superior portion of the patella (arrow). (b) On the conventional intermediate-weighted magnetic resonance (MR) image, the superior portion was prospectively interpreted as normal.
Challenges and Future Directions
Although the various MR parametric mapping techniques described above have shown promise for clinical use (Supplementary Table 2, available online at sph.sagepub.com/supplemental), a number of challenges exist. First, biologic tissues are heterogeneous and contain various tissue components. In ex vivo cartilage samples, up to 4 distinct pools of protons, each with their own decay pattern, have been demonstrated.29 Although some of these proton pools may not be detectable in clinical practice, there are circumstances where a biexponential relaxation pattern can be detected and indeed provides a better model for curve fitting.11,37 Preliminary data suggest that identification and separation of individual proton pools provides added information, and some of these measures may be much less sensitive to the confounding magic angle effect.38,54
Reproducibility of relaxation measurements is another challenge. Although high reproducibility can be seen when sequences and parameters are kept constant,25,48 there is significant variation when comparing between different pulse sequences, parameters, and coils used for imaging.43,52 There is little consensus at this time as to which sequence, set of parameters, and post-processing method is optimal. Interpretation of quantitative relaxation values can also be challenging. Normal cartilage can demonstrate artifactual increases or decreases in T2 values due to the confounding magic angle effect. Pathologic cartilage most typically demonstrates increases in T2 values but at times can demonstrate decreased values.41,42 Coupled with the fact that there is typically a narrow range of quantitative MR parameters over clinical populations, it becomes apparent that there is much parameter value overlap between controls versus OA patients.58 Promising approaches to overcome these limitations include using a multiparametric approach34,35 and analysis of spatial variation (texture analysis).33,56
Improvements in speed of quantitative mapping techniques must also occur prior to widespread clinical acceptance. Of the above described mapping techniques, total time of examination is a major barrier for the acceptance of the dGEMRIC technique. For the remaining techniques, advances in accelerated imaging techniques have been successfully implemented, and T1 and T2 maps have been generated in approximately 1 minute.23,31 Finally, multiple less widely available techniques are also being evaluated in the rapidly developing field of MR biomarkers. Many of these have shown promise in preliminary studies including sodium,50 magnetization transfer (such as chemical exchange saturation transfer68), and diffusion20 techniques.
Conclusion
Quantitative assessment of cartilage using noninvasive MR imaging techniques likely represents the best opportunity to identify early cartilage degeneration and to follow patients after treatment. However, at present, there is no single MR biomarker that is both widely available and accepted for these purposes. Continuing efforts to further refine existing techniques, develop emerging techniques, and improve analysis have shown exciting and promising results. The combination of vendor incorporation of faster sequences into clinically available packages, standardization, and validation will lead to increasing acceptance and utilization by the community.
Supplementary Material
Acknowledgments
The authors acknowledge support from the VA Clinical Science Research and Development Service (IK2CX000749 and I01CX001388) and the National Institutes of Health (R01AR062581 and R01AR068987).
Footnotes
The authors report no potential conflicts of interest in the development and publication of this article.
References
- 1. Akella SV, Regatte RR, Gougoutas AJ, et al. Proteoglycan-induced changes in T1ρ-relaxation of articular cartilage at 4T. Magn Reson Med. 2001;46:419-423. [DOI] [PubMed] [Google Scholar]
- 2. Aspden RM, Hukins DW. Collagen organization in articular cartilage, determined by X-ray diffraction, and its relationship to tissue function. Proc R Soc Lond B Biol Sci. 1981;212:299-304. [DOI] [PubMed] [Google Scholar]
- 3. Bashir A, Gray ML, Burstein D. Gd-DTPA2- as a measure of cartilage degradation. Magn Reson Med. 1996;36:665-673. [DOI] [PubMed] [Google Scholar]
- 4. Berberat JE, Nissi MJ, Jurvelin JS, Nieminen MT. Assessment of interstitial water content of articular cartilage with T1 relaxation. Magn Reson Imaging. 2009;27:727-732. [DOI] [PubMed] [Google Scholar]
- 5. Bittersohl B, Hosalkar HS, Sondern M, et al. Spectrum of T2* values in knee joint cartilage at 3 T: a cross-sectional analysis in asymptomatic young adult volunteers. Skeletal Radiol. 2014;43:443-452. [DOI] [PubMed] [Google Scholar]
- 6. Borthakur A, Mellon E, Niyogi S, Witschey W, Kneeland JB, Reddy R. Sodium and T1ρ MRI for molecular and diagnostic imaging of articular cartilage. NMR Biomed. 2006;19:781-821. [DOI] [PMC free article] [PubMed] [Google Scholar]
- 7. Buckwalter JA, Martin J. Degenerative joint disease. Clin Symp. 1995;47:1-32. [PubMed] [Google Scholar]
- 8. Burstein D, Hunter DJ. “Why aren’t we there yet?” Re-examining standard paradigms in imaging of OA: summary of the 2nd annual workshop on imaging based measures of osteoarthritis. Osteoarthritis Cartilage. 2009;17:571-578. [DOI] [PubMed] [Google Scholar]
- 9. Carballido-Gamio J, Link TM, Majumdar S. New techniques for cartilage magnetic resonance imaging relaxation time analysis: texture analysis of flattened cartilage and localized intra- and inter-subject comparisons. Magn Reson Med. 2008;59:1472-1477. [DOI] [PMC free article] [PubMed] [Google Scholar]
- 10. Carballido-Gamio J, Stahl R, Blumenkrantz G, Romero A, Majumdar S, Link TM. Spatial analysis of magnetic resonance T1ρ and T2 relaxation times improves classification between subjects with and without osteoarthritis. Med Phys. 2009;36:4059-4067. [DOI] [PMC free article] [PubMed] [Google Scholar]
- 11. Chang EY, Du J, Chung CB. UTE imaging in the musculoskeletal system. J Magn Reson Imaging. 2015;41:870-883. [DOI] [PMC free article] [PubMed] [Google Scholar]
- 12. Chen W. Errors in quantitative T1rho imaging and the correction methods. Quant Imaging Med Surg. 2015;5:583-591. [DOI] [PMC free article] [PubMed] [Google Scholar]
- 13. Cohen NP, Foster RJ, Mow VC. Composition and dynamics of articular cartilage: structure, function, and maintaining healthy state. J Orthop Sports Phys Ther. 1998;28:203-215. [DOI] [PubMed] [Google Scholar]
- 14. Domayer SE, Welsch GH, Stelzeneder D, et al. Microfracture in the ankle: clinical results and MRI with T2-mapping at 3.0 T after 1 to 8 years. Cartilage. 2011;2:73-80. [DOI] [PMC free article] [PubMed] [Google Scholar]
- 15. Duvvuri U, Reddy R, Patel SD, Kaufman JH, Kneeland JB, Leigh JS. T1ρ-relaxation in articular cartilage: effects of enzymatic degradation. Magn Reson Med. 1997;38:863-867. [DOI] [PubMed] [Google Scholar]
- 16. Foster MA, Haase A. Relaxation measurements in imaging studies. eMagRes. 2007. doi: 10.1002/9780470034590.emrstm0457. [DOI] [Google Scholar]
- 17. Gillis A, Gray M, Burstein D. Relaxivity and diffusion of gadolinium agents in cartilage. Magn Reson Med. 2002;48:1068-1071. [DOI] [PubMed] [Google Scholar]
- 18. Gore JC, Anderson AW. The physics of relaxation. eMagRes. 2013;2(1). doi: 10.1002/9780470034590.emrstm1282. [DOI] [Google Scholar]
- 19. Gray ML, Burstein D, Kim YJ, Maroudas A. 2007 Elizabeth Winston Lanier Award Winner. Magnetic resonance imaging of cartilage glycosaminoglycan: basic principles, imaging technique, and clinical applications. J Orthop Res. 2008;26:281-291. [DOI] [PubMed] [Google Scholar]
- 20. Guha A, Wyatt C, Karampinos DC, Nardo L, Link TM, Majumdar S. Spatial variations in magnetic resonance-based diffusion of articular cartilage in knee osteoarthritis. Magn Reson Imaging. 2015;33:1051-1058. [DOI] [PMC free article] [PubMed] [Google Scholar]
- 21. Hannila I, Raina SS, Tervonen O, Ojala R, Nieminen MT. Topographical variation of T2 relaxation time in the young adult knee cartilage at 1.5 T. Osteoarthritis Cartilage. 2009;17:1570-1575. [DOI] [PubMed] [Google Scholar]
- 22. Holtzman DJ, Theologis AA, Carballido-Gamio J, Majumdar S, Li X, Benjamin C. T1ρ and T2 quantitative magnetic resonance imaging analysis of cartilage regeneration following microfracture and mosaicplasty cartilage resurfacing procedures. J Magn Reson Imaging. 2010;32:914-923. [DOI] [PMC free article] [PubMed] [Google Scholar]
- 23. Huang C, Graff CG, Clarkson EW, Bilgin A, Altbach MI. T2 mapping from highly undersampled data by reconstruction of principal component coefficient maps using compressed sensing. Magn Reson Med. 2012;67:1355-1366. [DOI] [PMC free article] [PubMed] [Google Scholar]
- 24. Hunter DJ, Schofield D, Callander E. The individual and socioeconomic impact of osteoarthritis. Nat Rev Rheumatol. 2014;10:437-441. [DOI] [PubMed] [Google Scholar]
- 25. Jordan CD, McWalter EJ, Monu UD, et al. Variability of CubeQuant T1ρ, quantitative DESS T2, and cones sodium MRI in knee cartilage. Osteoarthritis Cartilage. 2014;22:1559-1567. [DOI] [PMC free article] [PubMed] [Google Scholar]
- 26. Kijowski R, Blankenbaker DG, Munoz Del Rio A, Baer GS, Graf BK. Evaluation of the articular cartilage of the knee joint: value of adding a T2 mapping sequence to a routine MR imaging protocol. Radiology. 2013;267:503-513. [DOI] [PubMed] [Google Scholar]
- 27. Kim YJ, Jaramillo D, Millis MB, Gray ML, Burstein D. Assessment of early osteoarthritis in hip dysplasia with delayed gadolinium-enhanced magnetic resonance imaging of cartilage. J Bone Joint Surg Am. 2003;85-A:1987-1992. [DOI] [PubMed] [Google Scholar]
- 28. Kotlarz H, Gunnarsson CL, Fang H, Rizzo JA. Insurer and out-of-pocket costs of osteoarthritis in the US: evidence from national survey data. Arthritis Rheum. 2009;60:3546-3553. [DOI] [PubMed] [Google Scholar]
- 29. Lattanzio PJ, Marshall KW, Damyanovich AZ, Peemoeller H. Macromolecule and water magnetization exchange modeling in articular cartilage. Magn Reson Med. 2000;44:840-851. [DOI] [PubMed] [Google Scholar]
- 30. Liess C, Lusse S, Karger N, Heller M, Gluer CC. Detection of changes in cartilage water content using MRI T2-mapping in vivo. Osteoarthritis Cartilage. 2002;10:907-913. [DOI] [PubMed] [Google Scholar]
- 31. Li W, Griswold M, Yu X. Fast cardiac T1 mapping in mice using a model-based compressed sensing method. Magn Reson Med. 2012;68:1127-1134. [DOI] [PMC free article] [PubMed] [Google Scholar]
- 32. Li X, Ma BC, Link TM, et al. In vivo T1ρ and T2 mapping of articular cartilage in osteoarthritis of the knee using 3 T MRI. Osteoarthritis Cartilage. 2007;15:789-797. [DOI] [PMC free article] [PubMed] [Google Scholar]
- 33. Li X, Pai A, Blumenkrantz G, et al. Spatial distribution and relationship of T1ρ and T2 relaxation times in knee cartilage with osteoarthritis. Magn Reson Med. 2009;61:1310-1318. [DOI] [PMC free article] [PubMed] [Google Scholar]
- 34. Lin PC, Irrechukwu O, Roque R, Hancock B, Fishbein KW, Spencer RG. Multivariate analysis of cartilage degradation using the support vector machine algorithm. Magn Reson Med. 2012;67:1815-1826. [DOI] [PMC free article] [PubMed] [Google Scholar]
- 35. Lin PC, Reiter DA, Spencer RG. Classification of degraded cartilage through multiparametric MRI analysis. J Magn Reson. 2009;201:61-71. [DOI] [PMC free article] [PubMed] [Google Scholar]
- 36. Lin PC, Reiter DA, Spencer RG. Sensitivity and specificity of univariate MRI analysis of experimentally degraded cartilage. Magn Reson Med. 2009;62:1311-1318. [DOI] [PMC free article] [PubMed] [Google Scholar]
- 37. Liu F, Chaudhary R, Hurley SA, et al. Rapid multicomponent T2 analysis of the articular cartilage of the human knee joint at 3.0T. J Magn Reson Imaging. 2014;39:1191-1197. [DOI] [PubMed] [Google Scholar]
- 38. Liu F, Choi KW, Samsonov A, et al. Articular cartilage of the human knee joint: in vivo multicomponent T2 analysis at 3.0 T. Radiology. 2015;277:477-488. [DOI] [PMC free article] [PubMed] [Google Scholar]
- 39. Lukas VA, Fishbein KW, Reiter DA, Lin PC, Schneider E, Spencer RG. Sensitivity and specificity of univariate MRI analysis of experimentally degraded cartilage under clinical imaging conditions. J Magn Reson Imaging. 2015;42:136-144. [DOI] [PMC free article] [PubMed] [Google Scholar]
- 40. Mamisch TC, Trattnig S, Quirbach S, Marlovits S, White LM, Welsch GH. Quantitative T2 mapping of knee cartilage: differentiation of healthy control cartilage and cartilage repair tissue in the knee with unloading—initial results. Radiology. 2010;254:818-826. [DOI] [PubMed] [Google Scholar]
- 41. Markhardt BK, Chang EY. Hypointense signal lesions of the articular cartilage: a review of current concepts. Clin Imaging. 2014;38:785-791. [DOI] [PubMed] [Google Scholar]
- 42. Markhardt BK, Kijowski R. The clinical significance of dark cartilage lesions identified on MRI. AJR Am J Roentgenol. 2015;205:1251-1259. [DOI] [PubMed] [Google Scholar]
- 43. Matzat SJ, McWalter EJ, Kogan F, Chen W, Gold GE. T2 relaxation time quantitation differs between pulse sequences in articular cartilage. J Magn Reson Imaging. 2015;42:105-113. [DOI] [PMC free article] [PubMed] [Google Scholar]
- 44. Menezes NM, Gray ML, Hartke JR, Burstein D. T2 and T1ρ MRI in articular cartilage systems. Magn Reson Med. 2004;51:503-509. [DOI] [PubMed] [Google Scholar]
- 45. Mlynarik V, Szomolanyi P, Toffanin R, Vittur F, Trattnig S. Transverse relaxation mechanisms in articular cartilage. J Magn Reson. 2004;169:300-307. [DOI] [PubMed] [Google Scholar]
- 46. Mosher TJ, Dardzinski BJ. Cartilage MRI T2 relaxation time mapping: overview and applications. Semin Musculoskelet Radiol. 2004;8:355-368. [DOI] [PubMed] [Google Scholar]
- 47. Mosher TJ, Smith H, Dardzinski BJ, Schmithorst VJ, Smith MB. MR imaging and T2 mapping of femoral cartilage: in vivo determination of the magic angle effect. AJR Am J Roentgenol. 2001;177:665-669. [DOI] [PubMed] [Google Scholar]
- 48. Mosher TJ, Zhang Z, Reddy R, et al. Knee articular cartilage damage in osteoarthritis: analysis of MR image biomarker reproducibility in ACRIN-PA 4001 multicenter trial. Radiology. 2011;258:832-842. [DOI] [PMC free article] [PubMed] [Google Scholar]
- 49. Muir H. Proteoglycans of cartilage. J Clin Pathol Suppl (R Coll Pathol). 1978;12:67-81. [PMC free article] [PubMed] [Google Scholar]
- 50. Newbould RD, Miller SR, Upadhyay N, et al. T1-weighted sodium MRI of the articulator cartilage in osteoarthritis: a cross sectional and longitudinal study. PLoS One. 2013;8:e73067. [DOI] [PMC free article] [PubMed] [Google Scholar]
- 51. Nieminen MT, Rieppo J, Silvennoinen J, et al. Spatial assessment of articular cartilage proteoglycans with Gd-DTPA-enhanced T1 imaging. Magn Reson Med. 2002;48:640-648. [DOI] [PubMed] [Google Scholar]
- 52. Pachowsky ML, Trattnig S, Apprich S, Mauerer A, Zbyn S, Welsch GH. Impact of different coils on biochemical T2 and T2* relaxation time mapping of articular patella cartilage. Skeletal Radiol. 2013;42:1565-1572. [DOI] [PubMed] [Google Scholar]
- 53. Palazzo C, Nguyen C, Lefevre-Colau MM, Rannou F, Poiraudeau S. Risk factors and burden of osteoarthritis. Ann Phys Rehabil Med. 2016;59:134-138. [DOI] [PubMed] [Google Scholar]
- 54. Pauli C, Bae WC, Lee M, et al. Ultrashort-echo time MR imaging of the patella with bicomponent analysis: correlation with histopathologic and polarized light microscopic findings. Radiology. 2012;264:484-493. [DOI] [PMC free article] [PubMed] [Google Scholar]
- 55. Regatte RR, Akella SV, Borthakur A, Kneeland JB, Reddy R. Proteoglycan depletion-induced changes in transverse relaxation maps of cartilage: comparison of T2 and T1ρ. Acad Radiol. 2002;9:1388-1394. [DOI] [PubMed] [Google Scholar]
- 56. Schooler J, Kumar D, Nardo L, et al. Longitudinal evaluation of T1ρ and T2 spatial distribution in osteoarthritic and healthy medial knee cartilage. Osteoarthritis Cartilage. 2014;22:51-62. [DOI] [PMC free article] [PubMed] [Google Scholar]
- 57. Sophia Fox AJ, Bedi A, Rodeo SA. The basic science of articular cartilage: structure, composition, and function. Sports Health. 2009;1:461-468. [DOI] [PMC free article] [PubMed] [Google Scholar]
- 58. Spencer RG, Pleshko N. How do statistical differences in matrix-sensitive magnetic resonance outcomes translate into clinical assignment rules? J Am Acad Orthop Surg. 2013;21:438-439. [DOI] [PMC free article] [PubMed] [Google Scholar]
- 59. Theologis AA, Schairer WW, Carballido-Gamio J, Majumdar S, Li X, Ma CB. Longitudinal analysis of T1ρ and T2 quantitative MRI of knee cartilage laminar organization following microfracture surgery. Knee. 2012;19:652-657. [DOI] [PMC free article] [PubMed] [Google Scholar]
- 60. Tiderius CJ, Olsson LE, Leander P, Ekberg O, Dahlberg L. Delayed gadolinium-enhanced MRI of cartilage (dGEMRIC) in early knee osteoarthritis. Magn Reson Med. 2003;49:488-492. [DOI] [PubMed] [Google Scholar]
- 61. Tiderius CJ, Olsson LE, Nyquist F, Dahlberg L. Cartilage glycosaminoglycan loss in the acute phase after an anterior cruciate ligament injury: delayed gadolinium-enhanced magnetic resonance imaging of cartilage and synovial fluid analysis. Arthritis Rheum. 2005;52:120-127. [DOI] [PubMed] [Google Scholar]
- 62. Tiderius CJ, Svensson J, Leander P, Ola T, Dahlberg L. dGEMRIC (delayed gadolinium-enhanced MRI of cartilage) indicates adaptive capacity of human knee cartilage. Magn Reson Med. 2004;51:286-290. [DOI] [PubMed] [Google Scholar]
- 63. Trattnig S, Domayer S, Welsch GW, Mosher T, Eckstein F. MR imaging of cartilage and its repair in the knee—a review. Eur Radiol. 2009;19:1582-1594. [DOI] [PubMed] [Google Scholar]
- 64. Trattnig S, Burstein D, Szomolanyi P, Pinker K, Welsch GH, Mamisch TC. T1(Gd) gives comparable information as Delta T1 relaxation rate in dGEMRIC evaluation of cartilage repair tissue. Invest Radiol. 2009;44:598-602. [DOI] [PubMed] [Google Scholar]
- 65. Trattnig S, Marlovits S, Gebetsroither S, et al. Three-dimensional delayed gadolinium-enhanced MRI of cartilage (dGEMRIC) for in vivo evaluation of reparative cartilage after matrix-associated autologous chondrocyte transplantation at 3.0T: preliminary results. J Magn Reson Imaging. 2007;26:974-982. [DOI] [PubMed] [Google Scholar]
- 66. van Tiel J, Kotek G, Reijman M, et al. Is T1ρ mapping an alternative to delayed gadolinium-enhanced MR imaging of cartilage in the assessment of sulphated glycosaminoglycan content in human osteoarthritic knees? An in vivo validation study. Radiology. 2016;279:523-531. [DOI] [PubMed] [Google Scholar]
- 67. van Tiel J, Reijman M, Bos PK, et al. Delayed gadolinium-enhanced MRI of cartilage (dGEMRIC) shows no change in cartilage structural composition after viscosupplementation in patients with early-stage knee osteoarthritis. PLoS One. 2013;8:e79785. [DOI] [PMC free article] [PubMed] [Google Scholar]
- 68. van Zijl PC, Yadav NN. Chemical exchange saturation transfer (CEST): what is in a name and what isn’t? Magn Reson Med. 2011;65:927-948. [DOI] [PMC free article] [PubMed] [Google Scholar]
- 69. Watanabe A, Wada Y, Obata T, et al. Delayed gadolinium-enhanced MR to determine glycosaminoglycan concentration in reparative cartilage after autologous chondrocyte implantation: preliminary results. Radiology. 2006;239:201-208. [DOI] [PubMed] [Google Scholar]
- 70. Watrin-Pinzano A, Ruaud JP, Olivier P, et al. Effect of proteoglycan depletion on T2 mapping in rat patellar cartilage. Radiology. 2005;234:162-170. [DOI] [PubMed] [Google Scholar]
- 71. Welsch GH, Juras V, Szomolanyi P, et al. Magnetic resonance imaging of the knee at 3 and 7 tesla: a comparison using dedicated multi-channel coils and optimised 2D and 3D protocols. Eur Radiol. 2012;22:1852-1859. [DOI] [PubMed] [Google Scholar]
- 72. Williams A, Gillis A, McKenzie C, et al. Glycosaminoglycan distribution in cartilage as determined by delayed gadolinium-enhanced MRI of cartilage (dGEMRIC): potential clinical applications. AJR Am J Roentgenol. 2004;182:167-172. [DOI] [PubMed] [Google Scholar]
- 73. Williams A, Sharma L, McKenzie CA, Prasad PV, Burstein D. Delayed gadolinium-enhanced magnetic resonance imaging of cartilage in knee osteoarthritis: findings at different radiographic stages of disease and relationship to malalignment. Arthritis Rheum. 2005;52:3528-3535. [DOI] [PubMed] [Google Scholar]
- 74. Witschey WR, Borthakur A, Fenty M, et al. T1ρ MRI quantification of arthroscopically confirmed cartilage degeneration. Magn Reson Med. 2010;63:1376-1382. [DOI] [PMC free article] [PubMed] [Google Scholar]
- 75. Xia Y. Magic-angle effect in magnetic resonance imaging of articular cartilage: a review. Invest Radiol. 2000;35:602-621. [DOI] [PubMed] [Google Scholar]
- 76. Zhong H, Miller DJ, Urish KL. T2 map signal variation predicts symptomatic osteoarthritis progression: data from the Osteoarthritis Initiative. Skeletal Radiol. 2016;45:909-913. [DOI] [PMC free article] [PubMed] [Google Scholar]
Associated Data
This section collects any data citations, data availability statements, or supplementary materials included in this article.