

Abstract
Context:
Radiography is widely accepted as the gold standard for diagnosing osteoarthritis (OA), but it has limitations when assessing early stage OA and monitoring progression. While there are improvements in the treatment of OA, the challenge is early recognition.
Evidence Acquisition:
MEDLINE and PubMed as well as professional orthopaedic and imaging websites were reviewed from 2006 to 2016.
Study Design:
Clinical review.
Level of Evidence:
Level 4.
Results:
Magnetic resonance imaging (MRI) can provide the most comprehensive assessment of joint injury and OA with the advantages of being noninvasive and multiplanar with excellent soft tissue contrast. However, MRI is expensive, time consuming, and not widely used for monitoring OA clinically. Computed tomography (CT) and CT arthrography (CTA) can also be used to evaluate OA, but these are also invasive and require radiation exposure. Ultrasound is particularly useful for evaluation of synovitis but not for progression of OA.
Conclusion:
MRI, CT, and CTA are available for the diagnosis and monitoring of OA. Improvement in techniques and decrease in cost can allow some of these modalities to be effective methods of detecting early OA.
Keywords: osteoarthritis, MRI, cartilage, CT, ultrasound
Osteoarthritis (OA) affects approximately 15% of the population and is the leading cause of lower extremity disability among older adults.33,45 OA may be related to age, genetics, sex, obesity, activity level, joint injury, and occupation. Of all modifiable risk factors, only obesity and avoiding joint injury have shown sufficient evidence to support effective interventions.48
OA can be defined radiographically or clinically. Although pathological changes may be evident in all structures within an OA joint, articular cartilage abnormalities are always present.39 Because of the ease of standardization and acquisition, radiography is the gold standard for diagnosing OA using the Kellgren-Lawrence (KL) grading system.51 This system has been mostly used for hand, hip, and tibiofemoral joint OA as a semiquantitative assessment, measuring OA severity on a scale of 0 to 4, with >2 defining radiographic OA.20,48 However, the KL grading system has limitations when assessing early stage OA with only mild cartilage abnormalities or a localized cartilage defect. Magnetic resonance imaging (MRI) is more sensitive to preradiographic OA during these earlier stages as it can image soft tissue structures including articular cartilage, meniscus, ligaments, bone marrow, labrum, and synovium. It can also detect the changes in articular cartilage composition that occur before morphologic changes. However, MRI is currently still not a standard technique to diagnose and monitor OA.46 This review presents the current advantages and limitations of advanced MRI in the assessment in OA and also highlights the potentials of advanced imaging techniques.
Magnetic Resonance Imaging
Semiquantitative MRI
Semiquantitative MRI scoring systems focus on pathological features (eg, articular cartilage, bone marrow lesions [BMLs], and subchondral cysts) that may relate to the severity of OA, allowing cross-sectional and longitudinal comparisons of OA severity.86
Four scoring systems have been established for knee OA: the Whole Organ Magnetic Resonance Imaging Score (WORMS),74 the Knee Osteoarthritis Scoring System (KOSS),53 the Boston Leeds Osteoarthritis Knee Score (BLOKS),28 and the MRI Osteoarthritis Knee Score (MOAKS).47 WORMS and BLOKS are widely used. Two recent studies compared the strengths and weaknesses of these 2 systems with regard to knee OA evaluating cartilage, meniscus, and BMLs.28,63 Both demonstrated high reliability. The BLOKS meniscal score was preferable to the WORMS meniscal scale in predicting cartilage loss, while BML scoring in WORMS was preferable in that it predicted future cartilage loss. Nonetheless, neither method was definitively better for articular cartilage scoring. Within-grade changes in semiquantitative MRI assessment of cartilage and BMLs have also been applied to OA assessment to increase sensitivity in detecting longitudinal changes in lesions that do not meet the criteria of a full-grade change but show obvious visual changes.90 MOAKS is a refined semiquantitative scoring system for both cross-sectional and longitudinal MR assessment of knee OA. It includes semiquantitative scoring of BMLs, subchondral cysts, articular cartilage, osteophytes, Hoffa synovitis and synovitis effusion, meniscus, tendons and ligaments, and periarticular features such as bursitis.91 Studies using MOAKS showed that knees with medial joint space narrowing were associated with greater meniscal extrusion and damage.9 Scoring systems for synovitis based on contrast-enhanced MRI have also been developed to determine the significance of synovitis in the progression of OA.6
Semiquantitative MRI scoring systems for hand and hip OA have also been developed: the Oslo Hand OA MRI Score (OHOA-MRI), the Hip Osteoarthritis MRI Scoring System (HOAMS), and Scoring Hip Osteoarthritis with MRI (SHOMRI).42,55,88
Quantitative Analysis of Articular Cartilage
MRI-based quantitative analysis of articular cartilage requires high-resolution imaging to delineate the bone-cartilage interface and cartilage surface with adequate contrast, which has been validated in spoiled gradient echo images and double echo steady-state images.23,31 After image acquisition, either automated or manual segmentation of the articular cartilage is needed for postprocessing. The 3-dimensional nature of the data sets or figures can then evaluate tissue dimensions (thickness, area, volume) as continuous variables. Quantitative methods are superior to semiquantitative techniques in assessing cartilage changes and structural modifications.111
A quantitative cartilage measurement system includes cartilage volume (VC), area of cartilage surface (AC), total area of subchondral bone (tAB), denuded area of subchondral bone (dAB), and mean cartilage thickness over the tAB (ThCtAB.Me).22 Another modified system includes a core subset of the above measurements, namely ThCtAB.Me, tAB, and dAB.11 Quantitative cartilage measurements can also be used to detect regional cartilage changes.12,13,115,116 Other approaches discriminate longitudinal changes in knees with OA and detect risk factors of OA progression more efficiently.12,13,25,114-116
dAB is associated with concurrent and incident knee pain.16 Changes in ThCtAB.Me are related to the likelihood of future knee replacement, especially when cartilage loss occurs in the central medial tibiofemoral compartment.24,73,80
Cartilage volume and thickness changes can also be used as outcome measures in pharmacologic, physical exercise, and surgical studies. For example, using quantitative analyses of articular cartilage, use of celecoxib, chondroitin sulfate, and sprifermin did not reach statistical significance regarding improvement in the medial compartment, although effects were observed in the lateral compartment.81,112 VC was significantly smaller in anterior cruciate ligament (ACL)–injured knees than in contralateral intact knees in middle-aged patients.56 Women tended to display greater VC and ThCtAB.Me changes after ACL injury than men.56 No difference in cartilage thickness was detected between those undergoing ACL reconstruction and a control group in young male patients.57
Compositional MRI
Another aspect of MRI, compositional or quantitative MR (qMR), includes advanced imaging techniques to detail the state of the soft tissue by measuring the molecular structure of the extracellular matrix.34 Biochemical MRI offers insight into the ultrastructure of cartilage not apparent on visual inspection.
Cartilage Ultrastructure
Articular cartilage is composed of a highly organized network of collagen and proteoglycans along with the water molecules that reside between these macromolecules, allowing cartilage to withstand load by deforming and reverting back to its original shape after loading.95 The network of collagen fibers differs in orientation from the articular superficial zone to the deep zone adjacent to bone, and this structure is a key property of cartilage. In OA, there is a disruption of this structure with loss of collagen and proteoglycans, affecting the water content of cartilage. This process, however, is not obvious on conventional MRI sequences during the early stages of disease. Quantitative sequences of this unique structure of cartilage can determine the macromolecule status and water content.
T2/T2*/T1ρ/UTE
T2, T2*, T1ρ, and their related sequences (ultra-short echo time enhanced [UTE]) measure T1 and T2 relaxation times, with T1ρ dependent on both T1 and T2. Briefly, when a molecule is excited by a magnetic field, it requires time to “relax,” or decay, from its excited state to its resting state, and this differs from molecule to molecule. T1 and T2 relaxation times measure 2 different forms of excitation and decay; hence, the unit measure for all of these sequences is milliseconds (ms). One advantage of these sequences is that they do not require contrast. The concentrations of proteoglycans and collagen are associated with T1ρ and T2, where higher relaxation times correlate with increased deterioration of the cartilage matrix.1,58,70,72 T1ρ and T2 also show gradation within the cartilage matrix in healthy cartilage as collagen orientation changes from the superficial to deep zones; T2, T2*, and T1ρ all decrease within the deeper layers of cartilage.34,49,68 While these sequences may be similar in methodology, they can measure different components or levels of degeneration in cartilage (Figure 1).59
Figure 1.

T1ρ and T2 maps of (a) a healthy control, (b) a subject with mild osteoarthritis (OA), and (c) a subject with severe OA. Significant elevation of T1ρ and T2 values were observed in subjects with OA. T1ρ and T2 elevation had different spatial distribution and may provide complementary information associated with cartilage degeneration. Reprinted with permission from Li and Majumdar.59
T2, also called “spin-spin,” has been studied extensively in OA, ACL tears (a risk factor for early OA), and cartilage repair procedures. Studies generally agree that cartilage degeneration results in higher T2 relaxation times, but whether T2 can predict future outcomes is a topic of interest. Recent studies have used data from the Osteoarthritis Initiative,60,76,120 a large cohort study following the progression of osteoarthritis, and demonstrated the potential of T2 in predicting prognosis. In the hip joint, greater T2 was associated with cartilage degeneration measured by semiquantitative methods.30 In cartilage resurfacing studies, a low T2 value would indicate incorporation of the implant and has been used to assess the quality and health of the repaired cartilage.101 T2* is similar to T2 but can be used with increased resolution and is available commercially. T2* can capture short cartilage decay times, allowing detection of signals that may be too small for T2, and is more sensitive.
T1ρ (also called “spin-lock”) relaxation time may be a more sensitive method of detecting proteoglycan changes in cartilage.108 The signal frequency detected in T1ρ is lower than T2 and can complement the information obtained from T2.82 T1ρ can evaluate cartilage after ACL injuries, and recent studies have associated patient-reported outcomes and knee biomechanics with T1ρ measured at an earlier time point.3,97,118 These studies may identify factors that predispose patients to early cartilage degeneration after joint injury. Kinematic changes in 3-dimensional motion analysis in subjects with patellofemoral OA have correlated with an increase in T1ρ.99
The degeneration of meniscus can also be studied using T1ρ and T2 because it is also composed of collagen, proteoglycan, and water (Figure 2).107 Recently, UTE T2* and T1ρ have been used to analyze deep zones of the cartilage where non-UTE imaging may not be sensitive enough. UTE T2* is able to measure deep layers of cartilage while T2 cannot.113 UTE T1ρ may be best for the visualization of tendon and meniscus.21
Figure 2.

Magnetic resonance images showing the posterior horn of the lateral meniscus in an anterior cruciate ligament (ACL)–injured knee with modified meniscal Whole Organ Magnetic Resonance Imaging Score (WORMS) grade of 0 (a, b, c) and an ACL-injured knee with modified meniscal WORMS grade of 1 (d, e, f). The CUBE (a and d), T1ρ (b and e), and T2 (c and f) images illustrate the discrepancies between subjects with modified meniscal WORMS grades of 0 and 1. The color bar indicates the relaxation measure gradient. Reprinted with permission from Wang et al.107
Diffusion
Diffusion imaging is based on the water molecules that are trapped between the collagen and proteoglycans. These molecules move when they are excited by an applied magnetic field. The diffusion of water is measured through macromolecules. There are 2 major types of diffusion imaging: diffusion-weighted imaging and diffusion tensor imaging. These use a diffusion quotient or apparent diffusion coefficient as parameters for the degree of water diffusion and fractional anisotropy, which indicates the water diffusion in various orientations. In ex vivo studies, these parameters show sensitivity to collagen architecture and proteoglycans in cartilage matrix.78 Loss of proteoglycan can lead to significant increases in mean diffusion, while loss of collagen can alter the diffusion coefficient and fractional anisotropy. Therefore, these parameters can be indicators of early degeneration of cartilage and can be quantified from 1 sequence. In vivo diffusion-weighted imaging and diffusion tensor imaging of cartilage have been limited by technical challenges, such as the need for high-resolution images and long acquisition times. Several studies have demonstrated the potential in differentiating healthy and degenerated cartilage in vivo and evaluating cartilage after repair procedures.5,29,77,79 Various strategies are currently being applied to reduce scan times, signal-to-noise ratios (SNRs), and increase spatial resolution. Further studies are still needed to evaluate reliability and reproducibility before clinical application.
Sodium (23Na)
Proteoglycan is composed of glycosaminoglycan (GAG), which has a negative charge, and the accompanying cation is often sodium. Hence the concentration of sodium in tissue is directly correlated with the concentration of GAG, and therefore proteoglycan.64 Sodium (23Na) imaging is possible because signals from the nucleus of sodium are much lower than from protons, which is usually measured with MRIs. The major advantage of sodium (23Na) MRI of cartilage is its high specificity to proteoglycan with very high tissue contrast and without the need for any exogenous contrast (Figure 3).10 However, sodium MRI has been limited in vivo because of the inherent low SNR, caused by low 23Na concentrations in vivo and ultra-short T2 and T2* relaxation times. It is challenging to acquire in vivo sodium MR images with adequate SNR and resolution under a clinically reasonable scan time.102,110 Higher magnetic field strengths (3.0 T or higher), dedicated coils, and optimal pulse sequences make clinical use of in vivo sodium MRI possible.
Figure 3.
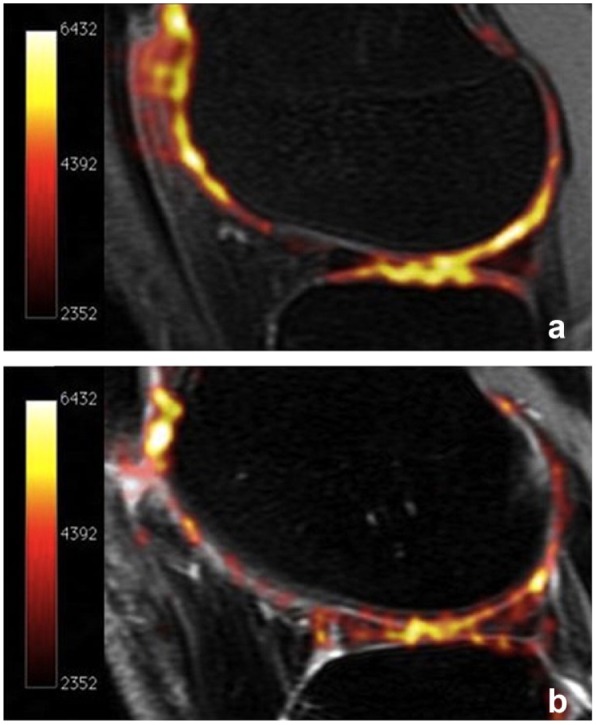
Sodium maps of articular cartilage in (a) a healthy volunteer and (b) a patient with osteoarthritis (OA) overlaid onto proton images. The increased sodium signal in Figure 3a correlates with higher glycosaminoglycan (GAG) concentration. As cartilage degenerates and GAG concentration decreases, sodium signal declines (b). Reprinted with permission from Braun and Gold.10
Delayed Gadolinium-Enhanced MRI of Cartilage (dGEMRIC)
dGEMERIC uses gadolinium contrast, which is injected intravenously. The patient exercises to allow the contrast to diffuse into the cartilage matrix. The scan is typically performed 60 to 90 minutes after injection. The gadolinium contrast is negatively charged and is repelled by GAG in cartilage. Therefore, contrast in the cartilage tissue is inversely related to the amount of GAG. The methodology behind dGEMERIC is well established and has excellent correlation with in vivo imaging, histology, and detecting OA.7,104,122 dGEMRIC can assess the effect of exercise on cartilage of both the hip and the knee (Figure 4)121 as well as the effect of hyaluronic acid.4,43,105 Despite the extensive experience with dGEMRIC, its application is limited because it requires a high dose of contrast (double the clinically recommended dose), raising the concern for nephrogenic systemic sclerosis, a rare complication that can lead to irreversible kidney failure.14 The challenge of a standardized waiting period between contrast injection and scan also poses hurdles to regular clinical use. Thus, the clinical application of dGEMRIC is currently limited.
Figure 4.

(a and c) Double-echo steady state (DESS) and (b and d) corresponding T1Gd reformat for separate analysis of acetabular and femoral cartilage. Reprinted with permission from Zilkens et al.121
Chemical Exchange Saturation Transfer Imaging (gagCEST)
Another method of quantifying cartilage is chemical exchange transfer, which relies on the constant transfer of labile protons between solutes (in the case of cartilage, GAG) and water.52 The characteristics of proton transfer between water molecules (water-water) and between water and GAG (water-GAG) differ. Measurements of these different signals correspond with the concentration of GAG in the tissue. MRI radiofrequency pulses can stimulate (or saturate) these labile protons in GAG, which are subsequently transferred to the surrounding water molecules. The unit of measure for CEST is magnetic transfer ratio, which reflects the difference between water-water transfer and water-GAG transfer. This technique has faced challenges in application because stronger magnetic fields are needed, often requiring a 7 T scanner. A recent study on a 3 T scanner observed knee cartilage of patients with chondromalacia and microfracture and found some correlation with T2 and dGEMRIC measures.83
Quantitative MR has demonstrated significant promise in research, allowing noninvasive monitoring of cartilage health in OA, after joint injury, and after soft tissue repair procedures. Its clinical application is currently limited due to advanced equipment requirements, lack of uniform protocols, and long acquisition times. Furthermore, these measurements require an added step of postprocessing after image acquisition, involving segmentation of the tissue of interest for each image, a process that can be very time consuming. Additional validation and reproducibility studies will also be needed when using these technologies in multiple sites. Despite these limitations, the high interest in this field may bring these sequences to clinical settings in the near future.
MRI After Cartilage Repair and Regeneration
Several surgical techniques have been developed to treat focal cartilage defects, including marrow stimulation, osteochondral grafting, particulated cartilage grafting, and autologous chondrocyte implantation (ACI). MRI can provide noninvasive morphologic and compositional assessment of the cartilage repair site. The 3D gradient echo (GRE) sequences with fat suppression or water excitation can depict the thickness and surface of cartilage accurately. Fast spin-echo sequences can outline the internal structure of cartilage and detect the focal cartilage defects with relative high sensitivity.38,89 Quantitative compositional MRI measurements (eg, T2, T2*, T1ρ) are available for biochemical assessment. However, susceptible artifacts may interfere with assessment—especially with GRE images—after cartilage repair techniques that utilize hardware.38
In the early postoperative period after microfracture (marrow stimulation technique) (Figure 5),38 the repair tissue appears rather thin and hyperintense compared with the native cartilage on T2-weighted images, and it is sometimes difficult to differentiate the repair tissue from fluid.38 As the repair tissue matures, signal intensity decreases and the subchondral marrow edema decreases. The defect filled by the repair tissue usually improves over 2 years but may eventually appear hypointense to intact cartilage.15,67 Poorly filled defects and incomplete peripheral tissue integration after 2 years may be associated with poor knee function.66,67 For osteochondral grafting, if the transplanted cartilage is intact, the postsurgical evaluation should include assessment of graft signal intensity, peripheral cartilage and bone interfaces, articular surface contour, and subchondral bone.15 Bone marrow edema within the grafts and the surrounding bone can last for more than 1 year after surgery and will decrease with progressive bone incorporation.61 Persistent bone marrow edema in subchondral bone beyond 18 months and subchondral cyst formation may be signs of poor tissue integration. For autograft cases, donor site defects are most often left unfilled or filled with bone and fibrocartilage to a level below the articular cartilage surface. After ACI, the appearance of the repair site is dependent on the procedure and the underfilled or overfilled defects. The signal is initially hyperintense compared with native cartilage but decreases as the repair tissue matures, approaching that of native cartilage during the first year (Figure 6).38,100 Overfill or hypertrophy of the repair tissue can occur when a periosteal cover is used with seeded matrix techniques.84
Figure 5.
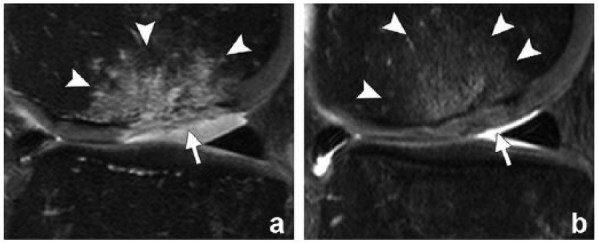
A 36-year-old man with a full-thickness focal cartilage defect of the lateral weightbearing femoral condyle treated with the microfracture technique. (a) Sagittal fat-suppressed intermediate-weighted magnetic resonance (MR) image (repetition time/echo time, 3370/34 ms) of the knee 6 weeks after microfracture shows heterogeneous hyperintense repair tissue that does not completely fill the defect (arrow). Note the surgically induced irregularity of the subchondral plate and intense subchondral edema-like marrow signal intensity (arrowheads). (b) MR image obtained 12 weeks after surgery shows near-complete filling of the cartilage defect with repair tissue that is similar in signal intensity to that of the adjacent native cartilage (arrow). There is also a substantive decrease in subchondral edema-like marrow signal intensity (arrowheads). Reprinted with permission from Guermazi et al.38
Figure 6.

A 49-year-old man with a cartilage defect and tear of the anterior cruciate ligament who underwent matrix-associated autologous chondrocyte transplantation. (a) Sagittal proton density–weighted magnetic resonance (MR) image of the knee obtained 24 months after surgery (repetition time/echo time, 2130/36 ms; flip angle, 180°) shows good fill of the defect (arrows) but focal degeneration of the repair with cartilage irregularity at the posterior aspect of the repair. (b) Sagittal sodium (repetition time/echo time, 17/7.7 ms; flip angle, 30°) and (c) glycosaminoglycan chemical exchange saturation transfer (repetition time/echo time, 7.3/3.2 ms; flip angle, 5°) MR images show lower signal intensity within the repair site (arrow) compared with normal reference tissue. Color bars in (b) and (c) represent sodium signal-to-noise ratio and magnetization transfer resonance asymmetry values summed over offsets from 0 to 1.3 ppm, respectively. Reprinted with permission from Guermazi et al.38
Two semiquantitative scoring systems are used for knee cartilage repair evaluation: the MR observation of cartilage repair tissue (MOCART)65,109 and the cartilage repair osteoarthritis knee score (CROAKS).87 The MOCART is excellent for assessing the repair site.65,109 CROAKS optimizes comprehensive morphologic assessment of the knee joint after cartilage repair, combining features of MOCART and MOAKS for whole-organ assessment of the knee.47 Their use is currently limited to research not for routine clinical practice.
MRI of Nonosteochondral Tissues in Osteoarthritis
Synovitis in Knee OA
Synovitis is increasingly recognized as an important feature of the pathophysiology of knee OA.44 It is strongly associated with tibiofemoral radiographic OA and widespread MRI-detected cartilage damage.36 MRI can visualize synovial changes deep within the joint, an advantage over ultrasound or CT. The prevalence of synovitis detected by non–contrast-enhanced MRI may be as high as 37% in the middle-aged and elderly population without radiographic knee OA.37 Synovitis detected by contrast-enhanced MRI occurred in 50.9% to 89.2% of individuals with or at risk of knee OA.39 Contrast-enhanced MRI can better differentiate inflamed synovium from joint effusion. However, it is not known whether contrast-enhanced MRI assessment of synovitis can predict the disease progression of OA. A randomized controlled study monitored the efficacy of a bradykinin receptor 2 antagonist in painful knee OA.94 Significant improvement of visual analog scale pain score was observed after therapy, but no significant change in the severity of synovitis was found in 36 subjects.
Meniscus Injury in Knee OA
Meniscus abnormalities are strongly associated with radiographic knee OA since structural changes of the meniscus (ie, tear or extrusion) can lead to a loss of the normal shock-absorbing function at the tibiofemoral joint.18,27 The prevalence of meniscus tears in middle-aged or elderly populations ranges from 19% to 56% and increases with age. If meniscus maceration is included as meniscus tear, the prevalence will be even higher, particularly in elderly women.26 T1, T2, and proton density–weighted, fat-saturated, fast or turbo spin-echo sequences with both sagittal and coronal images are useful for diagnosis of meniscus pathology.17 The sensitivity and specificity of meniscus tear diagnosed by MRI are 82% to 96%.19 Degenerative meniscus tears are the most typical tears of knee OA.26 Subjects with mild and moderate knee OA show significantly increased meniscus extrusion compared with normal when an axial mechanical load is applied to the knee.96 Posterior-medial meniscal root tears are associated with progressive medial tibiofemoral cartilage loss.35 By detecting the early stage premorphologic changes in meniscal matrix, advanced MRI protocols and image processing techniques may lead to better understanding of the role of meniscus pathology in the onset and progression of knee OA.
Labral Injury in Hip OA
Acetabular labral injuries are associated with hip OA caused by trauma, femoroacetabular impingement, capsular laxity, developmental dysplasia of the hip, and degeneration.32 In HOAMS, an MRI-based semiquantitative scoring system for hip labrum, the labrum is assessed anteriorly on sagittal slice, superolaterally/posteromedially on coronal slice, and anteriorly/posteriorly on axial slice using high-resolution, proton density–weighted, fat-saturated images.88 Labral tears and cartilage loss appear interrelated in patients with hip OA with mechanical symptoms, implying that labral tears may represent important risk factors for development and progression of hip OA.69 Labral tears and clinical symptoms are not necessarily associated, while acetabular cartilage defects, bone marrow edema-like lesions (BMELs), and subchondral cysts were related to greater self-reported pain and disability.54 Generally, the longitudinal relationship between labral pathology and hip OA is not well established.
BMELs in Knee OA
BMELs, defined as increased signal intensity in areas of subchondral bone marrow in fluid-sensitive sequences of MRI, are prevalent in patients with knee OA (Figure 7). BMELs are associated with increased severity of OA as defined by KL score (cartilage degeneration, bone marrow necrosis, bone marrow fibrosis, trabecular abnormalities, and a small amount of edema).98 There may be a local spatial correlation between BMELs and more advanced and accelerated cartilage degeneration. MRI T1ρ quantification in cartilage is a sensitive tool for evaluating such correlations.119 However, correlation between BMELs and knee pain still remains controversial.62
Figure 7.
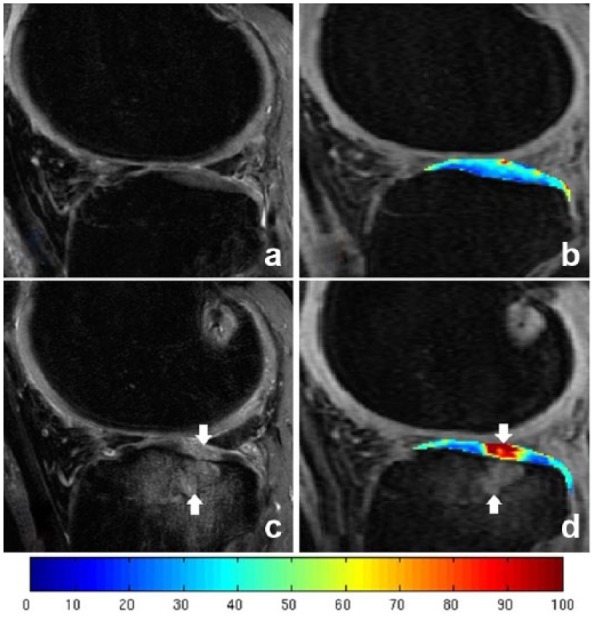
T1ρ color-coded maps of a knee with an anterior cruciate ligament tear at (b) baseline and (d) 2-year follow-up and sagittal fat-suppressed T2-weighted FSE image also obtained for each time point (a, baseline; c, 2-year follow-up). Cartilage injury (downward-facing arrows) within the cartilage overlying the bone marrow lesions (upward-facing arrows) at the lateral tibial plateau is demonstrated in 2-year follow-up images.
CT and MR Arthrography
Contrast-enhanced computed tomography (CT) and MR arthrography (CTA and MRA) evaluate articular cartilage and labral injuries with high anatomic resolution.93 CTA has a better spatial resolution but limited contrast between adjacent joint tissues and synovial fluid.71,117 From cadaver studies, CTA of the hip showed accurate assessment of acetabular cartilage.2,117 CTA may be used for quantitative cartilage analysis in hip OA research, but the invasive nature of the procedure and the radiation exposure are 2 major concerns.8 CTA using a low radiation dose could decrease radiation exposure.106 For MRA, diluted gadolinium diethylenetriaminepentaacetate is injected intra-articularly to visualize superficial cartilage defects and labral tears. Arthrographic examinations have risks, including pain, vasovagal reactions, systemic allergic reactions, and a low risk of infection from the intra-articular injection, which limits their clinical applicability.
Other Imaging Modalities
One of the main advantages of CT is accurate imaging of the subchondral bone and osteophytes. A CT-based semiquantitative grading system assessing facet joint OA of the spine in both clinical and research settings showed a high prevalence of joint OA with increasing age. A greater prevalence of disc narrowing and degenerative spondylolisthesis was noted.50,92 A new CT-based grading system for hip OA comparable with the KL grading system found CT grading has substantial reliability and sensitivity (Figure 8).103 Another advantage of hip CT is that it allows quantification of morphological abnormalities such as femoroacetabular impingement in 3 dimensions.41
Figure 8.
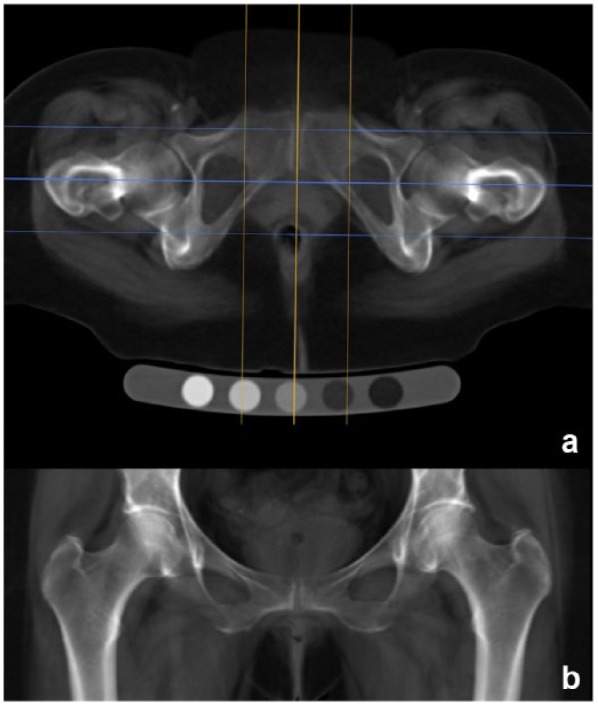
Digitally reconstructed radiography (DRR) process from helically acquired computed tomography (CT) data using OsiriX. (a) Axial mean intensity projection reformat of the original data showing the sagittal (orange) plane used to align along the anteroposterior axis of the pubic symphysis and the coronal (cyan) reformat plane with outer lines marking the limits of the reconstructed slab just beyond the anterior and posterior hip joint margins. (b) Coronal mean intensity projection slab (usually 6-8 cm in depth) showing the DRR used for minimum joint space width measurement and KL grading (window level, 200; window width, 700; magnification up to 200%). Reprinted with permission from Turmezei et al.103
Musculoskeletal ultrasound has advantages in depicting effusion and synovial hypertrophy of associated OA.40 Grayscale features can identify inflammation in OA, and increased power Doppler signal within the synovium may represent active inflammation.75 A musculoskeletal ultrasound score system of 61 items discerns various degrees of knee OA.85 This system may be reliable and valid in detecting knee OA and comparable with standing radiographs of the knees with relevant precision.85 The significant advantage of musculoskeletal ultrasound is the low cost. The reliability of the technique is very operator dependent and difficult to compare in studies.
Summary
Detecting early cartilage abnormalities and intra-articular injuries is essential for the early diagnosis of OA. In the clinical and research settings, radiography is still used commonly. Radiographic features such as joint space height represent only generalized cartilage and meniscal damage at the intermediate or late stages and are not indicative of localized cartilage lesions. MRI is currently the imaging modality that provides the most comprehensive assessment of joint injury. It enjoys the advantages of being noninvasive and multiplanar with excellent soft tissue contrast. Semiquantitative, quantitative, and compositional MRI assessment techniques can assess disease burden and monitor disease progression. However, the cost of MRI is still high and it is time consuming. CT and CTA can also be used to assess OA with analysis of articular cartilage and subchondral bone quality. They have very limited roles in larger scale clinical or epidemiological studies because of radiation exposure. Ultrasound is a low-cost modality that is particularly useful for the evaluation of synovitis, but it lacks specificity and the ability to monitor soft tissue conditions.
Footnotes
The author(s) reported no potential conflicts of interest in the development and publication of this manuscript.
References
- 1. Akella SV, Regatte RR, Gougoutas AJ, et al. Proteoglycan-induced changes in T1ρ-relaxation of articular cartilage at 4T. Magn Reson Med. 2001;46:419-423. [DOI] [PubMed] [Google Scholar]
- 2. Allen BC, Peters CL, Brown NA, Anderson AE. Acetabular cartilage thickness: accuracy of three-dimensional reconstructions from multidetector CT arthrograms in a cadaver study. Radiology. 2010;255:544-552. [DOI] [PMC free article] [PubMed] [Google Scholar]
- 3. Amano K, Pedoia V, Su F, Souza RB, Li X, Ma CB. Persistent biomechanical alterations after acl reconstruction are associated with early cartilage matrix changes detected by quantitative MR. Orthop J Sports Med. 2016;4:2325967116644421. [DOI] [PMC free article] [PubMed] [Google Scholar]
- 4. Anandacoomarasamy A, Leibman S, Smith G, et al. Weight loss in obese people has structure-modifying effects on medial but not on lateral knee articular cartilage. Ann Rheum Dis. 2012;71:26-32. [DOI] [PubMed] [Google Scholar]
- 5. Apprich S, Trattnig S, Welsch GH, et al. Assessment of articular cartilage repair tissue after matrix-associated autologous chondrocyte transplantation or the microfracture technique in the ankle joint using diffusion-weighted imaging at 3 Tesla. Osteoarthritis Cartilage. 2012;20:703-711. [DOI] [PubMed] [Google Scholar]
- 6. Baker K, Grainger A, Niu J, et al. Relation of synovitis to knee pain using contrast-enhanced MRIs. Ann Rheum Dis. 2010;69:1779-1783. [DOI] [PMC free article] [PubMed] [Google Scholar]
- 7. Bashir A, Gray ML, Hartke J, Burstein D. Nondestructive imaging of human cartilage glycosaminoglycan concentration by MRI. Magn Reson Med. 1999;41:857-865. [DOI] [PubMed] [Google Scholar]
- 8. Biswas D, Bible JE, Bohan M, Simpson AK, Whang PG, Grauer JN. Radiation exposure from musculoskeletal computerized tomographic scans. J Bone Joint Surg Am. 2009;91:1882-1889. [DOI] [PubMed] [Google Scholar]
- 9. Bloecker K, Guermazi A, Wirth W, et al. Tibial coverage, meniscus position, size and damage in knees discordant for joint space narrowing—data from the Osteoarthritis Initiative. Osteoarthritis Cartilage. 2013;21:419-427. [DOI] [PMC free article] [PubMed] [Google Scholar]
- 10. Braun HJ, Gold GE. Diagnosis of osteoarthritis: imaging. Bone. 2012;51:278-288. [DOI] [PMC free article] [PubMed] [Google Scholar]
- 11. Buck RJ, Wyman BT, Le Graverand MP, Wirth W, Eckstein F; A9001140 Investigators. An efficient subset of morphological measures for articular cartilage in the healthy and diseased human knee. Magn Reson Med. 2010;63:680-690. [DOI] [PubMed] [Google Scholar]
- 12. Buck RJ, Wyman BT, Hellio Le, Graverand MP, et al. Using ordered values of subregional cartilage thickness change increases sensitivity in detecting risk factors for osteoarthritis progression. Osteoarthritis Cartilage. 2011;19:302-308. [DOI] [PubMed] [Google Scholar]
- 13. Buck RJ, Wyman BT, Le Graverand MP, Hudelmaier M, Wirth W, Eckstein F. Does the use of ordered values of subregional change in cartilage thickness improve the detection of disease progression in longitudinal studies of osteoarthritis? Arthritis Care Res. 2009;61:917-924. [DOI] [PubMed] [Google Scholar]
- 14. Chang G, Regatte RR. Advanced Computational Approaches to Biomedical Engineering. New York, NY: Springer Science & Business Media; 2014. [Google Scholar]
- 15. Choi YS, Potter HG, Chun TJ. MR imaging of cartilage repair in the knee and ankle. Radiographics. 2008;28:1043-1059. [DOI] [PubMed] [Google Scholar]
- 16. Cotofana S, Wyman BT, Benichou O, et al. Relationship between knee pain and the presence, location, size and phenotype of femorotibial denuded areas of subchondral bone as visualized by MRI. Osteoarthritis Cartilage. 2013;21:1214-1222. [DOI] [PubMed] [Google Scholar]
- 17. Crema MD, Felson DT, Roemer FW, et al. Peripatellar synovitis: comparison between non-contrast-enhanced and contrast-enhanced MRI and association with pain. The MOST study. Osteoarthritis Cartilage. 2013;21:413-418. [DOI] [PMC free article] [PubMed] [Google Scholar]
- 18. Crema MD, Roemer FW, Felson DT, et al. factors associated with meniscal extrusion in knees with or at risk for osteoarthritis: the Multicenter Osteoarthritis Study. Radiology. 2012;264:494-503. [DOI] [PMC free article] [PubMed] [Google Scholar]
- 19. De Smet AA, Tuite MJ. Use of the “two-slice-touch” rule for the MRI diagnosis of meniscal tears. AJR Am J Roentgenol. 2006;187:911-914. [DOI] [PubMed] [Google Scholar]
- 20. Demehri S, Hafezi-Nejad N, Carrino JA. Conventional and novel imaging modalities in osteoarthritis: current state of the evidence. Curr Opin Rheumatol. 2015;27:295-303. [DOI] [PubMed] [Google Scholar]
- 21. Du J, Carl M, Diaz E, et al. Ultrashort TE T1ρ (UTE T1ρ) imaging of the Achilles tendon and meniscus. Magn Reson Med. 2010;64:834-842. [DOI] [PubMed] [Google Scholar]
- 22. Eckstein F, Ateshian G, Burgkart R, et al. Proposal for a nomenclature for magnetic resonance imaging based measures of articular cartilage in osteoarthritis. Osteoarthritis Cartilage. 2006;14:974-983. [DOI] [PubMed] [Google Scholar]
- 23. Eckstein F, Hudelmaier M, Wirth W, et al. Double echo steady state magnetic resonance imaging of knee articular cartilage at 3 Tesla: a pilot study for the Osteoarthritis Initiative. Ann Rheum Dis. 2006;65:433-441. [DOI] [PMC free article] [PubMed] [Google Scholar]
- 24. Eckstein F, Kwoh CK, Boudreau RM, et al. Quantitative MRI measures of cartilage predict knee replacement: a case-control study from the Osteoarthritis Initiative. Ann Rheum Dis. 2013;72:707-714. [DOI] [PubMed] [Google Scholar]
- 25. Eckstein F, Le Graverand MPH, Charles HC, et al. Clinical, radiographic, molecular and MRI-based predictors of cartilage loss in knee osteoarthritis. Ann Rheum Dis. 2011;70:1223-1230. [DOI] [PubMed] [Google Scholar]
- 26. Englund M, Guermazi A, Gale D, et al. Incidental meniscal findings on knee MRI in middle-aged and elderly persons. N Engl J Med. 2008;359:1108-1115. [DOI] [PMC free article] [PubMed] [Google Scholar]
- 27. Englund M, Roemer FW, Hayashi D, Crema MD, Guermazi A. Meniscus pathology, osteoarthritis and the treatment controversy. Nat Rev Rheumatol. 2012;8:412-419. [DOI] [PubMed] [Google Scholar]
- 28. Felson DT, Lynch J, Guermazi A, et al. Comparison of BLOKS and WORMS scoring systems part II. Longitudinal assessment of knee MRIs for osteoarthritis and suggested approach based on their performance: data from the Osteoarthritis Initiative. Osteoarthritis Cartilage. 2010;18:1402-1407. [DOI] [PMC free article] [PubMed] [Google Scholar]
- 29. Friedrich KM, Mamisch TC, Plank C, et al. Diffusion-weighted imaging for the follow-up of patients after matrix-associated autologous chondrocyte transplantation. Eur J Radiol. 2010;73:622-628. [DOI] [PubMed] [Google Scholar]
- 30. Gallo MC, Wyatt C, Pedoia V, et al. T1ρ and T2 relaxation times are associated with progression of hip osteoarthritis. Osteoarthritis Cartilage. 2016;24:1399-1407. [DOI] [PMC free article] [PubMed] [Google Scholar]
- 31. Graichen H, Eisenhart-Rothe RV, Vogl T, Englmeier KH, Eckstein F. Quantitative assessment of cartilage status in osteoarthritis by quantitative magnetic resonance imaging: technical validation for use in analysis of cartilage volume and further morphologic parameters. Arthritis Rheum. 2004;50:811-816. [DOI] [PubMed] [Google Scholar]
- 32. Groh MM, Herrera J. A comprehensive review of hip labral tears. Curr Rev Musculoskelet Med. 2009;2:105-117. [DOI] [PMC free article] [PubMed] [Google Scholar]
- 33. Guccione AA, Felson DT, Anderson JJ, et al. The effects of specific medical conditions on the functional limitations of elders in the Framingham study. Am J Public Health. 1994;84:351-358. [DOI] [PMC free article] [PubMed] [Google Scholar]
- 34. Guermazi A, Alizai H, Crema MD, Trattnig S, Regatte RR, Roemer FW. Compositional MRI techniques for evaluation of cartilage degeneration in osteoarthritis. Osteoarthritis Cartilage. 2015;23:1639-1653. [DOI] [PubMed] [Google Scholar]
- 35. Guermazi A, Hayashi D, Jarraya M, et al. Medial posterior meniscal root tears are associated with development or worsening of medial tibiofemoral cartilage damage: the multicenter osteoarthritis study. Radiology. 2013;268:814-821. [DOI] [PMC free article] [PubMed] [Google Scholar]
- 36. Guermazi A, Hayashi D, Roemer FW, et al. Synovitis in knee osteoarthritis assessed by contrast-enhanced magnetic resonance imaging (MRI) is associated with radiographic tibiofemoral osteoarthritis and MRI-detected widespread cartilage damage: the MOST study. J Rheumatol. 2014;41:501-508. [DOI] [PMC free article] [PubMed] [Google Scholar]
- 37. Guermazi A, Niu J, Hayashi D, et al. Prevalence of abnormalities in knees detected by MRI in adults without knee osteoarthritis: population based observational study (Framingham Osteoarthritis Study). BMJ. 2012;345:e5339. [DOI] [PMC free article] [PubMed] [Google Scholar]
- 38. Guermazi A, Roemer FW, Alizai H. State of the art: MR imaging after knee cartilage repair surgery. Radiology. 2015;277:23-43. [DOI] [PubMed] [Google Scholar]
- 39. Guermazi A, Roemer FW, Crema MD, Englund M, Hayashi D. Imaging of non-osteochondral tissues in osteoarthritis. Osteoarthritis Cartilage. 2014;22:1590-1605. [DOI] [PubMed] [Google Scholar]
- 40. Hall M, Doherty S, Courtney P, Latief K, Zhang W, Doherty M. Synovial pathology detected on ultrasound correlates with the severity of radiographic knee osteoarthritis more than with symptoms. Osteoarthritis Cartilage. 2014;22:1627-1633. [DOI] [PMC free article] [PubMed] [Google Scholar]
- 41. Harris MD, Datar M, Whitaker RT, Jurrus ER, Peters CL, Anderson AE. Statistical shape modeling of cam femoroacetabular impingement. J Orthop Res. 2013;31:1620-1626. [DOI] [PMC free article] [PubMed] [Google Scholar]
- 42. Haugen IK, Lillegraven S, Slatkowsky-Christensen B, et al. Hand osteoarthritis and MRI: development and first validation step of the proposed Oslo Hand Osteoarthritis MRI score. Ann Rheum Dis. 2011;70:1033-1038. [DOI] [PubMed] [Google Scholar]
- 43. Hawezi ZK, Lammentausta E, Svensson J, Roos EM, Dahlberg LE, Tiderius CJ. Regional dGEMRIC analysis in patients at risk of osteoarthritis provides additional information about activity related changes in cartilage structure. Acta Radiol. 2016;57:468-474. [DOI] [PubMed] [Google Scholar]
- 44. Hayashi D, Roemer FW, Katur A, et al. Imaging of synovitis in osteoarthritis: current status and outlook. Semin Arthritis Rheum. 2011;41:116-130. [DOI] [PubMed] [Google Scholar]
- 45. Helmick CG, Felson DT, Lawrence RC, et al. Estimates of the prevalence of arthritis and other rheumatic conditions in the United States. Part I. Arthritis Rheum. 2008;58:15-25. [DOI] [PubMed] [Google Scholar]
- 46. Hunter DJ, Arden N, Conaghan PG, et al. Definition of osteoarthritis on MRI: results of a Delphi exercise. Osteoarthritis Cartilage. 2011;19:963-969. [DOI] [PMC free article] [PubMed] [Google Scholar]
- 47. Hunter DJ, Guermazi A, Lo GH, et al. Evolution of semi-quantitative whole joint assessment of knee OA: MOAKS (MRI Osteoarthritis Knee Score). Osteoarthritis Cartilage. 2011;19:990-1002. [DOI] [PMC free article] [PubMed] [Google Scholar]
- 48. Johnson VL, Hunter DJ. The epidemiology of osteoarthritis. Best Pract Res Clin Rheumatol. 2014;28:5-15. [DOI] [PubMed] [Google Scholar]
- 49. Juras V, Zbýnˇ Š, Mlynarik V, et al. The compositional difference between ankle and knee cartilage demonstrated by T2 mapping at 7 Tesla MR. Eur J Radiol. 2016;85:771-777. [DOI] [PubMed] [Google Scholar]
- 50. Kalichman L, Kim DH, Li L, Guermazi A, Hunter DJ. Computed tomography-evaluated features of spinal degeneration: prevalence, intercorrelation, and association with self-reported low back pain. Spine J. 2010;10:200-208. [DOI] [PMC free article] [PubMed] [Google Scholar]
- 51. Kellgren J, Lawrence J. Radiological assessment of osteoarthritis. Ann Rheum Dis. 1957;16:494. [DOI] [PMC free article] [PubMed] [Google Scholar]
- 52. Kogan F, Hariharan H, Reddy R. Chemical exchange saturation transfer (CEST) imaging: description of technique and potential clinical applications. Curr Radiol Rep. 2013;1:102-114. [DOI] [PMC free article] [PubMed] [Google Scholar]
- 53. Kornaat PR, Ceulemans RY, Kroon HM, et al. MRI assessment of knee osteoarthritis: Knee Osteoarthritis Scoring System (KOSS)—inter-observer and intra-observer reproducibility of a compartment-based scoring system. Skeletal Radiol. 2005;34:95-102. [DOI] [PubMed] [Google Scholar]
- 54. Kumar D, Wyatt CR, Lee S, et al. Association of cartilage defects, and other MRI findings with pain and function in individuals with mild-moderate radiographic hip osteoarthritis and controls. Osteoarthritis Cartilage. 2013;21:1685-1692. [DOI] [PMC free article] [PubMed] [Google Scholar]
- 55. Lee S, Nardo L, Kumar D, et al. Scoring hip osteoarthritis with MRI (SHOMRI): a whole joint osteoarthritis evaluation system. J Magn Reson Imaging. 2014;1557:1549-1557. [DOI] [PMC free article] [PubMed] [Google Scholar]
- 56. Li H, Hosseini A, Li JS, Gill TJ, 4th, Li G. Quantitative magnetic resonance imaging (MRI) morphological analysis of knee cartilage in healthy and anterior cruciate ligament-injured knees. Knee Surg Sports Traumatol Arthrosc. 2012;20:1496-1502. [DOI] [PMC free article] [PubMed] [Google Scholar]
- 57. Li H, Tao H, Hua Y, Chen J, Li Y, Chen S. Quantitative magnetic resonance imaging assessment of cartilage status: a comparison between young men with and without anterior cruciate ligament reconstruction. Arthroscopy. 2013;29:2012-2019. [DOI] [PubMed] [Google Scholar]
- 58. Li X, Cheng J, Lin K, et al. Quantitative MRI using T1ρ and T2 in human osteoarthritic cartilage specimens: correlation with biochemical measurements and histology. Magn Reson Imaging. 2011;29:324-334. [DOI] [PMC free article] [PubMed] [Google Scholar]
- 59. Li X, Majumdar S. Quantitative MRI of articular cartilage and its clinical applications. J Magn Reson Imaging. 2013;38:991-1008. [DOI] [PMC free article] [PubMed] [Google Scholar]
- 60. Liebl H, Joseph G, Nevitt MC, et al. Early T2 changes predict onset of radiographic knee osteoarthritis: data from the osteoarthritis initiative. Ann Rheum Dis. 2015;74:1353-1359. [DOI] [PMC free article] [PubMed] [Google Scholar]
- 61. Link TM, Mischung J, Wörtler K, Burkart A, Rummeny EJ, Imhoff AB. Normal and pathological MR findings in osteochondral autografts with longitudinal follow-up. Eur Radiol. 2006;16:88-96. [DOI] [PubMed] [Google Scholar]
- 62. Lo GH, McAlindon TE, Niu J, et al. Bone marrow lesions and joint effusion are strongly and independently associated with weight-bearing pain in knee osteoarthritis: data from the osteoarthritis initiative. Osteoarthritis Cartilage. 2009;17:1562-1569. [DOI] [PMC free article] [PubMed] [Google Scholar]
- 63. Lynch JA, Roemer FW, Nevitt MC, et al. Comparison of BLOKS and WORMS scoring systems part I. Cross sectional comparison of methods to assess cartilage morphology, meniscal damage and bone marrow lesions on knee MRI: data from the osteoarthritis initiative. Osteoarthritis Cartilage. 2010;18:1393-1401. [DOI] [PMC free article] [PubMed] [Google Scholar]
- 64. Madelin G, Jerschow A, Regatte RR. Sodium relaxation times in the knee joint in vivo at 7T. NMR Biomed. 2012;25:530-537. [DOI] [PMC free article] [PubMed] [Google Scholar]
- 65. Marlovits S, Singer P, Zeller P, Mandl I, Haller J, Trattnig S. Magnetic resonance observation of cartilage repair tissue (MOCART) for the evaluation of autologous chondrocyte transplantation: determination of interobserver variability and correlation to clinical outcome after 2 years. Eur J Radiol. 2006;57:16-23. [DOI] [PubMed] [Google Scholar]
- 66. Mithoefer K, McAdams T, Williams RJ, Kreuz PC, Mandelbaum BR. Clinical efficacy of the microfracture technique for articular cartilage repair in the knee: an evidence-based systematic analysis. Am J Sports Med. 2009;37:2053-2063. [DOI] [PubMed] [Google Scholar]
- 67. Mithoefer K, Williams RJ, 3rd, Warren RF, et al. The microfracture technique for the treatment of articular cartilage lesions in the knee. J Bone Joint Surg. 2005;87:1911-1920. [DOI] [PubMed] [Google Scholar]
- 68. Nardo L, Carballido-Gamio J, Tang S, Lai A, Krug R. Quantitative assessment of morphology, T1ρ, and T2 of shoulder cartilage using MRI [published online March 18, 2016]. Eur Radiol. doi: 10.1007/s00330-016-4322-6. [DOI] [PMC free article] [PubMed] [Google Scholar]
- 69. Neumann G, Mendicuti AD, Zou KH, et al. Prevalence of labral tears and cartilage loss in patients with mechanical symptoms of the hip: evaluation using MR arthrography. Osteoarthritis Cartilage. 2007;15:909-917. [DOI] [PubMed] [Google Scholar]
- 70. Nieminen MT, Töyräs J, Rieppo J, et al. Quantitative MR microscopy of enzymatically degraded articular cartilage. Magn Reson Med. 2000;43:676-681. [DOI] [PubMed] [Google Scholar]
- 71. Nishii T, Tanaka H, Sugano N, Miki H, Takao M, Yoshikawa H. Disorders of acetabular labrum and articular cartilage in hip dysplasia: evaluation using isotropic high-resolutional CT arthrography with sequential radial reformation. Osteoarthritis Cartilage. 2007;15:251-257. [DOI] [PubMed] [Google Scholar]
- 72. Nishioka H, Hirose J, Nakamura E, et al. T1ρ and T2 mapping reveal the in vivo extracellular matrix of articular cartilage. J Magn Reson Imaging. 2012;35:147-155. [DOI] [PubMed] [Google Scholar]
- 73. Pelletier J-P, Cooper C, Peterfy C, et al. What is the predictive value of MRI for the occurrence of knee replacement surgery in knee osteoarthritis? Ann Rheum Dis. 2013;72:1594-1604. [DOI] [PubMed] [Google Scholar]
- 74. Peterfy CG, Guermazi A, Zaim S, et al. Whole-organ magnetic resonance imaging score (WORMS) of the knee in osteoarthritis. Osteoarthritis Cartilage. 2004;12:177-190. [DOI] [PubMed] [Google Scholar]
- 75. Porta F, Radunovic G, Vlad V, et al. The role of Doppler ultrasound in rheumatic diseases. Rheumatology (Oxford). 2012;51:976-982. [DOI] [PubMed] [Google Scholar]
- 76. Prasad A, Nardo L, Schooler J, Joseph G, Link T. T1ρ and T2 relaxation times predict progression of knee osteoarthritis. Osteoarthritis Cartilage. 2013;21:69-76. [DOI] [PMC free article] [PubMed] [Google Scholar]
- 77. Raya JG. Techniques and applications of in vivo diffusion imaging of articular cartilage. J Magn Reson Imaging. 2015;41:1487-1504. [DOI] [PMC free article] [PubMed] [Google Scholar]
- 78. Raya JG, Arnoldi AP, Weber DL, et al. Ultra-high field diffusion tensor imaging of articular cartilage correlated with histology and scanning electron microscopy. MAGMA. 2011;24:247-258. [DOI] [PubMed] [Google Scholar]
- 79. Raya JG, Melkus G, Adam-Neumair S, et al. Diffusion-tensor imaging of human articular cartilage specimens with early signs of cartilage damage. Radiology. 2013;266:831-841. [DOI] [PubMed] [Google Scholar]
- 80. Raynauld J, Martel-Pelletier J, Haraoui B, et al. Risk factors predictive of joint replacement in a 2-year multicentre clinical trial in knee osteoarthritis using MRI: results from over 6 years of observation. Ann Rheum Dis. 2011;70:1382-1388. [DOI] [PubMed] [Google Scholar]
- 81. Raynauld JP, Martel-Pelletier J, Beaulieu A, et al. An open-label pilot study evaluating by magnetic resonance imaging the potential for a disease-modifying effect of celecoxib compared to a modelized historical control cohort in the treatment of knee osteoarthritis. Semin Arthritis Rheum. 2010;40:185-192. [DOI] [PubMed] [Google Scholar]
- 82. Regatte RR, Akella SVS, Lonner JH, Kneeland JB, Reddy R. T1ρ relaxation mapping in human osteoarthritis (OA) cartilage: comparison of T1rho with T2. J Magn Reson Imaging. 2006;23:547-553. [DOI] [PubMed] [Google Scholar]
- 83. Rehnitz C, Kupfer J, Streich NA, et al. Comparison of biochemical cartilage imaging techniques at 3T MRI. Osteoarthritis Cartilage. 2014;22:1732-1742. [DOI] [PubMed] [Google Scholar]
- 84. Reiter DA, Lin P, Fishbein KW, Spencer RG. Multicomponent T2 relaxation analysis in cartilage. Magn Reson Med. 2009;61:803-809. [DOI] [PMC free article] [PubMed] [Google Scholar]
- 85. Riecke BF, Christensen R, Torp-Pedersen S, Boesen M, Gudbergsen H, Bliddal H. An ultrasound score for knee osteoarthritis: a cross-sectional validation study. Osteoarthritis Cartilage. 2014;22:1675-1691. [DOI] [PubMed] [Google Scholar]
- 86. Roemer FW, Eckstein F, Hayashi D, et al. The role of imaging in osteoarthritis. Best Pract Res Clin Rheumatol. 2014;28:31-60. [DOI] [PubMed] [Google Scholar]
- 87. Roemer FW, Guermazi A, Trattnig S, et al. Whole joint MRI assessment of surgical cartilage repair of the knee: cartilage repair osteoarthritis knee score (CROAKS). Osteoarthritis Cartilage. 2014;22:779-799. [DOI] [PubMed] [Google Scholar]
- 88. Roemer FW, Hunter DJ, Winterstein A, et al. Hip Osteoarthritis MRI Scoring System (HOAMS): reliability and associations with radiographic and clinical findings. Osteoarthritis Cartilage. 2011;19:946-962. [DOI] [PubMed] [Google Scholar]
- 89. Roemer FW, Kwoh CK, Hannon MJ, et al. Semiquantitative assessment of focal cartilage damage at 3 T MRI: a comparative study of dual echo at steady state (DESS) and intermediate-weighted (IW) fat suppressed fast spin echo sequences. Eur J Radiol. 2011;80:126-131. [DOI] [PubMed] [Google Scholar]
- 90. Roemer FW, Nevitt MC, Felson DT, et al. Predictive validity of within-grade scoring of longitudinal changes of MRI-based cartilage morphology and bone marrow lesion assessment in the tibio-femoral joint - the MOST study. Osteoarthritis Cartilage. 2012;20:1391-1398. [DOI] [PMC free article] [PubMed] [Google Scholar]
- 91. Runhaar J, Schiphof D, van Meer B, Reijman M, Bierma-Zeinstra SMA, Oei EHG. How to define subregional osteoarthritis progression using semi-quantitative MRI Osteoarthritis Knee Score (MOAKS). Osteoarthritis Cartilage. 2014;22:1533-1536. [DOI] [PubMed] [Google Scholar]
- 92. Scheele J, de Schepper EIT, Van Meurs JB, et al. Association between spinal morning stiffness and lumbar disc degeneration: the Rotterdam study. Osteoarthritis Cartilage. 2012;20:982-987. [DOI] [PubMed] [Google Scholar]
- 93. Siebelt M, Agricola R, Weinans H, Kim YJ. The role of imaging in early hip OA. Osteoarthritis Cartilage. 2014;22:1470-1480. [DOI] [PubMed] [Google Scholar]
- 94. Song IH, Althoff CE, Hermann KG, et al. Contrast-enhanced ultrasound in monitoring the efficacy of a bradykinin receptor 2 antagonist in painful knee osteoarthritis compared with MRI. Ann Rheum Dis. 2009;68:75-83. [DOI] [PubMed] [Google Scholar]
- 95. Sophia Fox AJ, Bedi A, Rodeo SA. The basic science of articular cartilage: structure, composition, and function. Sports Health. 2009;1:461-468. [DOI] [PMC free article] [PubMed] [Google Scholar]
- 96. Stehling C, Souza RB, Le Graverand MPH, et al. Loading of the knee during 3.0 T MRI is associated with significantly increased medial meniscus extrusion in mild and moderate osteoarthritis. Eur J Radiol. 2012;81:1839-1845. [DOI] [PMC free article] [PubMed] [Google Scholar]
- 97. Su F, Pedoia V, Teng H-L, et al. The association between MR T1ρ and T2 of cartilage and patient-reported outcomes after ACL injury and reconstruction. Osteoarthritis Cartilage. 2016;24:1180-1189. [DOI] [PMC free article] [PubMed] [Google Scholar]
- 98. Taljanovic MS, Graham AR, Benjamin JB, et al. Bone marrow edema pattern in advanced hip osteoarthritis: quantitative assessment with magnetic resonance imaging and correlation with clinical examination, radiographic findings, and histopathology. Skeletal Radiol. 2008;37:423-431. [DOI] [PubMed] [Google Scholar]
- 99. Teng H-L, Calixto NE, MacLeod TD, et al. Associations between patellofemoral joint cartilage T1ρ and T2 and knee flexion moment and impulse during gait in individuals with and without patellofemoral joint osteoarthritis [published online April 12, 2016]. Osteoarthritis Cartilage. doi: 10.1016/j.joca.2016.04.006. [DOI] [PMC free article] [PubMed] [Google Scholar]
- 100. Trattnig S, Ba-Ssalamah A, Pinker K, Plank C, Vecsei V, Marlovits S. Matrix-based autologous chondrocyte implantation for cartilage repair: noninvasive monitoring by high-resolution magnetic resonance imaging. Magn Reson Imaging. 2005;23:779-787. [DOI] [PubMed] [Google Scholar]
- 101. Trattnig S, Ohel K, Mlynarik V, Juras V, Zbyn S, Korner A. Morphological and compositional monitoring of a new cell-free cartilage repair hydrogel technology—GelrinC by MR using semi-quantitative MOCART scoring and quantitative T2 index and new zonal T2 index calculation. Osteoarthritis Cartilage. 2015;23:2224-2232. [DOI] [PubMed] [Google Scholar]
- 102. Trattnig S, Welsch GH, Juras V, et al. 23Na MR imaging at 7 T after knee matrix-associated autologous chondrocyte transplantation preliminary results. Radiology. 2010;257:175-184. [DOI] [PubMed] [Google Scholar]
- 103. Turmezei TD, Fotiadou A, Lomas DJ, Hopper MA, Poole KE. A new CT grading system for hip osteoarthritis. Osteoarthritis Cartilage. 2014;22:1360-1366. [DOI] [PubMed] [Google Scholar]
- 104. Van Tiel J, Bron EE, Tiderius CJ, et al. Reproducibility of 3D delayed gadolinium enhanced MRI of cartilage (dGEMRIC) of the knee at 3.0 T in patients with early stage osteoarthritis. Eur Radiol. 2013;23:496-504. [DOI] [PubMed] [Google Scholar]
- 105. Van Tiel J, Reijman M, Bos PK, et al. Delayed gadolinium-enhanced MRI of cartilage (dGEMRIC) shows no change in cartilage structural composition after viscosupplementation in patients with early-stage knee osteoarthritis. PLoS One. 2013;8(11):1-11. [DOI] [PMC free article] [PubMed] [Google Scholar]
- 106. Van Tiel J, Siebelt M, Waarsing JH, et al. CT arthrography of the human knee to measure cartilage quality with low radiation dose. Osteoarthritis Cartilage. 2012;20:678-685. [DOI] [PubMed] [Google Scholar]
- 107. Wang A, Pedoia V, Su F, et al. MR T1ρ and T2 of meniscus after acute anterior cruciate ligament injuries. Osteoarthritis Cartilage. 2016;24:631-639. [DOI] [PMC free article] [PubMed] [Google Scholar]
- 108. Wáng YX, Zhang Q, Li X, Chen W, Ahuja A, Yuan J. T1ρ magnetic resonance: basic physics principles and applications in knee and intervertebral disc imaging. Quant Imaging Med Surg. 2015;5:858-885. [DOI] [PMC free article] [PubMed] [Google Scholar]
- 109. Welsch GH, Zak L, Mamisch TC, Resinger C, Marlovits S, Trattnig S. Three-dimensional magnetic resonance observation of cartilage repair tissue (MOCART) score assessed with an isotropic three-dimensional true fast imaging with steady-state precession sequence at 3.0 Tesla. Invest Radiol. 2009;44:603-612. [DOI] [PubMed] [Google Scholar]
- 110. Widhalm HK, Apprich S, Welsch GH, et al. Optimized cartilage visualization using 7-T sodium (23Na) imaging after patella dislocation. Knee Surg Sports Traumatol Arthrosc. 2016;24:1601-1609. [DOI] [PubMed] [Google Scholar]
- 111. Wildi LM, Martel-Pelletier J, Abram F, Moser T, Raynauld JP, Pelletier JP. Assessment of cartilage changes over time in knee osteoarthritis disease-modifying osteoarthritis drug trials using semiquantitative and quantitative methods: pros and cons. Arthritis Care Res. 2013;65:686-694. [DOI] [PubMed] [Google Scholar]
- 112. Wildi LM, Raynauld J, Martel-Pelletier J, et al. Chondroitin sulphate reduces both cartilage volume loss and bone marrow lesions in knee osteoarthritis patients starting as early as 6 months after initiation of therapy: a randomised, double-blind, placebo-controlled pilot study using MRI. Ann Rheum Dis. 2011;70:982-989. [DOI] [PMC free article] [PubMed] [Google Scholar]
- 113. Williams A, Qian Y, Bear D, Chu CR. Assessing degeneration of human articular cartilage with ultra-short echo time (UTE) T2* mapping. Osteoarthritis Cartilage. 2010;18:539-546. [DOI] [PMC free article] [PubMed] [Google Scholar]
- 114. Wirth W, Buck R, Nevitt M, et al. MRI-based extended ordered values more efficiently differentiate cartilage loss in knees with and without joint space narrowing than region-specific approaches using MRI or radiography—data from the OA initiative. Osteoarthritis Cartilage. 2011;19:689-699. [DOI] [PMC free article] [PubMed] [Google Scholar]
- 115. Wirth W, Eckstein F. A technique for regional analysis of femorotibial cartilage thickness based on quantitative magnetic resonance imaging. IEEE Trans Med Imaging. 2008;27:737-744. [DOI] [PubMed] [Google Scholar]
- 116. Wirth W, Hellio Le, Graverand MP, Wyman BT, et al. Regional analysis of femorotibial cartilage loss in a subsample from the Osteoarthritis Initiative progression subcohort. Osteoarthritis Cartilage. 2009;17:291-297. [DOI] [PMC free article] [PubMed] [Google Scholar]
- 117. Wyler A, Bousson V, Bergot C, et al. Hyaline cartilage thickness in radiographically normal cadaveric hips: comparison of spiral CT arthrographic and macroscopic measurements. Radiology. 2007;242:441-449. [DOI] [PubMed] [Google Scholar]
- 118. Zaid M, Lansdown D, Su F, et al. Abnormal tibial position is correlated to early degenerative changes one year following ACL reconstruction. J Orthop Res. 2015;33:1079-1086. [DOI] [PMC free article] [PubMed] [Google Scholar]
- 119. Zhao J, Li X, Bolbos RI, Link TM, Majumdar S. Longitudinal assessment of bone marrow edema-like lesions and cartilage degeneration in osteoarthritis using 3 T MR T1rho quantification. Skeletal Radiol. 2010;39:523-531. [DOI] [PMC free article] [PubMed] [Google Scholar]
- 120. Zhong H, Miller DJ, Urish KL. T2 map signal variation predicts symptomatic osteoarthritis progression: data from the Osteoarthritis Initiative. Skeletal Radiol. 2016;45:909-913. [DOI] [PMC free article] [PubMed] [Google Scholar]
- 121. Zilkens C, Miese F, Kim YJ, et al. Three-dimensional delayed gadolinium-enhanced magnetic resonance imaging of hip joint cartilage at 3 T: a prospective controlled study. Eur J Radiol. 2012;81:3420-3425. [DOI] [PubMed] [Google Scholar]
- 122. Zilkens C, Tiderius CJ, Krauspe R, Bittersohl B. Current knowledge and importance of dGEMRIC techniques in diagnosis of hip joint diseases. Skeletal Radiol. 2015;44:1073-1083. [DOI] [PubMed] [Google Scholar]