

Abstract
Insulin and insulin-like growth factor I (IGF1) influence cancer risk and progression through poorly understood mechanisms. To better understand the roles of insulin and IGF1 signaling in breast cancer, we combined proteomic screening with computational network inference to uncover differences in IGF1 and insulin induced signaling. Using reverse phase protein array, we measured the levels of 134 proteins in 21 breast cancer cell lines stimulated with IGF1 or insulin for up to 48 h. We then constructed directed protein expression networks using three separate methods: (i) lasso regression, (ii) conventional matrix inversion, and (iii) entropy maximization. These networks, named here as the time translation models, were analyzed and the inferred interactions were ranked by differential magnitude to identify pathway differences. The two top candidates, chosen for experimental validation, were shown to regulate IGF1/insulin induced phosphorylation events. First, acetyl-CoA carboxylase (ACC) knock-down was shown to increase the level of mitogen-activated protein kinase (MAPK) phosphorylation. Second, stable knock-down of E-Cadherin increased the phospho-Akt protein levels. Both of the knock-down perturbations incurred phosphorylation responses stronger in IGF1 stimulated cells compared with insulin. Overall, the time-translation modeling coupled to wet-lab experiments has proven to be powerful in inferring differential interactions downstream of IGF1 and insulin signaling, in vitro.
Insulin (Ins) 1 and type I insulin-like growth factor (IGF1) receptors (InsR and IGF1R, respectively) are receptor tyrosine kinases that are expressed in almost all types of cells. Signaling through InsR and IGF1R initiates a phosphorylation cascade that drives cell growth and proliferation (1–8). Overexpression of these receptors is correlated with higher breast cancer risk (9–15) and has been shown to influence tumorigenesis, metastasis, and resistance to existing forms of cancer therapy (10, 16, 17). IGF receptor blockade can slow tumor growth and metastasis, but the receptor has proven to be difficult to target specifically (18–20). A confounding factor in developing therapies targeting these receptors is their high sequence (∼60%) and structural homology. IGF1R and InsR are able to form functional hybrids, and each can partially compensate for the loss or suppression of the other (1–4, 21–24). Moreover, it has been shown that IGF1R signaling is one mechanism of resistance to conventional hormonal therapy (19, 25–29). Understanding the relationships between IGF1R and InsR signaling cascades and their combinatorial role in cancer is crucial to developing better diagnostics and personalized treatments for cancer.
In order to gain insight into cellular signaling networks, a method of tracking the evolution of multiple cellular features in time is required. Advances in experimental procedures and instruments have led to the development of proteomics approaches such as mass spectrometry (8) and live cell imaging (30) that enable the quantification of the levels of multiple proteins across large numbers of samples. Similarly, reverse phase protein array (RPPA) is a high-throughput technique that provides quantification of expression levels of total proteins as well as specific phosphorylated forms (31). Researchers have already used the power of RPPA toward biomarker prediction (32), classification of responses to diverse inputs (33), and study of drug responsiveness (34). In this study, RPPA data obtained from IGF1 and Ins stimulated breast cancer cell lines (n = 21) over a 48 h time course was utilized to construct models of time translation to characterize important differential dynamics and interactions present downstream of two structurally similar yet functionally different growth factors.
High throughput data sets have been the subject of computational modeling for well over a decade. Early linear models applied to gene expression data were able to extract clear signals from superficially noisy time-series data. Conventional tools and methods for studying temporal dynamics of genomic data (35) and pathways (36) often rely on sophisticated machine learning techniques that provide high accuracy at the cost of clarity. The utility of simpler linear models is that their results can be interpreted in terms of known biology. Whereas complex models may tend to obfuscate their inner workings, linear models connect components directly to each other in an unambiguous fashion. Application of linear elastic network models (ENM) in structural biology, for instance, enables one to analyze very large systems by lowering complexity (37–39). Coarse-grained motions and equilibrium dynamics can be recapitulated with very high accuracy using reductionist models. These and other studies (40–42) have shown that simple, cheaper, and faster approaches are valuable in beginning to understand and apply current knowledge to drive better models of biological systems.
Over the last few decades, the progression from static to time-series data has enabled researchers to infer rates of change of state variables, to find causal interactions in-between, and to study collective system dynamics. The algorithms and protocols to analyze the time-dependent data generated have been expanding in parallel, especially with the invention and development of microarray technology, and a variety of tools and methods are available for studying temporal dynamics (35). Although most of the techniques are based on the genomic data, they are applicable to other types of temporal data as well. These methods span a large set of approaches, including both linear and nonlinear models (43–50). Linear models, like ones performed in studies focusing on construction of circadian gene regulation or interaction network topologies (48, 51), serve as tools of easy implementation and interpretation.
Here, we use a simple yet intuitive linear model to explore the time evolution of protein expression profiles in breast cancer cell lines stimulated with IGF1 or Ins. Using the lasso algorithm trained on the time-series RPPA expression profiles, we construct temporal networks of effective interactions between signaling proteins. Analyzing the resultant networks, we find novel temporal differences in cellular response to IGF1 and insulin stimulation. The approach generates a set of predictions that are validated using wet-lab perturbation experiments.
MATERIALS AND METHODS
Cell Culture and Reverse Phase Protein Array
The initial data set (supplemental Table S1, also deposited in NCBI's Gene Expression Omnibus (GEO) (52) database with series accession number GSE80233) used here was generated at the RPPA Core Facility (MD Anderson Cancer Center, Houston, TX) (34, 53, 54). Twenty-one breast cancer cell lines (supplemental Table S2) were cultured in DMEM, DMEM/F-12, RPMI, L15 or McCoys 5A media supplemented with 10% FBS or horse serum according to the conditions provided by Neve et al. (55). Cells were plated in triplicate 6 cm dishes per treatment time point and then switched to serum-free medium (SFM). Cells were serum starved for 24 h, then treated with 10 nm IGF1 (Novozymes, Franklinton, NC) or Ins (Sigma, St. Louis, MO) for 5m, 10m, 30m, 6h, 24h, and 48h. Cells treated with vehicle (Vhc), the serum-free control were collected at 5m, 24h, and 48 h. Cell lysates were harvested by washing in ice-cold PBS twice, and lysing immediately in RPPA lysis buffer with protease inhibitor (1% Triton X-100, 50 mm Hepes, 150 mm NaCl, 1.5 mm MgCl2, 1 mm EGTA, 100 mm NaF, 10 mm NaPPi, 10% Glycerol, 1 mm Na3VO4, 1 mm PMSF, 10 μg/ml Aprotinin). Lysates were sonicated and centrifuged at 14,000 rpm at 4 °C for 10 min. Protein concentrations were determined by BCA. Then, lysates were mixed with 4X SDS/2-ME sample buffer to have final concentration of 1 μg/ml. The lysates were boiled for 5 min and diluted twofold five times. The diluted lysates were arrayed on nitrocellulose-coated FAST slides (GE Healthcare, Chicago, IL). Each slide was probed with a primary antibody and a biotin-conjugated secondary antibody. Levels of 134 proteins or phospho-proteins were measured using corresponding antibodies. The signal, amplified by DakoCytomation-catalyzed system (Dako, Carpinteria, CA), was visualized by DAB colorimetric reaction. The slides were scanned and quantified using Microvigene (VigeneTech, Carlisle, MA) software. Supercurve fitting was used for loading correction of each sample (56).
Quality Control of RPPA Antibodies
We performed an internal quality control on the specificity and validity of the 134 antibodies used in the RPPA data generation. This step included a condition of obtaining a single or dominant band for the antibody in question on Western blots ran for the dynamic range conditions of RPPA data. Then, a Pearson correlation coefficient of 0.8 between RPPA and WB results was used as cutoff to determine if the antibody is specific enough for the intended target. The RPPA Core Facility (57) also considers intra- and inter-slide reproducibility for the antibodies. They update their list of available reliable antibodies regularly based on experiences in hundreds of conditions and cell lines. Finally, 26 of the antibodies were labeled not specific enough under the specific experimental conditions, and are excluded from all subsequent analyses.
siRNA Knock-down and Immunoblotting
The HCC1569 and MCF7 cell lines were acquired from ATCC and grown in RPMI+10% FBS. ACACA and ACACB (gene names for acetyl-coenzyme-A carboxylase isoforms) pooled siRNAs (Dharmacon, Lafayette, CO) were reverse transfected with Lipofectamine RNAi MAX, following the manufacturer's protocol (Life Technologies, Waltham, MA), with a final concentration of 25 nm. T47D cells acquired from ATCC were stably transfected with shRenilla and shCDH1 (CDH1: E-Cadherin gene name) constructs using a retroviral infection and were grown in RPMI+10% FBS with 1 μg/ml puromycin. Cells were serum starved for 24 h then stimulated with 10 nm IGF1 or insulin for 5 min, 10 min, 30 min, and 6 h time points. 10 nm HCl was used as a vehicle control. Protein lysates were collected with RIPA buffer containing protease and phosphatase inhibitors, and standard immunoblot techniques were used to evaluate protein expression. The pMAPK (Thr202/Tyr204; Cell Signaling, Danvers, MA, 1:1000), MAPK (Cell signaling, 1:1000), pAkt (Ser473; Cell signaling; 1:1000), Akt (Cell signaling; 1:1000), E-cadherin (BD Biosciences, San Jose, CA; 1:1000), ACC (Cell Signaling; 1:500) and β-actin (Sigma; 1:5000) antibodies were used. RNA was isolated using the Illustra RNAspin Mini Kit (GE Healthcare) and reverse transcription was done following the iScript cDNA synthesis kit protocol (BioRad, Hercules, CA). The SYBR green supermix protocol (BioRad) was used for qRT-PCR. Primers for ACACA (5′AAGAATCGGACTGGCAGAAG (fwd) and 5′ AATGGACAGAGTTGAGAGCAC (rev)),ACACAB (5′ ACCACATCTTCCTCAACTTCG (fwd) and 5′TGTTGATCTTGACCTCAGCC (rev)), and CDH1 (5′ GAACAGCACGTACACAGCCCT (fwd) and 5′ GCAGAAGTGTCCCTGTTCCAG (rev)) were used to evaluate siRNA transfection efficiency.
Construction of Linear Statistical Models
Data Preprocessing
To reduce noise, we selected only proteins with large expression-level variance. We calculated the variance of each (phospho)-protein expression across all conditions and identified a variance cutoff that separates our antibody set into 43 high-variance proteins and 65 low-variance proteins. The 0.42 cutoff is empirically decided and is stable (supplemental Fig. S1), so that small changes in the cutoff value do not alter the number of proteins retained. We also showed that the data from triplicates are more similar to each other than the mean of triplicates across different conditions (supplemental Fig. S2). The Kolmogorov-Smirnov distance between the standard deviations of the triplicates and the standard deviation of the mean of triplicates across conditions is 0.98 (supplemental Fig. S2). In addition, when we performed one-way ANOVA on the filtered RPPA data for every condition separately, the results indicated that the mean of triplicate measurements across proteins are significantly different (highest p value ≈ 6e-26). As a result, we only used the mean of triplicate experiments in all subsequent analyses. The individual time point data sets (each of size (43 proteins) × (21 cell lines)) were then column centered, row-centered, and row-normalized in a step that causes minimal information loss.
The time-translation matrices constructed here satisfy the equation x(t2) = T x(t1), where the expression vector x(t) contains the levels of P proteins measured at time point t. The time translation matrix T is a square matrix that transforms protein expression levels from an early time point (t1) to a later one (t2). As any matrix that exactly transforms all the data from one time point to another is considered a valid time translation matrix, the problem of defining T is underdetermined if the number of measured proteins exceeds the number of samples. We investigated three different methods of calculating T from the data, each representing a constrained optimization.
Pseudoinversion
If we compile the N expression vectors at time t1 into the p × N matrix X(t1) and construct X(t2) similarly, then T is given by
where X−1(t2) is the pseudoinverse of X(t2) when N<P, as in the present case. The time translation matrix calculated this way minimizes the contribution to TC from the nullspace of X(t2). The steps of model, called SVD modeling, construction are depicted in Fig. 1A.
Fig. 1.

Three time-translation models are constructed. The overview of model construction steps is visualized. First, the data set was filtered, mean-centered, normalized, and partitioned into individual time point matrices. Three time-translation models were constructed for full (A) and leave-one-out analyses (B). (A) The construction steps of the three models. Construction of the TC model matrix using the joint covariance matrix, C (steps 1–4). Construction of the TM model matrix using entropy maximization (steps 1, 2, 5–7). Construction of TL model matrix using the lasso algorithm (steps 1, 8–10). Here, the glmnet package was called for each of the P protein expression vector, and the median matrix from an ensemble of R networks was selected as the model matrix (see Methods for details). These three matrices (steps 4, 7, 10) represent three models of time translation. (B) A leave-one-out cross validation (LOOCV) analysis was performed to check the validity of our approach. The information for test cell line (tan and red bars) was hidden and the model matrix was constructed via the scheme in (A). After the three time translation matrices are generated in either (A) or (B), they are used to calculate the expression profiles of the future time points using SFM condition data and corresponding T matrix.
Entropy Maximization
We can alternatively assume a distribution that maximizes entropy subject to the constraints of the data. We write the equation of probability for the expression value distributions:
 |
where M is the (pseudo)inverse of the joint-covariance matrix and Z is the partition sum and equal to (2π)P|M|(−1/2). M is the matrix of effective interactions between components of the expression matrices. The steps followed for time-translation matrices construction from the M matrix are also given in Fig. 1A, route 1-2-5-6-7 (the MaxEnt model). The details of model construction are given in Supplementary Materials.
Lasso Regression
The time translation (TT) matrix TL is obtained by an iterative application of the lasso algorithm (58, 59). For each row k of the data matrix, we calculate one row of the time translation matrix T and one component of the offset vector δ by numerically minimizing the quantity
where the summation over i minimizes the mean squared error and the last summation penalizes nonzero entries in the time-translation matrix, dictated by the positive-valued constant λ. The software used here calculates a set of λ values at the start of the cross-validation given the inputs (60). By penalizing the L1 norm of T, only a few nonzero coefficients are selected. The procedure is run independently for each row, and the coefficient arrays for every protein are concatenated to obtain TL = , where Tij represents the regression coefficient obtained for the effect of protein j at time t1 on the level of protein i at time t2. Ten thousand instances of the time translation matrix TL, each starting with a different random seed, are generated using the glmnet package (61). Edges that appear in at least half the matrices are considered essential and are used to select a representative matrix from the ensemble. The matrix that contains essential edges the most is selected as the representative the matrix. Route 1-8-9-10 in Fig. 1A schematically depicts the lasso model construction.
Validation of the Lasso Models
To validate the lasso approach and the interaction values it selects, we use randomly generated synthetic data. We find that the networks inferred from the RPPA data have fewer (typically about half as many) essential interactions than those generated from random synthetic data (supplemental Figs. S3 and S4). We further find that the distribution of interaction values inferred from synthetic data is normal (supplemental Fig. S5), whereas those inferred from the experimental data contain a few very high values and a long tail. Moreover, we show that the number of edges inferred is robust against the number networks generated, and that the number of edges in the representative network converges to the number of accepted edges when 10,000 networks are generated (supplemental Fig. S6). In addition, we find the best candidate networks always contain high magnitude interactions both in Ins and IGF1 stimulation cases for full (supplemental Fig. S7) and leave-one-out cross validation (LOOCV) (supplemental Fig. S8) models. Finally, the TT matrices of lasso models for IGF1 and Ins conditions have multiple interaction elements in common (supplemental Fig. S9). The lists of inferred interactions for all time translation lasso models are given in supplemental Table S3.
Leave-one-out Cross Validation Models
To test the performance of the three models, we further employed a leave-one-out cross validation (LOOCV) scheme (Fig. 1B). In each LOOCV step, one cell line is excluded from the training set and the three TT models are constructed using the remaining cell lines only. The SFM expression profile of the removed cell line is used to predict its profile at the next time point. As a result, twenty-one LOOCV models are obtained for each time translation for each model. In the case of lasso models, hundred TT matrix instances are generated, and the ensemble median is selected as the representative model. Comparison of LOOCV model performances of the three methods on the same unseen data enabled us to evaluate the robustness of models.
Statistical Analysis
Standard one-way ANOVA was performed on the RPPA data, considering each condition separately. The analyses were done for the triplicate measurements of a cell line, with one stimulation condition at a specific time point. Statistical analysis on the validation experimental results was performed using two-sample t test with significance level of p < 0.05. Unless otherwise indicated, the values are presented as means ± S.E. (standard error of the mean). All of the simulations and analyses were run in Matlab, versions 2014a and 2015a (MathWorks, Natick, MA).
RESULTS
Data Analysis
The data set of this study contains expression levels for 134 proteins, either in total or in a specific phosphorylated form, in 21 breast cancer cell lines stimulated in biological triplicates with IGF1 or insulin for 0–48 h (see supplemental Table S2 for information on cell line subtypes (62)). Twenty-six antibodies were excluded from this study to have only an initial set of 108 proteins (see Methods). A cursory look at the data (Fig. 2) reveals that IGF1 stimulation induces phosphorylation of IGF1R at Tyr1135 in all cell lines. Half of the cell lines also exhibit a higher phosphorylation rate of Akt and its downstream protein targets, including ribosomal protein S6. The six time-point data for each cell line show expected responses, with pAkt levels peaking around 5–10 min and decreasing gradually afterward. The cell lines MCF7, MCF10A, T47D, and ZR751 were found to be highly IGF1 responsive (see supplemental Fig. S10 for complementary Ins stimulation results).
Fig. 2.

Time-course (phospho)-protein expression profiles of 21 breast cancer cell lines in response to IGF1. The change in the (phospho)-protein levels upon IGF1 stimulation are shown. The values represent the difference in log2 expression levels (stimulated - serum starved). IGF1R phosphorylation is induced in all cell lines in response to IGF1. RAS/MAPK and PI3K/Akt cascades are regulated downstream of IGF1R signaling. Six columns are shown for each cell line, each column representing one time point (5, 10, 30 min, 6, 24, 48 h). Red color corresponds to up-regulation and blue color represents down-regulation of the proteins compared with serum starved cells. Row headings indicate proteins or phospho-proteins with phosphorylation sites indicated after the subscript p.
The Lasso-based Models are Accurate and Robust
To discover signaling differences from the data, we constructed linear models of time translation (TT) using three different methods: (1) regression coefficients selected by the lasso algorithm (58) (lasso model), (2) conventional matrix inversion (SVD model), and (3) entropy maximization (MaxEnt model). Initially, the starting RPPA data set was filtered and pre-processed. First, the raw-expression profiles were variance-ranked and the top 43 phospho or total proteins were selected for all the subsequent analyses (see supplemental Table S4). Each procedure results in a time translation matrix, T, of size 43 × 43. The element Tij represents the effect that the level of protein j in unstimulated (serum-free medium, SFM) cells will have on the level of the protein i at a future time (see Methods and Fig. 1 for details of the model construction).
We obtain predicted expression profiles for each time point by multiplying expression profiles from the SFM condition by the corresponding TT matrix. We quantify the performance of the TT models by comparing the predicted expression profiles with the experimental data and through leave-one-out cross validation (LOOCV, Fig. 3). Briefly, in LOOCV one cell line is excluded from the training set, the TT models are constructed using the remaining cell lines, and the SFM expression profile of the removed cell line is used to predict its profile at the next time point. The SVD model performs perfectly on its own training set, but clearly overfits during LOOCV (Fig. 3). The lasso model performs relatively well on both the training set and LOOCV. On average (of all time points and conditions), the lasso models showed 0.95 correlation with the data in full modeling scheme (Fig. 3 and supplemental Fig. S11). In LOOCV analyses, they also performed well, with Pearson correlation coefficient values of 0.902 ± 0.005 for IGF1 and 0.895 ± 0.006 for Ins stimulated cases (supplemental Fig. S11). The MaxEnt results are not exact for either the training data or LOOCV and are worse than lasso predictions(R≈-0.6). In fact, we notice that the MaxEnt predictions have a negative correlation with experimentally measured values. Based on these performance results, the sparsity of the lasso matrices (supplemental Fig. S9), and the significance of the inferred interactions (see Methods for details), we selected the lasso model as the main model for experimental predictions.
Fig. 3.
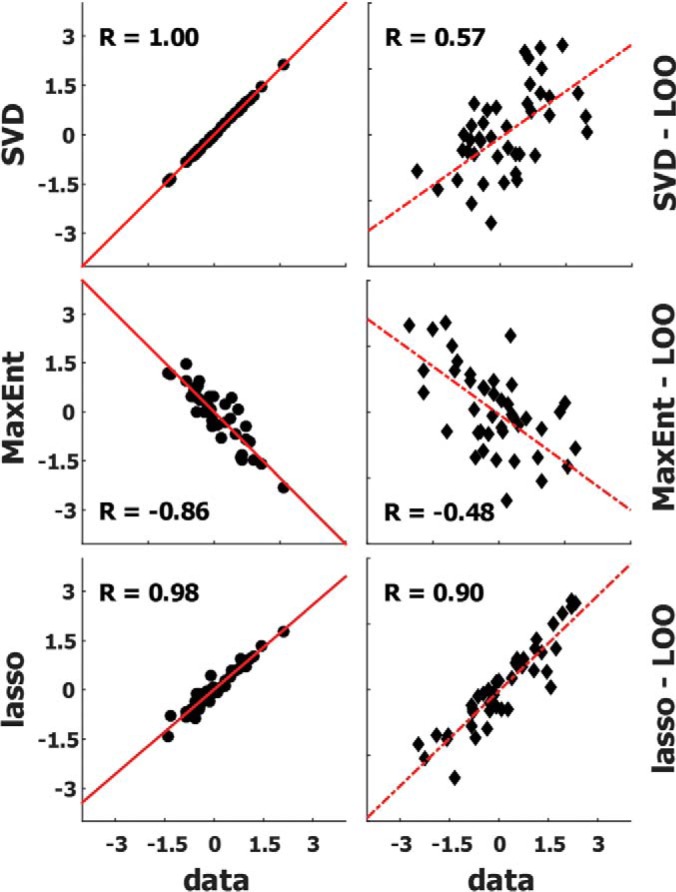
Performance analyses of the three models reveal that lasso models are accurate and robust. Three matrices were constructed for full (Fig. 1A) and LOOCV (Fig. 1B) models of each time translation. Correlation plots of data and prediction results from the three models for in-training (left) and leave-one-out cases (right) are shown. Black dots in the left panels represent data versus full model predictions, and black diamonds on the right represent the data versus LOOCV model predictions. The red lines are the least-square fits. The Pearson correlation coefficients are reported on each subpanel as R. Overall, the lasso models outperformed the other two methods. Modeling results of time translation for SFM to 10 min IGF1 stimulation in MCF7 cells shown as an example.
Differences between lasso-inferred interaction networks in IGF1 and Ins stimulated cells can be visually detected, as shown in Fig. 4 and supplemental Fig. S9. Both networks are sparse, and they have very few interactions in common. To verify that our method is robust, we compared the networks obtained through LOOCV with those constructed from the full data set. In the LOOCV, a TT matrix was constructed for excluding each cell line once, giving a total 21 LOOCV models for each time translation. The networks from these models overlap with the full model networks. Although the number of coinciding edges was dependent on cell lines, these results provide additional support that the lasso model inference was robust. The overlap of inferred interactions from the full and LOO models are presented in supplemental Fig. S12. Two representative LOOCV models constructed without the information for the corresponding cell lines are shown with comparison to full model interaction matrices. The mean Jaccard coefficients for comparison of LOOCV model networks with full model networks are 0.65 (±0.063) and 0.64 (±0.065) for IGF1 and insulin cases, respectively. These numbers mean that out of the interactions inferred for full and LOOCV models, on average 65% of them are found in both of the corresponding time point models and that the lasso models are robust in interaction inference. Additionally, the lasso model matrices are 83% (±2) sparse both in full and LOOCV models.
Fig. 4.

The lasso modeling inferred network of interactions in IGF1/Ins signaling pathways. The interactions inferred by the lasso model for SFM to 10 min stimulation are depicted. The purple edges are the top 20 exclusive interactions present in IGF1 model only. The blue edges are the interactions inferred only in the insulin model. The red edges represent the interactions present in both models whereas the magnitudes are stronger in the IGF1 model. The black edges are the ones with higher magnitudes in the Ins model. The yellow nodes are the two phospho-proteins taken as the outputs for the experimental validations.
Lasso-inferred Interactions are Experimentally Validated
We constructed six TT matrices for IGF1 and six matrices for Ins using the mean SFM condition data as X(t1) and data from each stimulation time point as X(t2) (see Methods). In this setting, the TT matrices reflect the interactions from time zero to the end of hormone stimulation. We used SFM as the starting point for all TT calculations because SFM protein levels can be experimentally controlled, enabling us to validate model predictions.
The interaction values of the TT matrices reflect the effect of synthetically knocking down a protein. If one perturbs the interaction values of a protein (a column in the TT matrix) and predicts how the responses deviate from the data, the results are correlated with the magnitudes of the inferred interaction constant. These observations led to the study of the individual interaction values only. First, the set of nonself-interactions present in TT matrices of both IGF1 and Ins stimulation cases were determined (96, 87, 98, 78, 62, and 85 interactions found for time points 1–6, respectively). The list was filtered to retain only pairs of interactions having either phospho-Akt (pAkt) or phospho-MAPK (pMAPK) as outputs because these are two of the major downstream mediators of IGF1 and Ins signaling. Finally, for each time point the interactions were ranked by differential response to IGF and Ins (i.e. for each interaction in each time point, the quantity was calculated, where TTx is the response in condition x). The depiction of the top exclusive interactions for IGF1 and insulin cases as well as the top differential interactions revealed how complex our study system is (Fig. 4).
Our model identifies a number of previously known interactions. For instance, the magnitudes of the inferred interactions between PKCα - pPKCα and between Rb1 - pRb1 are among the highest strength interactions. These indicate that the level of nonphosphorylated proteins in unstimulated cells influences the level of phosphorylated proteins of the same protein at later times (see supplemental Table S5 for more such interactions). It is also important to note that the existence of these two interactions reflects on the importance of the roles of PKCα and Rb1 in cancer progression and transcriptional regulation, modulated downstream of IGF1 and Ins signaling (63–68). Additionally, the inferred interaction of Rb1 level affecting pRb1 level is the only nonself interaction present in all eight (four IGF1, four Ins) lasso models up to 6 h, pointing out the importance and critical role of Rb1 regulation. Other such interactions are also uncovered by the model, including the levels of phosphorylated Akt (69), EGFR (70, 71), and HER2 (72, 73) depending on the total protein level in SFM condition.
Our method also predicts several interactions (supplemental Table S6) that are neither reported in the literature nor in databases like STRING (74). For example, a STRING search using the 42 gene names (supplemental Table S1) corresponding to the 43 proteins used in this study produces a network of 49 edges based on a confidence cutoff of 0.9 and evidence only from experiments. None of the interactions reported in Table I and supplemental Table S6 are in that list. When the STRING-based network is compared with our lasso models, there are 12 and 10 edges in common for IGF1 and Ins networks, respectively. The probabilities of having at least these many edges correctly assigned in a random network (calculated via the hypergeometric distribution) are PIGF = 0.021 and PIns = 0.063, suggesting that the lasso models capture more known interactions than would be expected at random. The list presented in Table I summarizes results from the lasso models. The first line indicates that phospho-ACC (pACC) levels are predicted to have a greater effect on the IGF1-induced phosphorylation of MAPK than on insulin-induced MAPK phosphorylation after 5 and 10 min of stimulation. The SVD model makes the same prediction, but extends it to 30 min after stimulation (supplemental Table S6). The MaxEnt model also predicts the effect for 5 min of stimulation (supplemental Table S6), but interestingly predicts that the effect is stronger because of insulin stimulation for 10 and 30 min stimulation. Importantly, all three models predict that altering levels of pACC in cells in SFM will impact levels of pMAPK upon IGF1 and Ins stimulation, and that the extent of the effect will depend on which growth factor is introduced. The interaction was also shown to be robust, appearing in 99.96% of networks (out of 40,000) generated for the first two time points for both insulin and IGF1 stimulation in LOOCV of the HCC1569 cell line. It is also important to note that our models do not discriminate between direct and indirect associations, so that the interactions that we observe may be mediated by other cell factors that are not measured in the current data set.
Table I. The perturbation experiment predictions from the lasso modeling. The experimentally studied perturbations are highlighted.
| Perturb | Measure | Lasso prediction (minutes) |
|---|---|---|
| ACC1/2 | MAPK_pThr202 | IGF1 (5, 10) |
| Cyclin B1 | MAPK_pThr202 | IGF1 (30) |
| ATM | Akt_pSer473 | Ins (5, 10, 30) |
| E-Cadherin | Akt_pSer473 | IGF1 (10, 30) |
| COX-2 | Akt_pSer473 | IGF1 (10, 30) |
| ATM | Akt_pThr308 | Ins (5, 10) |
We verified the differential influence of ACC using knock-down experiments. The two cell lines for the knock-down, MCF7 and HCC1569, were chosen because they have high pACC protein levels in the data, and also because both exhibit an expected MAPK response upon hormone stimulation. The immunoblot shown in Fig. 5A and the bar graph in Fig. 5C demonstrate that upon ACC1/2 siRNA knock-down in MCF7 cells, phospho-MAPK levels increased, and that the extent of the increase was different in IGF1- and Ins-stimulated cells. Compared with Scr cells, IGF1 stimulated cells with no active ACC1/2 showed higher MAPK phosphorylation, amounting to a 40% increase (p < 0.05) in fold-change level at 5 min. However, a twenty percent decrease in fold-change (p > 0.05) was observed in insulin stimulated cells, suggesting a higher proliferative IGF1 response compared with insulin induction. At 10 min, there was an insignificant down-regulation of the pMAPK response in ACC knock-down cells in both cases. Additionally, we showed that the ACC knock-down in HCC1569 cell line causes a significant change (70% increase in fold-change, p < 0.05) in IGF1 stimulated cells compared with an insignificant change (5% increase, p > 0.05) seen in Ins stimulated cells at 10 min (supplemental Fig. S13). Indeed, the differences in fold-change of relative pMAPK levels were larger in IGF1 stimulated cells for all time points in HCC1569 cells (supplemental Fig. S13).
Fig. 5.

The lasso model predictions are experimentally validated to show a differential effect of ACC knock-down on MAPK phosphorylation, and E-Cadherin knock-down on Akt phosphorylation levels. A, The representative Western blot for ACC knock-down in MCF7 cells at 5 and 10 min of stimulation, Scr = control cells, ACC = ACC-knock-down cells. The cells were stimulated with Vhc, IGF1, or Ins. The other experimental replicates are given in supplemental Fig. S14. B, The Western blot showing the change induced by stable E-Cadherin knock-down in T47D cells in response to 5 and 10 min IGF1 and Ins stimulation. Scr = control cells, CDH1 = E-Cadherin-knock-down cells. The cells were stimulated with Vhc, IGF1, or Ins. The efficiency of E-Cadherin knock-down is reported in supplemental Fig. S15. C, The quantification of Western blots given in (A), shown as relative values of pMAPK/MAPK normalized to Vhc treated Scr condition. D, The quantification of the Western blot in (b). Relative values of pAkt to total Akt, normalized by Vhc treated wild-type cells. The bars represent fold-changes from basal condition and results are shown as mean ± S.E. of two or three experimental replicates. The results are compared using unpaired, one-tailed two-sample t test, and p < 0.05 (*), p < 0.01 (**), p < 0.005 (***), nonsignificant (ns). The bars for each time point, from left-to-right: IGF1 stimulated WT cells, Ins stimulated WT cells, IGF1 stimulated knock-down cells, and Ins stimulated knock-down cells.
Another interesting prediction of our model is the differential effect of E-Cadherin expression levels on pAkt level induced by IGF and Ins. This is the top differential effect candidate for the 30 min time point, and was shown to be present in 97.35% of LOO networks constructed for 10 and 30 min stimulation of both growth factors. Figs. 5B and 5D show increased Akt activation upon E-Cadherin knockdown. The effect was more drastic in response to IGF1 than to Ins. Leading to higher growth signaling in stimulated cells, the loss of E-Cadherin induced an almost 2.5-fold increase in relative pAkt/Akt level in response to both IGF1 (p < 0.005) and Ins (p < 0.01) at 10 min. At 5 min, the change was significant again in both cases (p < 0.01 and p < 0.005, respectively). The magnitude of the increase in fold-change was twice in IGF1 stimulated cells compared with insulin induced cells both at 5 and 10 min.
DISCUSSION
In the present work, we analyzed temporal proteomic data to identify differences in the insulin and IGF1 signaling pathways in a large panel of human breast cancer cell lines. The data consist of protein expression levels generated by RPPA, collected at different times with IGF1 and Ins stimulation conditions. The transformation matrices obtained by the lasso approach differ significantly from matrices generated using randomized data in the number of interactions (supplemental Figs. S3 and S4), and in interaction magnitudes (supplemental Fig. S5). We predicted that knocking down ACC and E-cadherin would produce differential effects in Ins- and IGF1-stimulated cells, and we verified the predictions experimentally.
RPPA acquisition and analysis is still a growing area of research. Studies utilizing RPPA data have employed a diverse range of data (pre)processing and benchmarking methods, but no single protocol for processing RPPA data has yet been universally accepted (32–34, 75). Although inclusion of RPPA is still lacking, there are ongoing efforts to standardize and coordinate dissemination of different data types (76). Here, we mean-centered and standardized the protein arrays before model construction. This pre-processing enabled us to study the relative shapes of the time-course expression curves rather than of the amplitudes. Each sub-matrix of 43 proteins in 21 cell lines was processed separately, and three different models of time-translation were constructed for each pair (Fig. 1).
The lasso model TT matrices constructed for each time point pair were sparse (supplemental Fig. S9). They performed overall best among the three modeling schemes explored (SVD, MaxEnt, and lasso). The lasso algorithm provides a means of selecting a few good descriptor weights given input data, to recapture the output with minimal deviation (58, 60, 77–79). It was shown in Fig. 3 that the lasso models perform equally well in leave-one-out tests as in training-set tests. When compared with the other two models, the lasso model selected enough good descriptors during model construction to enable better predictions from unseen input data. The lasso models also contain fewer nonzero interactions than the other models, easing the burden of identifying biologically relevant interactions. This lasso procedure follows a gradient descent method that depends on a random seed. To minimize the influence of random effects on our results, a large number of matrices were generated and one representative canonical lasso matrix was selected based on the number of times that each of its elements is nonzero. Selection of this ensemble median network as the model representative is also useful in other applications, such as reconstruction of gene regulatory networks from microarray data (80, 81).
The covariance-matrix derived models (SVD) are analytical solutions of the training problem and suffer from overfitting. These models can recapture the response exactly for the training data, whereas outputs for nontraining-set inputs deviate from the real response considerably. The overfitting can be relaxed by invoking maximum entropy (MaxEnt models), but this gives rise to another problem: Because the number of proteins is larger than the number of cell lines the MaxEnt method does not exactly reproduce the training set data. Instead of predicting the training data exactly and the test data poorly, it generates mildly erroneous predictions for all data. Interestingly, we find that the data agree more closely with the inverse of the MaxEnt predictions than with the predictions themselves. This discrepancy between measured and modeled values occurs only when the number of proteins is greater than the number of conditions. If we use 20 proteins instead of 43, the data agree better with the MaxEnt solution than with its inverse. The MaxEnt matrix has been shown in earlier works to be more stable for systems for inputs with random noise (48). The lasso models outperformed maximum entropy models here, suggesting that the data are not drawn from a maximum entropy distribution.
Our model predictions were validated in multiple ways. First, existence of post-translational modifications in the translation matrices, i.e. effects of nonphosphorylated forms of PKCα and Rb1 on the levels of respective phosphorylated states, are important measures of validity of the models. Existence of such interactions over the time-course persistently shows that the lasso algorithm selects meaningful, nonrandom descriptors. Further validation comes from the presence of known interactions between kinase and substrate. Examples from the lasso model include the level of p70S6K affecting the level of phospho-S6 (82) and the predicted dependence of TSC2 phosphorylation level on the level of Akt present. TSC2 is phosphorylated in response to activation of Akt, leading to activation of mTORC1 complex (83). A third tier of validation is the set of results obtained from the in vitro knock-down experiments. The effects of ACC knock-down on pMAPK level and of E-Cadherin knock-down on pAkt level in response to IGF1 and Ins show that the model predictions are accurate. The fact that the aforementioned experimental candidates show differential results in IGF1 and Ins stimulation conditions validates the overall approach for elucidating novel interactions downstream of the two hormones.
ACC is involved in lipid metabolism, specifically in conversion of acetyl-CoA to malonyl-CoA. The latter is the building block of fatty acids and there is evidence tying ACC activity to the energetic state of the tumor microenvironment and cell survival (84, 85). Low energy states (high AMP/ATP ratio conditions) promote higher AMPK activity, inhibiting ACC1/2 by phosphorylation. The inhibition of ACC in turn leads to increased fatty acid oxidation and decreased lipid biosynthesis (85). It has been suggested that high levels of inactive pACC sustain NADPH (nicotinamide adenine dinucleotide phosphate), a reducing agent for biosynthetic reactions, at a high level, providing a better environment for tumor cell growth under stress. It has also been shown that the diabetic drug metformin activates AMPK, leading to an increase in pACC levels and consequently to higher insulin signaling and reduced insulin resistance (84). Although there is evidence linking pACC to cell growth and insulin signaling, we found no previously reported link between pACC and pMAPK. Our results are consistent with the previous results such that a decrease in ACC1/2 level promotes cell survival, although through an additional mechanism of action. This differential effect in response to IGF1 or Ins requires further study.
The following may be an example of our model identifying an indirect effect between proteins including E-Cadherin and Akt. There are controversial results reported so far, some stating that the presence of E-Cadherin junctions between cells recruits PI3K to the cell membrane, resulting in a higher activation of Akt in normal kidney and ovarian cancer cells (86, 87). Lau and colleagues, on the other hand, stated that endogenous E-Cadherin signaling negatively regulates Akt activation by sequestering beta-catenin leading to increased PTEN transcription and decreased Akt phosphorylation (88). Loss of E-Cadherin then releases beta-catenin for translocation into the nucleus leading to inhibition of PTEN transcription and thus up-regulation of Akt signaling. Complementarily, previous investigations showed that upon IGF1 treatment, increased pIGF1R and pAkt levels reduced E-Cadherin concentration and functioning (89–92). It was also shown that high cell-cell contact formation by E-Cadherin disrupted high affinity IGF1 binding to its receptor, resulting in lesser downstream activation (93, 94). Collectively, our lasso model prediction clearly has foundations in the literature but the differential effect in response to IGF1 and insulin has not been studied. Our results support the notion that loss of E-Cadherin induces pAkt and also coincide with the earlier works showing a relationship between IGF1 signaling and EMT (Epithelial-to-Mesenchymal Transition) through regulation of E-cadherin. Fig. 6 summarizes our hypothesized mechanisms of actions for ACC and E-Cadherin within the canonical cascades of IGF and Ins signaling.
Fig. 6.

Links between IGF1/Ins signaling, ACC and E-Cadherin. A, The canonical IGF1R/InsR signaling pathways comprised of MAPK and Akt cascades. B, The canonical signaling including newly hypothesized interactions based on validated predictions of TT modeling approach. The adherens junction formation sequesters beta-catenin, leading to a repressive effect on Akt activation. When free in cytosol and translocate to nucleus, beta-catenin inhibits PTEN translation, leading to higher activation of Akt. Activated Akt in return phosphorylates GSK3b, and cause a decrease in beta-catenin degradation. Phosphorylated Akt also turns on NF-kB signaling and inhibits E-Cadherin translation. E-Cadherin driven cell-cell contacts also were shown to repress high affinity ligand binding to the receptors, leading to diminished downstream signaling. On the other hand, ACC1 and ACC2 control fatty acid synthesis cascade, but here shown to affect MAPK phosphorylation in response to IGF1 and insulin stimulation.
Another interesting prediction of our lasso models was the effect of ATM on both phospho-forms of Akt (Table I). Earlier studies showed that ATM mediates full activation and downstream signaling of Akt under insulin and IGF1 stimulation in other tissue types (95–97). Our models are of note to infer edges from ATM to both pAkt proteins, where full activation of Akt is accomplished by dual phosphorylation of these sites. Further study of that interaction might spearhead new combination therapies with IGF1R inhibitors in breast cancer tumors. Indeed, very recently, researchers have shown that presence of kinase-domain mutations in ATM is a biomarker for Topo-isomerase I inhibitor therapy (98).
The main aim of the statistical modeling scheme introduced here was to extract information on important and differential interactions from available experimental data. Any dependence inferred reflects trends in the data enabling us to extrapolate the underlying correlations to new predictions. Such novel findings will potentially lead to new insights and understanding of the underlying mechanisms of IGF and insulin signaling (43). The experimentally validated interactions can further be explored to find better targets for anti-tumor response. One option is to incorporate these novel interactions into mechanistic models downstream of IGF1R or InsR signaling to study the system dynamics and pathway dysregulation mechanisms. Such studies are ongoing in our lab, but are not the focus of current paper, and a similar approach was studied by Iadevaia et al. using RPPA data of IGF1 stimulation in MDA-MB-231 cells (34).
The study of breast cancer prevention, diagnosis, and therapy is imperative. However, compensation and activating feedback mechanisms collectively depress the efficacy of anti-IGF1R/InsR therapies (11). Only after discerning the dual IGF1R/InsR system dynamics and novel components, will we be able to start to direct patients with suitable tumor subclasses toward more efficient personalized clinical interventions. The computationally scalable reverse-engineered models of cellular networks introduced here provided us with a framework to elucidate experimental targets of pharmacological importance in a cost effective way.
Supplementary Material
Footnotes
Author contributions: DLT, ALV and TRL designed the research; AMN, AJC, BCL and YW performed experiments; CE constructed all computational models; CE, AMN, DLT, AVL and TRL analyzed data and wrote the paper.
* This work was supported by the National Center for Advancing Translational Sciences at the National Institutes of Health under Award Number UH3TR0005032, by the Commonwealth of PA under Award Number SAP 4100062224, by NCI under Award Number P50CA058183 and R01CA94118, and by NIH under Award Number T32 GM008424. RPPA Core Facility, where the initial data set was generated, is funded by NCI Award Number CA16672. The content is solely the responsibility of the authors and does not necessarily represent the official views of the National Institutes of Health.
 This article contains supplemental material.
The authors declare that they have no competing interests.
1 The abbreviations used are:
- Ins
- Insulin
- ACC
- Acetyl-coenzyme-A carboxylase
- Akt
- Rac-alpha serine/threonine-protein kinase (Protein kinase B)
- AMP
- Adenosine monophosphate
- AMPK
- 5′-AMP-activated protein kinase catalytic subunit alpha-1
- ATM
- Serine-protein kinase Ataxia telangiectasia mutated
- ATP
- Adenosine triphosphate
- COX2
- Prostaglandin G/H synthase 2 (Cyclooxygenase-2)
- E-Cadherin
- Epithelial cadherin
- EGFR
- Epidermal growth factor receptor
- EMT
- Epithelial-mesenchymal transition
- ENM
- Elastic network model
- HER2
- Receptor tyrosine-protein kinase erbB-2
- IGF1
- Insulin-like growth factor I
- IGF1R
- IGF1 receptor
- InsR
- Insulin receptor
- LOOCV
- Leave-one-out cross-validation
- MAPK
- Mitogen-activated protein kinase
- MaxEnt
- Entropy maximization
- mTORC1
- Mammalian target of rapamycin complex 1
- NADPH
- Nicotinamide adenine dinucleotide phosphate (reduced form)
- NF-kB
- Nuclear factor kappa B
- ns
- nonsignificant
- p70S6K
- Ribosomal protein S6 kinase beta-1
- PI3K
- Phosphatidylinositol 4,5-bisphosphate 3-kinase
- PKCα
- Protein kinase C alpha type
- PTEN
- Phosphatidylinositol 3,4,5-trisphosphate 3-phosphatase
- R
- Pearson correlation coefficient
- RAS
- GTPase Ras
- Rb1
- Retinoblastoma-associated protein
- RPPA
- Reverse phase protein array
- S6
- Ribosomal protein S6
- Scr
- Scrambled
- S.E.
- Standard error of the mean
- SFM
- Serum free medium
- std
- Standard deviation
- SVD
- Singular value decomposition
- TSC2
- Tuberin (Tuberous sclerosis 2 protein)
- TT
- Time translation
- Vhc
- Vehicle
- WT
- Wild-type.
REFERENCES
- 1. Casa A. J., Dearth R. K., Litzenburger B. C., Lee A. V., and Cui X. (2008) The type I insulin-like growth factor receptor pathway: a key player in cancer therapeutic resistance. Frontiers Biosci. 13, 3273–3287 [DOI] [PubMed] [Google Scholar]
- 2. Sachdev D., and Yee D. (2001) The IGF system and breast cancer. Endocrine-Related Cancer 8, 197–209 [DOI] [PubMed] [Google Scholar]
- 3. Boone D. N., and Lee A. V. (2012) Targeting the insulin-like growth factor receptor: developing biomarkers from gene expression profiling. Crit. Rev. Oncogenesis 17, 161–173 [DOI] [PMC free article] [PubMed] [Google Scholar]
- 4. Casa A., Litzenburger B., Dearth R., and Lee A. v. (2008) Insulin-like growth factor signaling in normal mammary gland development and breast cancer progression. Breast Cancer: Prognosis, Treatment and Prevention, CRC Press, Boca Raton FL, pp. 303–322, 2nd Ed Informa Healthcare, New York [Google Scholar]
- 5. Liu J. L., and LeRoith D. (1999) Insulin-like growth factor I is essential for postnatal growth in response to growth hormone. Endocrinology 140, 5178–5184 [DOI] [PubMed] [Google Scholar]
- 6. Kooijman R. (2006) Regulation of apoptosis by insulin-like growth factor (IGF)-I. Cytokine Growth F R 17, 305–323 [DOI] [PubMed] [Google Scholar]
- 7. Braun S., Bitton-Worms K., and LeRoith D. (2011) The Link between the Metabolic Syndrome and Cancer. Int. J. Biol. Sci. 7, 1003–1015 [DOI] [PMC free article] [PubMed] [Google Scholar]
- 8. Kruger M., Kratchmarova I., Blagoev B., Tseng Y. H., Kahn C. R., and Mann M. (2008) Dissection of the insulin signaling pathway via quantitative phosphoproteomics. Proc. Natl. Acad. Sci. USA 105, 2451–2456 [DOI] [PMC free article] [PubMed] [Google Scholar]
- 9. Pollak M. N., Schernhammer E. S., and Hankinson S. E. (2004) Insulin-like growth factors and neoplasia. Nat. Rev. Cancer 4, 505–518 [DOI] [PubMed] [Google Scholar]
- 10. Pollak M. (2008) Insulin and insulin-like growth factor signalling in neoplasia. Nat. Rev. Cancer 8, 915–928 [DOI] [PubMed] [Google Scholar]
- 11. Farabaugh S. M., Boone D. N., and Lee A. V. (2015) Role of IGF1R in Breast Cancer Subtypes, Stemness, and Lineage Differentiation. Front. Endocrinol. 6, 59. [DOI] [PMC free article] [PubMed] [Google Scholar]
- 12. Maki R. G. (2010) Small is beautiful: insulin-like growth factors and their role in growth, development, and cancer. J. Clin. Oncol. 28, 4985–4995 [DOI] [PMC free article] [PubMed] [Google Scholar]
- 13. Gallagher E. J., and LeRoith D. (2010) The proliferating role of insulin and insulin-like growth factors in cancer. Trends Endocrin. Met. 21, 610–618 [DOI] [PMC free article] [PubMed] [Google Scholar]
- 14. Siddle K. (2011) Signalling by insulin and IGF receptors: supporting acts and new players. J. Mol. Endocrinol. 47, R1–R10 [DOI] [PubMed] [Google Scholar]
- 15. Clayton P. E., Banerjee I., Murray P. G., and Renehan A. G. (2011) Growth hormone, the insulin-like growth factor axis, insulin and cancer risk. Nat. Rev. Endocrinol. 7, 11–24 [DOI] [PubMed] [Google Scholar]
- 16. Law J. H., Habibi G., Hu K., Masoudi H., Wang M. Y., Stratford A. L., Park E., Gee J. M., Finlay P., Jones H. E., Nicholson R. I., Carboni J., Gottardis M., Pollak M., and Dunn S. E. (2008) Phosphorylated insulin-like growth factor-i/insulin receptor is present in all breast cancer subtypes and is related to poor survival. Cancer Res. 68, 10238–10246 [DOI] [PubMed] [Google Scholar]
- 17. Habibi G., Leung S., Law J. H., Gelmon K., Masoudi H., Turbin D., Pollak M., Nielsen T. O., Huntsman D., and Dunn S. E. (2008) Redefining prognostic factors for breast cancer: YB-1 is a stronger predictor of relapse and disease-specific survival than estrogen receptor or HER-2 across all tumor subtypes. Breast Cancer Res. 10, R86. [DOI] [PMC free article] [PubMed] [Google Scholar]
- 18. Arcaro A. (2013) Targeting the insulin-like growth factor-1 receptor in human cancer. Front. Pharmacol. 4(30), 1–8 [DOI] [PMC free article] [PubMed] [Google Scholar]
- 19. Olmos D., Basu B., and de Bono J. S. (2010) Targeting insulin-like growth factor signaling: rational combination strategies. Mol. Cancer Ther. 9, 2447–2449 [DOI] [PubMed] [Google Scholar]
- 20. Sachdev D., and Yee D. (2006) Inhibitors of insulin-like growth factor signaling: a therapeutic approach for breast cancer. J. Mammary Gland Biol. Neoplasia 11, 27–39 [DOI] [PubMed] [Google Scholar]
- 21. Niederst M. J., and Engelman J. A. (2013) Bypass mechanisms of resistance to receptor tyrosine kinase inhibition in lung cancer. Sci. Signal. 6, re6. [DOI] [PMC free article] [PubMed] [Google Scholar]
- 22. Lu Y., Zi X., Zhao Y., Mascarenhas D., and Pollak M. (2001) Insulin-like growth factor-I receptor signaling and resistance to trastuzumab (Herceptin). J. Natl. Cancer Inst. 93, 1852–1857 [DOI] [PubMed] [Google Scholar]
- 23. Buck E., Gokhale P. C., Koujak S., Brown E., Eyzaguirre A., Tao N., Rosenfeld-Franklin M., Lerner L., Chiu M. I., Wild R., Epstein D., Pachter J. A., and Miglarese M. R. (2010) Compensatory insulin receptor (IR) activation on inhibition of insulin-like growth factor-1 receptor (IGF-1R): rationale for cotargeting IGF-1R and IR in cancer. Mol. Cancer Ther. 9, 2652–2664 [DOI] [PubMed] [Google Scholar]
- 24. Lemmon M. A., and Schlessinger J. (2010) Cell signaling by receptor tyrosine kinases. Cell 141, 1117–1134 [DOI] [PMC free article] [PubMed] [Google Scholar]
- 25. Cancer Genome Atlas, N. (2012) Comprehensive molecular portraits of human breast tumours. Nature 490, 61–70 [DOI] [PMC free article] [PubMed] [Google Scholar]
- 26. Chakravarti A., Loeffler J. S., and Dyson N. J. (2002) Insulin-like growth factor receptor I mediates resistance to anti-epidermal growth factor receptor therapy in primary human glioblastoma cells through continued activation of phosphoinositide 3-kinase signaling. Cancer Res. 62, 200–207 [PubMed] [Google Scholar]
- 27. Jones H. E., Goddard L., Gee J. M., Hiscox S., Rubini M., Barrow D., Knowlden J. M., Williams S., Wakeling A. E., and Nicholson R. I. (2004) Insulin-like growth factor-I receptor signalling and acquired resistance to gefitinib (ZD1839; Iressa) in human breast and prostate cancer cells. Endocrine-Related Cancer 11, 793–814 [DOI] [PubMed] [Google Scholar]
- 28. Jordan V. C. (2003) Tamoxifen: A most unlikely pioneering medicine. Nat. Rev. Drug Discov. 2, 205–213 [DOI] [PubMed] [Google Scholar]
- 29. Fitzgerald J. B., Johnson B. W., Baum J., Adams S., Iadevaia S., Tang J., Rimkunas V., Xu L., Kohli N., Rennard R., Razlog M., Jiao Y., Harms B. D., Olivier K. J. Jr., Schoeberl B., Nielsen U. B., and Lugovskoy A. A. (2014) MM-141, an IGF-IR- and ErbB3-directed bispecific antibody, overcomes network adaptations that limit activity of IGF-IR inhibitors. Mol. Cancer Ther. 13, 410–425 [DOI] [PubMed] [Google Scholar]
- 30. Senutovitch N., Vernetti L., Boltz R., DeBiasio R., Gough A., and Taylor D. L. (2015) Fluorescent protein biosensors applied to microphysiological systems. Exp. Biol. Med. 240, 795–808 [DOI] [PMC free article] [PubMed] [Google Scholar]
- 31. Tibes R., Qiu Y., Lu Y., Hennessy B., Andreeff M., Mills G. B., and Kornblau S. M. (2006) Reverse phase protein array: validation of a novel proteomic technology and utility for analysis of primary leukemia specimens and hematopoietic stem cells. Mol. Cancer Ther. 5, 2512–2521 [DOI] [PubMed] [Google Scholar]
- 32. Daemen A., Griffith O. L., Heiser L. M., Wang N. J., Enache O. M., Sanborn Z., Pepin F., Durinck S., Korkola J. E., Griffith M., Hur J. S., Huh N., Chung J., Cope L., Fackler M. J., Umbricht C., Sukumar S., Seth P., Sukhatme V. P., Jakkula L. R., Lu Y., Mills G. B., Cho R. J., Collisson E. A., van't Veer L. J., Spellman P. T., and Gray J. W. (2013) Modeling precision treatment of breast cancer. Genome Biol. 14, R110. [DOI] [PMC free article] [PubMed] [Google Scholar]
- 33. Toettcher J. E., Weiner O. D., and Lim W. A. (2013) Using optogenetics to interrogate the dynamic control of signal transmission by the Ras/Erk module. Cell 155, 1422–1434 [DOI] [PMC free article] [PubMed] [Google Scholar]
- 34. Iadevaia S., Lu Y., Morales F. C., Mills G. B., and Ram P. T. (2010) Identification of optimal drug combinations targeting cellular networks: integrating phospho-proteomics and computational network analysis. Cancer Res. 70, 6704–6714 [DOI] [PMC free article] [PubMed] [Google Scholar]
- 35. Bar-Joseph Z., Gitter A., and Simon I. (2012) Studying and modelling dynamic biological processes using time-series gene expression data. Nat. Rev. Genet. 13, 552–564 [DOI] [PubMed] [Google Scholar]
- 36. Jin L., Zuo X. Y., Su W. Y., Zhao X. L., Yuan M. Q., Han L. Z., Zhao X., Chen Y. D., and Rao S. Q. (2014) Pathway-based analysis tools for complex diseases: a review. Genomics, Proteomics Bioinformatics 12, 210–220 [DOI] [PMC free article] [PubMed] [Google Scholar]
- 37. Bahar I., Atilgan A. R., and Erman B. (1997) Direct evaluation of thermal fluctuations in proteins using a single-parameter harmonic potential. Fold Des. 2, 173–181 [DOI] [PubMed] [Google Scholar]
- 38. Chennubhotla C., and Bahar I. (2007) Signal propagation in proteins and relation to equilibrium fluctuations. PLoS Computational Biol. 3, 1716–1726 [DOI] [PMC free article] [PubMed] [Google Scholar]
- 39. Chennubhotla C., Rader A. J., Yang L. W., and Bahar I. (2005) Elastic network models for understanding biomolecular machinery: from enzymes to supramolecular assemblies. Phys. Biol. 2, S173–S180 [DOI] [PubMed] [Google Scholar]
- 40. Wang G. (2010) Singularity analysis of the AKT signaling pathway reveals connections between cancer and metabolic diseases. Phys. Biol. 7, 046015 [DOI] [PubMed] [Google Scholar]
- 41. Poirel C. L., Rodrigues R. R., Chen K. C., Tyson J. J., and Murali T. M. (2013) Top-Down Network Analysis to Drive Bottom-Up Modeling of Physiological Processes. J. Comput. Biol. 20, 409–418 [DOI] [PMC free article] [PubMed] [Google Scholar]
- 42. Niepel M., Hafner M., Pace E. A., Chung M., Chai D. H., Zhou L. L., Schoeberl B., and Sorger P. K. (2013) Profiles of Basal and Stimulated Receptor Signaling Networks Predict Drug Response in Breast Cancer Lines. Sci. Signaling 6, ra84. [DOI] [PMC free article] [PubMed] [Google Scholar]
- 43. Huang S. S., and Fraenkel E. (2009) Integrating proteomic, transcriptional, and interactome data reveals hidden components of signaling and regulatory networks. Sci. Signaling 2, ra40. [DOI] [PMC free article] [PubMed] [Google Scholar]
- 44. Vinayagam A., Stelzl U., Foulle R., Plassmann S., Zenkner M., Timm J., Assmus H. E., Andrade-Navarro M. A., and Wanker E. E. (2011) A directed protein interaction network for investigating intracellular signal transduction. Sci. Signaling 4, rs8. [DOI] [PubMed] [Google Scholar]
- 45. White F. M. (2008) Quantitative phosphoproteomic analysis of signaling network dynamics. Curr. Opinion Biotechnol. 19, 404–409 [DOI] [PMC free article] [PubMed] [Google Scholar]
- 46. Alon U. (2007) Network motifs: theory and experimental approaches. Nat. Rev. Genet. 8, 450–461 [DOI] [PubMed] [Google Scholar]
- 47. Holter N. S., Maritan A., Cieplak M., Fedoroff N. V., and Banavar J. R. (2001) Dynamic modeling of gene expression data. Proc. Natl. Acad. Sci. USA 98, 1693–1698 [DOI] [PMC free article] [PubMed] [Google Scholar]
- 48. Lezon T. R., Banavar J. R., Cieplak M., Maritan A., and Fedoroff N. V. (2006) Using the principle of entropy maximization to infer genetic interaction networks from gene expression patterns. Proc. Natl. Acad. Sci. USA 103, 19033–19038 [DOI] [PMC free article] [PubMed] [Google Scholar]
- 49. Friedman N. (2004) Inferring cellular networks using probabilistic graphical models. Science 303, 799–805 [DOI] [PubMed] [Google Scholar]
- 50. Ernst J., Vainas O., Harbison C. T., Simon I., and Bar-Joseph Z. (2007) Reconstructing dynamic regulatory maps. Mol. Syst. Biol. 3, 74. [DOI] [PMC free article] [PubMed] [Google Scholar]
- 51. Friedman J., Hastie T., and Tibshirani R. (2008) Sparse inverse covariance estimation with the graphical lasso. Biostatistics 9, 432–441 [DOI] [PMC free article] [PubMed] [Google Scholar]
- 52. Edgar R., Domrachev M., and Lash A. E. (2002) Gene Expression Omnibus: NCBI gene expression and hybridization array data repository. Nucleic Acids Res. 30, 207–210 [DOI] [PMC free article] [PubMed] [Google Scholar]
- 53. Sheehan K. M., Calvert V. S., Kay E. W., Lu Y., Fishman D., Espina V., Aquino J., Speer R., Araujo R., Mills G. B., Liotta L. A., Petricoin E. F. 3rd, and Wulfkuhle J. D. (2005) Use of reverse phase protein microarrays and reference standard development for molecular network analysis of metastatic ovarian carcinoma. Mol. Cell. Proteomics 4, 346–355 [DOI] [PubMed] [Google Scholar]
- 54. Kaushik P., Molinelli E. J., Miller M. L., Wang W., Korkut A., Liu W., Ju Z., Lu Y., Mills G., and Sander C. (2014) Spatial normalization of reverse phase protein array data. PloS One 9, e97213. [DOI] [PMC free article] [PubMed] [Google Scholar]
- 55. Neve R. M., Chin K., Fridlyand J., Yeh J., Baehner F. L., Fevr T., Clark L., Bayani N., Coppe J. P., Tong F., Speed T., Spellman P. T., DeVries S., Lapuk A., Wang N. J., Kuo W. L., Stilwell J. L., Pinkel D., Albertson D. G., Waldman F. M., McCormick F., Dickson R. B., Johnson M. D., Lippman M., Ethier S., Gazdar A., and Gray J. W. (2006) A collection of breast cancer cell lines for the study of functionally distinct cancer subtypes. Cancer Cell 10, 515–527 [DOI] [PMC free article] [PubMed] [Google Scholar]
- 56. Hu J., He X., Baggerly K. A., Coombes K. R., Hennessy B. T., and Mills G. B. (2007) Non-parametric quantification of protein lysate arrays. Bioinformatics 23, 1986–1994 [DOI] [PubMed] [Google Scholar]
- 57. RPPA Core Facility. The University of Texas MD Anderson Cancer Center
- 58. Tibshirani R. (1996) Regression shrinkage and selection via the Lasso. J. Roy. Stat. Soc. B Met. 58, 267–288 [Google Scholar]
- 59. Tibshirani R. (2011) Regression shrinkage and selection via the lasso: a retrospective. J. R. Stat. Soc. B 73, 273–282 [Google Scholar]
- 60. Friedman J., Hastie T., and Tibshirani R. (2010) Regularization Paths for Generalized Linear Models via Coordinate Descent. J. Statistical Software 33, 1–22 [PMC free article] [PubMed] [Google Scholar]
- 61. Friedman J., Hastie T., and Tibshirani R. (2010) Regularization Paths for Generalized Linear Models via Coordinate Descent. Journal of statistical software 33, 1–22 [PMC free article] [PubMed] [Google Scholar]
- 62. Heiser L. M., Sadanandam A., Kuo W. L., Benz S. C., Goldstein T. C., Ng S., Gibb W. J., Wang N. J., Ziyad S., Tong F., Bayani N., Hu Z., Billig J. I., Dueregger A., Lewis S., Jakkula L., Korkola J. E., Durinck S., Pepin F., Guan Y., Purdom E., Neuvial P., Bengtsson H., Wood K. W., Smith P. G., Vassilev L. T., Hennessy B. T., Greshock J., Bachman K. E., Hardwicke M. A., Park J. W., Marton L. J., Wolf D. M., Collisson E. A., Neve R. M., Mills G. B., Speed T. P., Feiler H. S., Wooster R. F., Haussler D., Stuart J. M., Gray J. W., and Spellman P. T. (2012) Subtype and pathway specific responses to anticancer compounds in breast cancer. Proc. Natl. Acad. Sci. USA 109, 2724–2729 [DOI] [PMC free article] [PubMed] [Google Scholar]
- 63. Yamasaki T., Takahashi A., Pan J., Yamaguchi N., and Yokoyama K. K. (2009) Phosphorylation of Activation Transcription Factor-2 at Serine 121 by Protein Kinase C Controls c-Jun-mediated Activation of Transcription. J.Biol. Chem. 284, 8567–8581 [DOI] [PMC free article] [PubMed] [Google Scholar]
- 64. Tsao H. K., Chiu P. H., and Sun S. H. (2013) PKC-dependent ERK phosphorylation is essential for P2X7 receptor-mediated neuronal differentiation of neural progenitor cells. Cell Death Disease 4, e751. [DOI] [PMC free article] [PubMed] [Google Scholar]
- 65. Dick F. A., and Rubin S. M. (2013) Molecular mechanisms underlying RB protein function. Nat. Rev. Mol. Cell Bio. 14, 297–306 [DOI] [PMC free article] [PubMed] [Google Scholar]
- 66. Lamber E. P., Beuron F., Morris E. P., Svergun D. I., and Mittnacht S. (2013) Structural insights into the mechanism of phosphoregulation of the retinoblastoma protein. PloS One 8, e58463. [DOI] [PMC free article] [PubMed] [Google Scholar]
- 67. Lapenna S., and Giordano A. (2009) Cell cycle kinases as therapeutic targets for cancer. Nat. Rev. Drug Discov. 8, 547–566 [DOI] [PubMed] [Google Scholar]
- 68. Ren S. J., and Rollins B. J. (2004) Cyclin C/Cdk3 promotes Rb-dependent G0 exit. Cell 117, 239–251 [DOI] [PubMed] [Google Scholar]
- 69. Taniguchi C. M., Emanuelli B., and Kahn C. R. (2006) Critical nodes in signalling pathways: insights into insulin action. Nat. Rev. Mol. Cell Biol. 7, 85–96 [DOI] [PubMed] [Google Scholar]
- 70. Citri A., and Yarden Y. (2006) EGF-ERBB signalling: towards the systems level. Nat. Rev. Mol. Cell Biol. 7, 505–516 [DOI] [PubMed] [Google Scholar]
- 71. Yarden Y., and Sliwkowski M. X. (2001) Untangling the ErbB signalling network. Nat. Rev. Mol. Cell Biol. 2, 127–137 [DOI] [PubMed] [Google Scholar]
- 72. Baselga J., and Swain S. M. (2009) Novel anticancer targets: revisiting ERBB2 and discovering ERBB3. Nat. Rev. Cancer 9, 463–475 [DOI] [PubMed] [Google Scholar]
- 73. Emde A., Kostler W. J., Yarden Y., Association of, R., and Oncology of the Mediterranean, a. (2012) Therapeutic strategies and mechanisms of tumorigenesis of HER2-overexpressing breast cancer. Crit. Rev. Oncol./Hematol. 84, e49–e57 [DOI] [PMC free article] [PubMed] [Google Scholar]
- 74. Szklarczyk D., Franceschini A., Wyder S., Forslund K., Heller D., Huerta-Cepas J., Simonovic M., Roth A., Santos A., Tsafou K. P., Kuhn M., Bork P., Jensen L. J., and von Mering C. (2015) STRING v10: protein-protein interaction networks, integrated over the tree of life. Nucleic Acids Res. 43, D447–D452 [DOI] [PMC free article] [PubMed] [Google Scholar]
- 75. Koboldt D. C., Fulton R. S., McLellan M. D., Schmidt H., Kalicki-Veizer J., McMichael J. F., Fulton L. L., Dooling D. J., Ding L., Mardis E. R., Wilson R. K., Ally A., Balasundaram M., Butterfield Y. S. N., Carlsen R., Carter C., Chu A., Chuah E., Chun H. J. E., Coope R. J. N., Dhalla N., Guin R., Hirst C., Hirst M., Holt R. A., Lee D., Li H. Y. I., Mayo M., Moore R. A., Mungall A. J., Pleasance E., Robertson A. G., Schein J. E., Shafiei A., Sipahimalani P., Slobodan J. R., Stoll D., Tam A., Thiessen N., Varhol R. J., Wye N., Zeng T., Zhao Y. J., Birol I., Jones S. J. M., Marra M. A., Cherniack A. D., Saksena G., Onofrio R. C., Pho N. H., Carter S. L., Schumacher S. E., Tabak B., Hernandez B., Gentry J., Nguyen H., Crenshaw A., Ardlie K., Beroukhim R., Winckler W., Getz G., Gabriel S. B., Meyerson M., Chin L., Park P. J., Kucherlapati R., Hoadley K. A., Auman J. T., Fan C., Turman Y. J., Shi Y., Li L., Topal M. D., He X. P., Chao H. H., Prat A., Silva G. O., Iglesia M. D., Zhao W., Usary J., Berg J. S., Adams M., Booker J., Wu J. Y., Gulabani A., Bodenheimer T., Hoyle A. P., Simons J. V., Soloway M. G., Mose L. E., Jefferys S. R., Balu S., Parker J. S., Hayes D. N., Perou C. M., Malik S., Mahurkar S., Shen H., Weisenberger D. J., Triche T., Lai P. H., Bootwalla M. S., Maglinte D. T., Berman B. P., Van den Berg D. J., Baylin S. B., Laird P. W., Creighton C. J., Donehower L. A., Getz G., Noble M., Voet D., Saksena G., Gehlenborg N., DiCara D., Zhang J. H., Zhang H. L., Wu C. J., Liu S. Y., Lawrence M. S., Zou L. H., Sivachenko A., Lin P., Stojanov P., Jing R., Cho J., Sinha R., Park R. W., Nazaire M. D., Robinson J., Thorvaldsdottir H., Mesirov J., Park P. J., Chin L., Reynolds S., Kreisberg R. B., Bernard B., Bressler R., Erkkila T., Lin J., Thorsson V., Zhang W., Shmulevich I., Ciriello G., Weinhold N., Schultz N., Gao J. J., Cerami E., Gross B., Jacobsen A., Sinha R., Aksoy B. A., Antipin Y., Reva B., Shen R. L., Taylor B. S., Ladanyi M., Sander C., Anur P., Spellman P. T., Lu Y. L., Liu W. B., Verhaak R. R. G., Mills G. B., Akbani R., Zhang N. X., Broom B. M., Casasent T. D., Wakefield C., Unruh A. K., Baggerly K., Coombes K., Weinstein J. N., Haussler D., Benz C. C., Stuart J. M., Benz S. C., Zhu J. C., Szeto C. C., Scott G. K., Yau C., Paul E. O., Carlin D., Wong C., Sokolov A., Thusberg J., Mooney S., Ng S., Goldstein T. C., Ellrott K., Grifford M., Wilks C., Ma S., Craft B., Yan C. H., Hu Y., Meerzaman D., Gastier-Foster J. M., Bowen J., Ramirez N. C., Black A. D., Pyatt R. E., White P., Zmuda E. J., Frick J., Lichtenberg T., Brookens R., George M. M., Gerken M. A., Harper H. A., Leraas K. M., Wise L. J., Tabler T. R., McAllister C., Barr T., Hart-Kothari M., Tarvin K., Saller C., Sandusky G., Mitchell C., Iacocca M. V., Brown J., Rabeno B., Czerwinski C., Petrelli N., Dolzhansky O., Abramov M., Voronina O., Potapova O., Marks J. R., Suchorska W. M., Murawa D., Kycler W., Ibbs M., Korski K., Spychala A., Murawa P., Brzezinski J. J., Perz H., Lazniak R., Teresiak M., Tatka H., Leporowska E., Bogusz-Czerniewicz M., Malicki J., Mackiewicz A., Wiznerowicz M., Le X. V., Kohl B., Tien N. V., Thorp R., Bang N. V., Sussman H., Phu B. D., Hajek R., Hung N. P., Tran V. T. P., Thang H. Q., Khan K. Z., Penny R., Mallery D., Curley E., Shelton C., Yena P., Ingle J. N., Couch F. J., Lingle W. L., King T. A., Gonzalez-Angulo A. M., Mills G. B., Dyer M. D., Liu S. Y., Meng X. L., Patangan M., Waldman F., Stoppler H., Rathmell W. K., Thorne L., Huang M., Boice L., Hill A., Morrison C., Gaudioso C., Bshara W., Daily K., Egea S. C., Pegram M. D., Gomez-Fernandez C., Dhir R., Bhargava R., Brufsky A., Shriver C. D., Hooke J. A., Campbell J. L., Mural R. J., Hu H., Somiari S., Larson C., Deyarmin B., Kvecher L., Kovatich A. J., Ellis M. J., King T. A., Hu H., Couch F. J., Mural R. J., Stricker T., White K., Olopade O., Ingle J. N., Luo C. Q., Chen Y. Q., Marks J. R., Waldman F., Wiznerowicz M., Bose R., Chang L. W., Beck A. H., Gonzalez-Angulo A. M., Pihl T., Jensen M., Sfeir R., Kahn A., Chu A., Kothiyal P., Wang Z. N., Snyder E., Pontius J., Ayala B., Backus M., Walton J., Baboud J., Berton D., Nicholls M., Srinivasan D., Raman R., Girshik S., Kigonya P., Alonso S., Sanbhadti R., Barletta S., Pot D., Sheth M., Demchok J. A., Shaw K. R. M., Yang L. M., Eley G., Ferguson M. L., Tarnuzzer R. W., Zhang J. S., Dillon L. A. L., Buetow K., Fielding P., Ozenberger B. A., Guyer M. S., Sofia H. J., Palchik J. D., and Network C. G. A. (2012) Comprehensive molecular portraits of human breast tumours. Nature 490, 61–70 [DOI] [PMC free article] [PubMed] [Google Scholar]
- 76. Vempati U. D., Chung C., Mader C., Koleti A., Datar N., Vidovic D., Wrobel D., Erickson S., Muhlich J. L., Berriz G., Benes C. H., Subramanian A., Pillai A., Shamu C. E., and Schurer S. C. (2014) Metadata standard and data exchange specifications to describe, model, and integrate complex and diverse high-throughput screening data from the Library of Integrated Network-based Cellular Signatures (LINCS). J. Biomol. Screening 19, 803–816 [DOI] [PMC free article] [PubMed] [Google Scholar]
- 77. Efron B., Hastie T., Johnstone I., and Tibshirani R. (2004) Least angle regression. Ann. Stat. 32, 407–451 [Google Scholar]
- 78. Tibshirani R. J. (2013) The lasso problem and uniqueness. Electron J. Stat. 7, 1456–1490 [Google Scholar]
- 79. Lockhart R., Taylor J., Tibshirani R. J., and Tibshirani R. (2014) A Significance Test for the Lasso (Vol 42, Pg 518, 2014). Ann. Stat. 42, 2138–2139 [DOI] [PMC free article] [PubMed] [Google Scholar]
- 80. Gustafsson M., Hornquist M., and Lombardi A. (2005) Constructing and analyzing a large-scale gene-to-gene regulatory network - Lasso-constrained inference and biological validation. Ieee Acm T. Comput. Bi. 2, 254–261 [DOI] [PubMed] [Google Scholar]
- 81. Gustafsson M., Hornquist M., Lundstrom J., Bjorkegren J., and Tegner J. (2009) Reverse engineering of gene networks with LASSO and nonlinear basis functions. Ann. NY Acad. Sci. 1158, 265–275 [DOI] [PubMed] [Google Scholar]
- 82. Fenton T. R., and Gout I. T. (2011) Functions and regulation of the 70 kDa ribosomal S6 kinases. Int. J. Biochem. Cell. Biol. 43, 47–59 [DOI] [PubMed] [Google Scholar]
- 83. Shimobayashi M., and Hall M. N. (2014) Making new contacts: the mTOR network in metabolism and signalling crosstalk. Nat. Rev. Mol. Cell. Biol. 15, 155–162 [DOI] [PubMed] [Google Scholar]
- 84. Fullerton M. D., Galic S., Marcinko K., Sikkema S., Pulinilkunnil T., Chen Z. P., O'Neill H. M., Ford R. J., Palanivel R., O'Brien M., Hardie D. G., Macaulay S. L., Schertzer J. D., Dyck J. R., van Denderen B. J., Kemp B. E., and Steinberg G. R. (2013) Single phosphorylation sites in Acc1 and Acc2 regulate lipid homeostasis and the insulin-sensitizing effects of metformin. Nat. Med. 19, 1649–1654 [DOI] [PMC free article] [PubMed] [Google Scholar]
- 85. Jeon S. M., Chandel N. S., and Hay N. (2012) AMPK regulates NADPH homeostasis to promote tumour cell survival during energy stress. Nature 485, 661–665 [DOI] [PMC free article] [PubMed] [Google Scholar]
- 86. Pece S., Chiariello M., Murga C., and Gutkind J. S. (1999) Activation of the protein kinase Akt/PKB by the formation of E-cadherin-mediated cell-cell junctions. Evidence for the association of phosphatidylinositol 3-kinase with the E-cadherin adhesion complex. J. Biol. Chem. 274, 19347–19351 [DOI] [PubMed] [Google Scholar]
- 87. De Santis G., Miotti S., Mazzi M., Canevari S., and Tomassetti A. (2009) E-cadherin directly contributes to PI3K/AKT activation by engaging the PI3K-p85 regulatory subunit to adherens junctions of ovarian carcinoma cells. Oncogene 28, 1206–1217 [DOI] [PubMed] [Google Scholar]
- 88. Lau M. T., Klausen C., and Leung P. C. (2011) E-cadherin inhibits tumor cell growth by suppressing PI3K/Akt signaling via beta-catenin-Egr1-mediated PTEN expression. Oncogene 30, 2753–2766 [DOI] [PubMed] [Google Scholar]
- 89. Kim E. Y., Kim A., Kim S. K., Kim H. J., Chang J., Ahn C. M., and Chang Y. S. (2014) Inhibition of mTORC1 induces loss of E-cadherin through AKT/GSK-3beta signaling-mediated upregulation of E-cadherin repressor complexes in non-small cell lung cancer cells. Respiratory Res. 15, 26. [DOI] [PMC free article] [PubMed] [Google Scholar]
- 90. Lau M. T., and Leung P. C. (2012) The PI3K/Akt/mTOR signaling pathway mediates insulin-like growth factor 1-induced E-cadherin down-regulation and cell proliferation in ovarian cancer cells. Cancer Lett. 326, 191–198 [DOI] [PubMed] [Google Scholar]
- 91. Hong K. O., Kim J. H., Hong J. S., Yoon H. J., Lee J. I., Hong S. P., and Hong S. D. (2009) Inhibition of Akt activity induces the mesenchymal-to-epithelial reverting transition with restoring E-cadherin expression in KB and KOSCC-25B oral squamous cell carcinoma cells. J. Exp. Clin. Cancer Res. 28, 28. [DOI] [PMC free article] [PubMed] [Google Scholar]
- 92. Kim H. J., Litzenburger B. C., Cui X., Delgado D. A., Grabiner B. C., Lin X., Lewis M. T., Gottardis M. M., Wong T. W., Attar R. M., Carboni J. M., and Lee A. V. (2007) Constitutively active type I insulin-like growth factor receptor causes transformation and xenograft growth of immortalized mammary epithelial cells and is accompanied by an epithelial-to-mesenchymal transition mediated by NF-kappaB and snail. Mol. Cell Biol. 27, 3165–3175 [DOI] [PMC free article] [PubMed] [Google Scholar]
- 93. Qian X., Karpova T., Sheppard A. M., McNally J., and Lowy D. R. (2004) E-cadherin-mediated adhesion inhibits ligand-dependent activation of diverse receptor tyrosine kinases. EMBO J. 23, 1739–1748 [DOI] [PMC free article] [PubMed] [Google Scholar]
- 94. de-Freitas-Junior J. C., Carvalho S., Dias A. M., Oliveira P., Cabral J., Seruca R., Oliveira C., Morgado-Diaz J. A., Reis C. A., and Pinho S. S. (2013) Insulin/IGF-I signaling pathways enhances tumor cell invasion through bisecting GlcNAc N-glycans modulation. an interplay with E-cadherin. PloS One 8, e81579. [DOI] [PMC free article] [PubMed] [Google Scholar]
- 95. Ching J. K., Luebbert S. H., Collins R. L. t., Zhang Z., Marupudi N., Banerjee S., Hurd R. D., Ralston L., and Fisher J. S. (2013) Ataxia telangiectasia mutated impacts insulin-like growth factor 1 signalling in skeletal muscle. Exp. Physiol. 98, 526–535 [DOI] [PMC free article] [PubMed] [Google Scholar]
- 96. Halaby M. J., Hibma J. C., He J., and Yang D. Q. (2008) ATM protein kinase mediates full activation of Akt and regulates glucose transporter 4 translocation by insulin in muscle cells. Cell. Signal. 20, 1555–1563 [DOI] [PubMed] [Google Scholar]
- 97. Viniegra J. G., Martinez N., Modirassari P., Hernandez Losa J., Parada Cobo C., Sanchez-Arevalo Lobo V. J., Aceves Luquero C. I., Alvarez-Vallina L., Ramon y Cajal S., Rojas J. M., and Sanchez-Prieto R. (2005) Full activation of PKB/Akt in response to insulin or ionizing radiation is mediated through ATM. J. Biol. Chem. 280, 4029–4036 [DOI] [PubMed] [Google Scholar]
- 98. Yamamoto K., Wang J., Sprinzen L., Xu J., Haddock C. J., Li C., Lee B. J., Loredan D. G., Jiang W., Vindigni A., Wang D., Rabadan R., and Zha S. (2016) Kinase-dead ATM protein is highly oncogenic and can be preferentially targeted by Topo-isomerase I inhibitors. Elife 5, e14709. [DOI] [PMC free article] [PubMed] [Google Scholar]
Associated Data
This section collects any data citations, data availability statements, or supplementary materials included in this article.