Abstract
Mean body size in marine animals has increased more than 100-fold since the Cambrian, a discovery that brings to attention the key life-history parameters of lifespan and growth rate that ultimately determine size. Variation in these parameters is not well understood on the planet today, much less in deep time. Here, we present a new global database of maximum reported lifespan and shell growth coupled with body size data for 1 148 populations of marine bivalves and show that (i) lifespan increases, and growth rate decreases, with latitude, both across the group as a whole and within well-sampled species, (ii) growth rate, and hence metabolic rate, correlates inversely with lifespan, and (iii) opposing trends in lifespan and growth combined with high variance obviate any demonstrable pattern in body size with latitude. Our observations suggest that the proposed increase in metabolic activity and demonstrated increase in body size of organisms over the Phanerozoic should be accompanied by a concomitant shift towards faster growth and/or shorter lifespan in marine bivalves. This prediction, testable from the fossil record, may help to explain one of the more fundamental patterns in the evolutionary and ecological history of animal life on this planet.
Keywords: bivalve, lifespan, growth rate, latitude, evolution, body size
1. Introduction
Animals living at high latitudes have long been suspected to live longer and grow more slowly than those in the tropics, but this contention is based on sparse and largely anecdotal data, and virtually nothing is known of how these parameters have changed over time. Bivalve molluscs are distributed pole to pole, are abundant in the fossil record, and their accretionary shells typically preserve records of age-at-size for every year of an animal's life. As such, they offer an ideal vessel by which to constrain these parameters for marine ectotherms over the Earth's surface today. Faster growth and longer life offer two avenues by which to attain larger size, but they have contrasting implications for the metabolic and ecologic changes hypothesized to drive a mean size increase over time [1–5]. In addition, ‘faster’ life histories allow for more rapid evolutionary change, and so any documented trend with latitude will have implications for gradients in diversity and ecology. An examination of spatial variation in life-history parameters may therefore provide insight into modern biodiversity patterns as well as lay the groundwork for interpreting trends through time.
Our dataset derives from an exhaustive search of the peer-reviewed literature and consists of measures of maximum reported lifespan (MLSP), growth, and, maximum body size from 1 148 local populations of living marine bivalves spanning the tropics to the polar regions. Data encompass 297 species in 158 genera and include members of nearly half (45) of all extant marine bivalve families (97). Not surprisingly, families that serve as fisheries targets (e.g. Veneridae, Pectinidae, and Mytilidae) are represented by greater numbers of populations in the published literature. Fewer populations are recorded from low latitudes; however, these observations account for over 140 000 individuals. Only data from ‘wild’ populations are included; aquacultural and experimental studies were omitted. Growth is approximated by k, the von Bertalanffy growth coefficient, a measure of how fast maximum adult size is attained and a consistent proxy for shell growth across disparate taxa. Maximum body size of individuals within populations is approximated by L∞, the asymptotic size derived from the von Bertalanffy growth equation. See the electronic supplementary material for details on the dataset and the von Bertalanffy growth equation [6].
2. Results
The data reveal that most bivalves are short lived and that there is a pattern in the distribution of lifespan and growth, but not body size, with latitude.
Maximum reported lifespans for populations of the Bivalvia are exponentially distributed; in more than half the sampled populations, the oldest individuals live for fewer than 11 years (figure 1). While most bivalves by far are short lived (the modal lifespan of species is 3 years), a not insignificant number of species have MLSPs that exceed 20 years, and at least nine centenarian taxa are documented, including the record-holding Arctica islandica, at 507 years [7] (electronic supplementary material, table S1). Note that ‘maximum’ lifespan is in part a function of sampling effort, and reported values should be treated as estimates.
Figure 1.
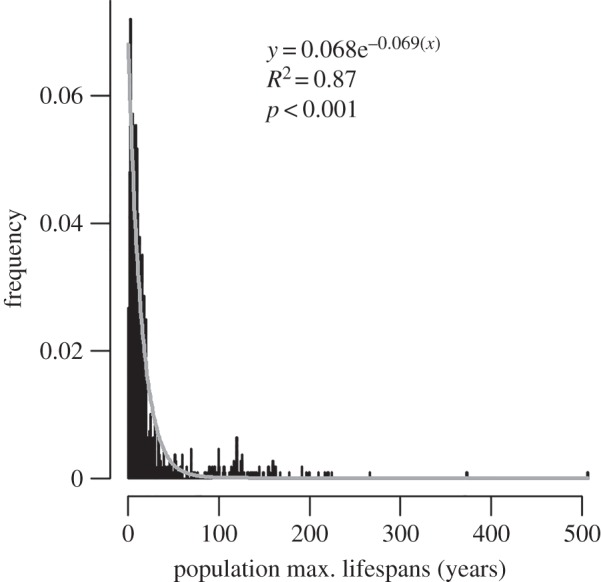
Distribution of maximum reported lifespans of individuals within all populations of the Bivalvia in the database. Minimum = 0.25 years (Donax variabilis), maximum = 507 years (Arctica islandica). Dataset provided in the electronic supplementary material (n = 1 084).
Population-level data plotted by latitude reinforce the preponderance of short-lived bivalves but also demonstrate a strong tendency for populations with longer lived individuals to be found at higher latitudes (figure 2a). Because frequency distributions of population MLSPs, both for the whole dataset (figure 1) and for subsets of populations divided by latitude (electronic supplementary material, figure S1), are exponentially distributed, standard parametric descriptive statistics can be used to compare population variables across latitude. The mean and standard deviation of MLSPs reported for populations increase with increasing latitude. Populations of tropical (less than 30°) bivalves record a mean MLSP of 7.9 years, whereas those in the mid- to high-latitudes have a mean MLSP of 24.7 years. Outliers for low latitudes include the photosymbiotic giant clams (Tridacna) and the chemosymbiotic vent clam Bathymodiolus. No other low-latitude species have populations with MLSPs longer than 30 years. Individual taxa represented by at least 15 sampled populations spanning more than 10° of latitude show a similar pattern of increasing lifespan with latitude (electronic supplementary material, figure S2), suggesting a cause that acts both within and across species. Growth (k) shows a similar, but inverse, relationship with latitude (figure 2b). Low-latitude bivalves are characterized by significantly higher and more variable growth coefficients than those in the mid- and high-latitudes.
Figure 2.
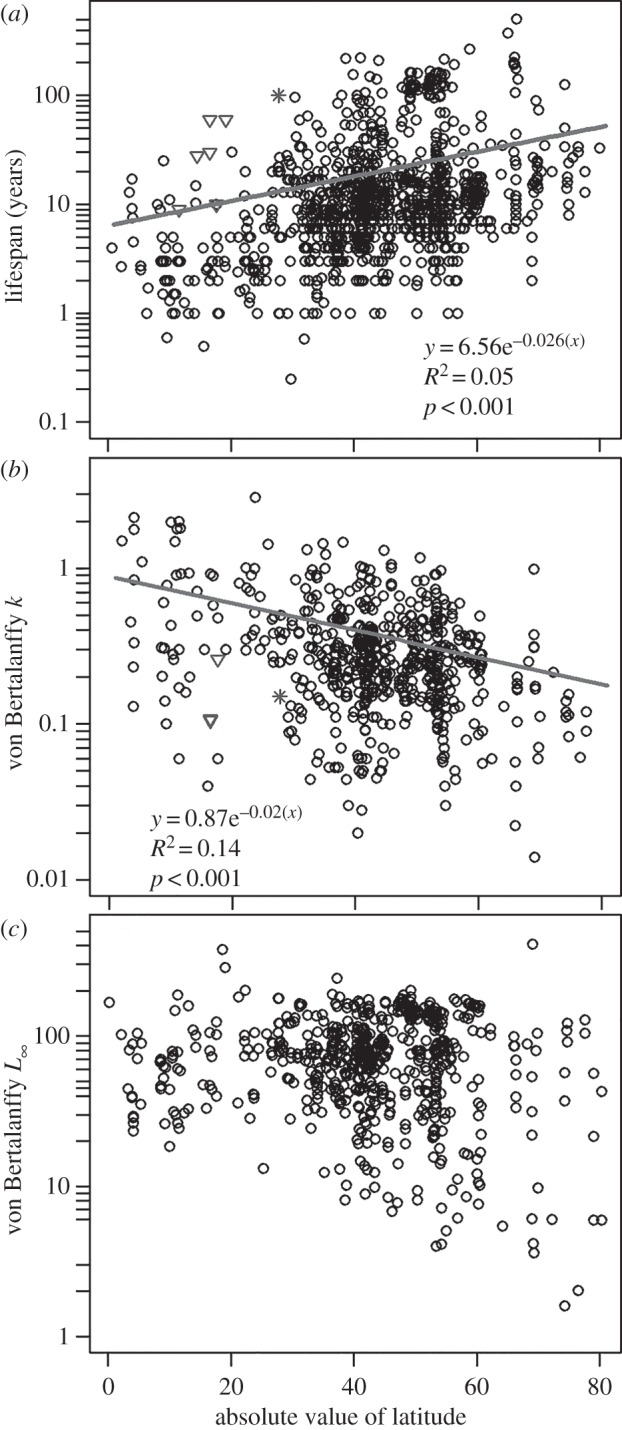
Relationships between latitude and life-history parameters in local populations of marine bivalves. (a) Maximum lifespan; n = 1 077. (b) Growth as measured by the von Bertalanffy growth parameter, k; n = 613. (c) Body size as measured by the von Bertalanffy L∞ parameter; n = 636. Inverted triangles denote Tridacna, a photosymbiotic taxon; asterisks denote Bathymodiolus, a chemosymbiotic taxon from a hydrothermal vent setting.
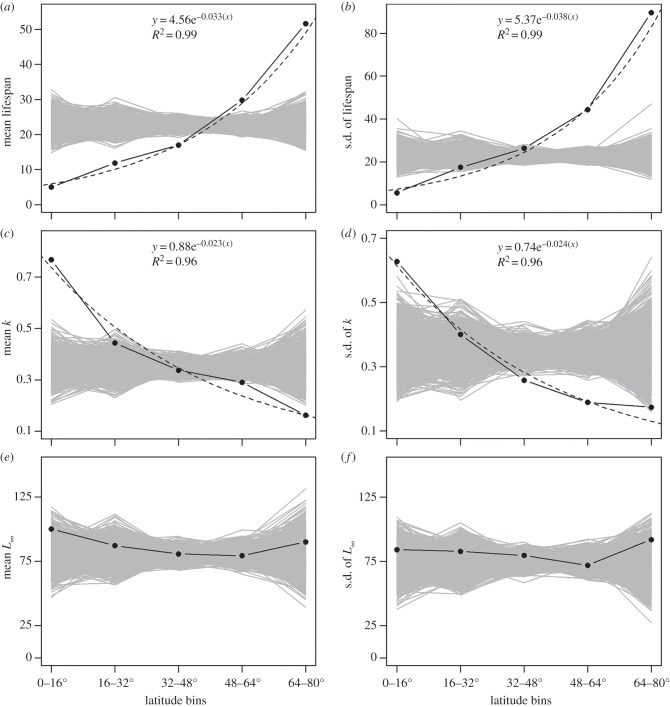
The potential for these observed patterns to arise simply from uneven sampling with latitude was evaluated by comparing observed data to modelled distributions where lifespan and k in fact have no relationship to latitude. For each variable, we generated exponential distributions using a rate term (slope on a log plot) equal to 1/mean of all observed values (a better approximation of the actual distribution than the best-fit to the discretized histogram), drew values from the modelled distributions at random, and randomly assigned them to each of our sampled-population latitudes, thus eliminating any preferred tendency with latitude. We then bin modelled data by latitude and calculated the mean and standard deviation of lifespan and k in each bin. After 1 000 trials, we compared the distributions of modelled lifespans, k-values, and body sizes in each bin, where there was no relation with latitude but sampling was still non-uniform, to the observed data. Despite being undersampled, observed lifespans were significantly shorter and less variable in the tropics, and higher and more variable near the poles, than seen in the randomized trials (figure 3a,b). Likewise, the observed mean and standard deviation of growth/metabolic rate were significantly higher in the tropics and lower towards the poles (figure 3c,d).
Figure 3.
Results of resampling procedures to evaluate the statistical significance of relationships between latitude and life-history parameters. Grey lines connect resampled values assuming no relationship with latitude. Black lines are the observed trends in values and their best-fit lines. (a) Mean and (b) standard deviation of maximum lifespan versus latitude. Mean observed lifespan = 22.47 for the entire database. (c) Mean and (d) standard deviation of von Bertalanffy k-values versus latitude. Mean observed k = 0.35 for entire database. Tropical and polar bivalves fall well outside the range of randomized trials for both lifespan and k. (e) Mean and (f) standard deviation of L∞. Observed values fall within the range of randomized trials suggesting no significant relationship.
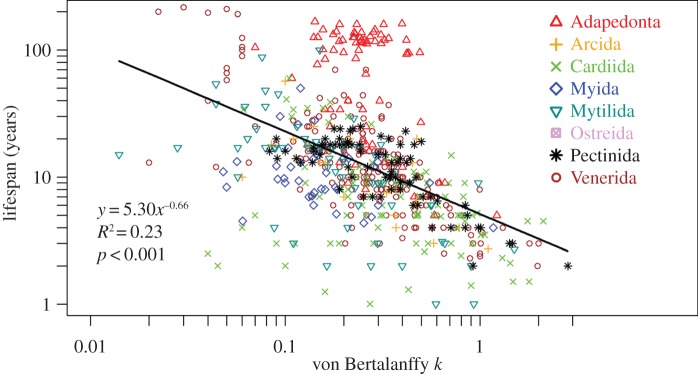
Plotting k versus lifespan reveals a significant log–log relationship (p < 0.001) such that slower growing bivalves tend to have longer lifespans than fast-growing forms (figure 4), corroborating a relationship suggested earlier from a limited dataset [8]. Data grouped by order (figure 4) or family exhibit the same negative lifespan–growth relationship, suggesting that causal factors act universally across taxa, rather than the pattern being merely an epiphenomenon of specialization for distinct physiologies or habitats. Because shell growth, more-so than soft-tissue growth, provides a strong proxy for metabolic rate [9], these data also indicate that short-lived (tropical) bivalves have faster metabolisms than long-lived (polar) species, an inference supported by oxygen consumption data for bivalves across a range of habitats [10].
Figure 4.
Relationship between the von Bertalanffy k growth coefficient and lifespan, with data points coded by Order within the Bivalvia. Only Orders with more than 20 observations are included. Six-hundred and thirteen populations contain data on both lifespan and growth rate. (Online version in colour.)
The exponential fits to frequency distributions of population MLSPs grouped into 16° latitudinal bands (electronic supplementary material, figure S1) illustrate the increasing proportion of populations with longer lived individuals as latitude increases. Such a pattern requires a systematic decrease in the exponent of the exponential equation (slope on a log scale) with latitude (electronic supplementary material, figure S1f). This value corresponds to the probability of death; higher slopes at low latitudes reflect higher overall rates of bivalve mortality (figure 5). This pattern is evident whether grouping data into bins of equal latitude or equal numbers of observations.
Figure 5.
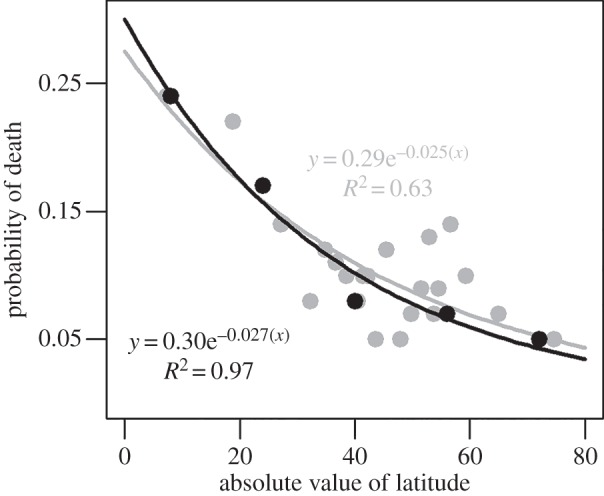
Probability of death versus latitude based on exponential fits to frequency distributions of populations MLSPs (electronic supplementary material, figure S1). Lifespan observations are binned by equal latitude (in black, 16° bins) or by equal number of observations (in grey, 50 lifespans per bin except last with 26). Total number of observations on lifespan = 1 078. Absolute value of latitude is plotted as the midpoint of each bin. Note that both approaches yield essentially the same relationship (p < 0.01).
While lifespan and growth rate demonstrate clear trends with latitude, the combined result of these two variables, body size, does not. Using the von Bertalanffy parameter L∞ as a proxy for maximum size within populations reveals no significant relationship between body size and latitude (figures 2c and 3e,f), lifespan, or growth rate (electronic supplementary material, figure S3a,b). Populations of slower growing, longer lived, high-latitude species show a similar range of sizes overall to those of faster growing, short-lived, tropical species. This lack of a consistent pattern in bivalve body size with latitude, within or across taxa, is supported by earlier work and has been discussed at some length (e.g. [11,12]).
Note that R2-values for the relationships described above are low; latitude alone is a poor predictor of lifespan and growth. Undoubtedly, the lifespans and growth rates exhibited within a population are controlled by a myriad of factors (e.g. see the discussion below), and this complexity contributes to the high variance exhibited in these relationships. Nevertheless, highly significant p-values indicate that, despite the variance, latitude and its correlates contribute in a substantive way to an explanation of lifespan and growth across marine Bivalvia today, and hence can be expected to have done so in the past as well.
3. Potential causal factors
Strong trends in lifespan and growth coefficient with latitude, both within and across taxa, require an explanation consistent with factors that vary systematically with latitude. Environmental variables such as temperature and light (and hence primary production, or food availability) are perhaps the most obvious—both have strong impacts on physiology through their influence on metabolism, and metabolic rate is widely suspected to relate causally to lifespan [13,14]. Indeed, our documentation of the relationship between lifespan and growth coefficient in bivalves lends further support to that hypothesis. The decrease in temperature that accompanies increasing latitude has a profound influence on biology; as temperature decreases, so too does metabolic rate in both plants and animals [15]. Metabolic rate is also influenced by the availability of food. For the dominantly filter-feeding bivalves, food constitutes phytoplankton and other suspended particles, and phytoplankton production is strongly tied to solar insolation. Studies on a range of animals have shown that caloric restriction increases lifespan, probably through a reduction in metabolic rate [16]. Today, high-latitude bivalves like Arctica islandica experience not only cold temperatures but also a limited and highly seasonal supply of food. Deconvolving their influence is difficult, but work with austral sea urchins demonstrates that the effect of starvation in winter on metabolism is far more significant than that of cold temperature [17]. In either case, long lifespan might simply be a side consequence of limited metabolism rather than a true adaptation to high-latitude environments. Alternatively, if trophic constraints are severe enough that successful reproduction in any given year is unlikely, then long life would be adaptive for organisms that spawn only once per year.
A decrease in disturbance frequency with latitude might also play a role in growth/lifespan trends because long-lived bivalves tend to delay the onset of reproduction for years or even decades [8], not a viable life-history strategy when an early death due to some calamity is probable. While physical/environmental disturbances such as storms or sediment gravity flows are unlikely to show a consistent relationship with latitude, ecological disturbances like predation could. Such has been postulated [18], and, while not observed everywhere [19,20], studies have demonstrated a decrease in both drilling [21] and skeleton-crushing [22] predation on bivalves with increasing latitude and extremely low predation in shallow Antarctic ecosystems [23–26]. Our data are consistent with the hypothesis that fast growth, and consequently shorter life, in the tropics is an adaptation to higher predation frequency. A general, though not universal, decrease in predation with latitude would allow for increasing variation in life-history strategies. While diversity and ecological interactions have a strong influence on local trophic structure (e.g. [27]), a putative latitudinal trend in predation intensity may itself also derive in part from the distribution of temperature and light over the Earth's surface.
Note that temperature and food supply in the oceans decrease not only with latitude, but also with water depth. There is evidence, too, that predation pressure decreases with increasing depth [25,28]. While not the focus of our study, water depth was reported for 425 of the populations in our dataset. Data are sparse, strongly skewed to shallow shelf depths, and often reported as ranges of values, but a tendency towards longer lifespan with increasing water depth is suggested (electronic supplementary material, figure S4a). There does not appear to be a relationship with growth rate or, perhaps less surprising given the lack of a latitudinal pattern as well, body size (electronic supplementary material, figure S4b,c). Nevertheless, the limitations of the available data require caution when interpreting pattern (see discussion in the electronic supplementary material). Additional targeted sampling might help to clarify the nature of these relationships.
4. Implications for Phanerozoic evolution
We document a clear global pattern in the latitudinal distribution of life-history parameters in today's oceans for a pervasive marine ectotherm, animals that also dominate the post-Palaeozoic fossil record and range back to the Cambrian. Is there a temporal trend in the expression of this pattern, and what might it mean for the evolution and ecology of marine ecosystems over the deep history of life? Despite the relative ease with which bivalve lifespans and growth rates can be determined from their shells, the longevities of fossil bivalves have only been reported in a handful of studies. Anecdotal data are consistent with today's broad latitudinal pattern persisting back through the Phanerozoic: subtropical molluscs live only a few years in the Eocene [29], mid-latitude (approx. 40° N) Jurassic gryphaeid bivalves live upwards of 20 years, and early Permian high-latitude faunas contain bivalves with lifespans of several to many decades [30], all consistent with the modern trend. The degree to which temperature is driving this pattern will determine how sensitive the gradient is to global climate change over time. Early in the Cenozoic, for example, the poles were a good deal warmer than today, yet bivalve centenarians are still present in austral polar faunas [31]. Such non-analogue settings, where temperature and light/food limitation are not as tightly correlated as they are today, can offer critical tests of their relative causal roles.
The pace of life—growth rate and lifespan—has significant implications for the interpretation of macroevolutionary trends. Not only is this at the heart of resolving modes of heterochronic change in the evolution of individual lineages [32,33], but there are potential connections to global Phanerozoic trends in body size, energetics, and diversity. Causal hypotheses for aspects of each of these can be tested using life-history data from the fossil record now that patterns in modern oceans are understood.
An increase in the mean body size of animals through time is now well documented [1,34], a trend manifest within bivalves as well (electronic supplementary material, figure S5). Today, consistent relationships between body size and latitude (figure 2), body size and lifespan (electronic supplementary material, figure S3a) or body size and growth rate (electronic supplementary material, figure S3b) cannot be demonstrated in marine bivalves, obfuscating the driving factor behind a temporal increase in body size using a space-for-time substitution argument. However, the relationship between lifespan and growth rate predicts that even limited new data on one variable or the other can bring greater clarity on how a trend towards larger body size comes about. The scenarios of increasing lifespan or growth rate bear rather different implications for the macroecological history of bivalves, hence these types of data are critical complements to existing data on body-size evolution.
An increase in the metabolic rate of marine organisms is an inherent prediction of broad ecological hypotheses such as Seafood through Time and escalation during the Mesozoic Marine Revolution [4,35]. This prediction is supported by Finnegan et al. [3], who used the metabolic model of Gillooly et al. [15] to relate increasing body size in post-Paleozoic gastropods to faster metabolic rates through time and provided the first quantitative test of the Energetics hypothesis. A subsequent analysis by Payne et al. [34] using size data of bivalves over the Phanerozoic suggests a similar increase in metabolic rates. The necessary assumptions that accompany the application of this model to extinct organisms in deep time call for some caution in interpreting the results. However, because shell growth correlates with both metabolic rate and lifespan, one could validate the Finnegan et al. [3] and Payne et al. [34] results, and hypotheses about energetics though time, with a targeted study of von Bertalanffy k-values and/or lifespans of shells sampled from similar palaeolatitudes over time. To the degree that lifespan/growth gradients are sensitive to temperature, our data also predict that polar faunas may become more ‘escalated’ during times of global warmth. Antarctic faunas during the warm Eocene are ecologically more similar to low-latitude assemblages than they become once temperature begins to fall [36]. Comparison of Eocene life-history traits with those from more recent cooler times could test this prediction.
Another fundamental biological pattern, the latitudinal diversity gradient, may not be unrelated to the distribution of life-history parameters with latitude. Speciation rates are in part dependent upon the rates of mutation, and taxa with shorter generation times have the potential to accumulate more variation in a given interval of time [37]. Because slow-growing bivalves also tend to delay the onset of sexual maturity [8], polar taxa might be less likely to spin off new species than are fast-growing tropical taxa. It is therefore not unreasonable to suggest that life-history parameters in fact contribute to the maintenance of the latitudinal diversity gradient. Such is consistent with observations of preferential bivalve origination in the tropics during the Neogene [38]. Furthermore, a connection might be made with the modest rise in sample-standardized diversity seen over the Phanerozoic [39].
While the potential for testing hypotheses about relationships between life-history traits and spatio-temporal macroevolutionary trends using the modern and fossil record is high, little work has thus far been done. This may be the next frontier of palaeobiological research.
Supplementary Material
Supplementary Material
Acknowledgements
The manuscript is much improved due to constructive feedback provided by Jonathan Payne and Elizabeth Harper. We thank Doug Jones, Jim Brower, Seth Finnegan, Margaret Voss, and Bruce Wilkinson for inspiration, assistance, and reviews of early drafts.
Data accessibility
The datasets supporting this article have been uploaded as part of the electronic supplementary material.
Authors' contributions
L.C.I. and D.K.M. conceived the project; D.K.M. and L.C.I. participated in data collection, conducted data analysis, and drafted the manuscript; E.J.J. participated in data collection and edited the manuscript; P.W.C., C.E.B., W.K., E.G.A., and J.R.D. participated in data collection. All authors gave final approval for publication.
Competing interests
We declare we have no competing interests.
Funding
Research was supported in part by the Department of Earth Sciences and the College of Arts and Sciences at Syracuse University, and by grants to D.K.M. from the Paleontological Society and the Geological Society of America.
References
- 1.Heim N, Knope M, Schaal E, Wang S, Payne J. 2015. Cope's rule in the evolution of marine animals. Science 347, 867–870. ( 10.1126/science.1260065) [DOI] [PubMed] [Google Scholar]
- 2.Payne JL, et al. 2009. Two-phase increase in the maximum size of life over 3.5 billion years reflects biological innovation and environmental opportunity. Proc. Natl Acad. Sci. USA 106, 24–27. ( 10.1073/pnas.0806314106) [DOI] [PMC free article] [PubMed] [Google Scholar]
- 3.Finnegan S, McClain C, Kosnik M, Payne J. 2011. Escargots through time: an energetic comparison of marine gastropod assemblages before and after the Mesozoic Marine Revolution. Paleobiology 37, 252–269. ( 10.1666/09066.1) [DOI] [Google Scholar]
- 4.Bambach R. 1993. Seafood through time: changes in biomass, energetics, and productivity in the marine ecosystem. Paleobiology 19, 372–397. [Google Scholar]
- 5.Smith FA, et al. 2016. Body size evolution across the Geozoic. Annu. Rev. Earth Planet. Sci. 44, 523–553. ( 10.1146/annurev-earth-060115-012147) [DOI] [Google Scholar]
- 6.von Bertalanffy L. 1938. A quantitative theory of organic growth (inquiries on growth laws II). Hum. Biol. 10, 181–213. [Google Scholar]
- 7.Butler PG, Wanamaker AD, Scourse JD, Richardson CA, Reynolds DJ. 2013. Variability of marine climate on the North Icelandic Shelf in a 1357-year proxy archive based on growth increments in the bivalve Arctica islandica. Palaeogeogr. Palaeoclimatol. Palaeoecol. 373, 141–151. ( 10.1016/j.palaeo.2012.01.016) [DOI] [Google Scholar]
- 8.Ridgway ID, Richardson CA, Austad SN. 2011. Maximum shell size, growth rate, and maturation age correlate with longevity in bivalve molluscs. J. Gerontol. A Biol. Sci. Med. Sci. 66, 183–190. ( 10.1093/gerona/glq172) [DOI] [PMC free article] [PubMed] [Google Scholar]
- 9.Lewis DE, Cerrato RM. 1997. Growth uncoupling and the relationship between shell growth and metabolism in the soft shell clam Mya arenaria. Mar. Ecol. Progress Ser. 158, 177–189. ( 10.3354/meps158177) [DOI] [Google Scholar]
- 10.Vladimirova I, Kleimenova S, Radzinskaya L. 2003. The relation of energy metabolism and body weight in bivalves (Mollusca:Bivalvia). Biol. Bull. 30, 392–399. ( 10.1023/A:1024822225406) [DOI] [Google Scholar]
- 11.Berke SK, Jablonski D, Krug AZ, Roy K, Tomasovych A. 2013. Beyond Bergmann's rule: size-latitude relationships in marine Bivalvia world-wide. Glob. Ecol. Biogeogr. 22, 173–183. ( 10.1111/j.1466-8238.2012.00775.x) [DOI] [Google Scholar]
- 12.Roy K, Jablonski D, Martien K. 2000. Invariant size-frequency distributions along a latitudinal gradient in marine bivalves. Proc. Natl Acad. Sci. USA 97, 13 150–13 155. ( 10.1073/pnas.97.24.13150) [DOI] [PMC free article] [PubMed] [Google Scholar]
- 13.Van Voorhies W. 2001. Metabolism and lifespan. Exp. Gerontol. 36, 55–64. ( 10.1016/S0531-5565(00)00208-4) [DOI] [PubMed] [Google Scholar]
- 14.Speakman JR. 2005. Body size, energy metabolism and lifespan. J. Exp. Biol. 208, 1717–1730. ( 10.1242/jeb.01556) [DOI] [PubMed] [Google Scholar]
- 15.Gillooly JF, Brown JH, West GB, Savage VM, Charnov EL. 2001. Effects of size and temperature on metabolic rate. Science 293, 2248–2251. ( 10.1126/science.1061967) [DOI] [PubMed] [Google Scholar]
- 16.Fontana L, Partridge L, Longo VD. 2010. Extending healthy life span - from yeast to humans. Science 329, 1014–1015. ( 10.1126/science.329.5995.1014) [DOI] [PMC free article] [PubMed] [Google Scholar]
- 17.Brockington S, Clarke A. 2001. The relative influence of temperature and food on the metabolism of a marine invertebrate. J. Exp. Mar. Biol. Ecol. 258, 87–99. ( 10.1016/S0022-0981(00)00347-6) [DOI] [PubMed] [Google Scholar]
- 18.Vermeij G. 1978. Biogeography and adaptation, 332 Cambridge, MA: Harvard University Press. [Google Scholar]
- 19.Vermeij G, Dudley E, Zipser E. 1989. Successful and unsuccessful drilling predation in recent pelecypods. The Veliger 32, 266–273. [Google Scholar]
- 20.Kelley P, Hansen T. 2007. Latitudinal patterns in naticid gastropod predation along the east coast of the United States: a modern baseline for interpreting temporal patterns in the fossil record. In Sediment-organism interactions: a multifaceted ichnology (eds Bromley RG, Buatois L, Mangano M, Genise J, Melchor R), pp. 287–289. SEMP Special Publication 88; Tulsa OK. [Google Scholar]
- 21.Visaggi CC, Kelley PH. 2015. Equatorward increase in naticid gastropod drilling predation on infaunal bivalves from Brazil with paleontological implications. Palaeogeogr. Palaeoclimatol. Palaeoecol. 438, 285–299. ( 10.1016/j.palaeo.2015.07.045) [DOI] [Google Scholar]
- 22.Bertness MD, Garrity SD, Levings SC. 1981. Predation pressure and gastropod foraging: a tropical-temperate comparison. Evolution 35, 995–1007. ( 10.2307/2407870) [DOI] [PubMed] [Google Scholar]
- 23.Aronson RB, Thatje S, Clarke A, Peck LS, Blake DB, Wilga CD, Seibel BA. 2007. Climate change and invasibility of the Antarctic benthos. Annu. Rev. Ecol. Evol. Syst. 38, 129–154. ( 10.1146/annurev.ecolsys.38.091206.095525) [DOI] [Google Scholar]
- 24.Martinelli JC, Gordillo S, Archuby F. 2013. Muricid drilling predation at high latitudes: Insights from the southernmost Atlantic. Palaios 28, 33–41. ( 10.2110/palo.2012.p12-087r) [DOI] [Google Scholar]
- 25.Harper EM, Peck L. 2003. Predatory behaviour and metabolic costs in the Antarctic muricid gastropod Trophon longstaffi. Polar Biol. 26, 208–217. ( 10.1007/s00300-002-0455-y) [DOI] [Google Scholar]
- 26.Harper EM, Peck LS. 2016. Latitudinal and depth gradients in marine predation pressure. Glob. Ecol. Biogeogr. 25, 670–678. ( 10.1111/geb.12444) [DOI] [Google Scholar]
- 27.Hairston NGJ, Hairston NGS. 1993. Cause-effect relationships in energy flow, trophic structure, and interspecific interactions. Am. Nat. 142, 379–411. ( 10.1086/285546) [DOI] [Google Scholar]
- 28.Oji T. 1996. Is predation intensity reduced with increasing depth? Evidence from the West Atlantic stalked crinoid Endoxocrinus parrae (Gervais) and implications for the Mesozoic Marine Revolution. Paleobiology 22, 339–351. [Google Scholar]
- 29.Haveles A, Ivany LC. 2010. Rapid growth of mollusks in the Eocene Gosport Sand US. Gulf Coast. Palaios 25, 550–564. ( 10.2110/palo.2009.p09-148r) [DOI] [Google Scholar]
- 30.Ivany LC, Runnegar B. 2010. Early Permian seasonality from bivalve δ18O and implications for the oxygen isotopic composition of seawater. Geology 38, 1027–1030. ( 10.1130/g31330.1) [DOI] [Google Scholar]
- 31.Buick DP, Ivany LC. 2004. 100 years in the dark: extreme longevity of Eocene bivalves from Antarctica. Geology 32, 921–924. ( 10.1130/g20796.1) [DOI] [Google Scholar]
- 32.Jones DS. 1988. Sclerochronology and the size versus age problem. In Heterochrony in evolution (ed. McKinney ML.), pp. 94–108. New York, NY: Plenum Publishing Corporation. [Google Scholar]
- 33.Jones DS, Gould SJ. 1999. Direct measurement of age in fossil Gryphaea: the solution to a classic problem in heterochrony. Paleobiology 25, 158–187. [Google Scholar]
- 34.Payne JL, Heim NA, Knope ML, McClain CR. 2014. Metabolic dominance of bivalves predates brachiopod diversity decline by more than 150 million years. Proc. R. Soc. B 281, 20133122 ( 10.1098/rspb.2013.3122) [DOI] [PMC free article] [PubMed] [Google Scholar]
- 35.Vermeij G. 1977. The Mesozoic marine revolution: evidence from snails, predators, and grazers. Paleobiology 3, 245–258. [Google Scholar]
- 36.Aronson RB, Moody RM, Ivany LC, Blake DB, Werner JE, Glass A. 2009. Climate change and trophic response of the Antarctic bottom fauna. PLoS ONE 4, e4385 ( 10.1371/journal.pone.0004385) [DOI] [PMC free article] [PubMed] [Google Scholar]
- 37.Thomas JA, Welch JJ, Lanfear R, Bromham L. 2010. A generation time effect on the rate of molecular evolution in invertebrates. Mol. Biol. Evol. 27, 1173–1180. ( 10.1093/molbev/msq009) [DOI] [PubMed] [Google Scholar]
- 38.Jablonski D, Roy K, Valentine JW. 2006. Out of the tropics: evolutionary dynamics of the latitudinal diversity gradient. Science 314, 102–106. ( 10.1126/science.1130880) [DOI] [PubMed] [Google Scholar]
- 39.Alroy J, et al. 2008. Phanerozoic trends in global diversity of marine invertebrates. Science 321, 97–100. ( 10.1126/science.1156963) [DOI] [PubMed] [Google Scholar]
Associated Data
This section collects any data citations, data availability statements, or supplementary materials included in this article.
Supplementary Materials
Data Availability Statement
The datasets supporting this article have been uploaded as part of the electronic supplementary material.


