Abstract
Influenza viruses undergo frequent antigenic changes. As a result, the viruses circulating change within and between seasons, and the composition of the influenza vaccine is updated annually. Thus, estimation of the vaccine's effectiveness is not constant across seasons. In order to provide annual estimates of the influenza vaccine's effectiveness, health departments have increasingly adopted the “test-negative design,” using enhanced data from routine surveillance systems. In this design, patients presenting to participating general practitioners with influenza-like illness are swabbed for laboratory testing; those testing positive for influenza virus are defined as cases, and those testing negative form the comparison group. Data on patients' vaccination histories and confounder profiles are also collected. Vaccine effectiveness is estimated from the odds ratio comparing the odds of testing positive for influenza among vaccinated patients and unvaccinated patients, adjusting for confounders. The test-negative design is purported to reduce bias associated with confounding by health-care-seeking behavior and misclassification of cases. In this paper, we use directed acyclic graphs to characterize potential biases in studies of influenza vaccine effectiveness using the test-negative design. We show how studies using this design can avoid or minimize bias and where bias may be introduced with particular study design variations.
Keywords: causal inference, directed acyclic graphs, epidemiologic methods, influenza, observational studies, test-negative study design, vaccine effectiveness
Editor's note:An invited commentary on this article appears on page 354.
Influenza viruses undergo frequent antigenic changes; thus, influenza vaccination in one season may no longer confer protection in a subsequent season (1). The composition of the vaccine is updated twice each year by an expert working group that reviews global surveillance data on circulating strains (1). Therefore, the strain composition of the vaccine, the strains of the virus circulating, and vaccine effectiveness (VE) can all change between seasons.
In recent years, many research groups and health departments have enhanced existing influenza surveillance systems to enable near real-time estimation of influenza VE. This is achieved using the case test-negative study design (2). In a typical study using this design, swabs are collected from patients presenting to ambulatory care clinics with influenza-like illness and submitted for laboratory testing; those patients who test positive for influenza virus are defined as cases, and those who test negative form the noncase group (2, 3). Data on patients' vaccination histories, ages, sexes, and risk profiles are also collected. VE is estimated from the odds ratio comparing the odds of testing positive for influenza virus among vaccinated patients with the odds among unvaccinated patients by means of logistic regression, adjusting for potential confounders. This particular type of study has the advantage over traditional cohort or case-control designs of being relatively cheap and fast to conduct. Moreover, it is said to reduce the possibility of differential health-care-seeking behaviors among cases and noncases, and it reduces the risk of misclassification of influenza status (2).
This type of study design was initially used to study pneumococcal vaccine (4), and it has been used to estimate influenza VE since 2005 (5), after which it was rapidly adopted worldwide (3). However, the validity of the design has not been fully explored. Simulation studies have shown that the design can produce estimates comparable with those of case-control and cohort studies in the presence of a highly specific diagnostic test (6, 7). De Serres et al. (8) used data from a randomized controlled trial of influenza vaccination to show that VE estimates from a test-negative-style analysis were very similar to the estimates of vaccine efficacy based on ratios of incidence rates in the trial cohort. Finally, Foppa et al. (9) used simulation methods to show how the design may produce biased estimates. Here, we will build on this body of work using causal diagrams to represent studies using the test-negative design and show how they can avoid bias and where bias may be introduced with common study design variations.
DESIGN OF THE TEST-NEGATIVE STUDY
The term “test-negative design” is used to describe various study designs for estimating influenza VE. However, in epidemiologic terms, these studies may actually use different methodologies (summarized in Table 1). For simplicity, in this paper we focus only on studies embedded in surveillance programs. In such studies, patients meeting a clinical case definition for influenza-like illness or acute respiratory illness are recruited prospectively through participating ambulatory care clinics or hospitals. After recruitment and informed consent, patients' demographic details and vaccination histories are recorded or may be supplemented with registry records. Laboratory testing for influenza virus is performed; patients who test positive form the case group, and those who test negative are the comparison group. Although these studies have frequently been called case-control studies, a sampling frame is not used to guide recruitment. They may instead be thought of as a cohort study wherein the strata containing people who do not meet the clinical case definition are ignored (10).
Table 1.
Two Types of Studies Which Use a Test-Negative Comparison Group
| Setting | Surveillance Program | Diagnostic Records/Electronic Health Records |
|---|---|---|
| Data collection | Prospective | Retrospective |
| Sampling | Patients with a common clinical case definition recruited in a clinical setting and tested for influenza virus | All patients tested for influenza virus for diagnostic purposes |
| No common clinical case definition | ||
| Case group | Patients testing positive for influenza virus | Cases testing positive for influenza virus identified from medical/laboratory records |
| Case status unknown at time of recruitment | ||
| Comparison group | Patients testing negative for influenza virus | Patients testing negative for influenza virus |
| Vaccination status | Prospectively ascertained and verified | Obtained from medical/registry records |
Conversely, some studies use a nested a case-control design based on laboratory or medical records, where all patients with both vaccination information and an influenza test are used to estimate VE. This was the design originally used for the study of pneumococcal VE, termed an “indirect cohort design” (4, 11). Being opportunistic, these designs may not have a defined clinical case definition or adequately enumerate important covariates, which can result in significant losses of data due to missingness.
REVIEW OF CAUSAL DIAGRAMS
A causal diagram is a graphical tool that enables the visualization of causal relationships between variables in a causal model (12, 13). One particular class of causal diagrams, directed acyclic graphs (DAGs), have been described in detail previously (12, 14). Basic DAG terminology is described in the Web Appendix and Web Figure 1 (available at http://aje.oxfordjournals.org/). DAGs provide a convenient method of mapping out assumed causal relationships based on our prior knowledge about biological mechanisms and plausibility. Using these diagrams, it is possible to see where design components and statistical adjustment can eliminate bias or introduce it. In this paper, we use DAGs as a tool to illustrate various features in the design and analysis of test-negative studies intended to address confounding and specific biases.
USE OF THE ODDS RATIO IN TEST-NEGATIVE STUDIES
The VE in a test-negative study is estimated from the adjusted odds ratio (15). Similar to case-control studies, selection in a test-negative study is based on the outcome (because only persons with symptoms seek care). This would ordinarily bias the effect estimate (16). However, the odds ratio, because it is invariant to the marginal distribution of the outcome, avoids this bias (17). When sampling fractions are known or, equivalently, when the prevalence of disease in the population from which the cases arise is known, it is possible to recover the risk ratio or risk difference (18). Absent other biases (confounding, selection bias, measurement error, informative missingness) and where parametric assumptions are met, the design permits: 1) a valid test of the null hypothesis of no causal effect; 2) a consistent estimate of the causal odds ratio, which, although overstating the causal risk ratio, will be nonzero when the latter is, but also will be in the same direction as the latter; and 3) in subgroups of the population where the outcome is rare, it is possible to obtain an approximate estimate of the risk ratio (17). DAGs, being nonparametric in nature, cannot convey these properties of the odds ratio (19).
CONFOUNDING IN TEST-NEGATIVE STUDIES
A review of factors likely to cause confounding in VE studies was conducted by the Influenza Monitoring of Vaccine Effectiveness (I-MOVE) network in Europe (20). Among the list of potential confounders identified, the variables most often considered for influenza VE are age, high-risk status, calendar time, and sex (3). This is the minimum set of confounders we will use throughout our examples. One can see how all of these variables are parents of both vaccination and influenza, regardless of study design, and thus satisfy the condition for confounding of opening a backdoor path from influenza status to vaccination (12).
Age is a confounder because young children and the elderly are more likely to be infected due to immaturity of the immune system in children (21) or immunosenescence in the elderly (22); they may also be more or less likely to be vaccinated, depending on public health strategies and other factors (23). Similarly, high-risk status may confound VE estimates because certain conditions can increase a person's risk of influenza infection and his/her likelihood of vaccination or eligibility for free vaccination (24). These conditions include cardiac disease, chronic respiratory conditions, chronic neurological conditions, immunocompromising conditions, diabetes and other metabolic disorders, renal disease, hematological disorders, long-term aspirin therapy in children aged 6 months–10 years, pregnancy, obesity, alcoholism, and indigenous status (23, 25). Calendar time is a potential confounder because vaccination often occurs as part of a campaign prior to or at the start of an influenza season and protection may wane as the season progresses (26), while the risk of influenza infection rises and falls with the epidemic curve. Finally, sex is a plausible confounder because women may be more likely to be vaccinated (27) and may experience greater exposure to influenza through greater contact with children (28, 29). However, we note that sex is not a universally accepted confounder and is frequently omitted from VE estimation (3).
Figure 1 depicts a simple scenario of a study of the effect of vaccination V on influenza status I, with confounding by age A, high-risk status HR, calendar time CT, and sex S. There are backdoor paths from V to I via each of these variables (e.g., V←A→I), which results in biased estimates of the crude odds ratio. By including these 4 variables in a regression model (depicted by the rectangles), it is hoped that these paths are blocked and confounding bias removed.
Figure 1.
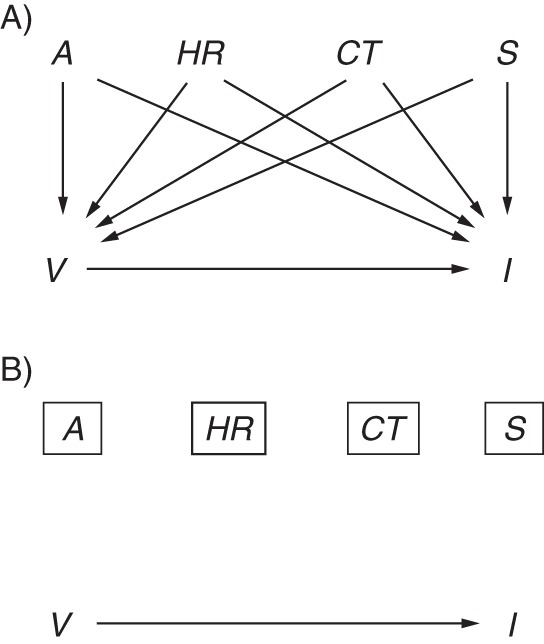
Simple directed acyclic graph of influenza vaccine effectiveness with confounding. The causal effect of interest is the effect of vaccination V on influenza I, shown by the arrow from V to I. A) Potential confounders include age A, high-risk status HR, calendar time CT, and sex S. For each potential confounder, there is a directed path to both I and V. B) The rectangles around each confounder indicate adjustment in a statistical model and closure of the biasing paths (directed paths are removed).
Prior exposure history and time-varying covariates
An important confounder missing from nearly all studies of influenza VE is the prior exposure history of a patient, which includes both prior infection and prior vaccination status. Exposure to the virus is believed to induce lifelong cellular and humoral immunity that not only protects against infection by the original infective strain but may also provide cross-protection against antigenically similar strains (30, 31). Figure 2 shows a possible time-varying graph for 2 influenza seasons, denoted 1 for the previous season and 2 for the current season. For simplicity, age, high-risk status, calendar time, and sex are subsumed under the set of confounders C. When the effect of interest is that of current vaccination V2 on current influenza I2, the effect is confounded not only by C2 but also by previous vaccination V1 (discussed below) and previous influenza status I1. An unbiased approach would appropriately control for previous influenza status (I1)—information which is probably impossible, or at least impractical, to collect (an exception might be the long-term follow-up of a birth cohort with frequent serological and virological testing). Thus, any estimate of the effect of V2 on I2 could be biased, regardless of the study design used.
Figure 2.
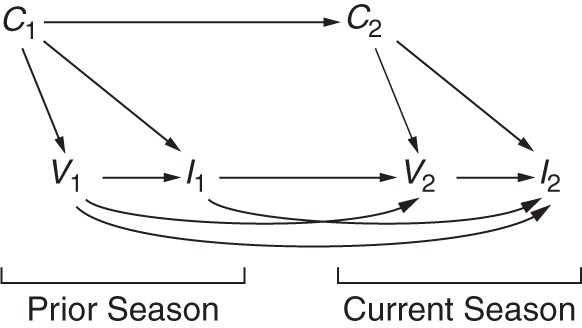
Directed acyclic graph illustrating the time-varying effects of prior exposure to the influenza vaccine and influenza virus across 2 seasons. The current season is depicted with a subscript 2, while the prior season is depicted with a subscript 1. The effect of interest is that of vaccination status in the current season V2 on current season influenza status I2. Influenza status in the previous season may influence a person's decision to be vaccinated in the current season (I1→V2) and will affect his/her susceptibility to infection in the current season, if the strains are similar or confer some cross-protection (I1→I2). Vaccination in the previous season influences vaccination in the current season (V1→V2), and protection may linger until the current season (V1→I2). Confounder status in the previous season C1, particularly age and high-risk status, is an ancestor of, but may differ from, confounder status in the current season C2 (C1→C2) and will influence both vaccination status (C1→V1) and influenza status (C1→I1).
In addition, vaccination with an inactivated vaccine (the most widely used type of vaccine) induces short-term antibody-mediated protection, which is unlikely to be lifelong but may continue beyond a single season. However, under certain conditions, the residual effects of vaccination in one season may interfere with the protection expected from vaccination in a subsequent season, leading to little or no protection against a new epidemic strain (32). Several recent studies have attempted to examine the role of repeated vaccination (33–35); that is, they included V1 in their model of the effect of V2 on I2. A model of the joint effects of V1 and V2 on I2 which controls only for C2 does not appropriately control for confounding bias along the path from V2←I1→I2. Moreover, were these variables available, standard statistical methods such as logistic regression would be inadequate to control the bias. This is because I1 is an example of a confounder of V2 that is simultaneously a mediator of the effect of V1. Instead, methods for time-varying exposures, such as G-estimation (36, 37) or marginal structural models (38), would be indicated.
Confounding by health-care-seeking behavior
In cohort studies, it has been shown that higher uptake of vaccination by relatively healthy seniors accounts for much of the beneficial effect of vaccination (39). The test-negative design, by selecting only patients who have sought medical attention, is said to remove bias due to confounding by health-care-seeking behavior (2), defined here as a person's propensity to seek care when ill. Such behavior might confound the relationship if it increases not only vaccination but also engagement in behaviors that reduce the risk of influenza infection (e.g., hand-washing (40)). It could thus be included in Figure 1 as another node HS (shown in parentheses because it is unmeasured) with arrows to V and I, resulting in the backdoor path I←HS→V (Figure 3A). Other confounders in the set C (i.e., age, high-risk status, sex, and calendar time) might also influence health-care-seeking (C→HS). If, by design, only people with a propensity to seek care when ill are selected into the study, we could think of HS as a binary variable (seeks care when ill = 1, does not seek care when ill = 0) and could extend Figure 3A to show restriction to patients with positive health-care-seeking behaviors (HS = 1; Figure 3B). Under this assumption, the level of confounding does not vary across groups and therefore does not bias the association, though it may reduce generalizability (see Daniel et al. (19)).
Figure 3.
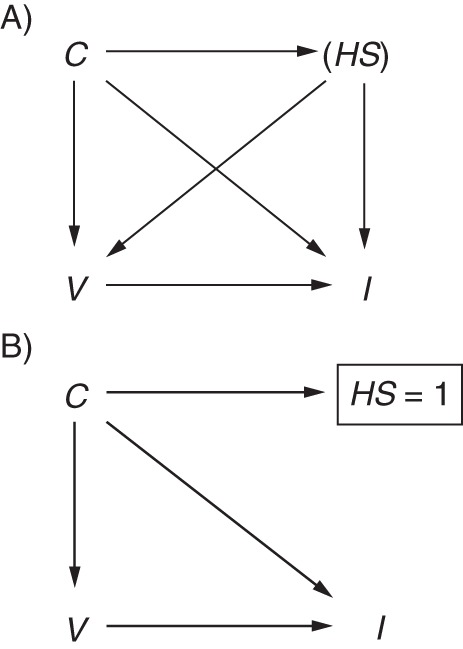
Directed acyclic graph illustrating confounding by health-care-seeking behavior. A) Health-care-seeking HS confounds the relationship between vaccination V and influenza infection I. The parentheses indicate that HS is unmeasured. Additional confounders C may be parents of HS (C→HS). B) By including only patients with positive health-care-seeking behaviors (shown by the rectangle around HS = 1), the test-negative design implicitly removes this source of confounding (biasing paths removed).
However, health-care-seeking is unlikely to be binary, since it represents someone's propensity to seek care, which is based on many factors. For example, when employers require staff to obtain a medical certificate in order to take medical leave, many people who do not otherwise engage in healthful behaviors may visit a health-care practitioner for care. Similarly, in hospital-based studies, it might be difficult to argue that only people with positive health-care-seeking behaviors seek hospital admission when severely ill. Thus, HS is unlikely to be completely captured by a single binary indicator of whether or not a person presents himself/herself to a physician when experiencing influenza symptoms, so HS would remain partially unobserved (as in Figure 3B), and the test-negative design is unlikely to completely block the effects of this confounder. Whether the design reduces the degree of confounding cannot be answered using DAGs. However, while controlling for a variable that represents an imperfect measure of a confounder may not eliminate bias, it can reduce it (41, 42).
SELECTION BIAS IN TEST-NEGATIVE STUDIES
By restricting recruitment to patients meeting a certain clinical case definition, we hope the cases and noncases are selected from the same population, a tenet central to the validity of case-control studies (10). The selection of patients into a study using the test-negative design is dependent on whether a patient seeks medical attention for treatment, agrees to participate in the study, and is tested. Some of this behavior is probably influenced by health-care-seeking behavior and the severity of disease. This type of bias is similar to “confounding by indication,” which has been described as both a type of confounding and a type of selection bias (43). Figure 4 extends Figure 3B to show selection of patients into a test-negative study. Health-care-seeking behavior HS influences a person's decision to be vaccinated, seek care, and be tested T (tested = 1, not tested = 0). Under this scenario, the test-negative design, by including only patients tested for influenza (T = 1), induces selection bias by conditioning on the collider T. This opens a backdoor path from I→T←HS→V, a path that would remain open even if health-care-seeking was not a parent of influenza status. Were HS adequately controlled (e.g., if HS = 1), then the selection bias (and confounding bias) would be blocked. Under such a scenario, the merits of the test-negative design not only would include control of confounding by health-care-seeking behavior but also would control selection bias associated with health-care-seeking behavior. However, as already noted, it is unlikely that HS = 1, and the bias is unlikely to be eliminated.
Figure 4.
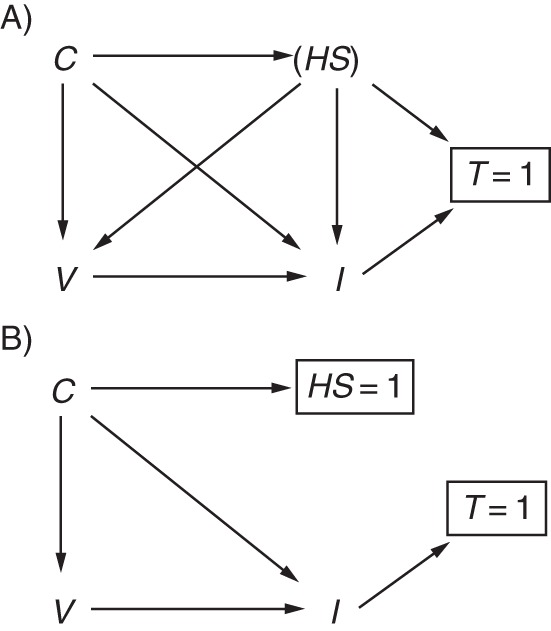
Directed acyclic graph illustrating selection bias by health-care-seeking behavior. A) Health-care-seeking HS confounds the relationship between vaccination V and influenza status I and also influences testing and selection into the study T. Influenza status may also influence a person to seek care and be tested. Additional confounders of the V→I relationship are represented by C and may also influence HS. Only patients who are tested for influenza (T = 1) are included in the study, resulting in collider bias. B) Control of HS (HS = 1) blocks the biasing path.
Although it is not explicitly shown in Figure 4, the bias induced by selection on the outcome (arrow from I to T) is avoided when using the odds ratio to estimate VE. Further illustrations of the use of DAGs for outcome-dependent selection can be found in the paper by Didelez et al. (44).
MISCLASSIFICATION IN CASE TEST-NEGATIVE STUDIES
Misclassification of influenza status
The test-negative study design is said to reduce misclassification of influenza status by including only those patients with a laboratory test result (2). In cohort or case-control studies, the noncases are assumed to be uninfected with influenza virus, but without confirmation they may in fact be misclassified thus. The opposite situation is less likely, as a majority of studies use real-time reverse-transcription polymerase chain reaction, the specificity of which is likely to be close to 100% (45). Thus, the opportunity for misclassifying a noncase as a case may be limited to data-entry errors or sample contamination. Figure 5 extends Figure 1 to the situation where I* is the observed influenza status and UI is the set of all unmeasured factors other than influenza status I which cause I* (46). For now, the DAG assumes that misclassification is independent and nondifferential, as shown by the absence of an arrow from V to UI (discussed further below), and would therefore lead to bias towards the null.
Figure 5.
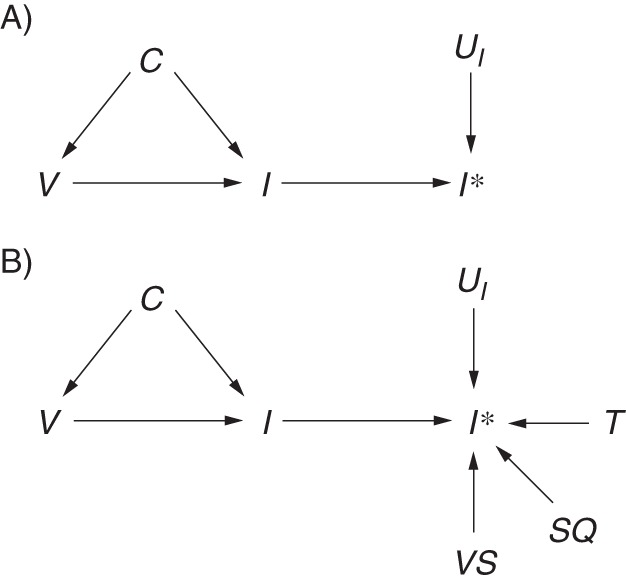
Directed acyclic graph illustrating misclassification of outcome status in a test-negative study. I* indicates measured influenza status. A) UI includes all of the factors that influence measurement of influenza status (UI →I*). B) UI is separated into known components, including availability of a test result T, viral shedding VS, and sample quality SQ, as well as other components that remain unknown UI.
Correct classification of a case does not depend only on whether he or she has been tested. Not all infected patients shed detectable virus after infection (depending on type/subtype). Shedding precedes symptoms by about a day (47) and continues, on average, for around 4–5 days (47), so there is a reasonable chance that patients presenting 4 days after symptom onset are no longer shedding virus and that the test result will be falsely negative. To overcome this potential source of error, many test-negative studies restrict patients to those presenting to a health-care provider within 4 days of symptom onset (3). Sensitivity may be further improved by choosing noncases from swabs testing positive for another respiratory virus to ensure that the respiratory sample was of sufficient quality to detect virus (48, 49). Swab quality is also determined by the swabbing technique of the attending physician, the swab site (e.g., nasal vs. nasopharyngeal), and the swab material (e.g., mattress vs. flocked) (50), so steps may be taken in the design to optimize sample quality. Figure 5B separates UI into additional components of the entire testing process, including viral shedding VS and swab quality SQ, to demonstrate that the availability of a test result is only one of many factors in UI. Thus, the reduction in measurement error gained by using a test-negative design over a cohort or case-control design is probably only minimal. Moreover, this measurement error is caused by imperfect (probably nondifferential) sensitivity in the presence of high specificity, which in practice is likely to only minimally harm validity (51).
The absence of an arrow from V to UI represents a very strong assumption, made here due to the lack of evidence for reduced viral shedding among patients receiving inactivated vaccines (52). This assumption may be violated when considering the lesser-used live attenuated vaccines (53, 54) or the in-development T-cell vaccines (55), which elicit a cell-mediated immune response that can reduce symptom severity and viral shedding. Extending Figure 5B, Figure 6 shows this association as a path through V→VS→I*, which represents reduced detection of influenza status I* among patients who were truly infected with influenza I, despite vaccination V, but were undetected due to minimal viral shedding VS. This is likely to result in bias away from the null (56).
Figure 6.
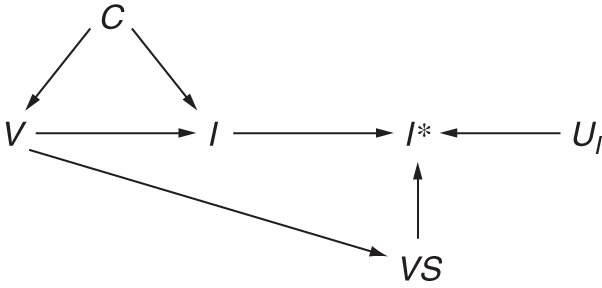
Directed acyclic graph illustrating differential misclassification of influenza status. Influenza status I may be differentially ascertained I* with respect to vaccination status V due to reduced viral shedding VS among recipients of live attenuated influenza vaccine.
Exposure misclassification
Unlike a traditional case-control study or retrospective cohort study, which may determine vaccination status after infection and may therefore be subject to differential recall by influenza status, test-negative studies avoid differential recall bias of the exposure because case status is unknown at the time of recruitment. However, these studies still rely on some form of recall to ascertain vaccination status, unlike a prospective cohort study, which may determine exposure at the start of follow-up. Vaccination status may be ascertained through self-reporting, which has been shown to have limited accuracy (57, 58), and even where registries exist or medical records can be consulted, these records can be wrong or incomplete. Figure 7 extends Figure 5A to include measured vaccination status V* and all factors contributing to misclassification of vaccination status UV. These sources of error are likely to be nondifferential but may affect specificity and could therefore lead to substantial bias in the resulting VE estimates (59).
Figure 7.
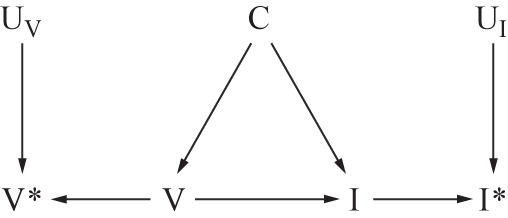
Directed acyclic graph illustrating independent, nondifferential misclassification of both influenza and vaccination status. True influenza status I may be misclassified I* due to the effects of factors which contribute to the measurement of influenza status UI. True vaccination status V may be misclassified V* due to the effects of factors which contribute to the measurement of vaccination status UV. C indicates other confounders of V→I and in this graph are assumed to be independent of I* and V*.
Misclassification of disease status within levels of confounders
While differential misclassification of either disease or exposure status in most test-negative studies seems unlikely, for nondifferential misclassification to result in bias towards the null, the errors must also be independent of confounders and effect modifiers (60). Taking the confounder age as an example, we can see how errors in exposure and outcome ascertainment may not be independent. For example, children are known to shed virus for a longer period of time (61–63), while the elderly may shed less virus and for shorter periods (47). Conversely, when patients are coinfected with another virus, which may be more likely in children, they shed influenza virus for shorter periods (64). Furthermore, a patient's age will probably affect vaccination status. Children are less likely to be vaccinated, even if they have a high-risk condition, and the elderly often have very high vaccination uptake. Finally, the elderly may have very poor recall of their vaccination status (65). Figure 8 extends Figure 7 to show misclassification of influenza and vaccination status that is dependent on the confounder age. Dependence is shown by the paths A→VS and A→R. Recall R of vaccination status V* is affected by age. Similarly, viral shedding VS is required to detect influenza I* but is variable with age A. Under this scenario, it is impossible to predict the direction of the bias.
Figure 8.
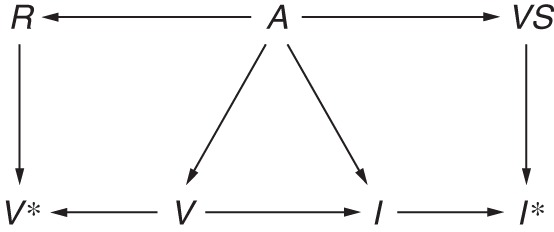
Directed acyclic graph illustrating misclassification of influenza and vaccination status within levels of a confounder. Age A affects detection of influenza I* because the duration of viral shedding VS differs by age group (A→VS), and viral shedding is needed to detect influenza (VS→I*), leading to misclassification of influenza status that is dependent on age (A→VS→I*). Recall R of vaccination status V may be poorer among the elderly (A→R), which in turn influences measured vaccination status (R→V*), leading to misclassification of vaccination status that is dependent on age (A→R→V).
DISCUSSION
Using DAGs, we have attempted to describe the theoretical basis for the test-negative design and have discussed potential sources of bias when using this study design to estimate influenza VE. In studies of VE we are not merely interested in the factors which predict or correlate with influenza virus infection; we are also interested in estimating the causal effect of vaccination on infection (15). Thus, it is important to approach such an analysis with a causal framework in mind. DAGs are a useful tool for thinking about the causal relationships among variables, both measured and unmeasured, and the types of bias they may introduce (12, 66–68). For instance, we have attempted to show here how the test-negative design may not avoid confounding by health-care-seeking behavior (Figure 3). Causal diagrams are developed based on our prior knowledge and beliefs about a causal relationship. The decision as to what to include or exclude is therefore highly subjective. Others may disagree with the variables included in these models or the structure of some diagrams, and the likely direction of the resulting biases. Nevertheless, we encourage researchers to develop their statistical analysis with reference to a DAG. We do caution, however, that this practice may lead researchers to consider far too many variables and that one should maintain realistic expectations of the data, as overparameterization can cause severe statistical biases (69).
For confounder adjustment, causal diagrams have advantages over statistical approaches, such as stepwise regression or change-in-estimate criteria, which may select nonconfounders or exclude important confounders and therefore introduce bias (70, 71). In addition, while we have described how to block a biasing path, it is important to note that statistical adjustment may not achieve this. For example, residual confounding (72) may occur when categorization of a continuous variable, such as age, is based on vaccination policy but has no relevance to the effect of that variable (i.e., age) on influenza status.
In conclusion, compared with traditional observational studies, the test-negative design may reduce but not remove confounding and selection bias due to differential health-care-seeking behaviors (Figure 3), may reduce misclassification of case status (Figure 5), and may avoid differential recall of the exposure (Figure 6). However, this study design shares many limitations of other observational designs, including dependent misclassification errors within levels of a confounder (Figure 8), and, crucially, it ignores the prior exposure history of a patient (Figure 2). The degree to which these limitations bias VE estimates obtained using the test-negative design is unclear and could be explored further using simulations. Thus, the chief advantages of this study design over the case-control or cohort design are speed and economy, since it can be nested in routine surveillance, without elevated concerns about the validity of the estimates produced.
ACKNOWLEDGMENTS
Author affiliations: WHO Collaborating Centre for Reference and Research on Influenza, Peter Doherty Institute for Infection and Immunity, Carlton South, Victoria, Australia (Sheena G. Sullivan); Department of Epidemiology, Fielding School of Public Health, University of California, Los Angeles, Los Angeles, California (Sheena G. Sullivan); Centre for Epidemiology and Biostatistics, Melbourne School of Population and Global Health, University of Melbourne, Melbourne, Victoria, Australia (Sheena G. Sullivan); Departments of Biostatistics and Epidemiology, Harvard School of Public Health, Cambridge, Massachusetts (Eric J. Tchetgen Tchetgen); and WHO Collaborating Centre for Infectious Disease Epidemiology and Control, School of Public Health, Li Ka Shing Faculty of Medicine, University of Hong Kong, Hong Kong Special Administrative Region, China (Benjamin J. Cowling).
E.J.T.T. and B.J.C. are joint senior authors.
This project was supported by the Health and Medical Research Fund, Food and Health Bureau, Government of the Hong Kong Special Administrative Region; the Harvard Center for Communicable Disease Dynamics (National Institute of General Medical Sciences grant U54 GM088558); and the Research Grants Council of the Hong Kong Special Administrative Region (project T11-705/14N). The WHO Collaborating Centre for Reference and Research on Influenza is supported by the Australian Government Department of Health.
Conflict of interest: none declared.
REFERENCES
- 1.Barr IG, McCauley J, Cox N et al. Epidemiological, antigenic and genetic characteristics of seasonal influenza A(H1N1), A(H3N2) and B influenza viruses: basis for the WHO recommendation on the composition of influenza vaccines for use in the 2009–2010 Northern Hemisphere season. Vaccine. 2010;285:1156–1167. [DOI] [PubMed] [Google Scholar]
- 2.Jackson ML, Nelson JC. The test-negative design for estimating influenza vaccine effectiveness. Vaccine. 2013;3117:2165–2168. [DOI] [PubMed] [Google Scholar]
- 3.Sullivan SG, Feng S, Cowling BJ. Potential of the test-negative design for measuring influenza vaccine effectiveness: a systematic review. Expert Rev Vaccines. 2014;1312:1571–1591. [DOI] [PMC free article] [PubMed] [Google Scholar]
- 4.Broome CV, Facklam RR, Fraser DW. Pneumococcal disease after pneumococcal vaccination: an alternative method to estimate the efficacy of pneumococcal vaccine. N Engl J Med. 1980;30310:549–552. [DOI] [PubMed] [Google Scholar]
- 5.Skowronski D, Gilbert M, Tweed S et al. Effectiveness of vaccine against medical consultation due to laboratory-confirmed influenza: results from a sentinel physician pilot project in British Columbia, 2004–2005. Can Commun Dis Rep. 2005;3118:181–191. [PubMed] [Google Scholar]
- 6.Orenstein EW, De Serres G, Haber MJ et al. Methodologic issues regarding the use of three observational study designs to assess influenza vaccine effectiveness. Int J Epidemiol. 2007;363:623–631. [DOI] [PubMed] [Google Scholar]
- 7.Jackson ML, Rothman KJ. Effects of imperfect test sensitivity and specificity on observational studies of influenza vaccine effectiveness. Vaccine. 2015;3311:1313–1316. [DOI] [PMC free article] [PubMed] [Google Scholar]
- 8.De Serres G, Skowronski DM, Wu XW et al. The test-negative design: validity, accuracy and precision of vaccine efficacy estimates compared to the gold standard of randomised placebo-controlled clinical trials. Euro Surveill. 2013;1837:pii:20585. [DOI] [PubMed] [Google Scholar]
- 9.Foppa IM, Haber M, Ferdinands JM et al. The case test-negative design for studies of the effectiveness of influenza vaccine. Vaccine. 2013;3130:3104–3109. [DOI] [PubMed] [Google Scholar]
- 10.Wacholder S, McLaughlin JK, Silverman DT et al. Selection of controls in case-control studies. I. Principles . Am J Epidemiol. 1992;1359:1019–1028. [DOI] [PubMed] [Google Scholar]
- 11.Butler J, Hooper KA, Petrie S et al. Estimating the fitness advantage conferred by permissive neuraminidase mutations in recent oseltamivir-resistant A(H1N1)pdm09 influenza viruses. PLoS Pathog. 2014;104:e1004065. [DOI] [PMC free article] [PubMed] [Google Scholar]
- 12.Greenland S, Pearl J, Robins JM. Causal diagrams for epidemiologic research. Epidemiology. 1999;101:37–48. [PubMed] [Google Scholar]
- 13.Pearl J. Causality. Cambridge, United Kingdom: Cambridge University Press; 2009. [Google Scholar]
- 14.Glymour M, Greenland S. Causal diagrams. In: Rothman KJ, Greenland S, Lash TL, eds. Modern Epidemiology. 3rd ed Philadelphia, PA: Lippincott Williams & Wilkins; 2008:183–209. [Google Scholar]
- 15.Sullivan SG, Cowling BJ. “Crude vaccine effectiveness” is a misleading term in test-negative studies of influenza vaccine effectiveness. Epidemiology. 2015;265:E60. [DOI] [PMC free article] [PubMed] [Google Scholar]
- 16.Westreich D. Berkson's bias, selection bias, and missing data. Epidemiology. 2012;231:159–164. [DOI] [PMC free article] [PubMed] [Google Scholar]
- 17.Cornfield J. A method of estimating comparative rates from clinical data; applications to cancer of the lung, breast, and cervix. J Natl Cancer Inst. 1951;116:1269–1275. [PubMed] [Google Scholar]
- 18.Wacholder S. The case-control study as data missing by design: estimating risk differences. Epidemiology. 1996;72:144–150. [DOI] [PubMed] [Google Scholar]
- 19.Daniel RM, Kenward MG, Cousens SN et al. Using causal diagrams to guide analysis in missing data problems. Stat Methods Med Res. 2012;213:243–256. [DOI] [PubMed] [Google Scholar]
- 20.Valenciano M, Ciancio B, Moren A. First steps in the design of a system to monitor vaccine effectiveness during seasonal and pandemic influenza in EU/EEA Member States. Euro Surveill. 2008;1343:pii:19015. [DOI] [PubMed] [Google Scholar]
- 21.Widdowson MA, Monto AS. Epidemiology of influenza. In: Wenster RG, Monto AS, Braciole TJ et al., eds. Textbook of Influenza. Chichester, United Kingdom: Wiley Blackwell; 2013:254–255. [Google Scholar]
- 22.Haq K, McElhaney JE. Immunosenescence: influenza vaccination and the elderly. Curr Opin Immunol. 2014;29:38–42. [DOI] [PubMed] [Google Scholar]
- 23.Australian Government Department of Health and Ageing. Part 4. Vaccine-preventable diseases. In: The Australian Immunisation Handbook. Canberra, Australia: National Health and Medical Research Council; 2015:251–256. [Google Scholar]
- 24.Beck CR, McKenzie BC, Hashim AB et al. Influenza vaccination for immunocompromised patients: systematic review and meta-analysis from a public health policy perspective. PLoS One. 2011;612:e29249. [DOI] [PMC free article] [PubMed] [Google Scholar]
- 25.Immunise Australia Program, Australian Government Department of Health and Ageing. Influenza (flu). 2014. http://www.immunise.health.gov.au/internet/immunise/publishing.nsf/Content/immunise-influenza Accessed July 29, 2014.
- 26.Kissling E, Valenciano M, Larrauri A et al. Low and decreasing vaccine effectiveness against influenza A(H3) in 2011/12 among vaccination target groups in Europe: results from the I-MOVE multicentre case-control study. Euro Surveill. 2013;185:pii:20390. [DOI] [PubMed] [Google Scholar]
- 27.Australian Institute of Health and Welfare. 2009 Adult Vaccination Survey. Canberra, Australia: Australian Institute of Health and Welfare; 2011:9. [Google Scholar]
- 28.Bureau of Labor Statistics, US Department of Labor. American Time Use Survey summary. Washington, DC: US Department of Labor; 2014. http://www.bls.gov/news.release/atus.nr0.htm. Accessed August 31, 2015. [Google Scholar]
- 29.Statistics Finland, Statistics Sweden. Harmonised European Time Use Survey [online database, version 2.0] Helsinki, Finland and Stockholm, Sweden: Statistics Finland and Statistics Sweden; 2007. https://www.h5.scb.se/tus/tus/default.htm. Accessed August 31, 2015. [Google Scholar]
- 30.Hancock K, Veguilla V, Lu X et al. Cross-reactive antibody responses to the 2009 pandemic H1N1 influenza virus. N Engl J Med. 2009;36120:1945–1952. [DOI] [PubMed] [Google Scholar]
- 31.Miller E, Hoschler K, Hardelid P et al. Incidence of 2009 pandemic influenza A H1N1 infection in England: a cross-sectional serological study. Lancet. 2010;3759720:1100–1108. [DOI] [PubMed] [Google Scholar]
- 32.Smith DJ, Forrest S, Ackley DH et al. Variable efficacy of repeated annual influenza vaccination. Proc Natl Acad Sci U S A. 1999;9624:14001–14006. [DOI] [PMC free article] [PubMed] [Google Scholar]
- 33.Ohmit SE, Petrie JG, Malosh RE et al. Influenza vaccine effectiveness in the community and the household. Clin Infect Dis. 2013;5610:1363–1369. [DOI] [PMC free article] [PubMed] [Google Scholar]
- 34.Sullivan SG, Kelly H. Stratified estimates of influenza vaccine effectiveness by prior vaccination: caution required. Clin Infect Dis. 2013;573:474–476. [DOI] [PubMed] [Google Scholar]
- 35.McLean HQ, Thompson MG, Sundaram ME et al. Impact of repeated vaccination on vaccine effectiveness against influenza A(H3N2) and B during 8 seasons. Clin Infect Dis. 2014;5910:1375–1385. [DOI] [PMC free article] [PubMed] [Google Scholar]
- 36.Greenland S, Lanes S, Jara M. Estimating effects from randomized trials with discontinuations: the need for intent-to-treat design and G-estimation. Clin Trials. 2008;51:5–13. [DOI] [PubMed] [Google Scholar]
- 37.Robins J. Causal inference from complex longitudinal data. In: Berkane M, ed. Latent Variable Modeling and Applications to Causality. (Lecture Notes in Statistics, vol 120). New York, NY: Springer Verlag New York; 1997:69–117. [Google Scholar]
- 38.Robins JM, Hernán MA, Brumback B. Marginal structural models and causal inference in epidemiology. Epidemiology. 2000;115:550–560. [DOI] [PubMed] [Google Scholar]
- 39.Jackson LA, Jackson ML, Nelson JC et al. Evidence of bias in estimates of influenza vaccine effectiveness in seniors. Int J Epidemiol. 2006;352:337–344. [DOI] [PubMed] [Google Scholar]
- 40.Wong VW, Cowling BJ, Aiello AE. Hand hygiene and risk of influenza virus infections in the community: a systematic review and meta-analysis. Epidemiol Infect. 2014;1425:922–932. [DOI] [PMC free article] [PubMed] [Google Scholar]
- 41.VanderWeele TJ, Shpitser I. On the definition of a confounder. Ann Stat. 2013;411:196–220. [DOI] [PMC free article] [PubMed] [Google Scholar]
- 42.Ogburn EL, VanderWeele TJ. On the nondifferential misclassification of a binary confounder. Epidemiology. 2012;233:433–439. [DOI] [PMC free article] [PubMed] [Google Scholar]
- 43.Salas M, Hofman A, Stricker BH. Confounding by indication: an example of variation in the use of epidemiologic terminology. Am J Epidemiol. 1999;14911:981–983. [DOI] [PubMed] [Google Scholar]
- 44.Didelez V, Kreiner S, Keiding N. Graphical models for inference under outcome-dependent sampling. Stat Sci. 2010;253:368–387. [Google Scholar]
- 45.Druce J, Tran T, Kelly H et al. Laboratory diagnosis and surveillance of human respiratory viruses by PCR in Victoria, Australia, 2002–2003. J Med Virol. 2005;751: 122–129. [DOI] [PMC free article] [PubMed] [Google Scholar]
- 46.Hernán MA, Cole SR. Invited commentary: causal diagrams and measurement bias. Am J Epidemiol. 2009;1708:959–962. [DOI] [PMC free article] [PubMed] [Google Scholar]
- 47.Carrat F, Vergu E, Ferguson NM et al. Time lines of infection and disease in human influenza: a review of volunteer challenge studies. Am J Epidemiol. 2008;1677:775–785. [DOI] [PubMed] [Google Scholar]
- 48.Kelly H, Jacoby P, Dixon GA et al. Vaccine effectiveness against laboratory-confirmed influenza in healthy young children: a case-control study. Pediatr Infect Dis J. 2011;302:107–111. [DOI] [PubMed] [Google Scholar]
- 49.Levy A, Sullivan SG, Tempone SS et al. Influenza vaccine effectiveness estimates for Western Australia during a period of vaccine and virus strain stability, 2010 to 2012. Vaccine. 2014;3247:6312–6318. [DOI] [PubMed] [Google Scholar]
- 50.Landry ML. Diagnostic tests for influenza infection. Curr Opin Pediatr. 2011;231:91–97. [DOI] [PubMed] [Google Scholar]
- 51.Greenland S, Lash TL. Bias analysis. In: Rothman KJ, Greenland S, Lash TL, eds. Modern Epidemiology. 3rd ed Philadelphia, PA: Lippincott Williams & Wilkins; 2008: 345–380. [Google Scholar]
- 52.Howard PF, McCaw JM, Richmond PC et al. Virus detection and its association with symptoms during influenza-like illness in a sample of healthy adults enrolled in a randomised controlled vaccine trial. Influenza Other Respir Viruses. 2013;73:330–339. [DOI] [PMC free article] [PubMed] [Google Scholar]
- 53.He XS, Holmes TH, Zhang C et al. Cellular immune responses in children and adults receiving inactivated or live attenuated influenza vaccines. J Virol. 2006;8023:11756–11766. [DOI] [PMC free article] [PubMed] [Google Scholar]
- 54.Hoft DF, Babusis E, Worku S et al. Live and inactivated influenza vaccines induce similar humoral responses, but only live vaccines induce diverse T-cell responses in young children. J Infect Dis. 2011;2046:845–853. [DOI] [PMC free article] [PubMed] [Google Scholar]
- 55.Lillie PJ, Berthoud TK, Powell TJ et al. Preliminary assessment of the efficacy of a T-cell-based influenza vaccine, MVA-NP+M1, in humans. Clin Infect Dis. 2012;551:19–25. [DOI] [PMC free article] [PubMed] [Google Scholar]
- 56.Jurek AM, Greenland S, Maldonado G. How far from non-differential does exposure or disease misclassification have to be to bias measures of association away from the null? Int J Epidemiol. 2008;372:382–385. [DOI] [PubMed] [Google Scholar]
- 57.Irving SA, Donahue JG, Shay DK et al. Evaluation of self-reported and registry-based influenza vaccination status in a Wisconsin cohort. Vaccine. 2009;2747:6546–6549. [DOI] [PubMed] [Google Scholar]
- 58.Mangtani P, Shah A, Roberts JA. Validation of influenza and pneumococcal vaccine status in adults based on self-report. Epidemiol Infect. 2007;1351:139–143. [DOI] [PMC free article] [PubMed] [Google Scholar]
- 59.Greenland S. Basic methods for sensitivity analysis of biases. Int J Epidemiol. 1996;256:1107–1116. [PubMed] [Google Scholar]
- 60.Rothman KJ, Greenland S, Lash TL. Validity in epidemiologic studies. In: Rothman KJ, Greenland S, Lash TL, eds. Modern Epidemiology. 3rd ed Philadelphia, PA: Lippincott Williams & Wilkins; 2008:128–147. [Google Scholar]
- 61.Hall CB, Douglas RG Jr, Geiman JM et al. Viral shedding patterns of children with influenza B infection. J Infect Dis. 1979;1404:610–613. [DOI] [PubMed] [Google Scholar]
- 62.Frank AL, Taber LH, Wells CR et al. Patterns of shedding of myxoviruses and paramyxoviruses in children. J Infect Dis. 1981;1445:433–441. [DOI] [PubMed] [Google Scholar]
- 63.Li CC, Wang L, Eng HL et al. Correlation of pandemic (H1N1) 2009 viral load with disease severity and prolonged viral shedding in children. Emerg Infect Dis. 2010;168:1265–1272. [DOI] [PMC free article] [PubMed] [Google Scholar]
- 64.Pascalis H, Temmam S, Turpin M et al. Intense co-circulation of non-influenza respiratory viruses during the first wave of pandemic influenza pH1N1/2009: a cohort study in Reunion Island. PLoS One. 2012;79:e44755. [DOI] [PMC free article] [PubMed] [Google Scholar]
- 65.Mac Donald R, Baken L, Nelson A et al. Validation of self-report of influenza and pneumococcal vaccination status in elderly outpatients. Am J Prev Med. 1999;163:173–177. [DOI] [PubMed] [Google Scholar]
- 66.Hernán MA, Hernández-Díaz S, Werler MM et al. Causal knowledge as a prerequisite for confounding evaluation: an application to birth defects epidemiology. Am J Epidemiol. 2002;1552:176–184. [DOI] [PubMed] [Google Scholar]
- 67.Howards PP, Schisterman EF, Heagerty PJ. Potential confounding by exposure history and prior outcomes: an example from perinatal epidemiology. Epidemiology. 2007;185:544–551. [DOI] [PubMed] [Google Scholar]
- 68.Schisterman EF, Cole SR, Platt RW. Overadjustment bias and unnecessary adjustment in epidemiologic studies. Epidemiology. 2009;204:488–495. [DOI] [PMC free article] [PubMed] [Google Scholar]
- 69.Greenland S. Small-sample bias and corrections for conditional maximum-likelihood odds-ratio estimators. Biostatistics. 2000;11:113–122. [DOI] [PubMed] [Google Scholar]
- 70.Christenfeld NJ, Sloan RP, Carroll D et al. Risk factors, confounding, and the illusion of statistical control. Psychosom Med. 2004;666:868–875. [DOI] [PubMed] [Google Scholar]
- 71.Maldonado G, Greenland S. Simulation study of confounder-selection strategies. Am J Epidemiol. 1993;13811:923–936. [DOI] [PubMed] [Google Scholar]
- 72.Becher H. The concept of residual confounding in regression models and some applications. Stat Med. 1992;1113:1747–1758. [DOI] [PubMed] [Google Scholar]


